Progressive Teaching Improvement For Small Scale Learning: A Case Study in China


Abstract
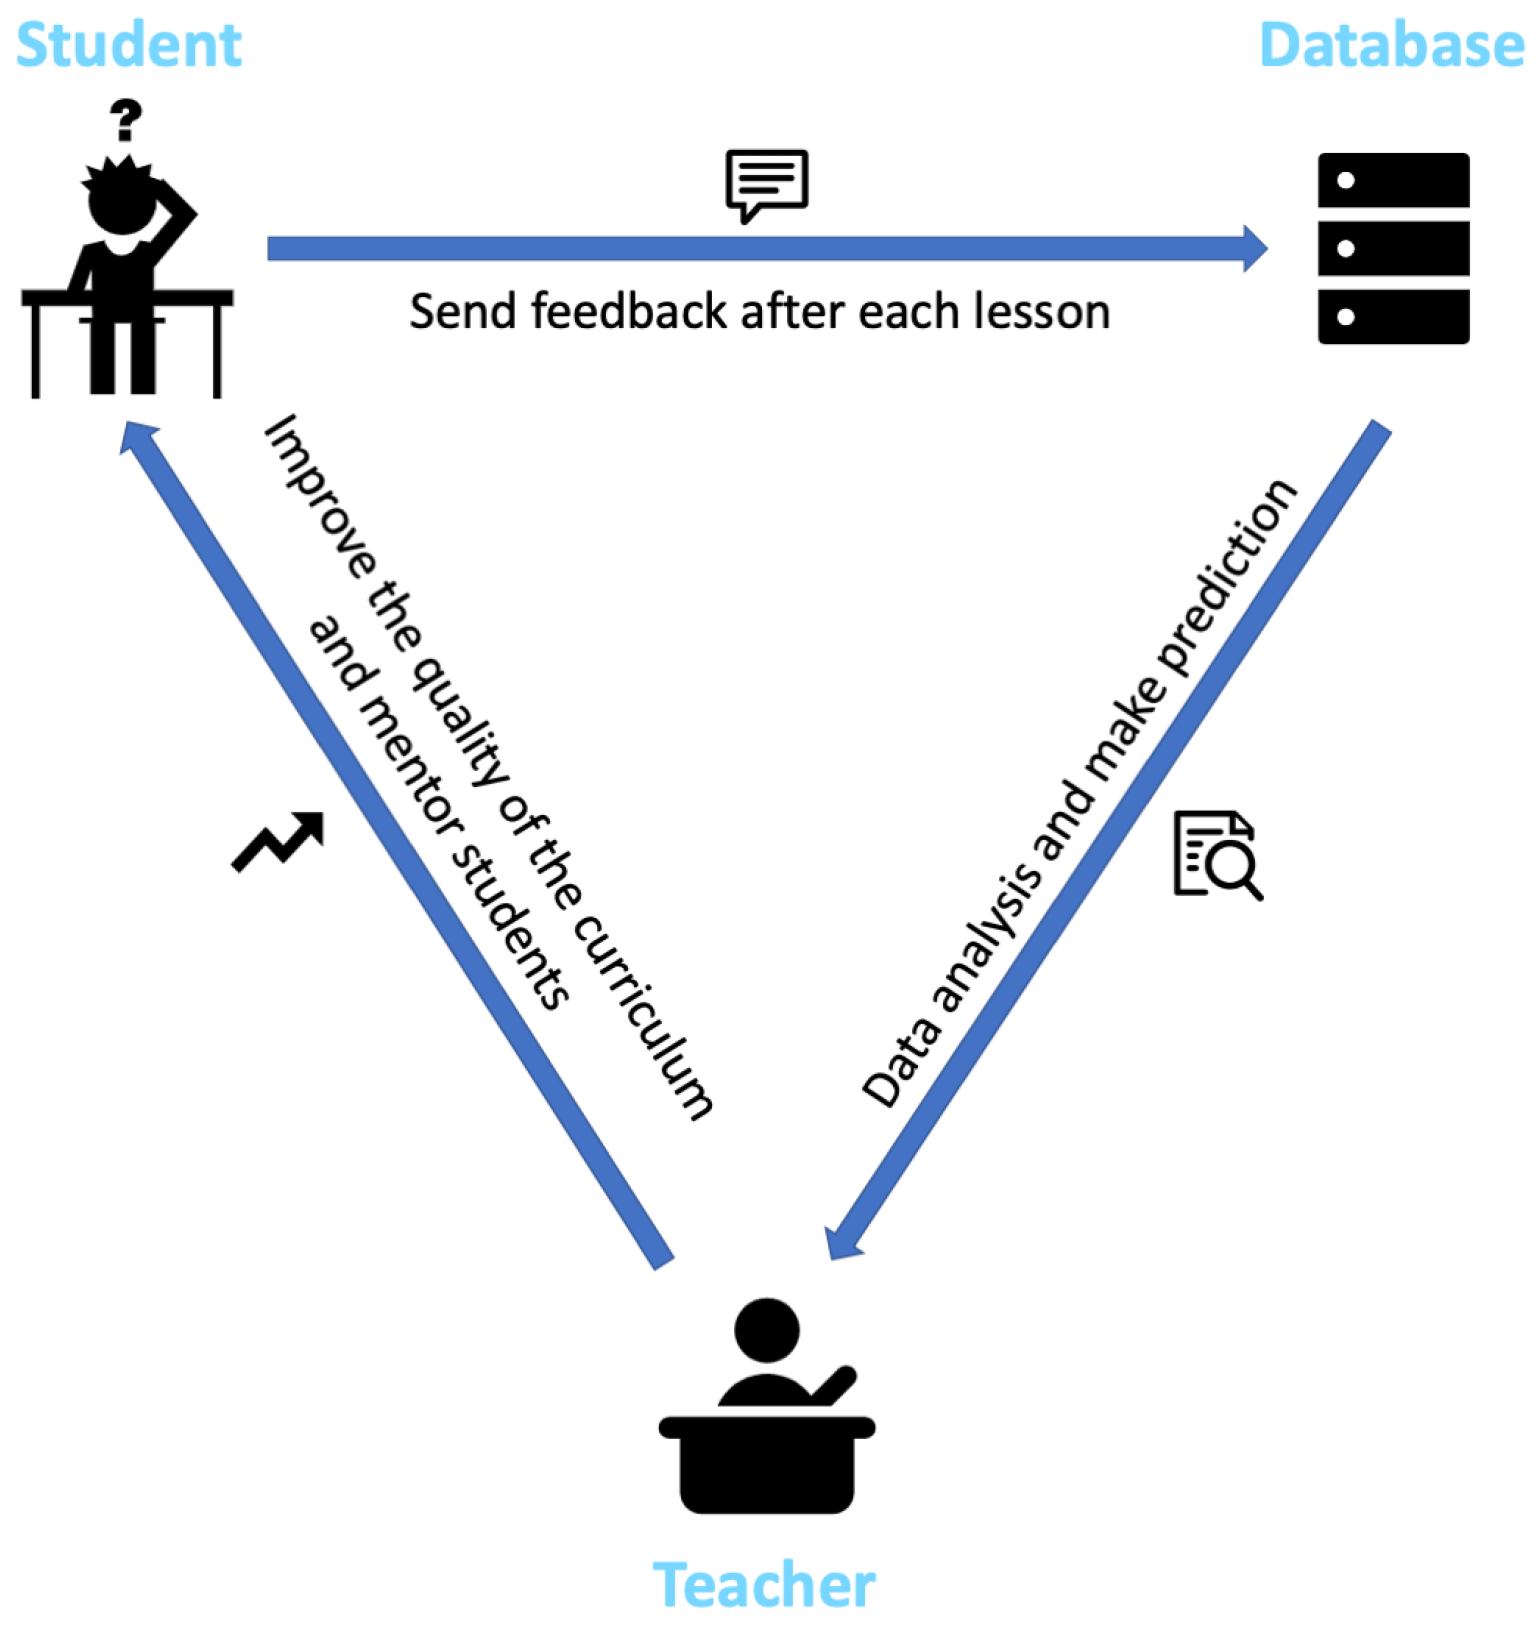
1. Introduction
- An innovative learning feedback mechanism via widely used WeChat mini program in China, conveniently making a collection of students’ evaluations and suggestions after each class.
- A novel artificial neural network model customized to small quantity of learning data, predicting students’ final academic performance progressively. These predictions are then indirectly instructing teachers to give specific advice for diverse students and improve teaching.
- A comprehensive comparison with other state-of-the-art machine learning methods.
2. Related Work
2.1. Educational Data Mining
2.2. Student Performance Prediction
2.3. Text Analysis
3. Method
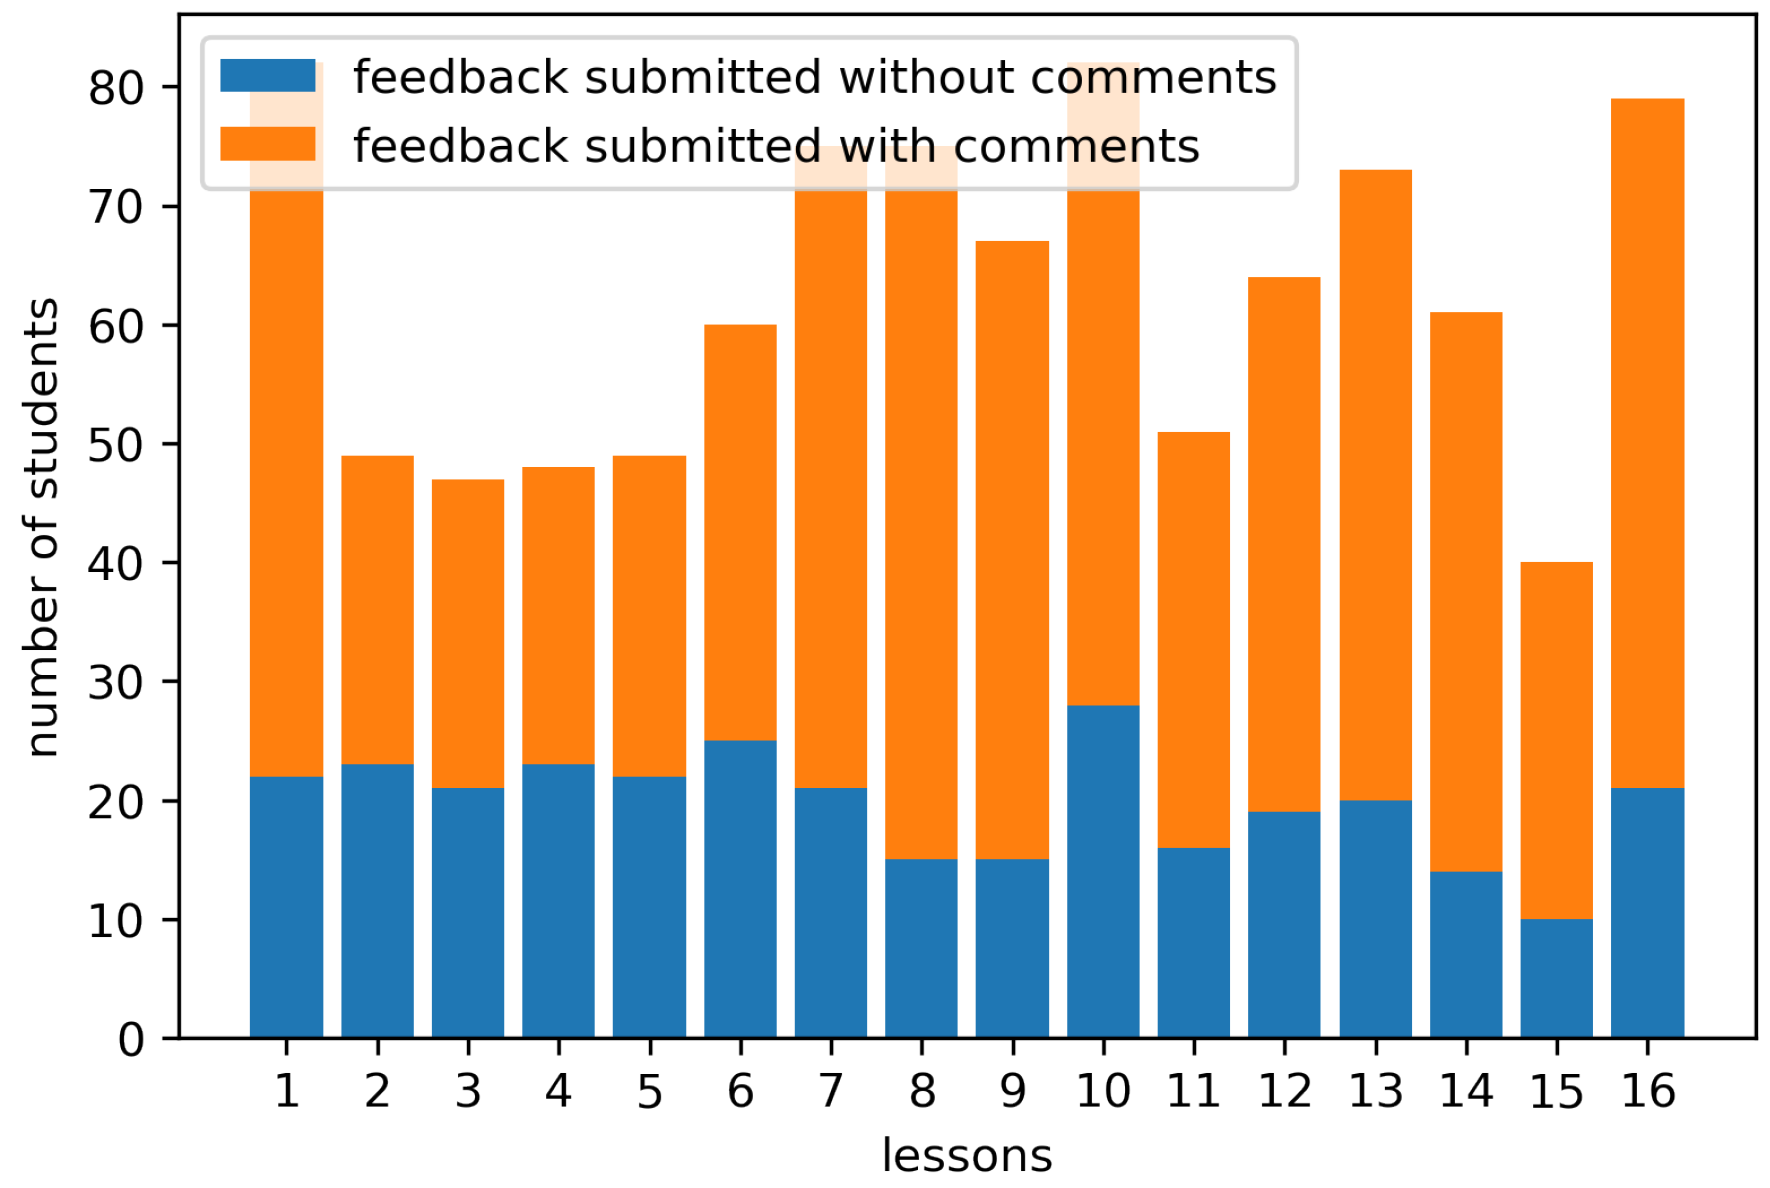
3.1. Feedback Data Collection
3.2. Data Pre-Processing
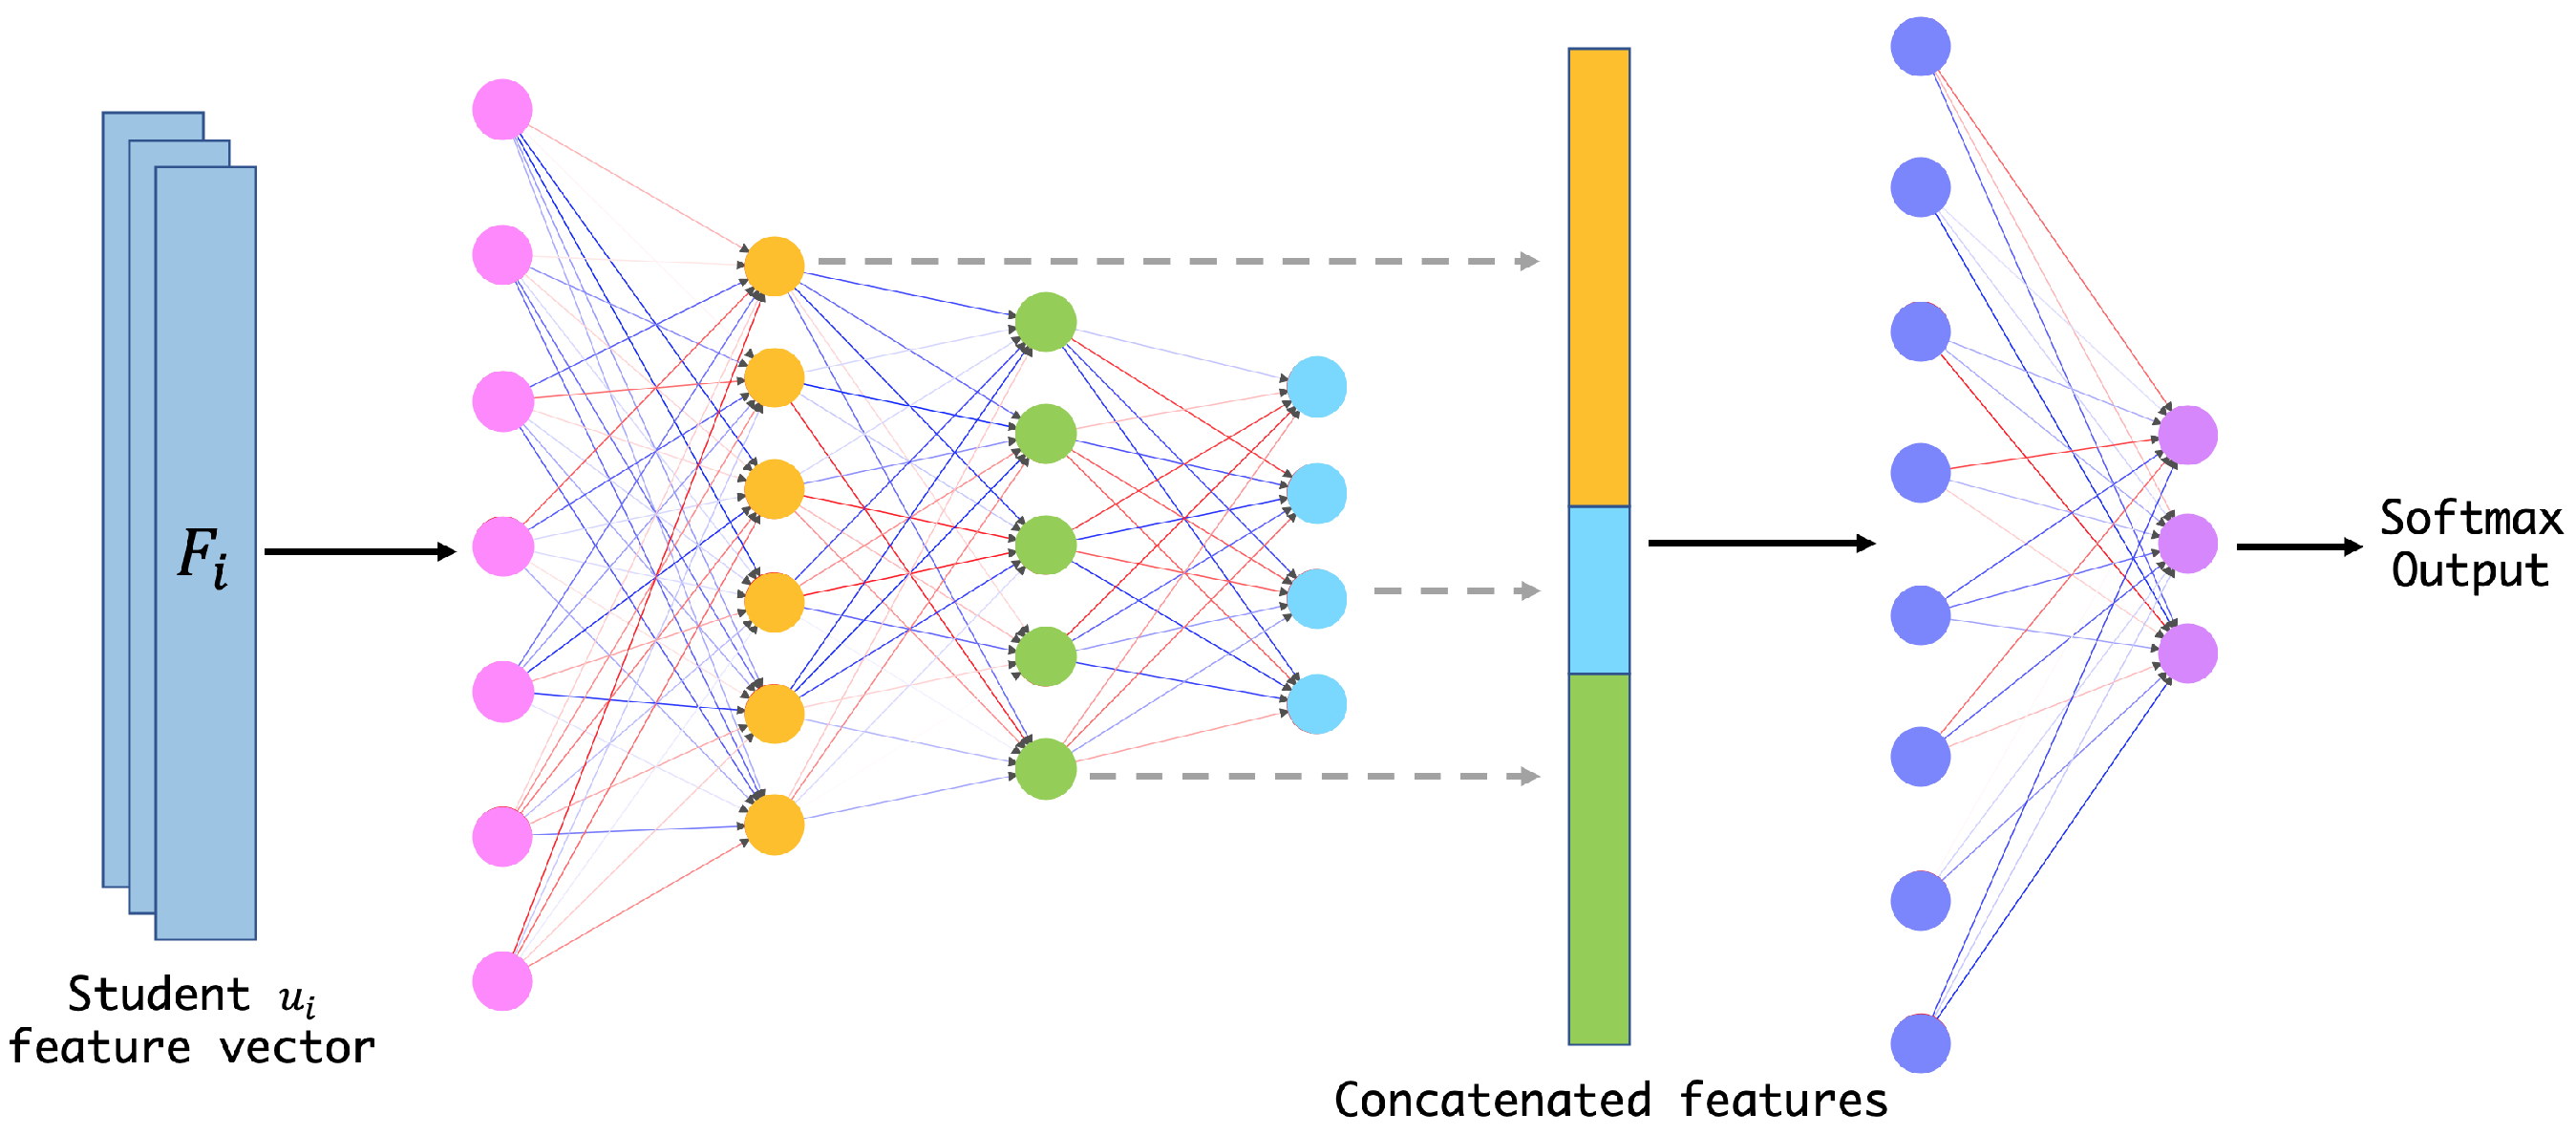
3.3. Artificial Neural Network Model
3.4. Data Visualization
4. Experiments and Discussions
4.1. Experimental Settings
4.2. Learning Performance Prediction
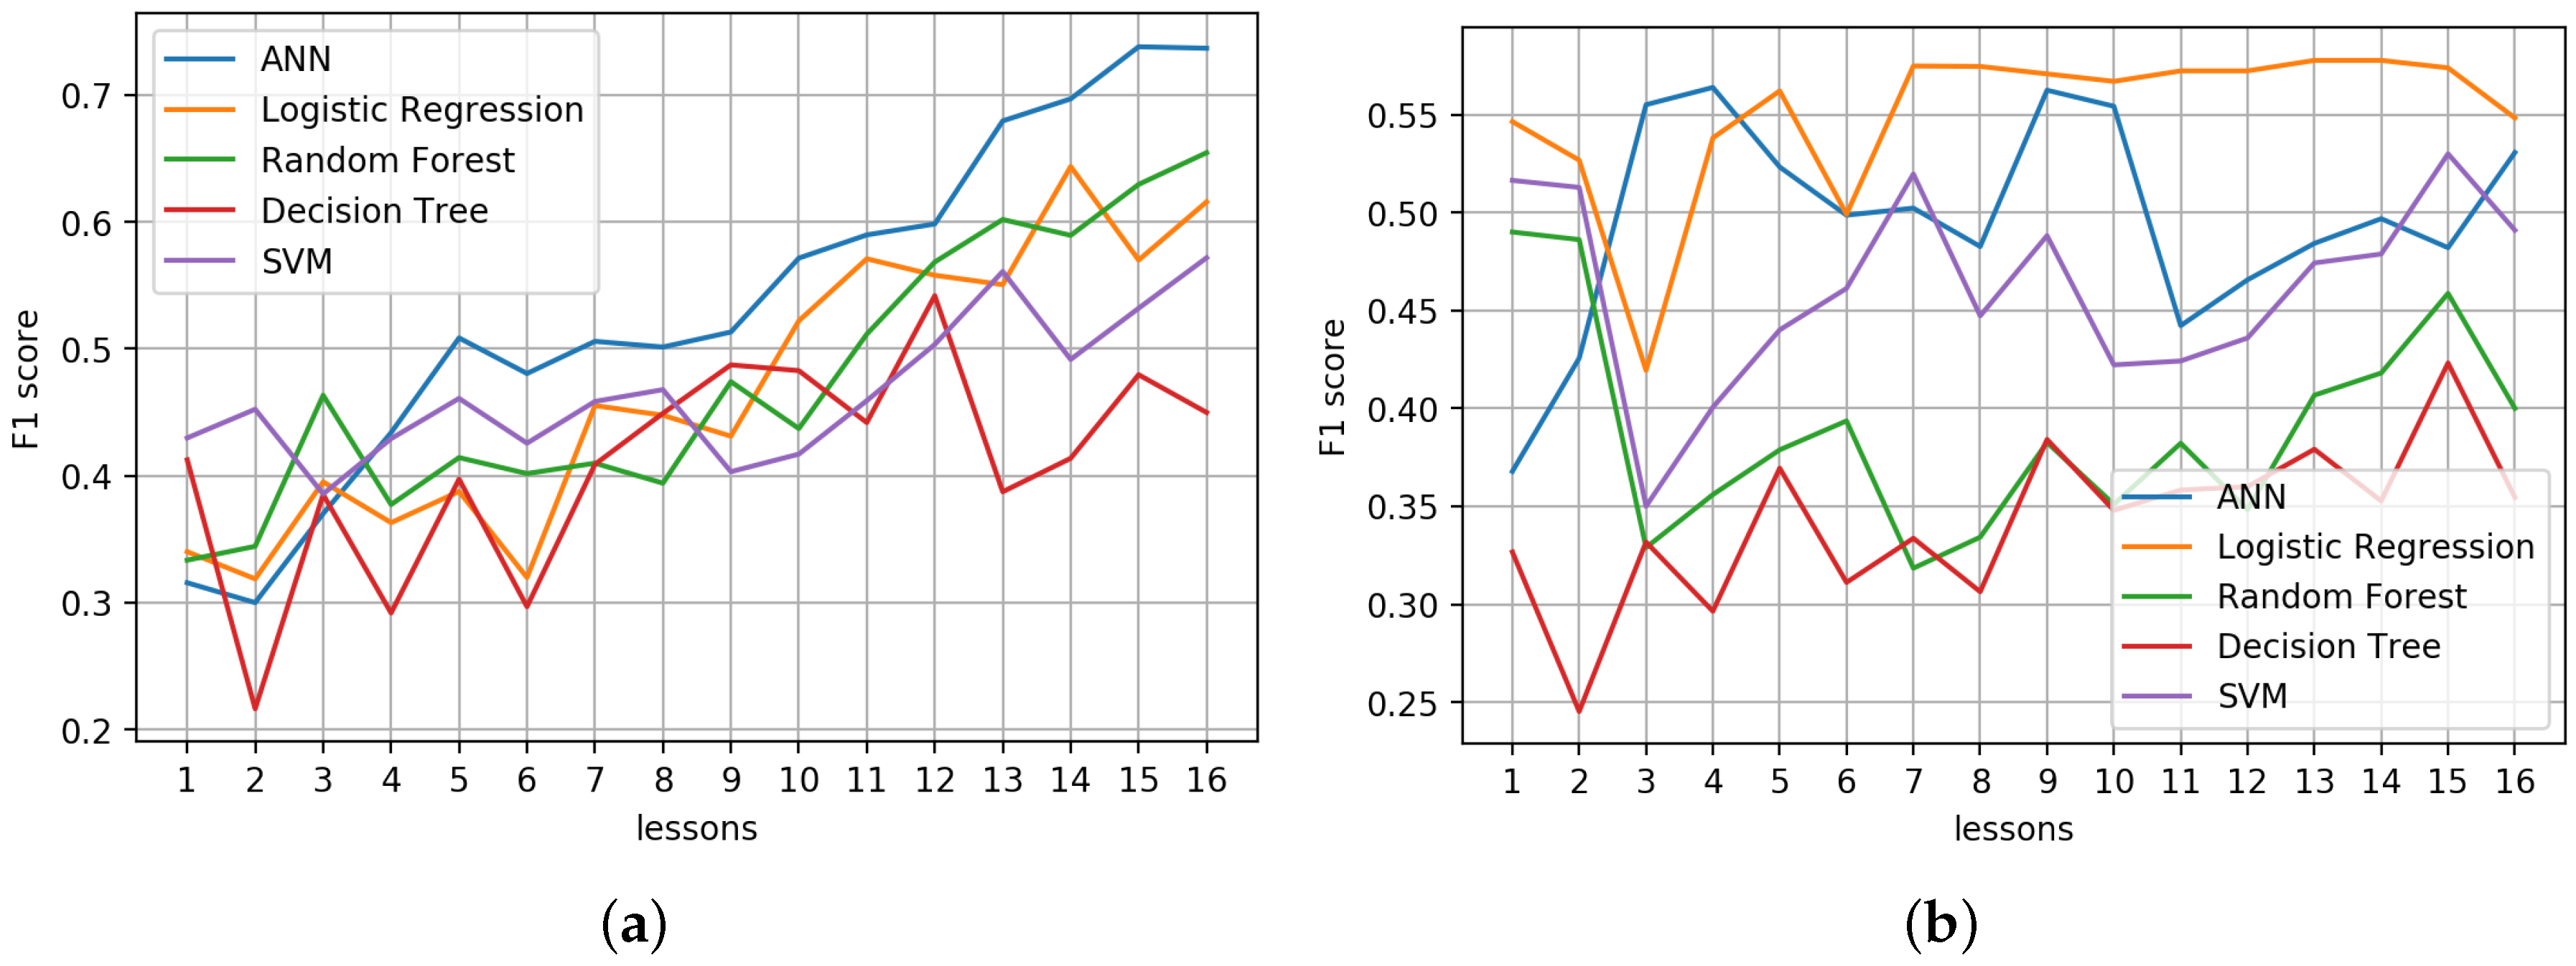
4.2.1. Comparison with State-of-the-Art Machine Learning Methods
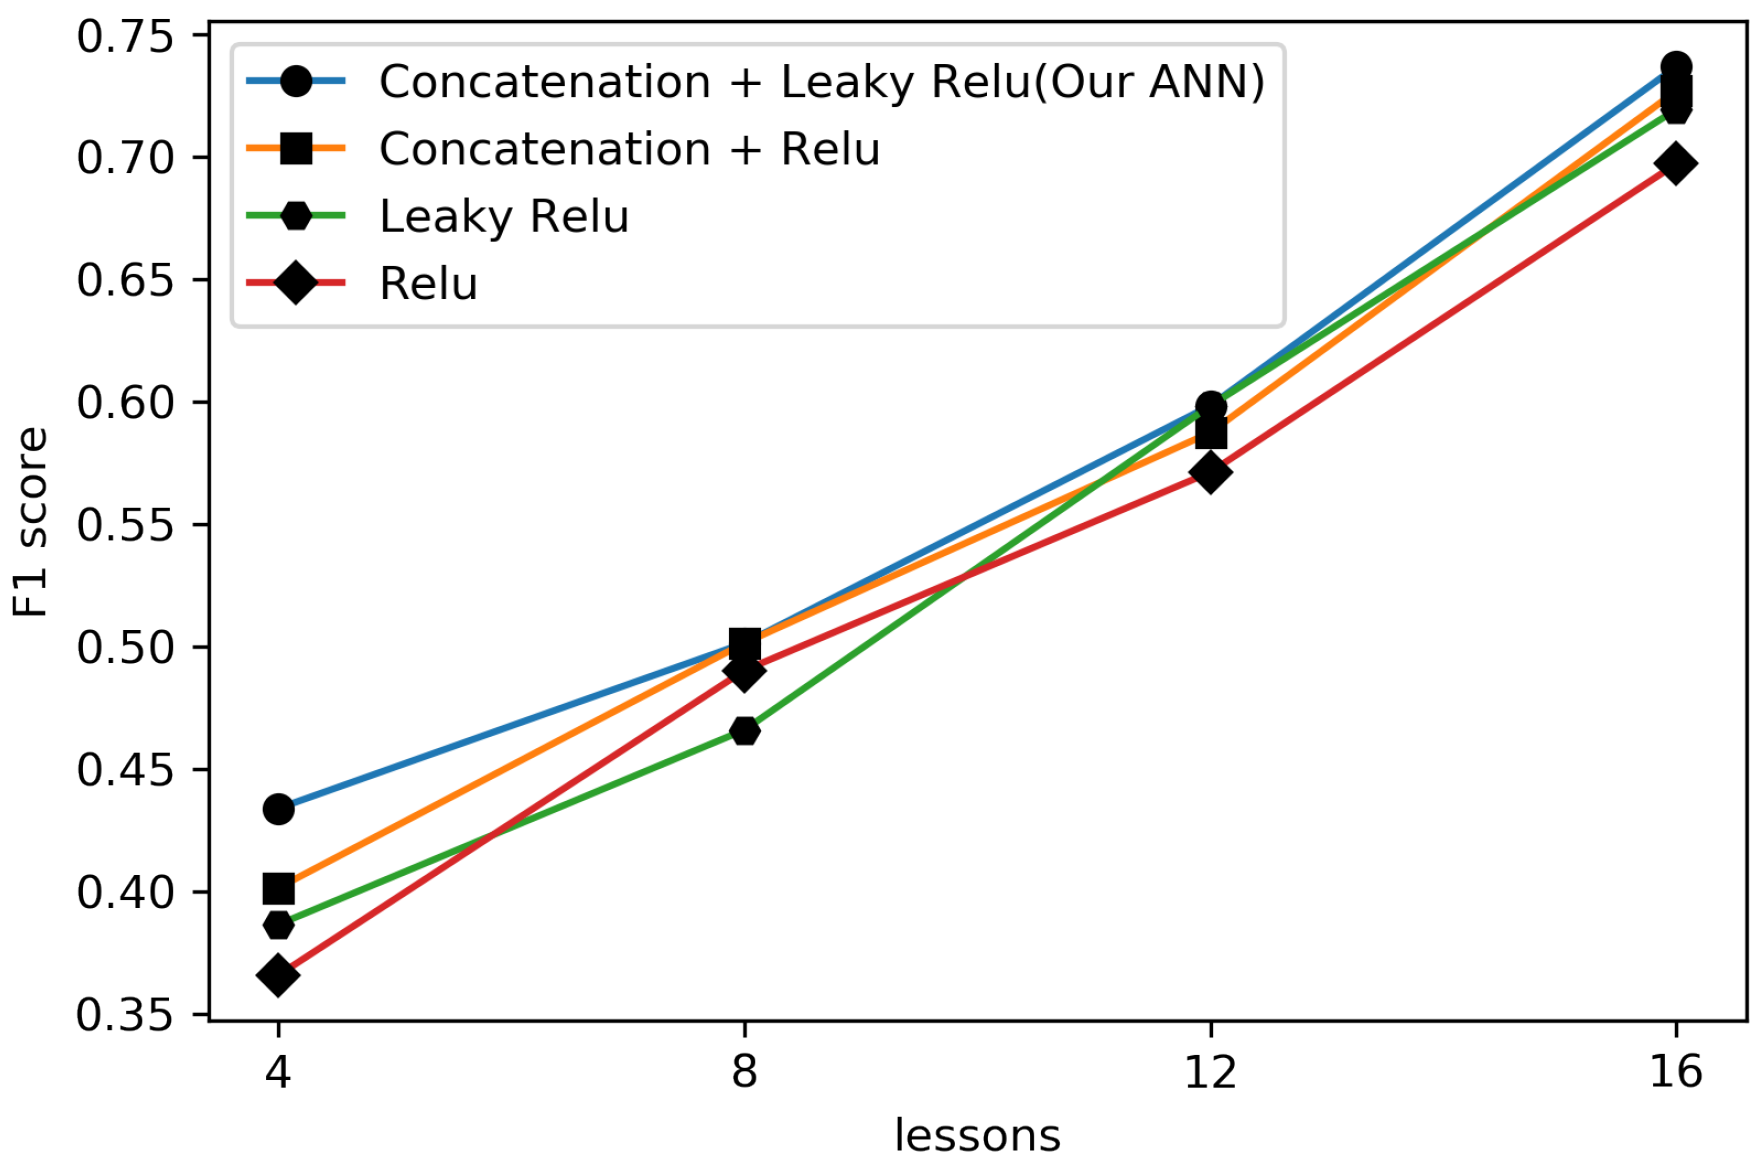
4.2.2. Comparison with Different ANN Configurations
5. Conclusions and Future Work
Author Contributions
Funding
Acknowledgments
Conflicts of Interest
Appendix A. WeChat Mini Programe Feedback Survey Questions
- What location are you in within the classroom?
- (a)
- First three rows
- (b)
- Middle rows
- (c)
- Last three rows
- What do you think of the overall difficulty of this class?
- (a)
- Easy
- (b)
- Medium
- (c)
- Hard
- How do you feel about your state of mind in this class?
- (a)
- Focused
- (b)
- Medium
- (c)
- Sleepy
- How do you find the class interesting?
- (a)
- Interesting
- (b)
- Medium
- (c)
- Boring
- Have you figured out the knowledge points covered in this lesson?
- (a)
- Already understood
- (b)
- Need to review after class
- (c)
- Not at all
- Have you figured out the code involved in this lesson?
- (a)
- Already understood
- (b)
- Need to review after class
- (c)
- Not at all
- What’s your biggest gain from this lesson?
- (a)
- Concept of Data Structure
- (b)
- Operations of Data Structure
- (c)
- Code replication
- (d)
- Nothing
- What drew you to the classroom?
- (a)
- Pressure of grade points
- (b)
- Fun to learn
- (c)
- Importance of Data Structure
- (d)
- The charm of the teacher
- (e)
- Other reasons
- What’s your overall rating for this class?
- (a)
- 1 star
- (b)
- 2 stars
- (c)
- 3 stars
- (d)
- 4 stars
- (e)
- 5 stars
- What do you want to say about this class?(Open question, no less than 10 Chinese characters)
References
- Sun, G.; Cui, T.; Beydoun, G.; Chen, S.; Dong, F.; Xu, D.; Shen, J. Towards massive data and sparse data in adaptive micro open educational resource recommendation: A study on semantic knowledge base construction and cold start problem. Sustainability 2017, 9, 898. [Google Scholar] [CrossRef]
- Herbert, M. Staying the course: A study in online student satisfaction and retention. Online J. Distance Learn. Adm. 2006, 9, 300–317. [Google Scholar]
- Dalipi, F.; Imran, A.S.; Kastrati, Z. MOOC dropout prediction using machine learning techniques: Review and research challenges. In Proceedings of the 2018 IEEE Global Engineering Education Conference (EDUCON), Tenerife, Spain, 17–20 April 2018; pp. 1007–1014. [Google Scholar]
- May, M.; Iksal, S.; Usener, C.A. The side effect of learning analytics: An empirical study on e-learning technologies and user privacy. In International Conference on Computer Supported Education; Springer: Berlin/Heidelberg, Germany, 2016; pp. 279–295. [Google Scholar]
- Kaur, G.; Singh, W. Prediction of student performance using weka tool. Int. J. Eng. Sci. 2016, 17, 8–16. [Google Scholar]
- Fayyad, U.; Piatetsky-Shapiro, G.; Smyth, P. From data mining to knowledge discovery in databases. AI Mag. 1996, 17, 37. [Google Scholar]
- Aziz, A.A.; Ismail, N.H.; Ahmad, F.; Abidin, Z.; Badak, K.G.; Candidate, M. Mining Students’ Academic Performance. J. Theor. Appl. Inf. Technol. 2013, 53, 485–495. [Google Scholar]
- Injadat, M.; Salo, F.; Nassif, A.B.; Essex, A.; Shami, A. Bayesian optimization with machine learning algorithms towards anomaly detection. In Proceedings of the 2018 IEEE Global Communications Conference (GLOBECOM), Abu Dhabi, United Arab Emirates, 9–13 December 2018; pp. 1–6. [Google Scholar]
- Yang, L.; Moubayed, A.; Hamieh, I.; Shami, A. Tree-based intelligent intrusion detection system in internet of vehicles. In Proceedings of the 2019 IEEE Global Communications Conference (GLOBECOM), Waikoloa, HI, USA, 9–13 December 2019; pp. 1–6. [Google Scholar]
- Moubayed, A.; Injadat, M.; Shami, A.; Lutfiyya, H. Dns typo-squatting domain detection: A data analytics & machine learning based approach. In Proceedings of the 2018 IEEE Global Communications Conference (GLOBECOM), Abu Dhabi, United Arab Emirates, 9–13 December 2018; pp. 1–7. [Google Scholar]
- Helal, S.; Li, J.; Liu, L.; Ebrahimie, E.; Dawson, S.; Murray, D.J.; Long, Q. Predicting academic performance by considering student heterogeneity. Knowl. Based Syst. 2018, 161, 134–146. [Google Scholar] [CrossRef]
- Kehrwald, B. Understanding social presence in text-based online learning environments. Distance Educ. 2008, 29, 89–106. [Google Scholar] [CrossRef]
- Romero, C.; Ventura, S. Educational data mining: A survey from 1995 to 2005. Expert Syst. Appl. 2007, 33, 135–146. [Google Scholar] [CrossRef]
- Wasif, M.; Waheed, H.; Aljohani, N.; Hassan, S.U. Understanding Student Learning Behavior and Predicting Their Performance. Available online: https://doi.org/10.4018/978-1-5225-9031-6.ch001 (accessed on 16 August 2020).
- Costa, E.B.; Fonseca, B.; Santana, M.A.; de Arajo, F.F.; Rego, J. Evaluating the Effectiveness of Educational Data Mining Techniques for Early Prediction of Students’ Academic Failure in Introductory Programming Courses. Comput. Hum. Behav. 2017, 73, 247–256. [Google Scholar] [CrossRef]
- Yi, J.C.; Kang-Yi, C.D.; Burton, F.; Chen, H.D. Predictive analytics approach to improve and sustain college students’ non-cognitive skills and their educational outcome. Sustainability 2018, 10, 4012. [Google Scholar] [CrossRef]
- Kaur, H. A Literature Review from 2011 to 2014 on Student’S Academic Performance Prediction and Analysis Using Decision Tree Algorithm. J. Glob. Res. Comput. Sci. 2018, 9, 10–15. [Google Scholar]
- Ahmed, A.; Elaraby, I.S. Data mining: A prediction for student’s performance using classification method. World J. Comput. Appl. Technol. 2014, 2, 43–47. [Google Scholar]
- Hussain, M.; Zhu, W.; Zhang, W.; Abidi, S.M.R. Student engagement predictions in an e-learning system and their impact on student course assessment scores. Comput. Intell. Neurosci. 2018, 2018. [Google Scholar] [CrossRef]
- Marbouti, F.; Diefes-Dux, H.A.; Madhavan, K. Models for early prediction of at-risk students in a course using standards-based grading. Comput. Educ. 2016, 103, 1–15. [Google Scholar] [CrossRef]
- Chui, K.T.; Fung, D.C.L.; Lytras, M.D.; Lam, T.M. Predicting at-risk university students in a virtual learning environment via a machine learning algorithm. Comput. Hum. Behav. 2020, 107, 105584. [Google Scholar] [CrossRef]
- Leitner, P.; Khalil, M.; Ebner, M. Learning analytics in higher education—A literature review. In Learning Analytics: Fundaments, Applications, and Trends; Springer: Berlin/Heidelberg, Germany, 2017; pp. 1–23. [Google Scholar]
- LeCun, Y.; Bengio, Y.; Hinton, G. Deep learning. Nature 2015, 521, 436–444. [Google Scholar] [CrossRef]
- De Albuquerque, R.M.; Bezerra, A.A.; de Souza, D.A.; do Nascimento, L.B.P.; de Mesquita Sá, J.J.; do Nascimento, J.C. Using neural networks to predict the future performance of students. In Proceedings of the 2015 International Symposium on Computers in Education (SIIE), Setubal, Portugal, 25–27 November 2015; pp. 109–113. [Google Scholar]
- Corrigan, O.; Smeaton, A.F. A course agnostic approach to predicting student success from VLE log data using recurrent neural networks. In European Conference on Technology Enhanced Learning; Springer: Berlin/Heidelberg, Germany, 2017; pp. 545–548. [Google Scholar]
- Jamal, N.; Xianqiao, C.; Aldabbas, H. Deep Learning-Based Sentimental Analysis for Large-Scale Imbalanced Twitter Data. Future Internet 2019, 11, 190. [Google Scholar] [CrossRef]
- Singla, Z.; Randhawa, S.; Jain, S. Statistical and sentiment analysis of consumer product reviews. In Proceedings of the 2017 8th International Conference on Computing, Communication and Networking Technologies (ICCCNT), Delhi, India, 3–5 July 2017; pp. 1–6. [Google Scholar]
- Zhao, W.; Guan, Z.; Chen, L.; He, X.; Cai, D.; Wang, B.; Wang, Q. Weakly-supervised deep embedding for product review sentiment analysis. IEEE Trans. Knowl. Data Eng. 2017, 30, 185–197. [Google Scholar] [CrossRef]
- He, R.; Lee, W.S.; Ng, H.T.; Dahlmeier, D. An unsupervised neural attention model for aspect extraction. In Proceedings of the 55th Annual Meeting of the Association for Computational Linguistics (Volume 1: Long Papers), Vancouver, BC, Canada, 30 July–4 August 2017; pp. 388–397. [Google Scholar]
- Wang, M.; Hu, G. A Novel Method for Twitter Sentiment Analysis Based on Attentional-Graph Neural Network. Information 2020, 11, 92. [Google Scholar] [CrossRef]
- Levy, O.; Goldberg, Y. Neural word embedding as implicit matrix factorization. In Proceedings of the Advances in Neural Information Processing Systems, Montreal, QC, Canada, 8–13 December 2014; pp. 2177–2185. [Google Scholar]
- Kiros, R.; Zhu, Y.; Salakhutdinov, R.R.; Zemel, R.; Urtasun, R.; Torralba, A.; Fidler, S. Skip-thought vectors. In Proceedings of the Advances in Neural Information Processing Systems (NIPS 2015), Montreal, QC, Canada, 7–12 December 2015; pp. 3294–3302. [Google Scholar]
- Palangi, H.; Deng, L.; Shen, Y.; Gao, J.; He, X.; Chen, J.; Song, X.; Ward, R. Deep sentence embedding using long short-term memory networks: Analysis and application to information retrieval. IEEE/ACM Trans. Audio, Speech, Lang. Process. 2016, 24, 694–707. [Google Scholar] [CrossRef]
- Reimers, N.; Gurevych, I. Sentence-bert: Sentence embeddings using siamese bert-networks. arXiv 2019, arXiv:1908.10084. [Google Scholar]
- Conneau, A.; Kiela, D.; Schwenk, H.; Barrault, L.; Bordes, A. Supervised learning of universal sentence representations from natural language inference data. arXiv 2017, arXiv:1705.02364. [Google Scholar]
- Ethayarajh, K. Unsupervised random walk sentence embeddings: A strong but simple baseline. In Proceedings of the Third Workshop on Representation Learning for NLP, Melbourne, Australia, 20 July 2018; pp. 91–100. [Google Scholar]
- Arora, S.; Liang, Y.; Ma, T. A simple but tough-to-beat baseline for sentence embeddings. Available online: https://openreview.net/forum?id=SyK00v5xx (accessed on 16 August 2020).
- Kiritchenko, S.; Zhu, X.; Mohammad, S.M. Sentiment analysis of short informal texts. J. Artif. Intell. Res. 2014, 50, 723–762. [Google Scholar]
- Burch, M.; Lohmann, S.; Pompe, D.; Weiskopf, D. Prefix tag clouds. In Proceedings of the 2013 17th International Conference on Information Visualisation, London, UK, 16–18 July 2013; pp. 45–50. [Google Scholar]


| Student ID | Answer | Submit Date |
|---|---|---|
| Stu1 | [“Linked List”,0,1,1,1,1,1,1,1,3, “I really listened to the lecture, but I couldn’t understand it.”] | 13 March 2019 13:43:03 |
| Stu2 | [“Linked List”,0,1,1,1,1,1,2,1,3, “I hope the teacher can explain the code in more detail”] | 13 March 2019 13:43:24 |
| Student ID | Question Value(Q1–Q9) | Emotion Value | Comment Features |
|---|---|---|---|
| Stu1 | [0.92307, 0.69231, ..., 3.07692] | −1.09782 | [0.76899, −0.28807, ..., −0.63832] |
| Stu2 | [0.27273, 0.81818, ..., 3.54546] | −0.52067 | [−0.14123, −0.32102, ..., −0.17956] |
| Grade Range | Number of Students | Label |
|---|---|---|
| 90–100 | 8 | Excellent |
| 80–89 | 36 | |
| 70–79 | 39 | Good |
| 60–69 | 26 | Worse |
| 0–59 | 4 |
| Number of Lessons | Techniques | Accuracy % | Precision | Recall | F1 Score |
|---|---|---|---|---|---|
| 1 | ANN | 38.74 | 0.3000 | 0.3874 | 0.3425 |
| Logistic Regression | 41.67 | 0.4167 | 0.4167 | 0.5167 | |
| Random Forest | 26.67 | 0.2667 | 0.2667 | 0.2930 | |
| Decision Trees | 38.33 | 0.3833 | 0.3833 | 0.3930 | |
| SVM | 31.67 | 0.3167 | 0.3167 | 0.4297 | |
| 4 | ANN | 43.26 | 0.4302 | 0.4326 | 0.4338 |
| Logistic Regression | 31.07 | 0.3107 | 0.3107 | 0.3508 | |
| Random Forest | 35.89 | 0.3589 | 0.3589 | 0.3647 | |
| Decision Trees | 32.50 | 0.3250 | 0.3250 | 0.3386 | |
| SVM | 37.86 | 0.3786 | 0.3786 | 0.4291 | |
| 8 | ANN | 47.12 | 0.4697 | 0.4712 | 0.4941 |
| Logistic Regression | 42.27 | 0.4227 | 0.4227 | 0.5435 | |
| Random Forest | 40.36 | 0.4036 | 0.4036 | 0.4241 | |
| Decision Trees | 37.45 | 0.3745 | 0.3745 | 0.3826 | |
| SVM | 42.09 | 0.4209 | 0.4209 | 0.4678 | |
| 12 | ANN | 56.53 | 0.5500 | 0.5653 | 0.5703 |
| Logistic Regression | 40.09 | 0.4009 | 0.4009 | 0.5398 | |
| Random Forest | 54.00 | 0.5400 | 0.5400 | 0.5471 | |
| Decision Trees | 46.82 | 0.4682 | 0.4682 | 0.4682 | |
| SVM | 49.45 | 0.4945 | 0.4945 | 0.5034 | |
| 16 | ANN | 73.69 | 0.7405 | 0.7370 | 0.7372 |
| Logistic Regression | 45.45 | 0.4545 | 0.4545 | 0.5451 | |
| Random Forest | 65.27 | 0.6527 | 0.6527 | 0.6527 | |
| Decision Trees | 41.82 | 0.4182 | 0.4182 | 0.4225 | |
| SVM | 56.36 | 0.5636 | 0.5636 | 0.5717 |
© 2020 by the authors. Licensee MDPI, Basel, Switzerland. This article is an open access article distributed under the terms and conditions of the Creative Commons Attribution (CC BY) license (http://creativecommons.org/licenses/by/4.0/).
Share and Cite
Jiang, B.; He, Y.; Chen, R.; Hao, C.; Liu, S.; Zhang, G. Progressive Teaching Improvement For Small Scale Learning: A Case Study in China. Future Internet 2020, 12, 137. https://doi.org/10.3390/fi12080137
Jiang B, He Y, Chen R, Hao C, Liu S, Zhang G. Progressive Teaching Improvement For Small Scale Learning: A Case Study in China. Future Internet. 2020; 12(8):137. https://doi.org/10.3390/fi12080137
Chicago/Turabian StyleJiang, Bo, Yanbai He, Rui Chen, Chuanyan Hao, Sijiang Liu, and Gangyao Zhang. 2020. "Progressive Teaching Improvement For Small Scale Learning: A Case Study in China" Future Internet 12, no. 8: 137. https://doi.org/10.3390/fi12080137
APA StyleJiang, B., He, Y., Chen, R., Hao, C., Liu, S., & Zhang, G. (2020). Progressive Teaching Improvement For Small Scale Learning: A Case Study in China. Future Internet, 12(8), 137. https://doi.org/10.3390/fi12080137