1. Introduction
In an effort to increase international communication, people and organizations within the EU area and Europe in general have been adopting the use of English as a common language for a long time. Although the use of the English language is considered an important factor for the internationalization of institutional and organizational websites [
1,
2], there is still, according to our knowledge, no study that focuses on the EU countries and spans multiple disciplines from education to government and commerce. The facts that the EU member states are archetypal nation-states and language is the common denominator of national identity strengthen the need for a study such as the one at hand, which will try to provide data regarding the influence of a foreign language in member states of a multinational formation such as the EU. The purpose of this research is to study the diffusion of the English language, and measure its spread in countries of the EU, and more specifically in the ones that don’t have English as one of their official languages.
In summary, the research goals of this work are: (i) to statistically examine and measure the existence of English content availability in a wide range of websites from each EU member state and (ii) to examine the proportion of websites in which English appears to have greater prevalence than each EU member state’s official language or languages. In order to meet these goals, the study provides accurate and fully quantifiable data extracted by a very large and representative sample of EU websites. This information can become a valuable instrument in understanding not only the use of language to achieve better international reach, but also the changes underway in the national identity of EU member states.
This research makes use of the Internet and specifically the World Wide Web to develop a method to analyze the diffusion of English. The World Wide Web is a major driving force in creating a global community but is also a technological entity that can to some extent be measured. By studying what languages are available or hold prominence in a large number of websites from every country of the EU we can get an accurate metric of the diffusion of English.
For the purposes of this study we consider the use of a National Top-Level Domain (NTLD) as an intentional action from the website’s owner to associate their website with a specific country. There are no technical requirements in procuring a Global Top-Level Domain (GTLD). The website hosting server does not need to be in a specific location and the language of the content presented in the website does not need to meet specific criteria. Hence, it is safe to assume that anyone who desired not to associate their website with a specific country or region would opt for the selection of a GTLD. On the other hand, purposefully selecting a NTLD can be seen as a clear indication of a relation between the website and the equivalent country. This notion is further reinforced as in the past use of the country’s NTLD has been linked to cultural characteristics and national pride for example in Sweden [
3] or India [
4].
Following that reasoning, from a grand total of more than 5.9 million recorded websites that belong to European national top-level domains, a sampling pool of over 100 thousand websites was created. These websites were then automatically traversed, and their content analyzed in order to infer the language they use, as well as any additional languages they might be offering, through a Language Inference Algorithm (LIA) developed exclusively for the purposes of the research at hand. Further below the results of this process are presented and relevant conclusions are drawn.
2. Language on the Web
Half a century ago, Marshall McLuhan introduced and popularized the term “global village” as the effect of an interconnected world due to the massive consumption of media [
5]. Internet as a medium of communication fulfilled this forecast by connecting people in distant locations and by intensifying relations. The Internet and the Web can be recognized as basic carriers or means of globalization when it comes to communication. Of course, we should take into account the digital divide [
6], but in general, Internet usage is steadily growing with Internet penetration being at 58.8% of the world population at the end of 2019 [
7].
Globalization does not have a specific definition [
8] and it can take different meanings depending on the context someone is referring too. For instance, globalization can have financial aspects, cultural aspects, social aspects and more. Three decades ago, Anthony Giddens described globalization as the increase in worldwide social relations that connect remote localities in such a way that local events are formed by events taking place far away and vice versa [
9]. We will use this definition because it is relevant to the topic under discussion. Communication technologies are transforming localities not only at a national level but at a more intimate and personal one [
9].
Although the aspects and consequences of globalization are disputed, what remains undisputable is the increase in interaction that the Internet (as part of globalization) has spurred [
10]. One of the aspects of globalization feared by scholars was homogenization, in the sense that there will be a standardization of lifestyles at a worldwide level and that the oriental and traditional cultures will be “westernized” [
11]. On the other hand, other scholars believe that homogenization will not happen, instead what will happen is hybridization [
12] and of course, someone should not forget the very well-known by now term of “glocalization” which is a mix of global and local, meaning that globalization will adapt to the local context [
13].
It is commonly accepted that language plays a crucial role in a culture, as it is an integral part of it, and in a way, it is a “symbolic representation of people” [
14]. Gazzola [
15] also points out the symbolic function of language mentioning that it is linked to people’s sense of national identity. Crystal [
16] characterizes language as one of the most immediate and universal symbols of people’s identity. He argues that the need for identity preservation and intelligibility often lead people in different directions. The need for identity promotes the use of ethnic culture and language and the need for intelligibility pulls people towards learning an international language, with English being the first choice in most of the cases. Taking language as a part of culture in the context of globalization, it is worth investigating whether there is a homogenization, a hybridization, or glocalization of it in the Web context. For instance, we know by experience that there is a level of glocalization by accepting the use of terms such as “Greeklish”, that means writing Greek words using Latin alphabet or the analogous case of “Franglais” which refers to the extended use of English words and expressions in modern French. There is also a level of hybridization when we adopt a foreign word and use it without translating it. On the other hand, homogenization is more difficult to observe. However, if cases where a language will be used as the main language of communication in the Web, then at this level we can talk about homogenization. Kim [
17], in an article about the globalization of the English language, characterizes it as undeniably global and international. In fact, Kim compares English to previous world languages like Arabic, Latin, and Turkish, mentioning that in fact they were not global, but rather geographically and socially limited, while the English language has managed to transcend such boundaries and spread globally. The factors that have led to its dispersion are related not only to political and diplomatic factors, but also to the language structure itself. For instance, the English language has comparably simple grammar, it is not hesitant in adopting words from other languages, it has a great amount of literature, and it is written in an easy to learn way. The fact that English language is characterized as a global language is not a contemporary phenomenon. David Graddol [
18] and David Crystal [
16] referred to English language as global during the 1990s. When it comes to transferring the language expansion to the Internet, David Block [
10] mentions that the English language was more prevalent than other languages even in the very beginning of the Web. According to Dor [
19], this was attributed to the fact that, during the early days of the Internet, the majority of users were English speaking. Fishman [
20] mentions that more than 80% of the content posted on the Internet is in the English language. Nonetheless, David Block [
10] in his study found that, despite the initial estimations that the Internet will promote the English language above all as an international language, this is not exactly the case, since the web is a common space for other languages as well. Dor [
19] argues that the spread of English language as the main language of communication between Internet users is regarded as the linguistic equivalent to financial globalization, but he believes that it is the consequence of other aspects of globalization, such as the financial and political. In addition, he also believes that the Internet is turning multilingual, but for reasons related to the economic aspects of globalization.
Although Edwards [
21] describes language as a part of our identity and consequently a part of our national identity, he sees a link between nationalism and language communities in Europe, but in other continents such as Africa and Asia, the link seems to be replaced by religion. Regarding language prevalence in more official settings, it seems that every country can keep the official language of the country as its working language. The same applies in cases where more countries that act as nation-states are included. For instance, Gazzola [
15] mentions that each nation-state has its official and working language and multilingualism has been confirmed. Despite the fact that more than a decade passed since Gazzola’s evaluation, still, each nation-state has its own official and working language, and by now there are 24 official languages in the European Union [
22]. The European Union’s website mentions that, “even after the withdrawal of the United Kingdom from the EU, English remains one of the official languages of Ireland and Malta”. Furthermore, the EU tries to establish multilingualism by having as a goal that EU citizens will be able to communicate in two or more languages other than their mother tongue [
22]. On the other hand, Wodak and Boukala mention that multilingualism is favored towards the languages of EU states and that proficiency in one of the national languages of its members is required in order to enforce this collective or (supra)national identity and exclude outsiders [
23]. At the same time, Kuhn [
24] mentions that there is an increase in the identity politics of the European Union and the citizens’ collective identities are significant for European integration. This is attributed to various factors, most prominent among them being the increasing participation of the citizens in transnational transactions. Although it is not mentioned in her article, we can safely assume that the Web made those transactions easier while we can also argue that a common language among the EU citizens would help these international transactions.
Nowadays, English remains the most used language in the web, used by 25.2 % of Internet users worldwide, followed by Chinese that counts for the 19.3% of the Internet users [
8]. In addition, in a study by Mongeon and Paul-Hus [
25] using Web of Science and Elsevier’s Scopus, it is suggested that journals written in the English language are overrepresented to the disadvantage of other languages. This is indicative of the fact that the authors are writing in the English language, even when it is not their mother tongue. A similar research regarding citations in Web of Science, Scopus, and Google Scholar by Martín-Martín [
26] suggested that the majority of citations were published in English, with the percentage for unique citations ranging from 62% to 80%, depending on the field. These two studies imply the extended use of the English language, at least in the academic community, which in turn is one of the many communities that form the users of Web. The Mongeon and Paul-Hus [
25] study also mentions that there was a considerable number of journals that had abstracts in more than one language, with the one of them being English. Although they did not use the data for the second language, the probabilities are that the second language was either their native tongue, or the language of the publisher or conference host. Except from the academic field, studies focused on specific parts of the world also indicate the use of English language when using the Internet, to the detriment of their native tongue or other languages. For example, Wei and Kolko [
27] in their study regarding language and Internet diffusion patterns in Uzbekistan argue that users on average agreed that they have to use English too often while they are using the Internet.
Phillipson [
28] notes that the majority of countries in continental Europe are promoting learning English as a foreign language while other languages fall short since English is the language used in a lot of conferences and publications of the EU, as well as one of the main working languages in the Union’s institutions [
29]. Noteworthy however is the fact that English was not included in the first official languages of the EU in 1958. These were Dutch, French, German, and Italian. English was added along with Danish in 1973, and Greek was added a few years later. The fact that the European Union wants to promote multilingualism and have its citizen be able to communicate fluently in at least three languages makes it more possible for website owners to include more than one language in their websites. Hillier [
30] highlighted the importance of considering the cultural context when developing a multilingual website. He also argues that when someone chooses to create a multilingual website, each language version will have its own domain name, either at the country level domain or as a subdomain of the main domain, e.g., xxxx.com.gr, xxxxxx.com.fi etc. This implies that users/citizens correlate the domain with their language and consequently with their culture and national identity. Top-level domains (TLDs) are the letters (characters) forming the last part of a fully qualified domain name. There are two naming structures for TLDs. One is referred to as global (GTLDs), with the most common endings being .com, .net, .org. The second naming structure is the national (NTLDs) and it is based on geographical criteria. It is usually composed endings with two letters such as .gr for Greece, .at for Austria, .fi for Finland etc. [
31]. During the early days of the Web, the widespread use of the .com TLD over the rest led to the gradual adoption of GTLDs. By now, it is uncertain if in the vast cyberspace a user will choose a NTLD over GTLD due to a choice based on culture and national identity or due to a habit that has its roots in the early days of the Web. In general, although most works mentioned above are not strongly related to the present study, they make two very important points: i) the use of the English language is a means to achieve a broader international reach and ii) the choice of a national TLD over a global one indicates an intention to associate with the equivalent nationality. These two points of approach converge to create the necessity for research with the characteristics of this study, which in turn will provide data and quantified information to enrich the relevant theoretical discussions.
3. Methodology
In order to achieve the goals of this research, it was required that multiple websites from every member state of the EU were analyzed. This analysis provided us with information about the languages used in each website. The tools used in this process are described in detail below. All tools were developed using PHP and recorded their data in a MariaDB Server database. “PHP is a widely-used open source general-purpose scripting language” [
32]. “MariaDB Server is one of the most popular database servers in the world […] made by the original developers of MySQL” [
33]. MariaDB was selected for its performance. PHP was selected because its popularity ensures there are plenty of tools for each task required by the study and because of the researchers’ familiarity with the language.
The complete analysis process can be divided into several steps:
Step 1: Collect a large number of websites to analyze.
Step 2: Determine the sampling method and size.
Step 3: Crawl websites and record relevant information.
Step 4: Use that information to extract answers.
The process took place over the months of January 2020 and February 2020. The process of collecting websites provided more than 5.9 million websites and the crawling process included more than 100,000 websites. The large amount of data gathered and the representativeness of the sample which was automatically and without bias selected from a vast total population helped create a quite realistic estimate of how websites across the EU treat languages.
3.1. Collecting a Large Number of Websites to Analyze
The nature of the present research required as many websites as possible, so that both our total population and our sampling pool were as close a representation of reality as possible. For this purpose, we used information obtained from Common Crawl, a “repository of web crawl data that is universally accessible and analyzable” [
34]. Among the data Common Crawl offers is an index of every available webpage for all member states of the EU amongst other countries. A process was developed in PHP: Hypertext Preprocessor (PHP) that used the CompounD indeX (CDX) server Application Program Interface (API) [
35] to access Common Crawl’s Uniform Resource Locator (URL) index [
36] and created a MariaDB database with information about websites from every member state of the EU.
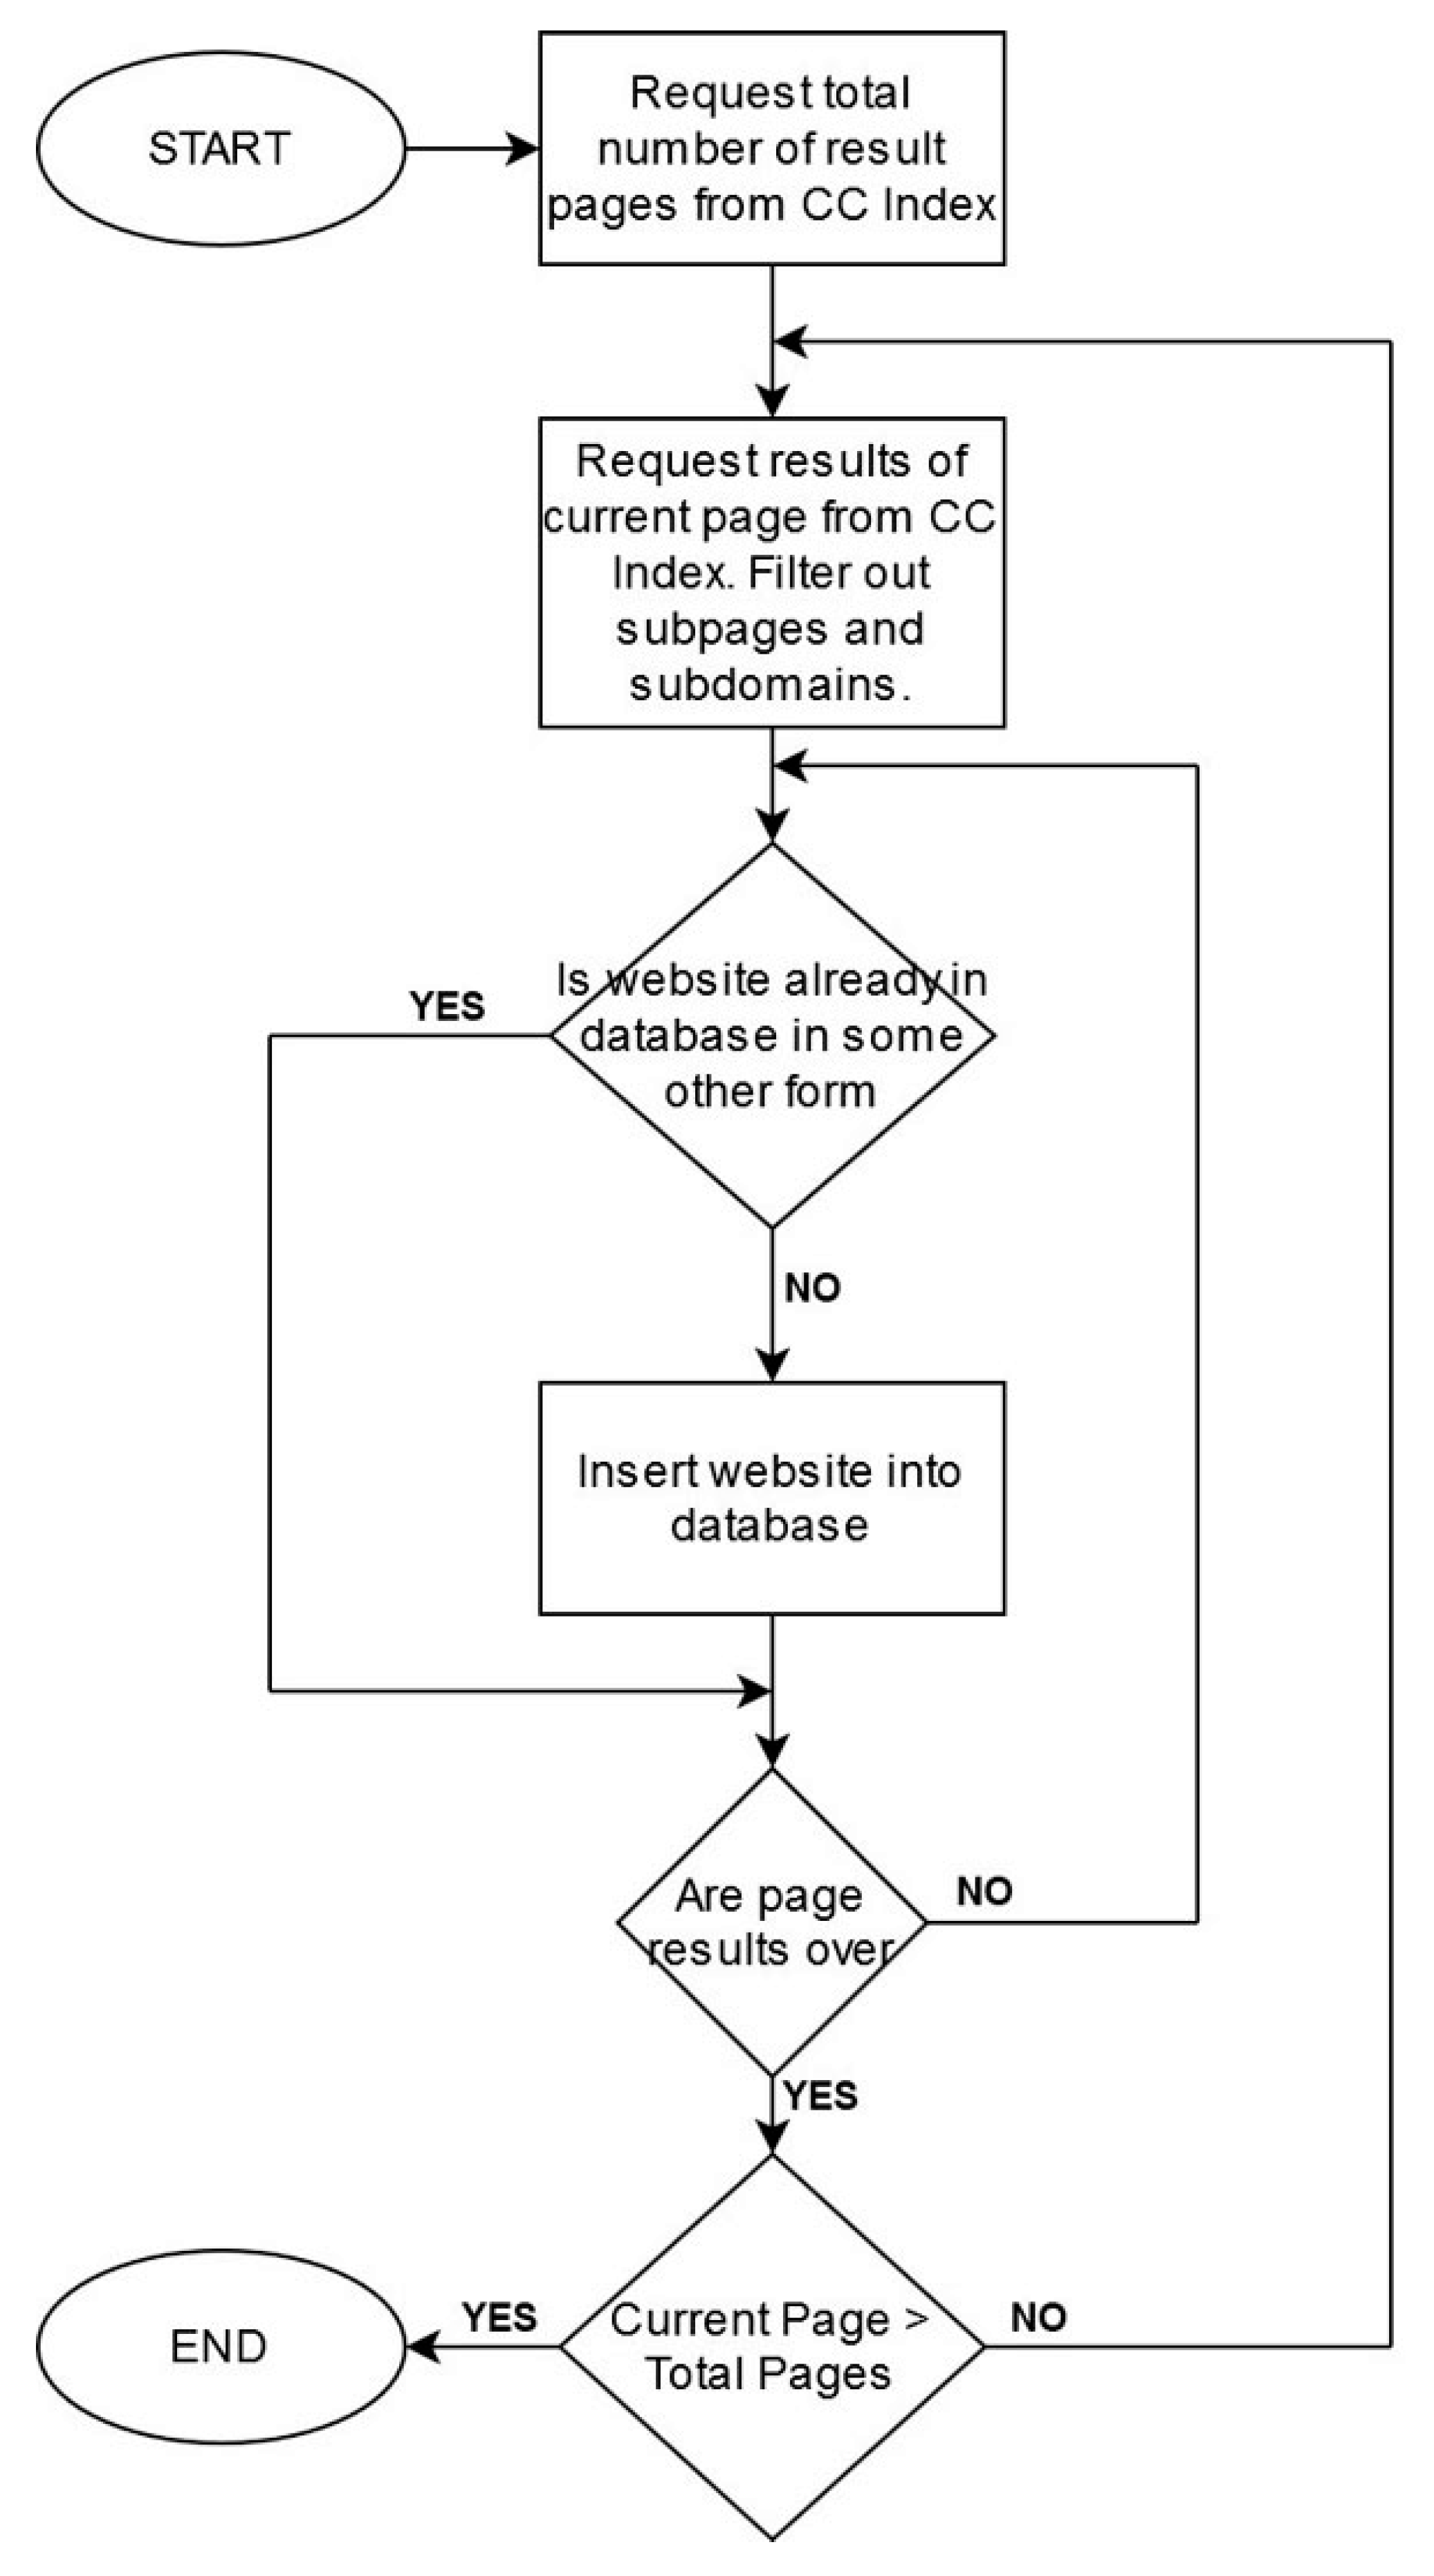
Although Common Crawl’s index provides all available crawled pages, our process of data collecting only focused on recording the landing page of one website per domain. This way, we made sure that websites of different sizes got the same representation in our data. Whether a domain contained thousands of subpages or just a few, it was given a single record in our database. Later in the process, when the domain is crawled in order to determine the languages used, multiple subpages are processed. This helps us shift the focus from how many individual pages use a language to how many websites as a whole use a language, thus making the website the main entity of our research as opposed to treating every page as its own separate entity. This helps focus results around individual real-life entities (people, businesses, organizations, groups, cities etc.) that are represented online instead of having such entities with a very large online presence in page count dominate over smaller but equally important ones.
On many occasions, a website is available both in normal HTTP and in the more secure HTTPS version. In addition to that, websites often make use of the www subdomain but are also available without it. In order to avoid domain duplicates our information gathering process made sure each domain was only accepted into the database once, while at the same time keeping track of what versions of the website were recorded in the Common Crawl Index (http, https, with www or without www).
For the purposes of this research, a decision was made to exclude subdomains from our website database. This was decided not only because subdomains are often subsections of one unified website, but also because subdomains are often used to provide different language versions of the same website (en.example.com vs de.example.com). Later in the process, when we crawl the websites ourselves to help detect their language, we extend our crawling to subdomains that are linked in a website’s front page and consider them part of a single website entity.
In order to successfully distinguish websites that use their SLD (second level domain) as part of a second-level hierarchy for NTLDs as opposed to indicate the registrar we compiled all second level hierarchies used by the various member-states of the EU. Mozilla Foundation’s Public Suffix List [
37] along with a National Top-Level Domain for Europe provided by Global WHOIS Search [
38] were used for the compilation of our list. The list is available on
Table 1. All countries that only use NTLDs were omitted.
Furthermore, the Common Crawl index provides a language annotation for every page, based on the detection result of Compact Language Detector 2, a library for the probabilistic detection of a written language [
39]. Since our study mainly focuses on the linguistic aspect, we also kept a record of the language as detected by CLD2 and provided by the Common Crawl index. This is used in tandem with our own crawling results to help determine the languages used by the different websites that were used in this research. A flowchart demonstrating the website collection process can be seen in
Figure 1.
3.2. Determining the Sampling Size
Time constrictions did not allow us to crawl every single website that was added in our website index which was more than 5.9 m websites. In order to make sure that our data were representative of reality we had to define an appropriate sampling size. Considering the number of websites available in our index, we set the confidence level high at 99%. In order to achieve a reasonable process timeframe and due to the rather large population size, we opted for an error margin of 2%. This led us to the sampling sizes that are available in
Table 2.
The Cochran’s standard sample size formula [
40] that appears in Equation (1) was used in order to calculate the required sample for each country. Where N = population size, e = margin of error (percentage in decimal form), z = z-score which is the number of standard deviations away from the mean and can be found in specific tables, and p is sample proportion which is basically 0.5. The calculations were made using the help of SurveyMonkey’s Sampling Size Calculator [
41]. SurveyMonkey is a widely popular online survey platform [
42].
3.3. Crawling Websites and Recording Relevant Information
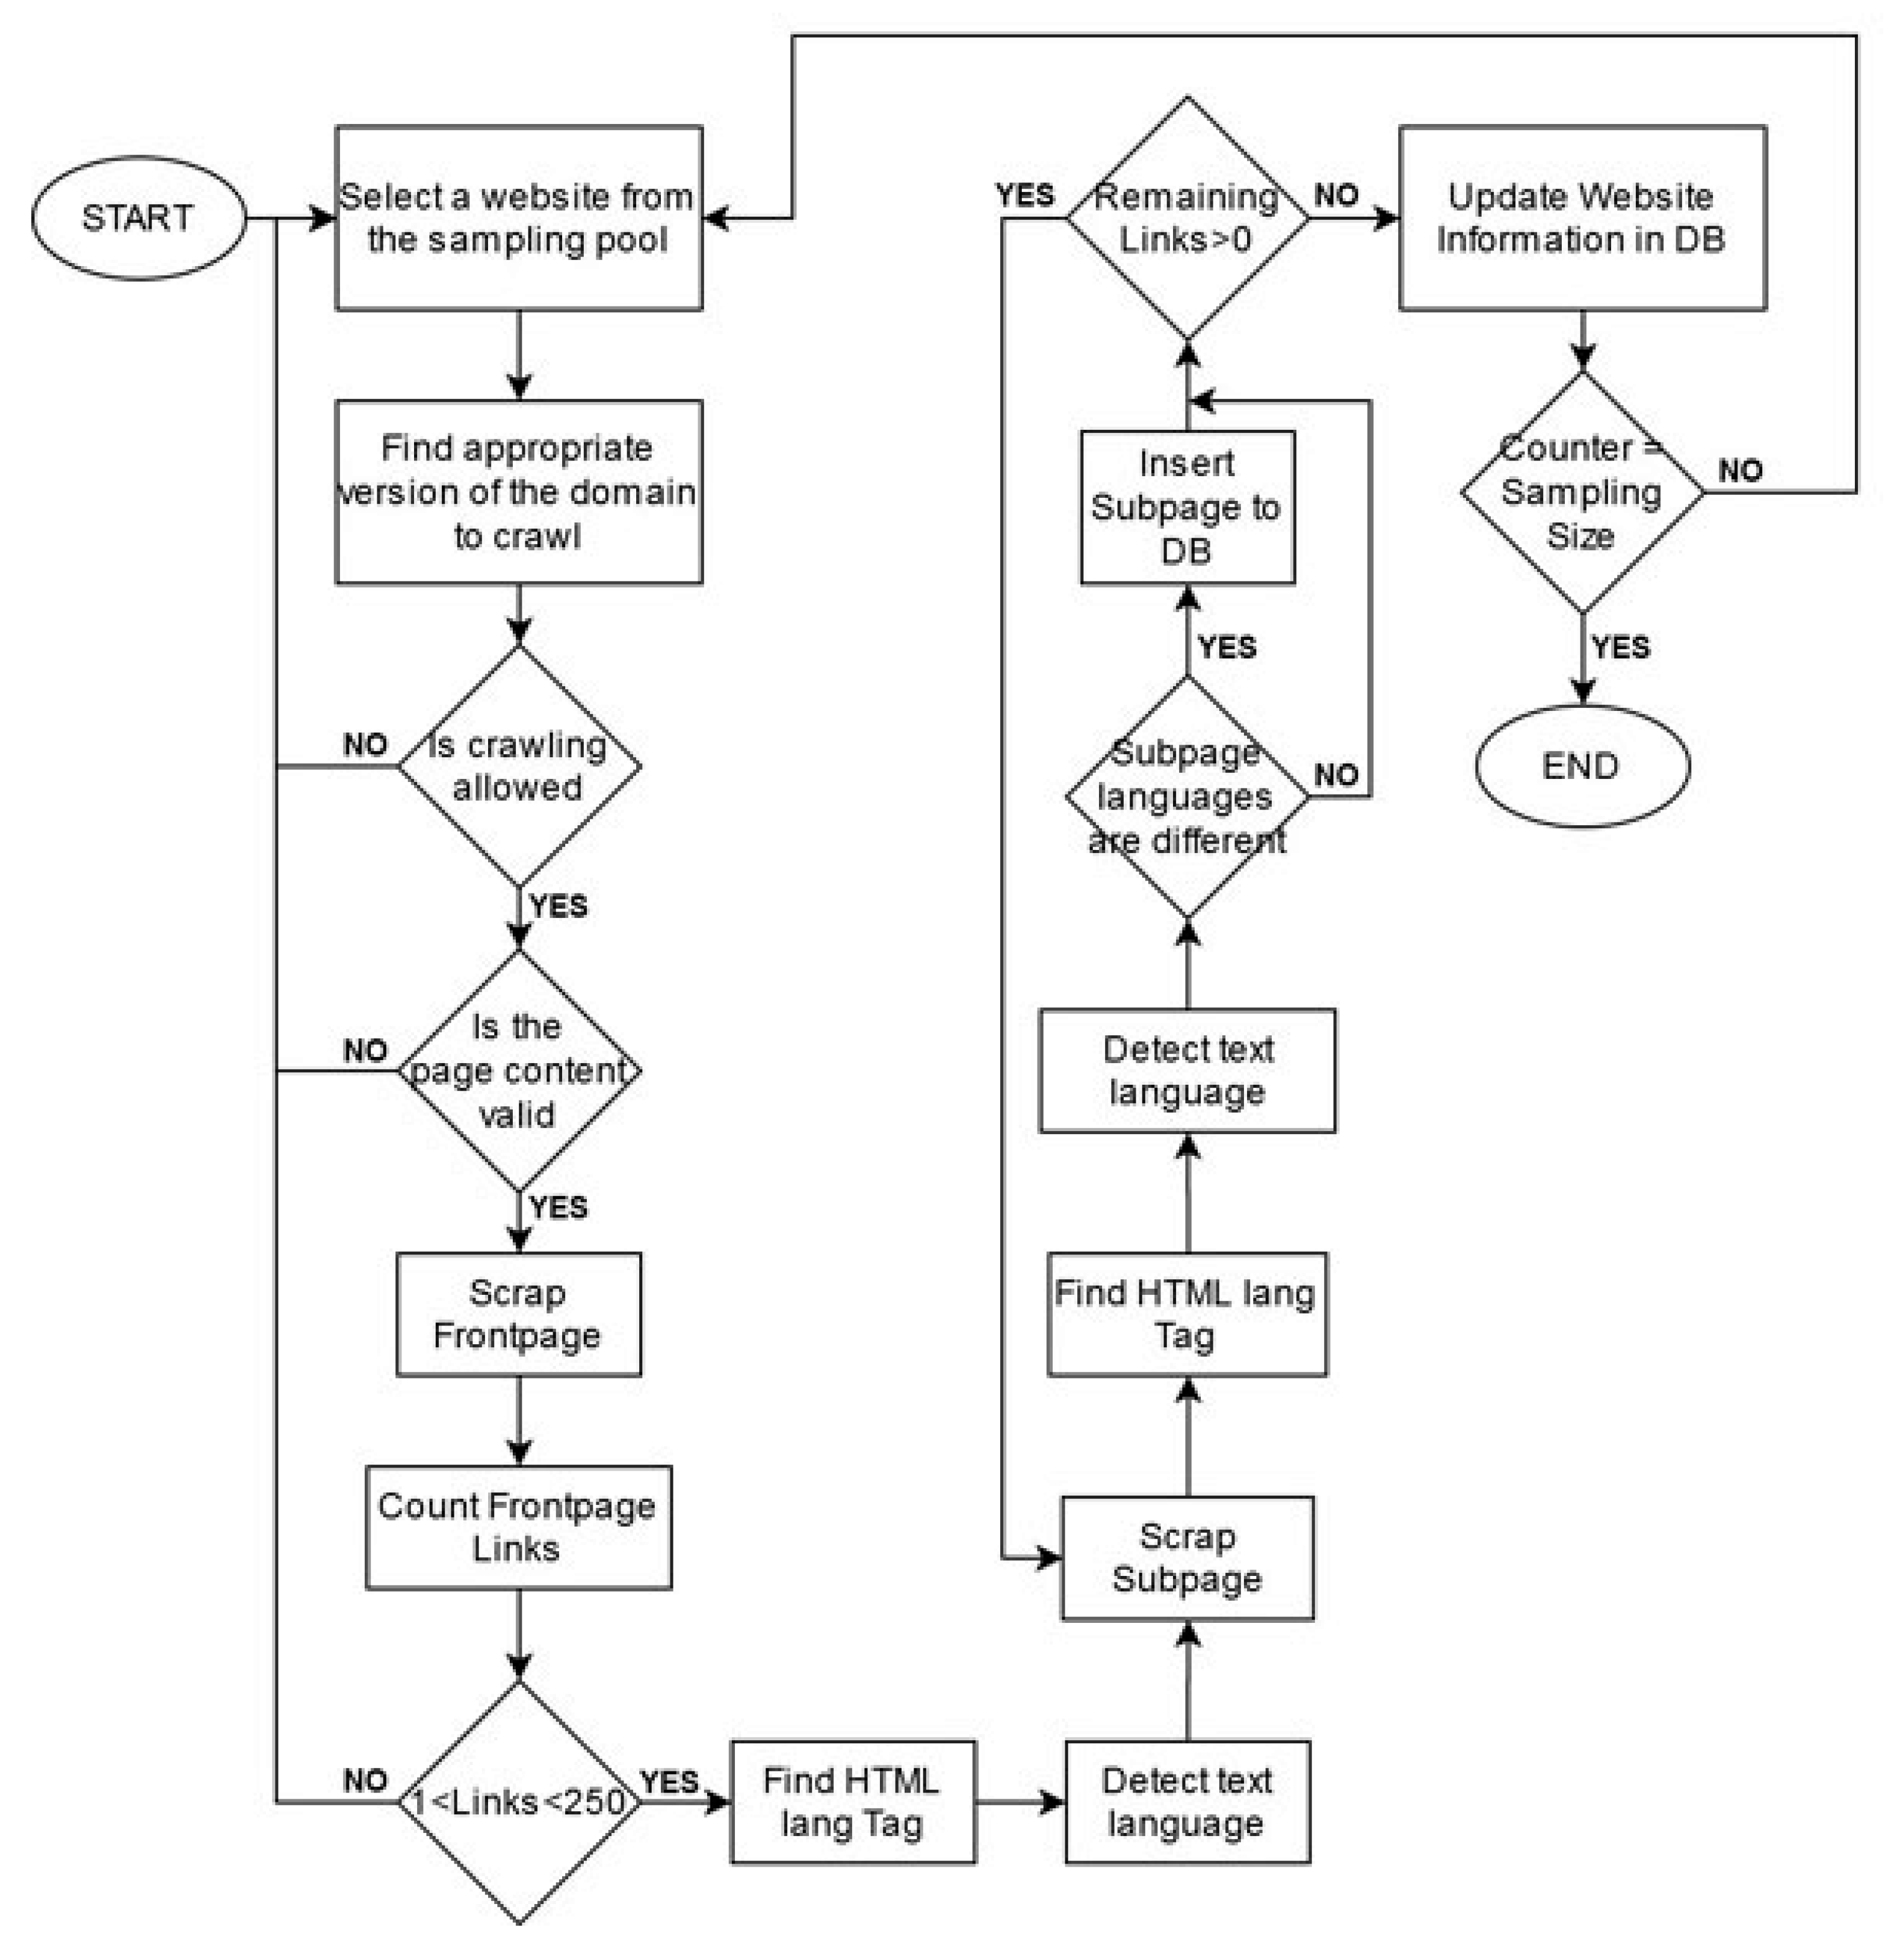
In the next step of our process, a number of websites equal to the sampling size were analyzed using a proprietary crawler which was developed using PHP and manipulated data in the MariaDB database developed during Step 1. The crawler first checked every available version of each website (http/https, with/without www). Priority was given to the https versions and the versions with www. The process followed the appropriate instructions available in the robots.txt file in order to determine whether crawling for that specific website was allowed or not. If it was, then the frontpage was scraped and analyzed. If not, the website was removed from the sampling pool and replaced. Additionally, if the page allowed crawling but returned an error page or a redirect it was also removed from the sampling pool and replaced.
In addition to that, the number of internal or subdomain links in each frontpage was counted and if that number was below 2 or above 250 the webpage was considered an extreme case and was removed from the sampling pool and replaced. The reasoning behind this is that, more often than not, low link pages are just placeholders and extremely high link pages are suspicious as they are often used to confuse search engines or are part of a back-link generation scheme. Additionally, they would increase the time required for the process to run without any clear benefit to the results.
First the lang attribute of the html tag was recorded if available. Then the crawler attempted to detect the actual written language of the page using the PHP language detection [
43] library. The language detection function processed the HTML DOM using PHP’s DOMDocument parsing library. With its help, it retained the text from each element of the frontpage while removing elements that don’t traditionally contain written content such as <head>, <script>, <style>, <svg>, <img>, and <code>. The full text of the page was then run through the language detection algorithm with a setting of 9000 max Ngrams in order to achieve more confidence in the result. If the full text of a page did not exceed 150 characters, any language detection was considered unreliable due to the short string and as such the language detection function returned an empty result.
Afterwards, in order to detect whether another language is available on the website, the crawler scraped every internal or subdomain link present in the frontpage and used the same language detection function to determine the language of each website. The HTML tag’s lang attribute of each subpage was also recorded. If a subpage’s detected language or lang attribute was different to the frontpage’s the crawler inserted this page into the database. These records would subsequently be used during the next step of the process to investigate the number of languages that a website supports.
A decision was made to stop the crawling of the website after one level beyond the frontpage. In the vast majority of multilingual webpages, the frontpage contains a link to the different language versions of the website. This way, we reduced the running time of the crawler but did not cause heavy traffic or other issues to the website being crawled. Towards the same goal, a delay was added between subpage scrapes. This delay was set to 1 second, and in addition, with the running time of the crawler and the language detection algorithm for each subpage, there was enough time between successive scrapes so that the website server’s performance wasn’t negatively impacted. A flowchart demonstrating the crawling process can be seen in
Figure 2.
3.4. Inferring Main and Other Languages
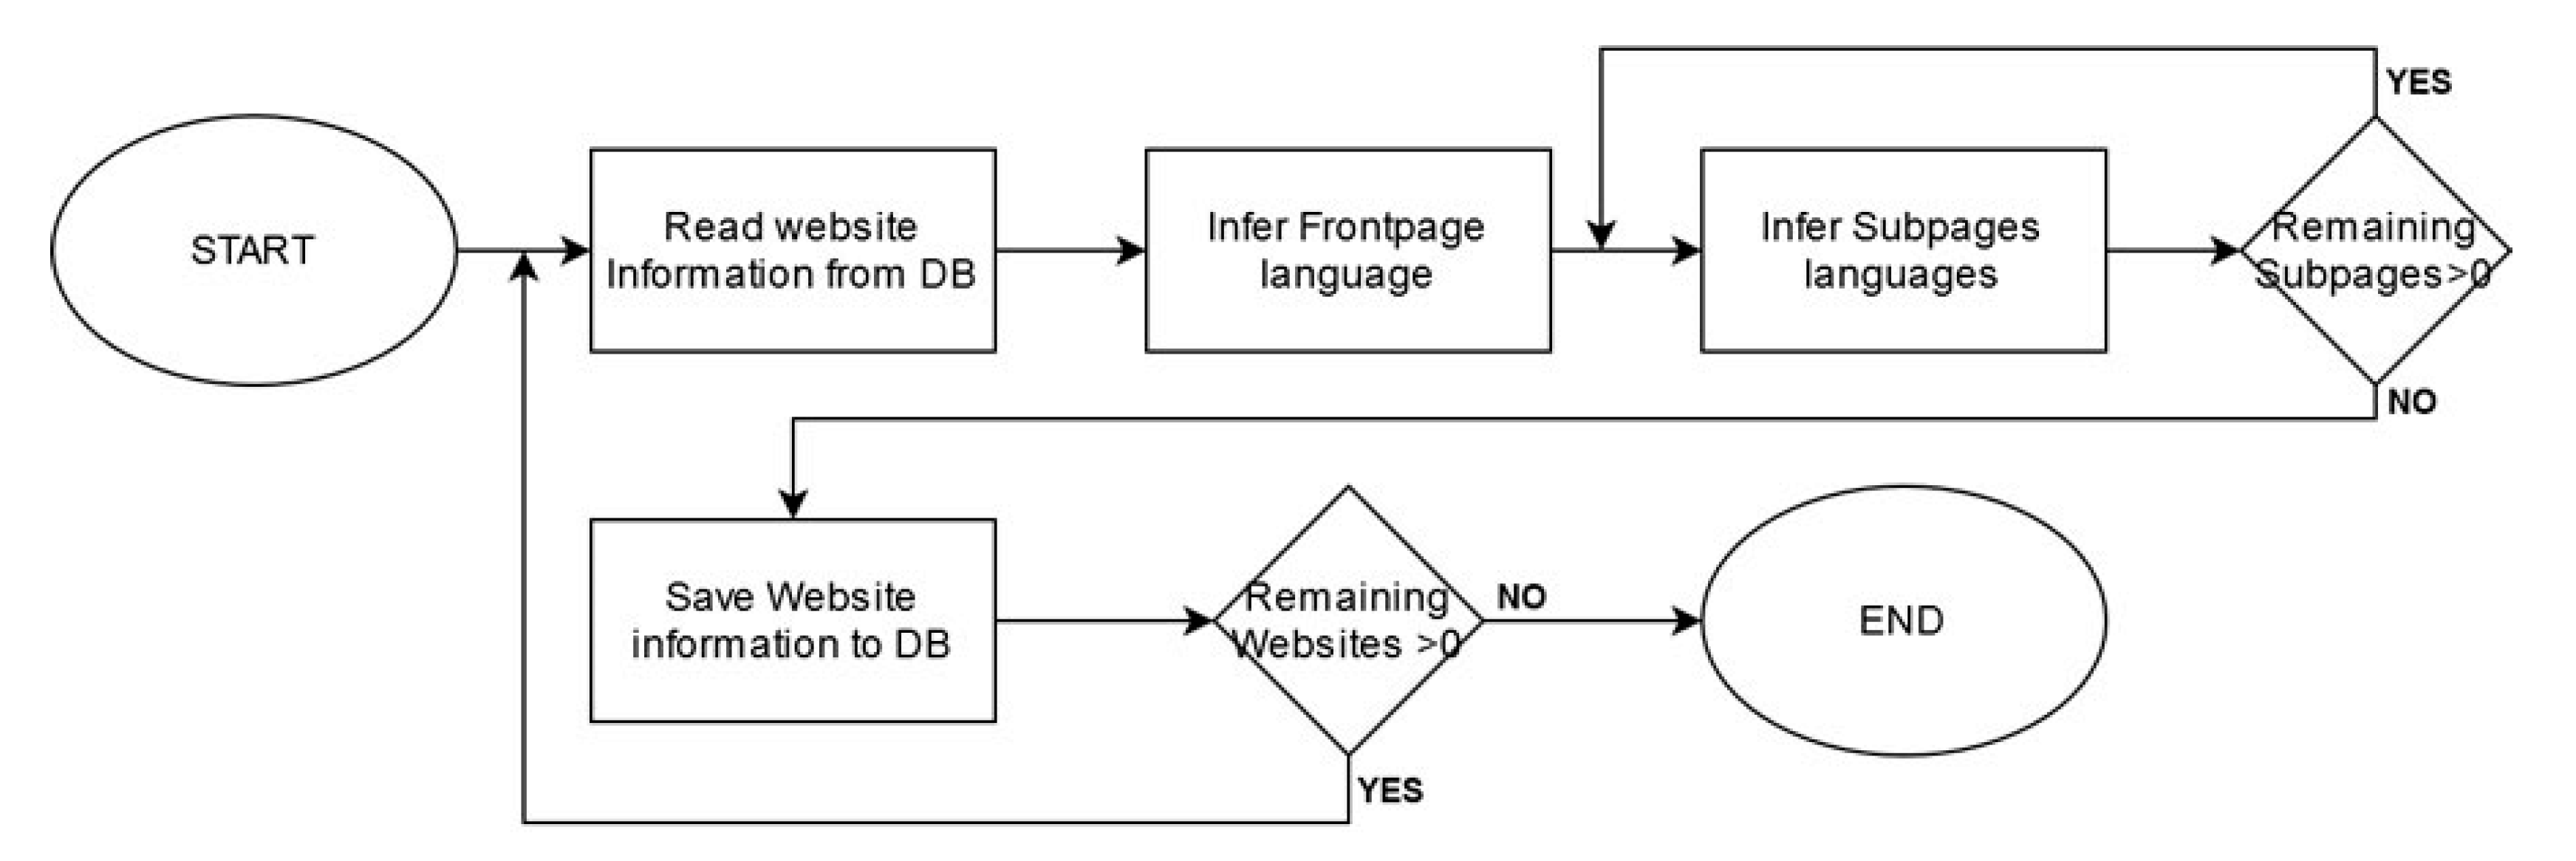
With the crawling process completed, large amounts of information were recorded in the database. The next step would be to use that information to reach a final conclusion about what the primary language of any website tested is, as well as what other languages are available in the website. In order to do that, an algorithm was developed that used the lang attribute of the HTML tag, the detected language of the php language detection library and the language provided by the Common Crawl Index which was detected by compact language detector 2. This language inference algorithm (LIA) was specifically developed for the purposes of this study, and as such, emphasis was given to the prevalence of the English language not only as a secondary supported language, but also as a primary language and its comparison with each country’s official language or languages.
In order to make the comparison between the detected languages and lang attribute easier, an array was created that contained the multiple different notations of a country’s official language that were encountered during the crawling process. In most cases, that included just the language’s ISO 639-1 two letter code, that was used by the lang attribute and the PHP language detection library, and the language’s ISO 639-3, that was used by CLD2. In some cases, more equivalent notations needed to be added in order to better infer each country’s official language. A list of these notations can be found in
Table 3.
In countries where English is an official language, if there is another official language, it was chosen as the primary language in order to facilitate the comparison between English and the other official language. This case includes Maltese for Malta and Gaelic for Ireland.
In countries with more than one non-English official language, the most prevalent was chosen based on how often it appeared in our already collected data. The most prevalent language was in every case identical in PHP’s language detection library, CLD2, and the lang attribute of the HTML tag. This case includes Dutch for Belgium and French for Luxemburg.
In countries where the NTLD is different to the two-letter ISO 639-1 notation the NTLD was included in the equivalency table. This was decided because occasionally it is declared in the HTML tag’s lang attribute even though it is not correct. This case included Austria, Belgium, Croatia, Cyprus, Czechia, Denmark, Estonia, Greece, and Sweden.
In the case of Croatia, the notation for both the Serbian and the Bosnian dialect of Serbo-Croatian was added.
With the notation equivalences in place, a priority rule system was implemented to infer each frontpages or subpage’s language. The rules are presented in
Table 4.
The rules are presented in order of priority. When a rule’s conditions are met, the primary language is inferred, and no lower priority rule is checked. The priority of rules was chosen to focus on inferring primarily the primary language of each country and English. A bit of extra weight is being placed on the PHP detected language over the CLD2 because the selected string that was parsed by the algorithm was selected specifically for the purposes of this study.
The HTML tag lang attribute is highly valued when deliberately stated by the webpage’s creator. An exception to this is embodied by rule 5. When the HTML tag lang attribute is set as English, but the detected language is the primary language of each country, the detected language is preferred (Rule 5). This was intentionally implemented because several popular CMS set the lang attribute to English by default without any regard to the page’s actual content. In contrast, the lang attribute was used to infer the language of a page when the lang attribute was explicitly stated in the HTML tag as something other than English, as this clearly indicated the purpose of the website’s developers. When the lang attribute is empty and the PHP detected language is not the country’s primary language, a combination of the CLD2 detected language and PHP detected language is used to infer the page’s language. In this process (rules 7–10), the PHP detected language is trusted more for the reasons mentioned above.
If the only information available to us after the crawling process is the PHP detected language, then it is only trusted in the case of a frontpage. This is meant to reduce the number of websites with no inferred language, but at the same time not to add a dubious detection as a secondary language when inferring the language of subpages.
If no information is available to us from either the lang attribute or the PHP detected language and the CLD2 detected language is neither the country’s primary language nor English, the algorithm is unable to infer a website’s language. This is very seldom the case and is usually true for image only websites or websites with non-html or client-side dynamically generated content. A flowchart demonstrating the language inferring process can be seen in
Figure 3.
5. Discussion
5.1. English Language Availability in Websites
One of the major cornerstones of international communication is a common language. In an effort to increase their respective reach, websites within the European Union often make themselves available in more than one language. Browsing through the results of the previous section, it is made abundantly clear that websites of non-English speaking member states are keener to provide their users with alternative languages.
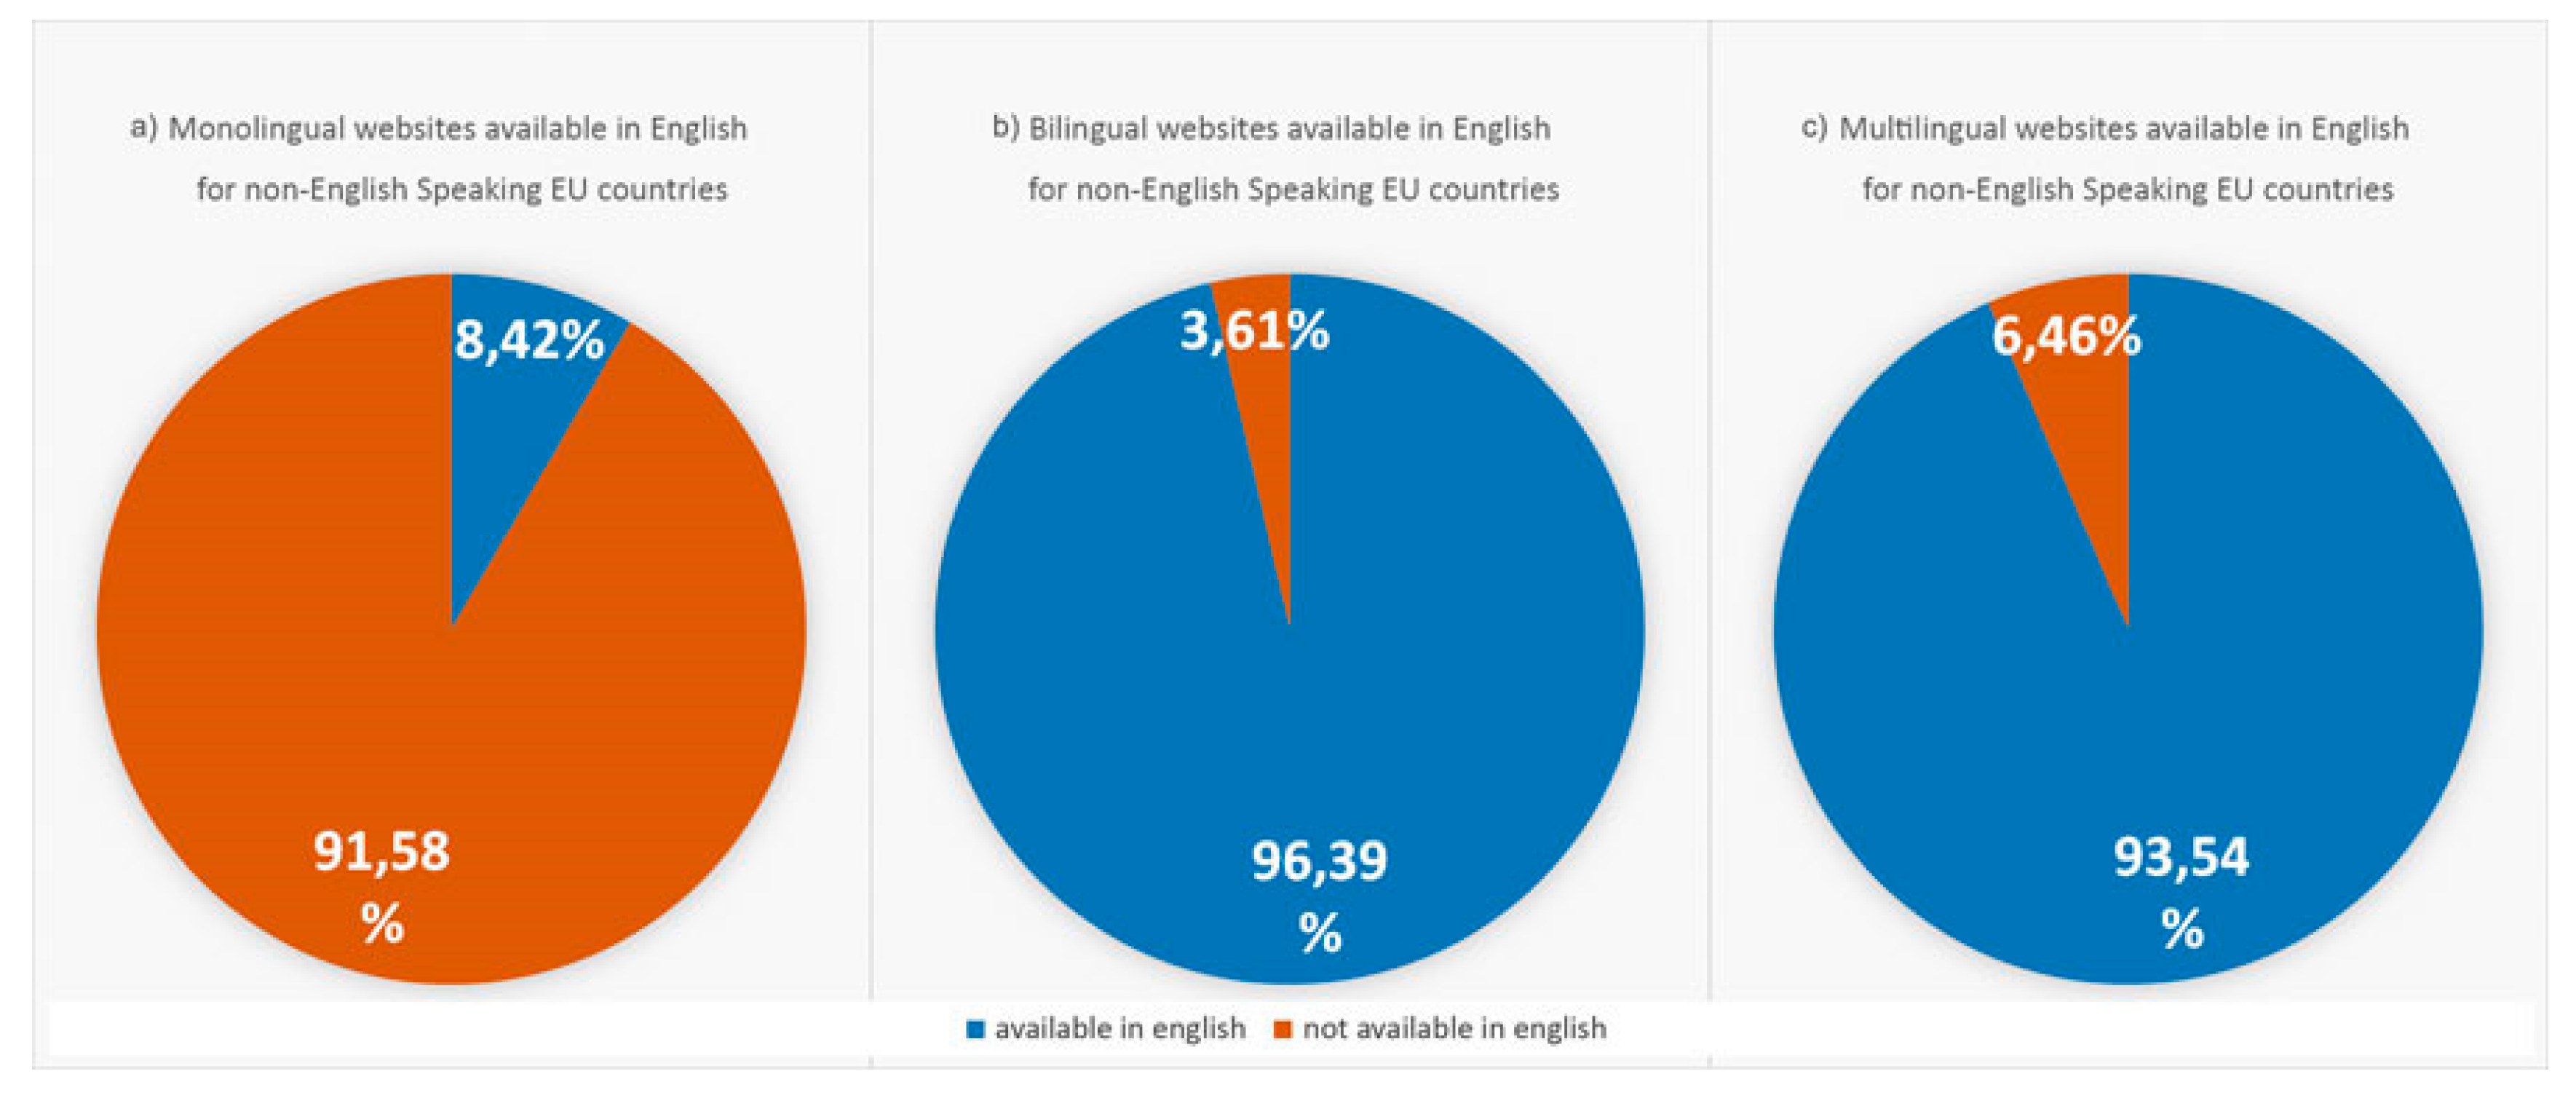
It is made clear by
Figure 4 of the results section that there is a discrepancy between English and non-English speaking countries. The percentage of monolingual sites drops from 98.01% in English speaking countries to 79.05% in non-English speaking countries. The major force behind that discrepancy is the effort to make non-English websites available in English as we will see further down.
Additionally, there is a notable difference between bilingual and multilingual websites. Making a website available in more than one language requires a lot of work, so having three or more languages is a costly endeavor. If the main purpose is increasing a website’s reach and that can be accomplished by using a dominant language, this makes the bilingual option much more attractive to website owners.
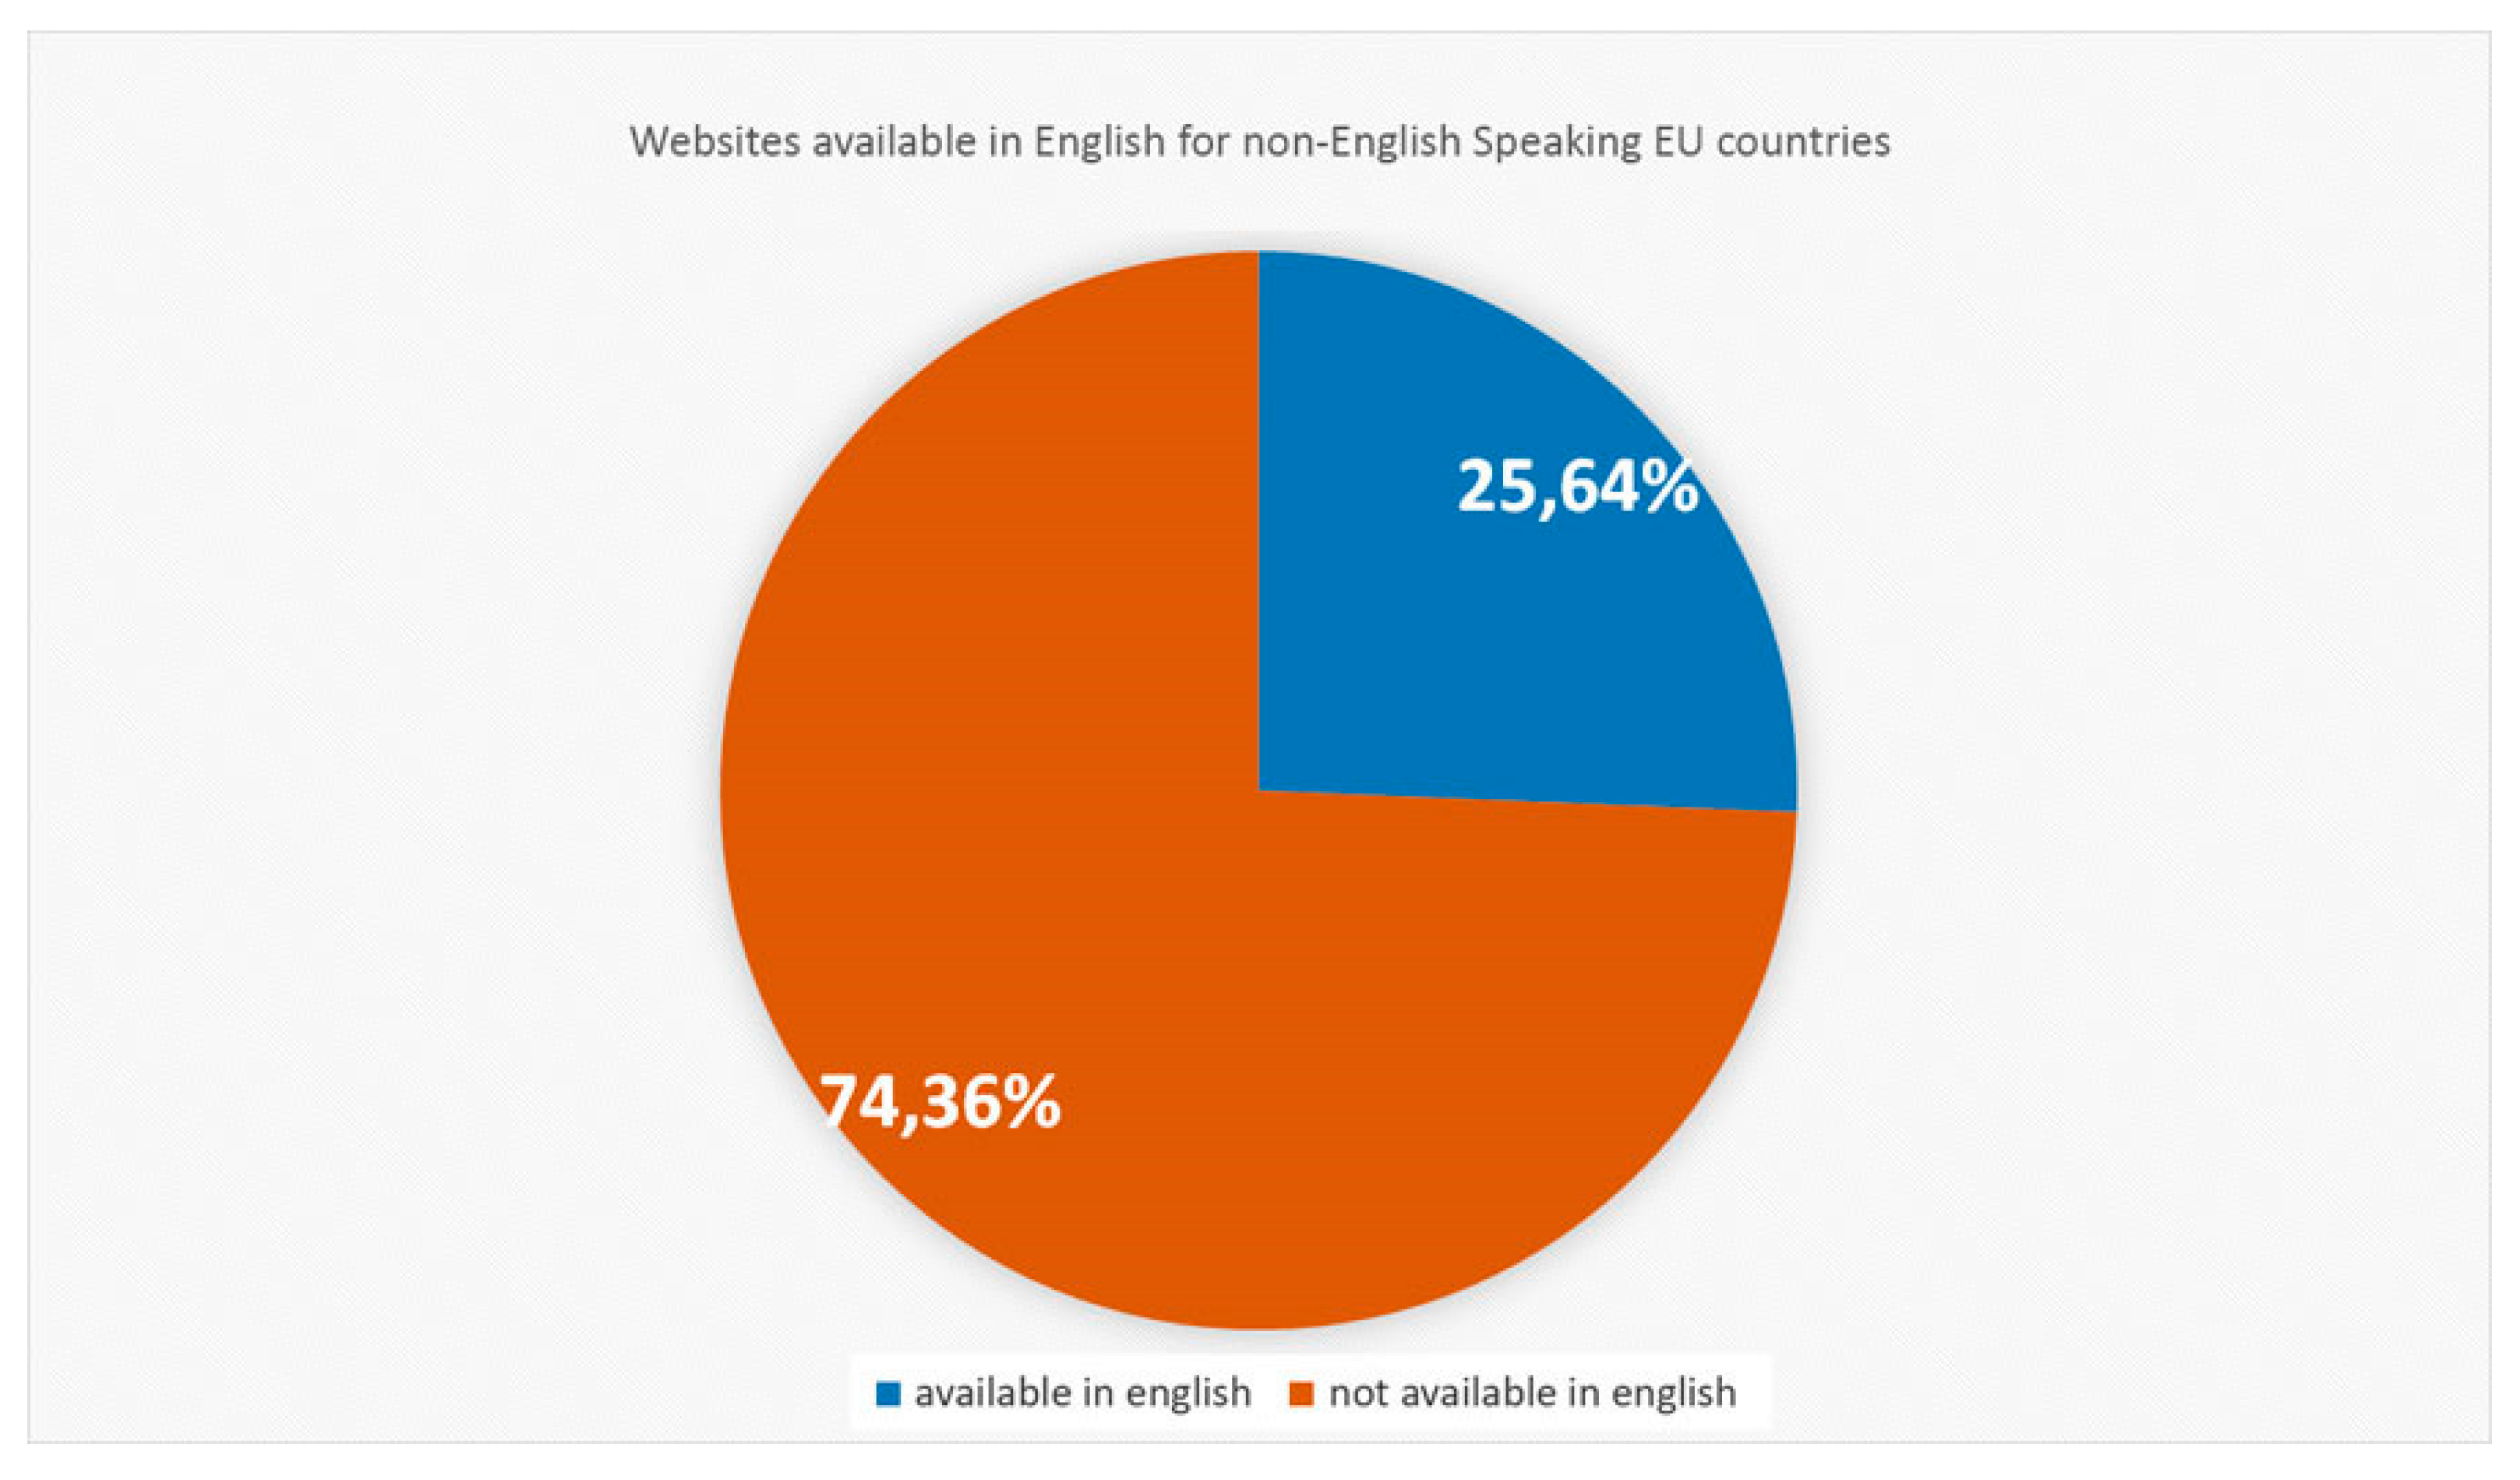
If we take into account the relative percentage of websites available in English in non-English speaking member states, as presented in
Figure 5, coupled with the fact that English speaking countries not only have a very low number of bilingual or multilingual websites, but also have a very high percentage of websites available in English, we come to the conclusion that there is a consensus that the English language is considered enough to cover the need of EU websites for international reach.
Having the English language available on a website can be achieved by adding it on top of each country’s established official language and that can increase costs. In some cases, especially when international or pan-European reach is the main objective of the website, the official language is abandoned, and the website is presented only in English. Additionally, when the investment for providing multiple languages is made, occasionally, other languages get priority over English.
As seen in
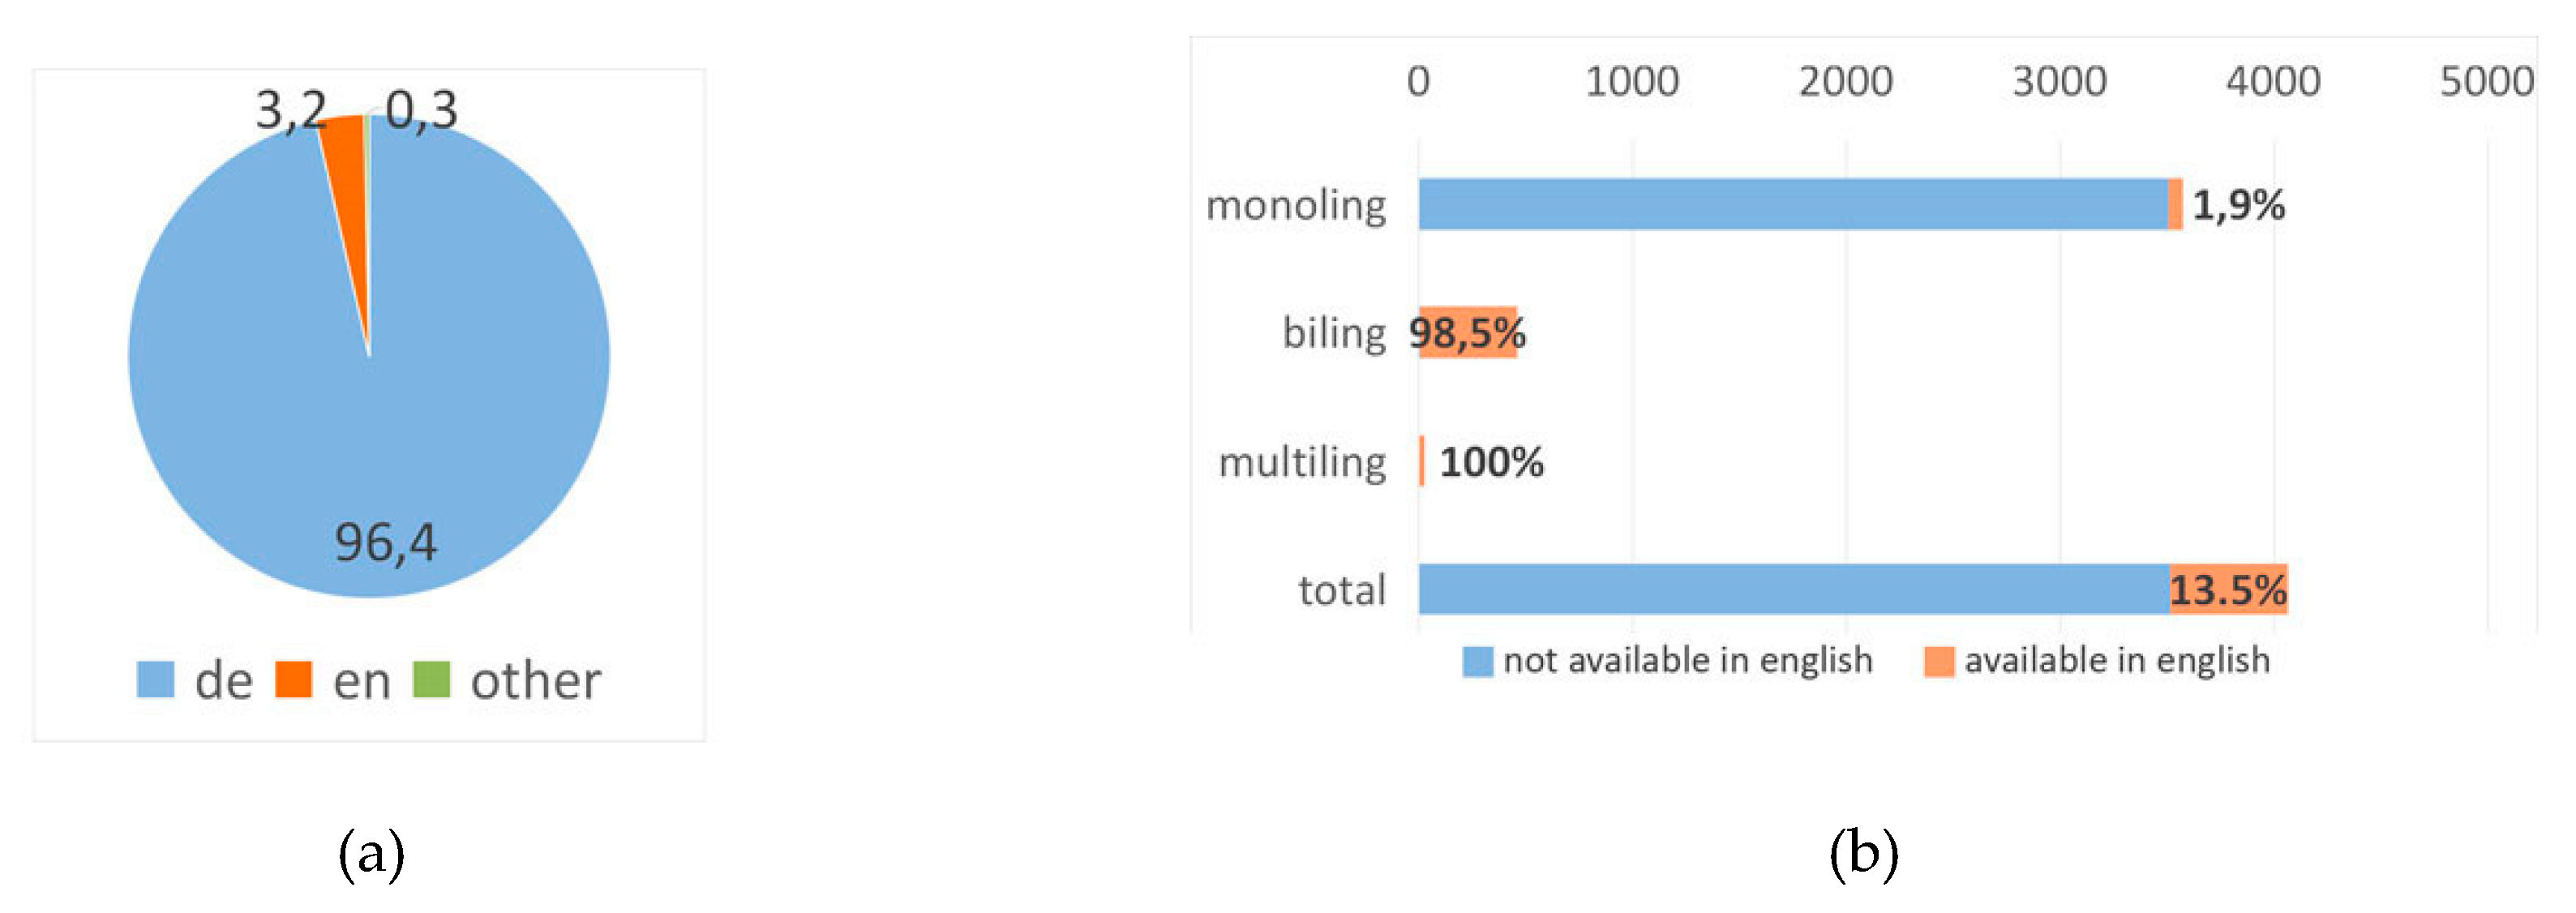
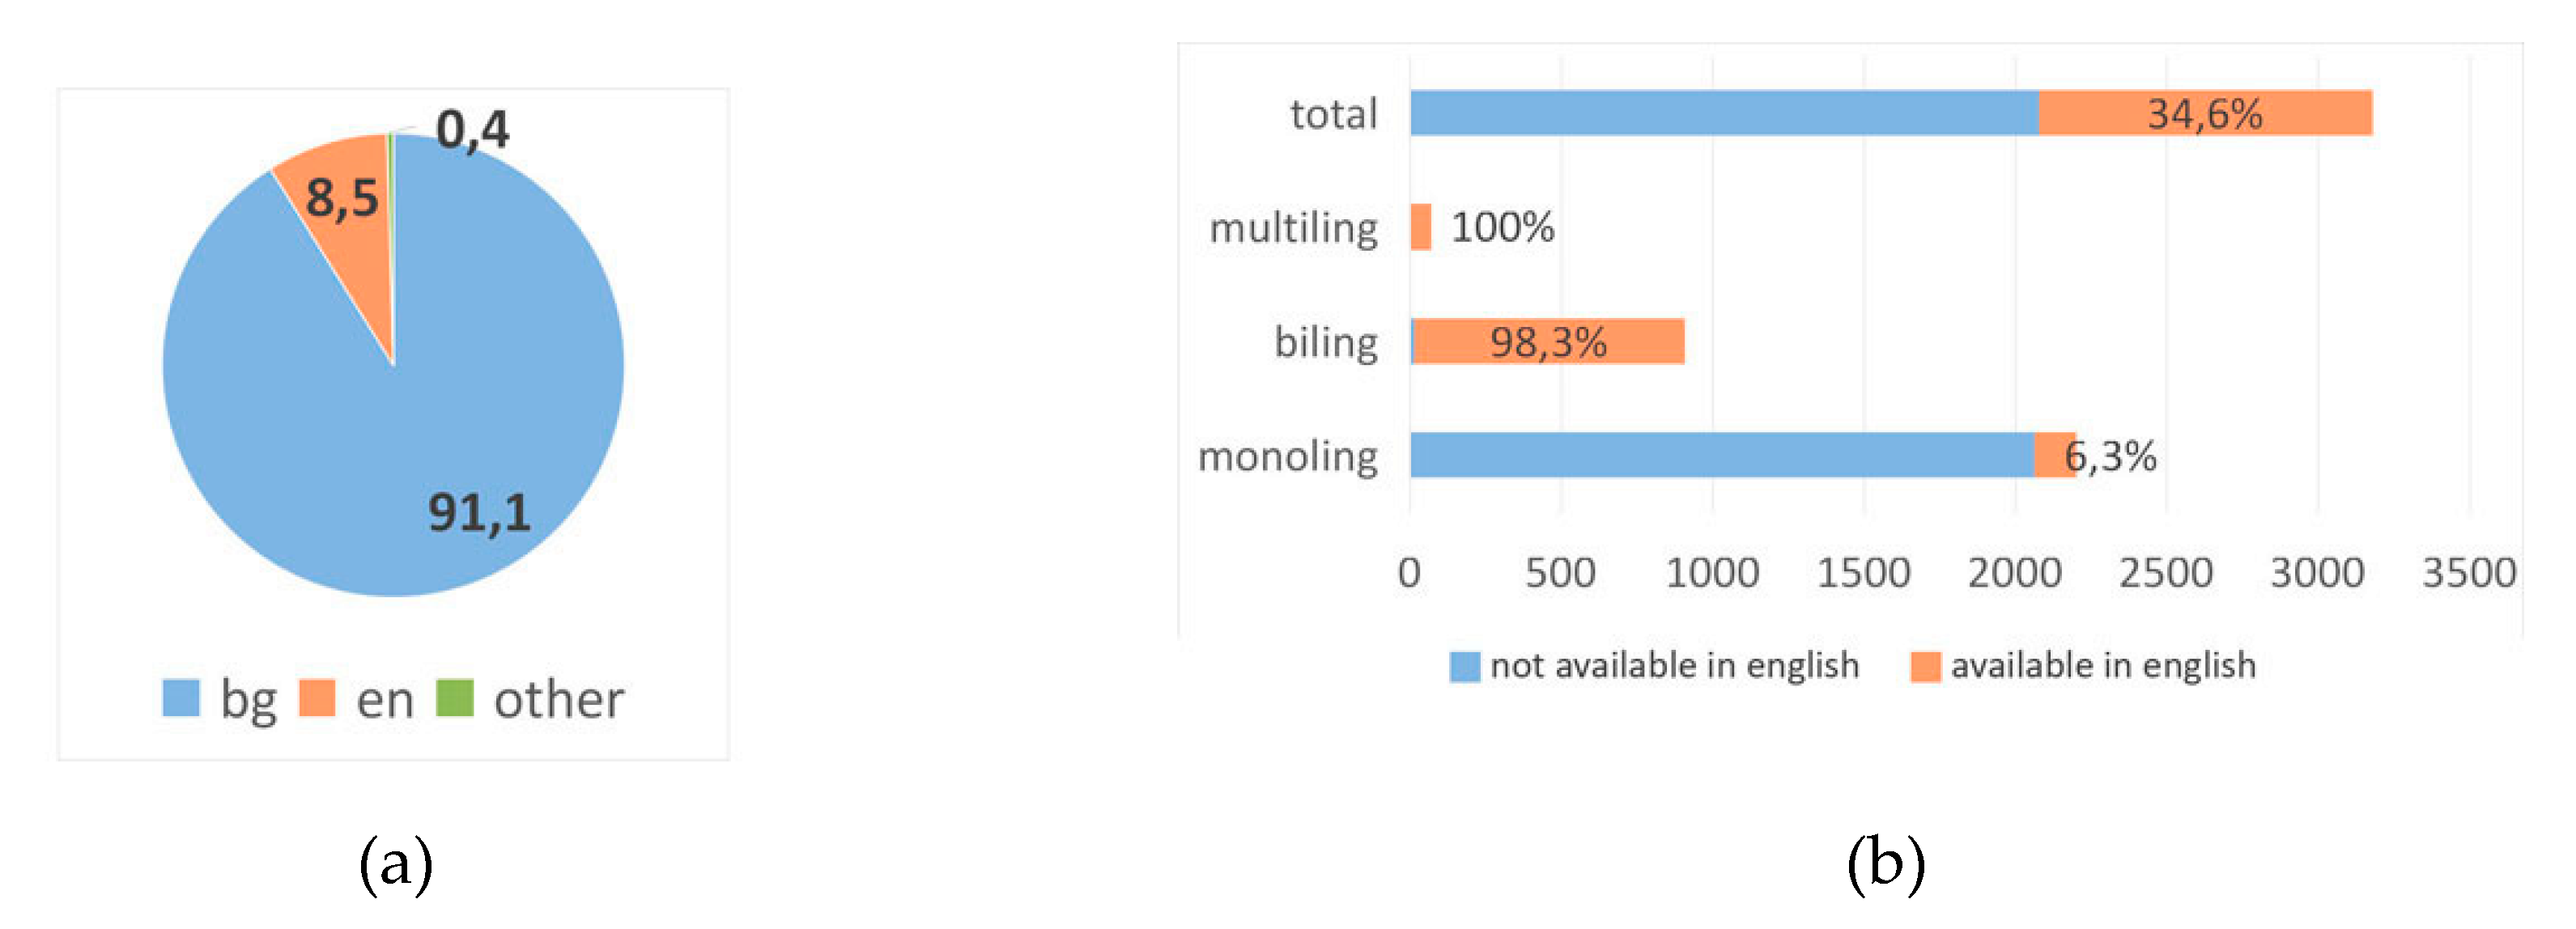
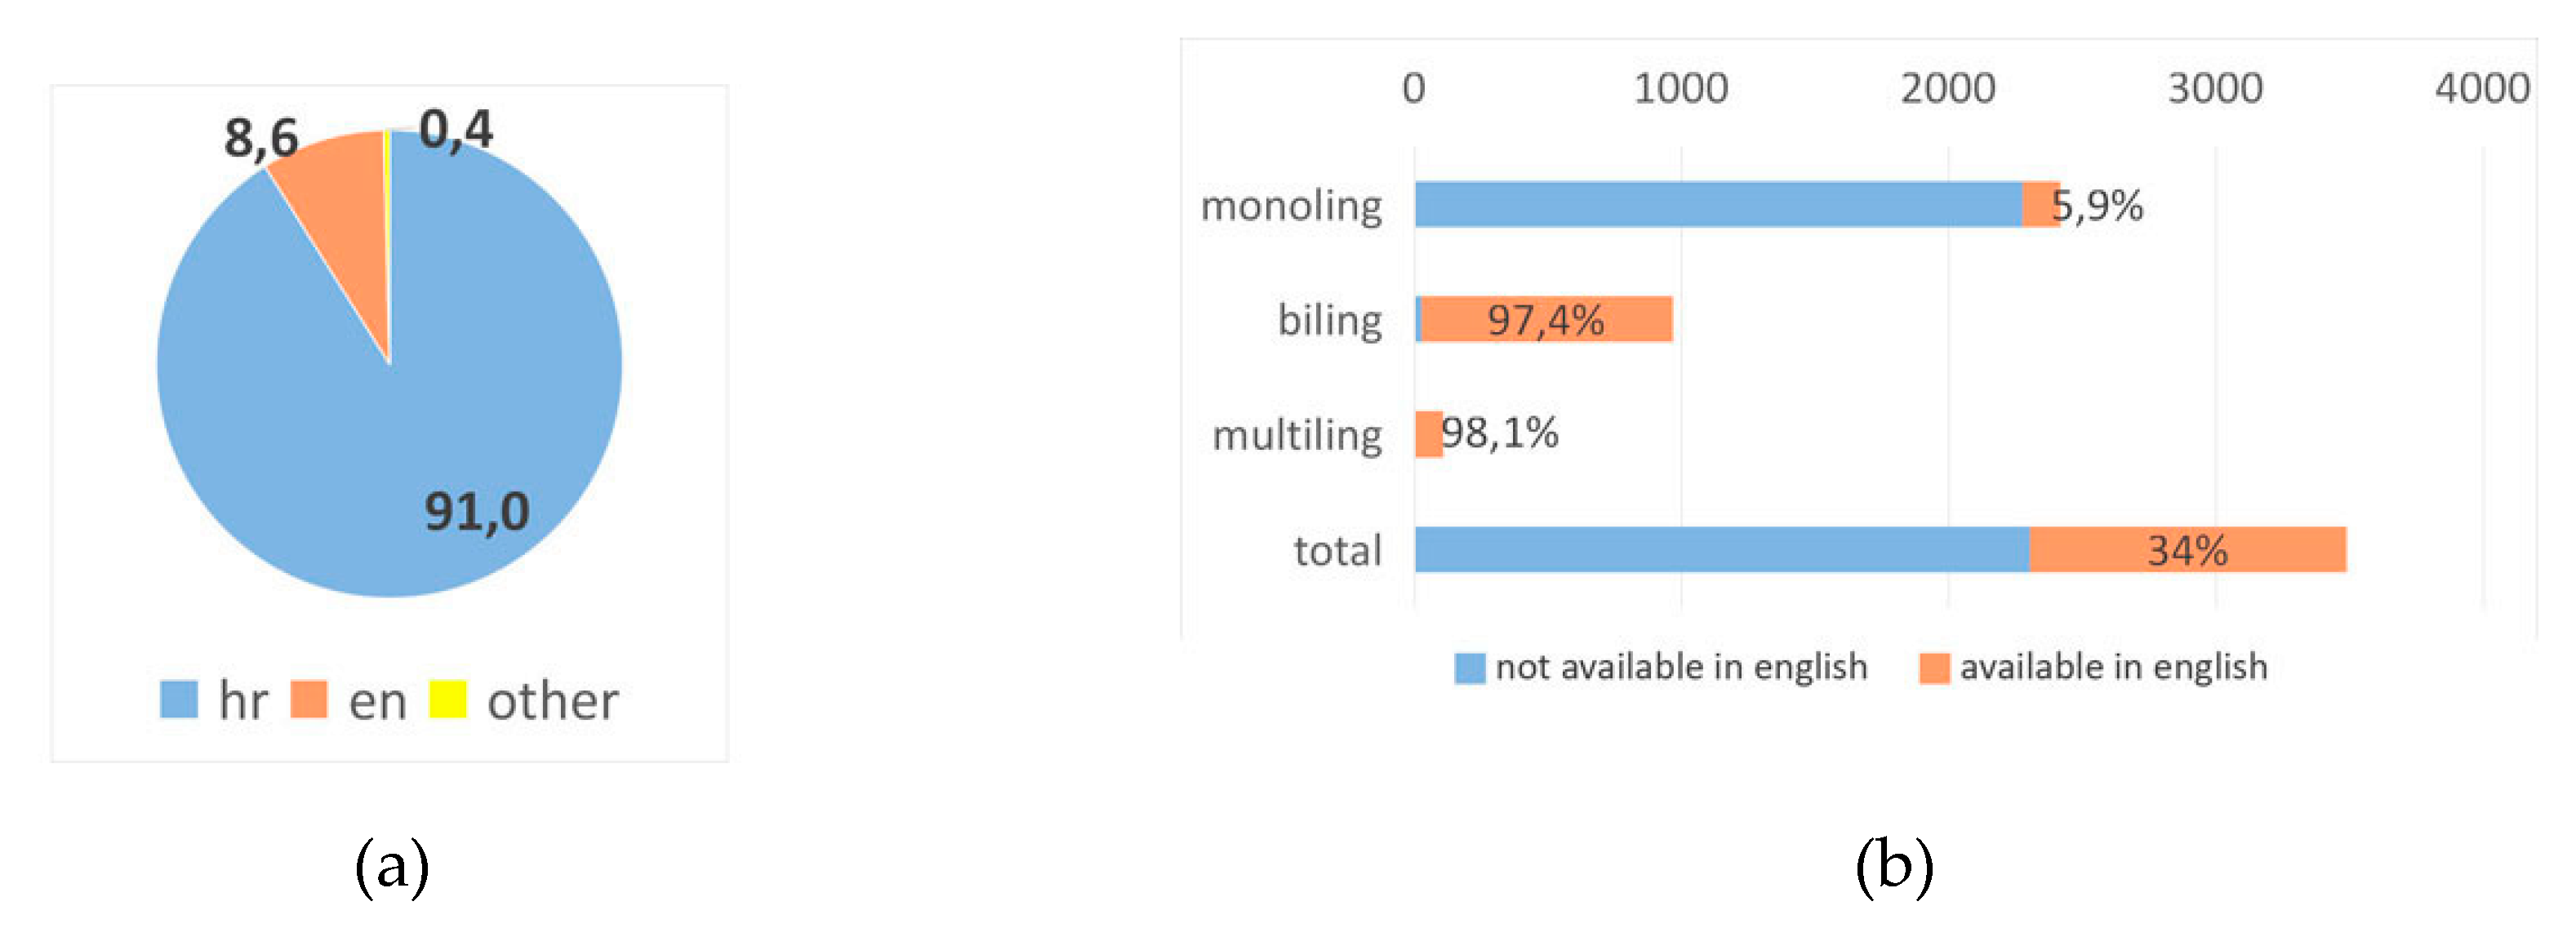
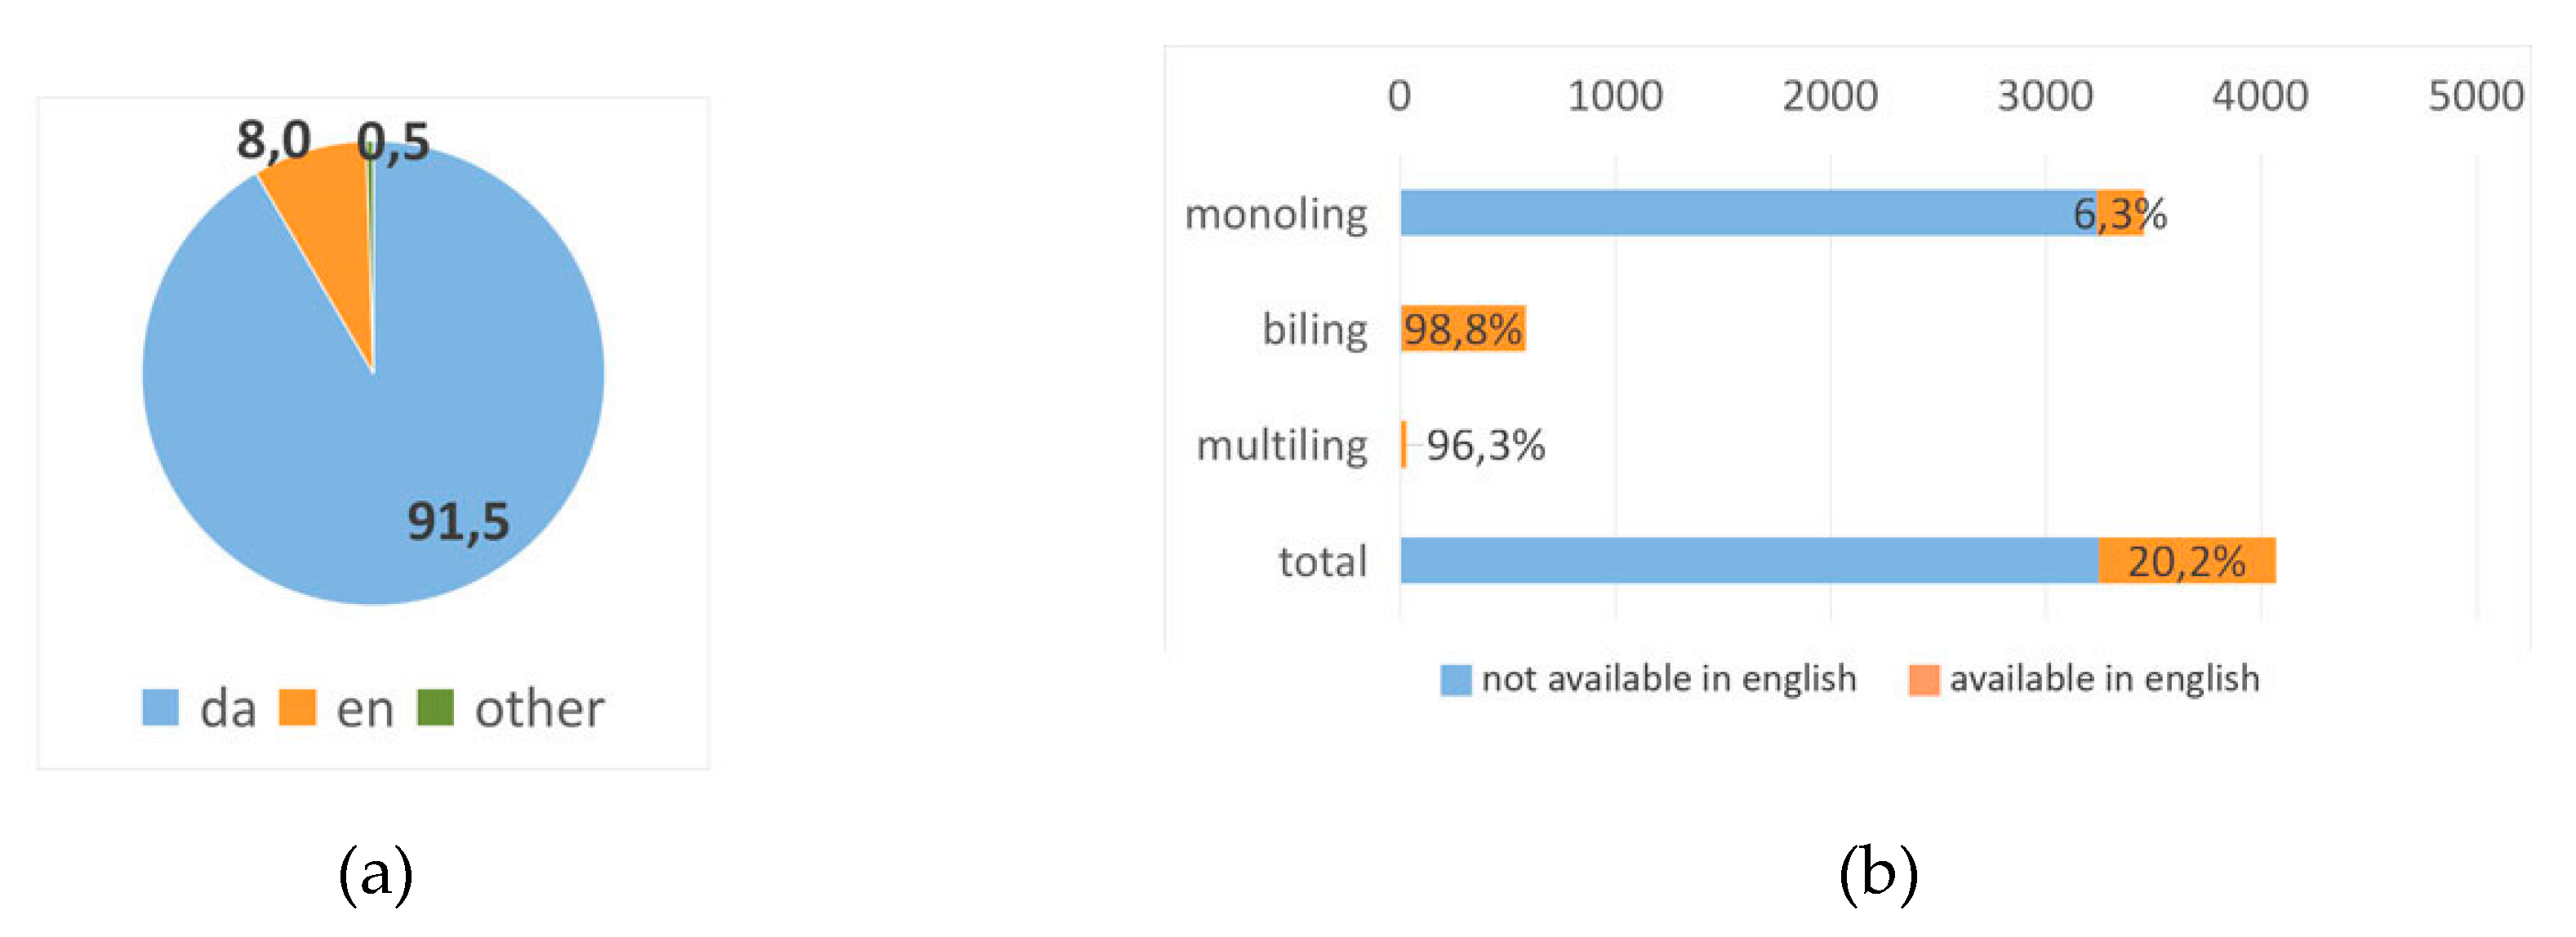
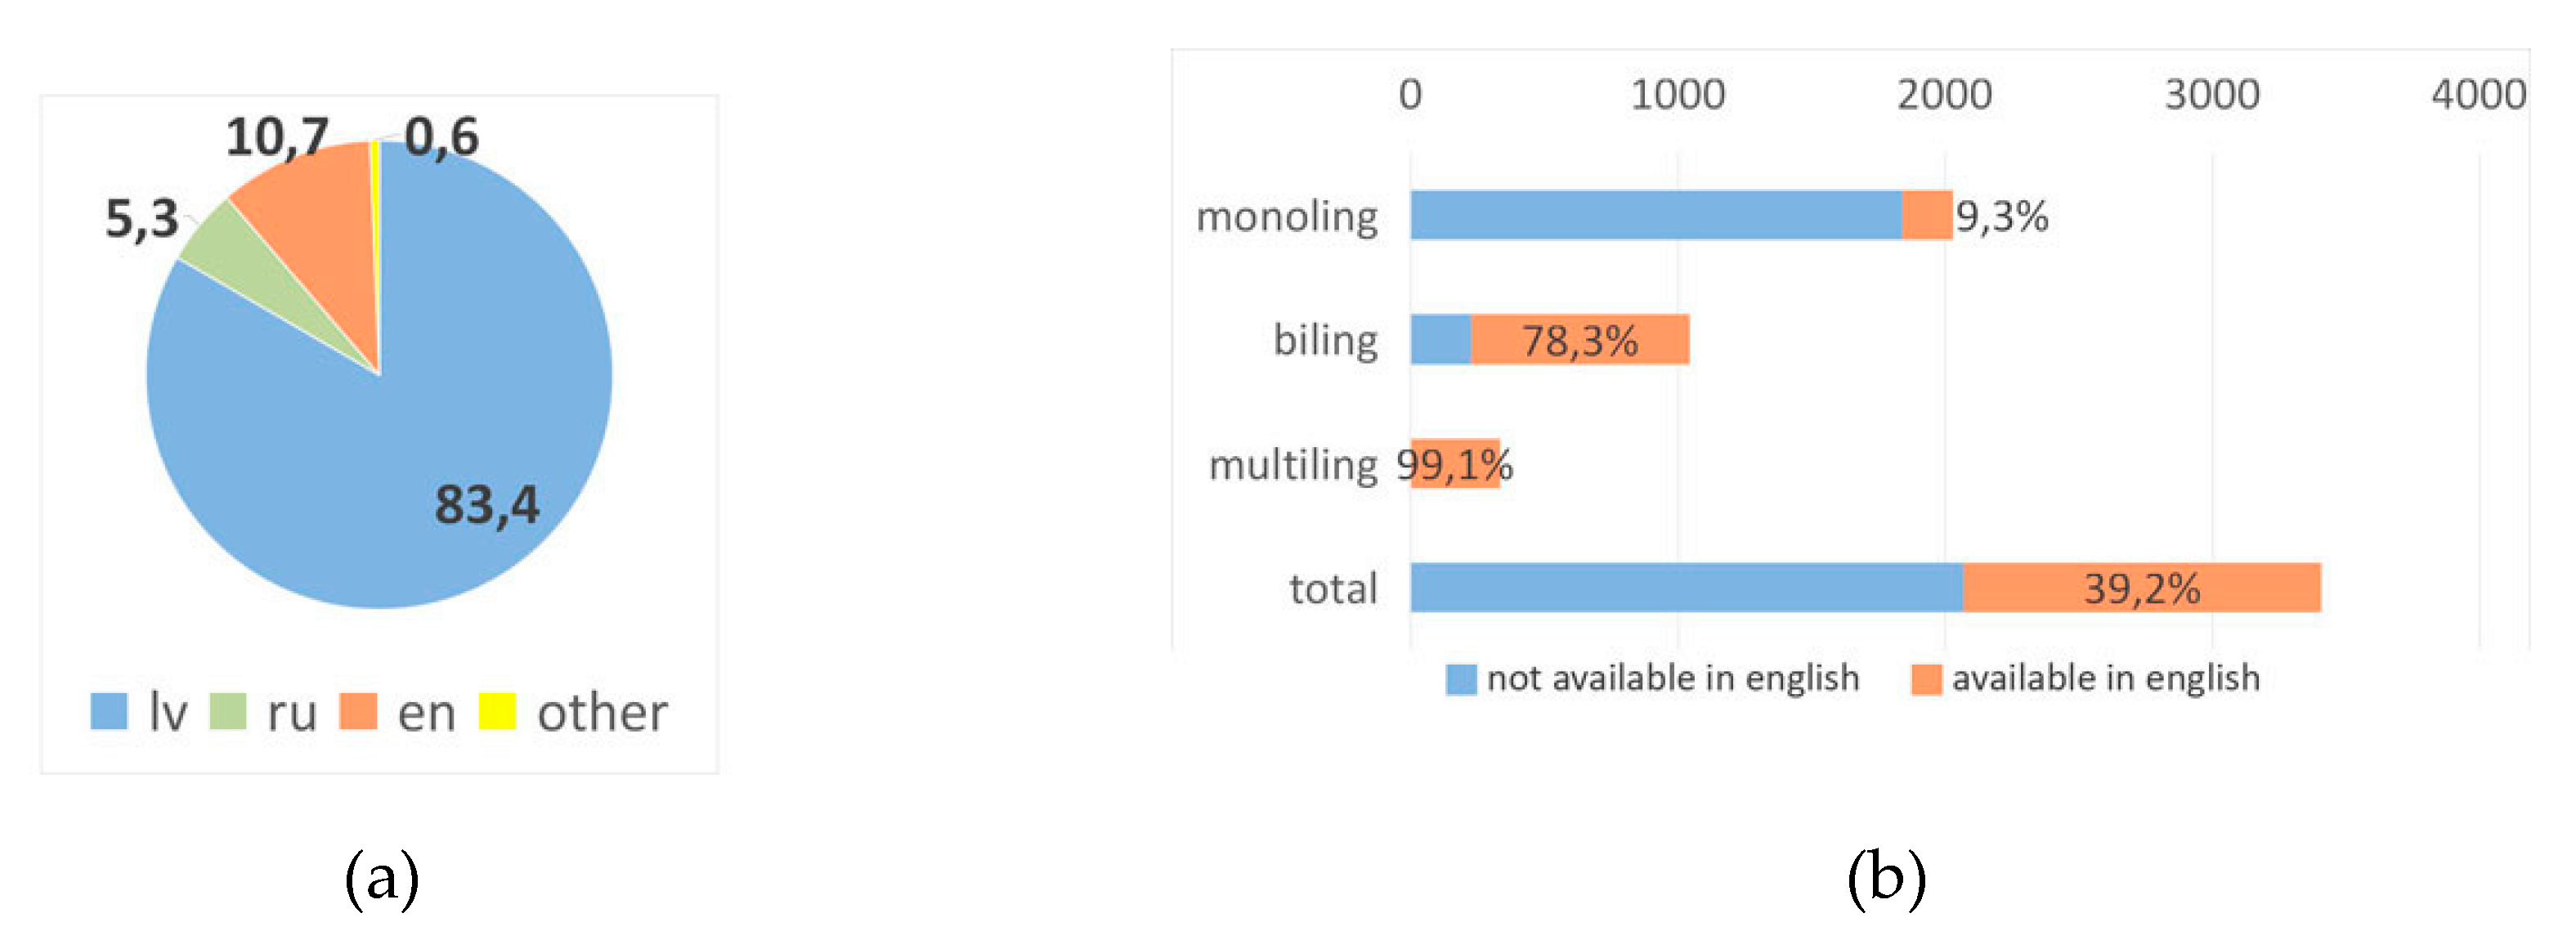
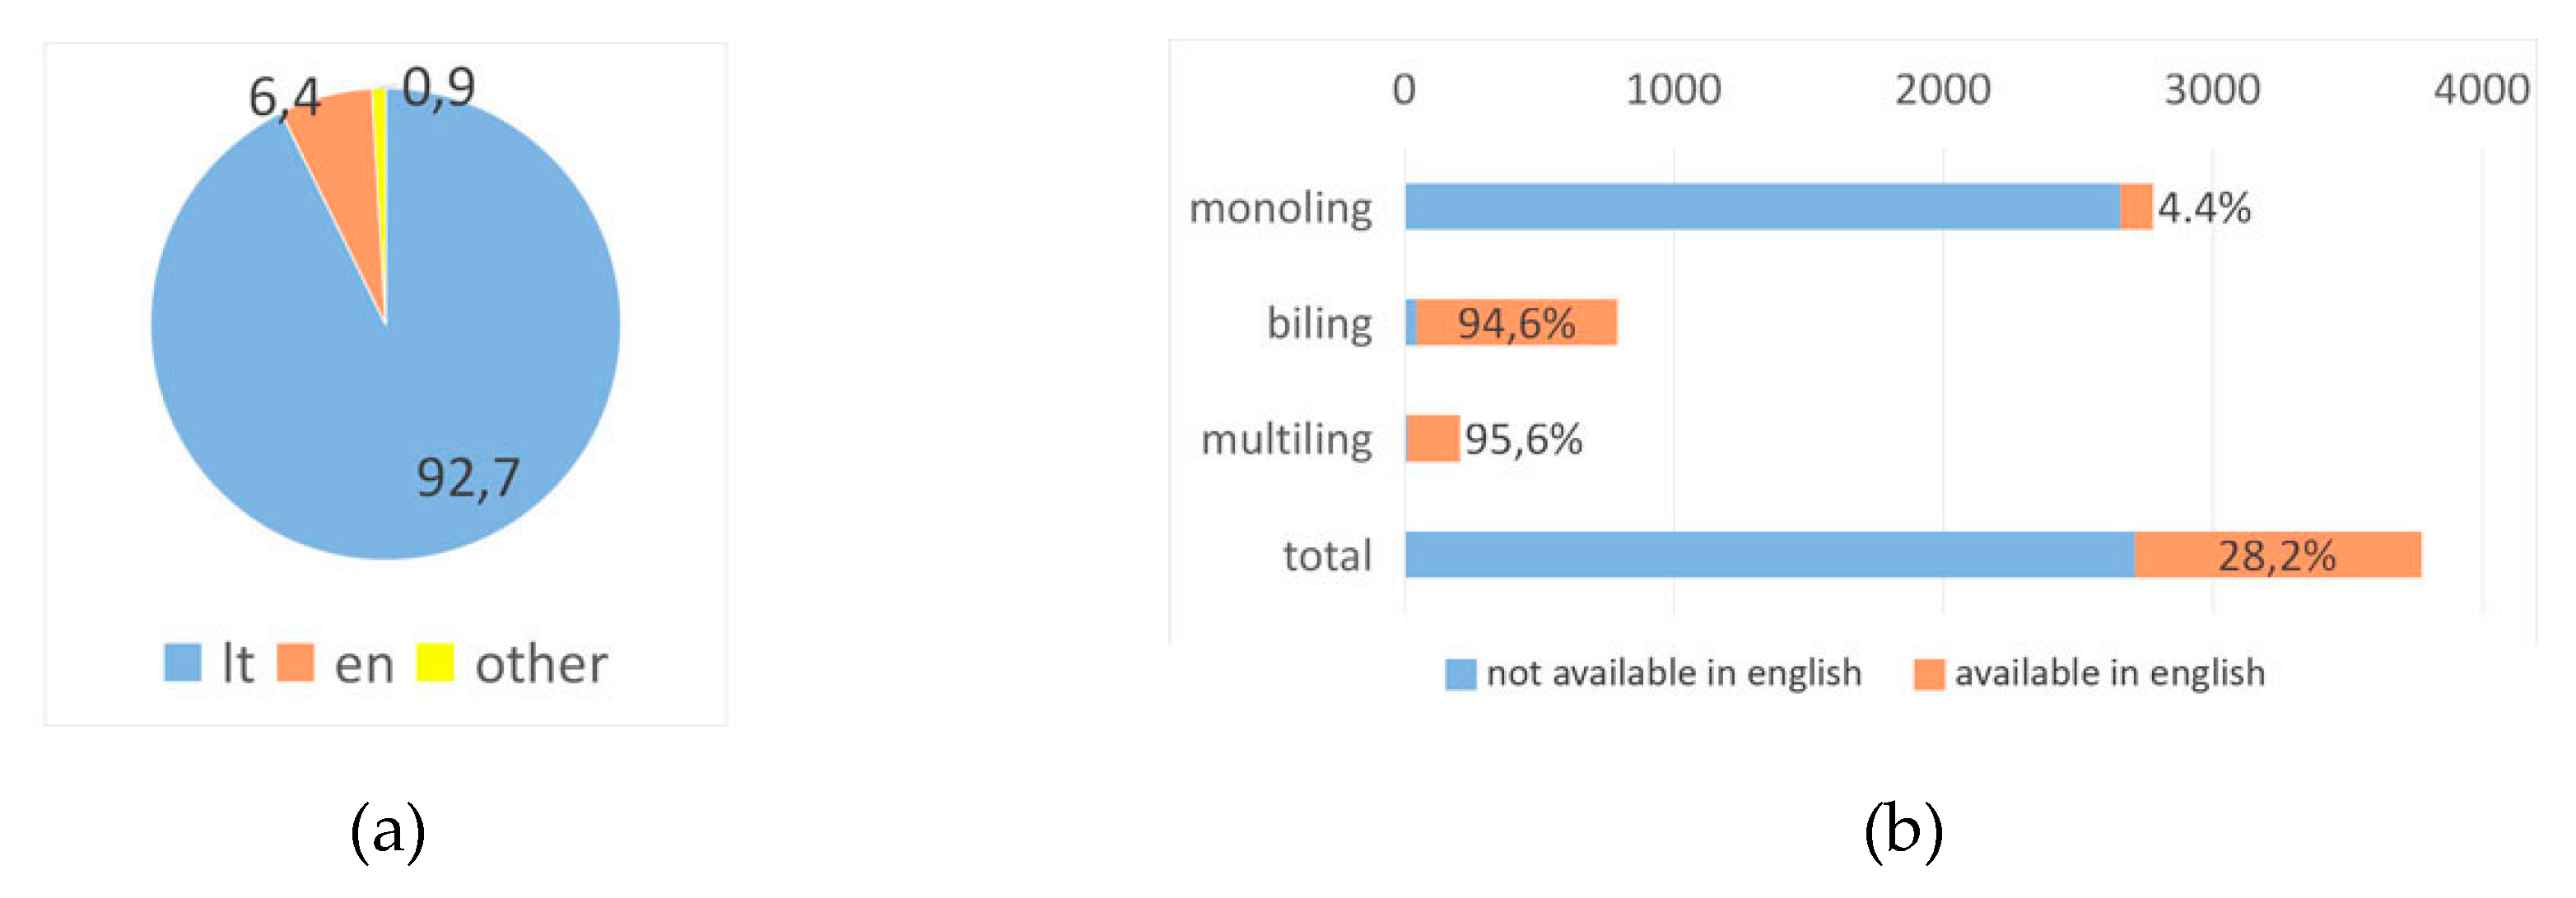
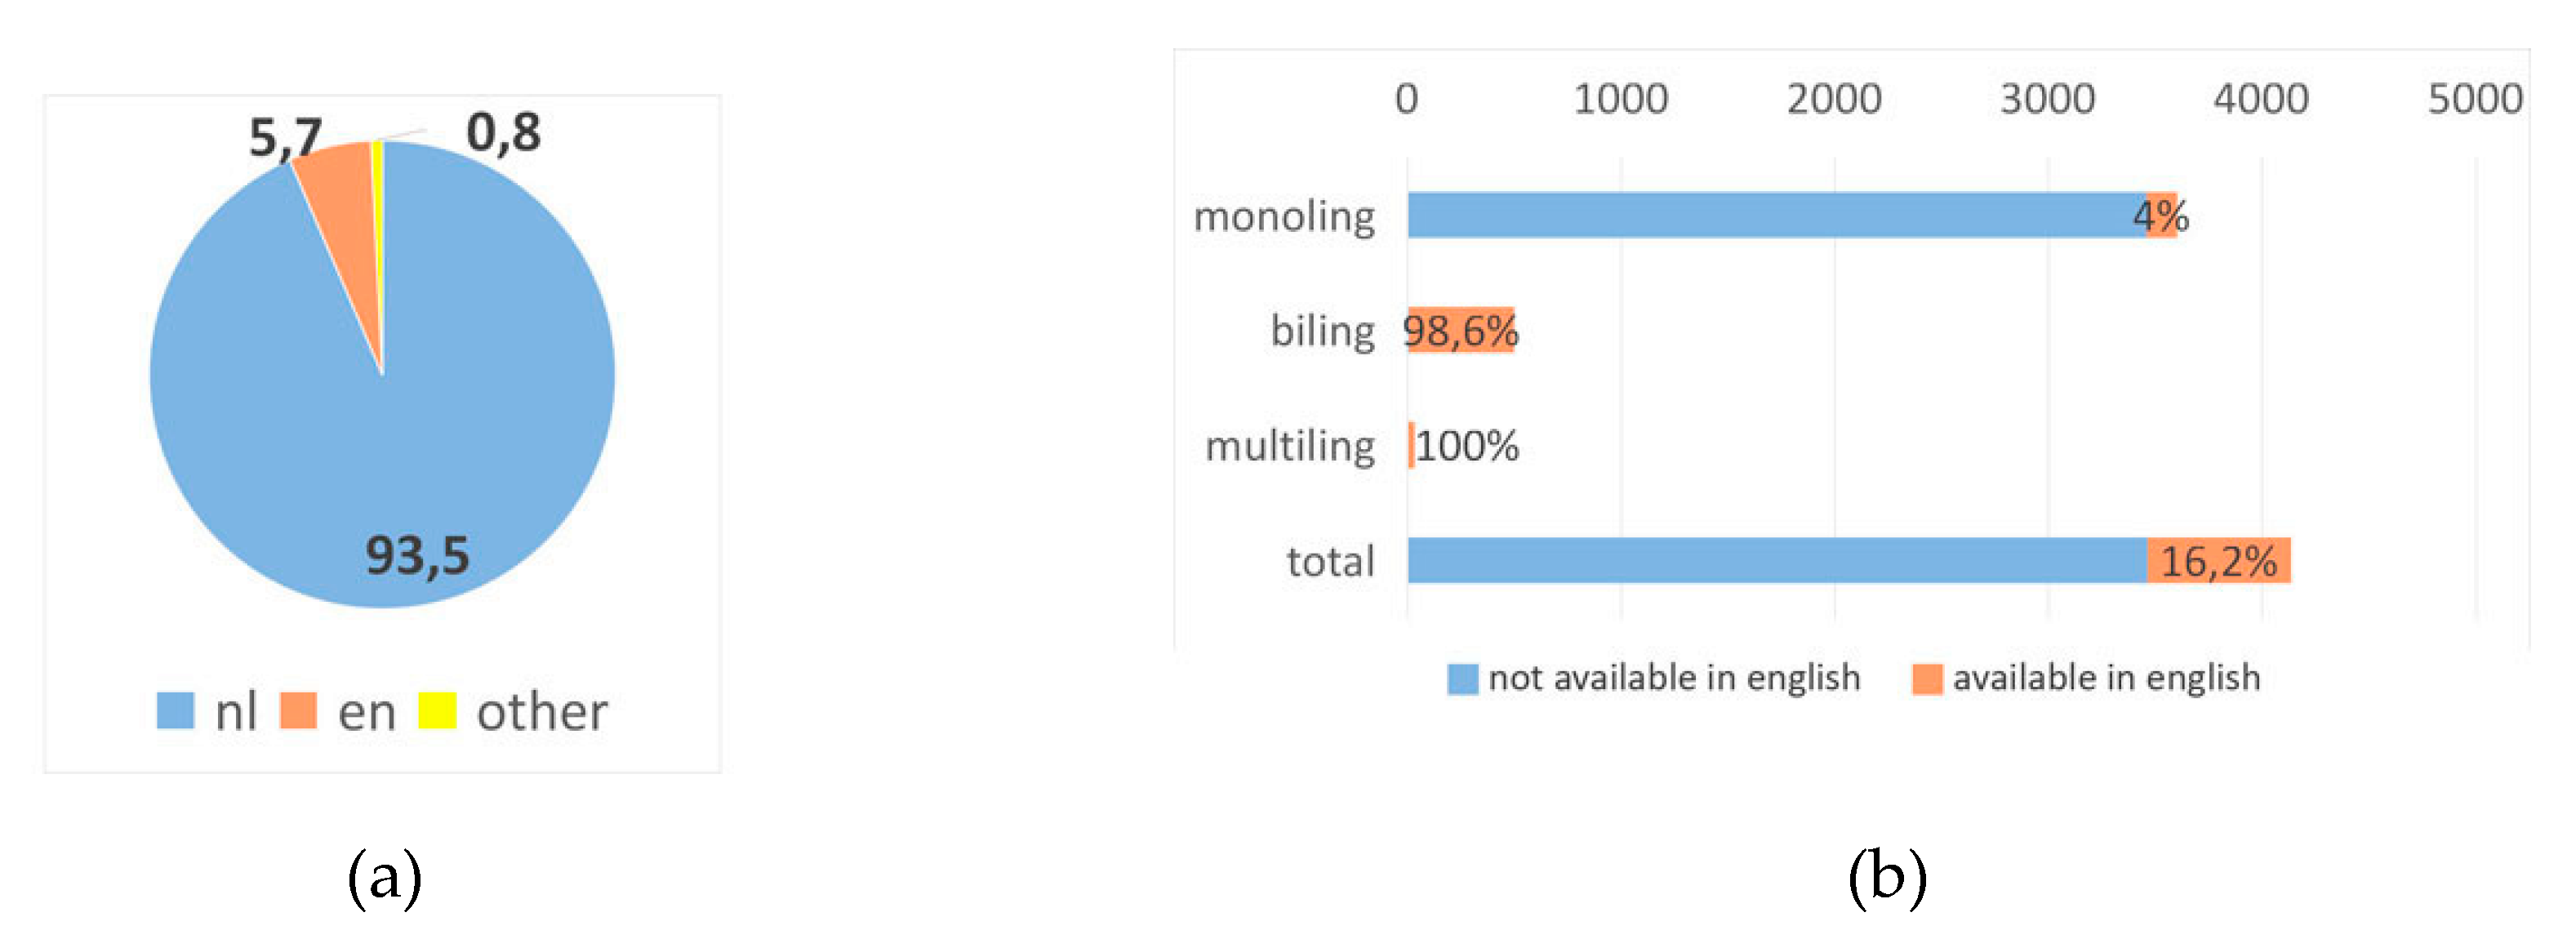
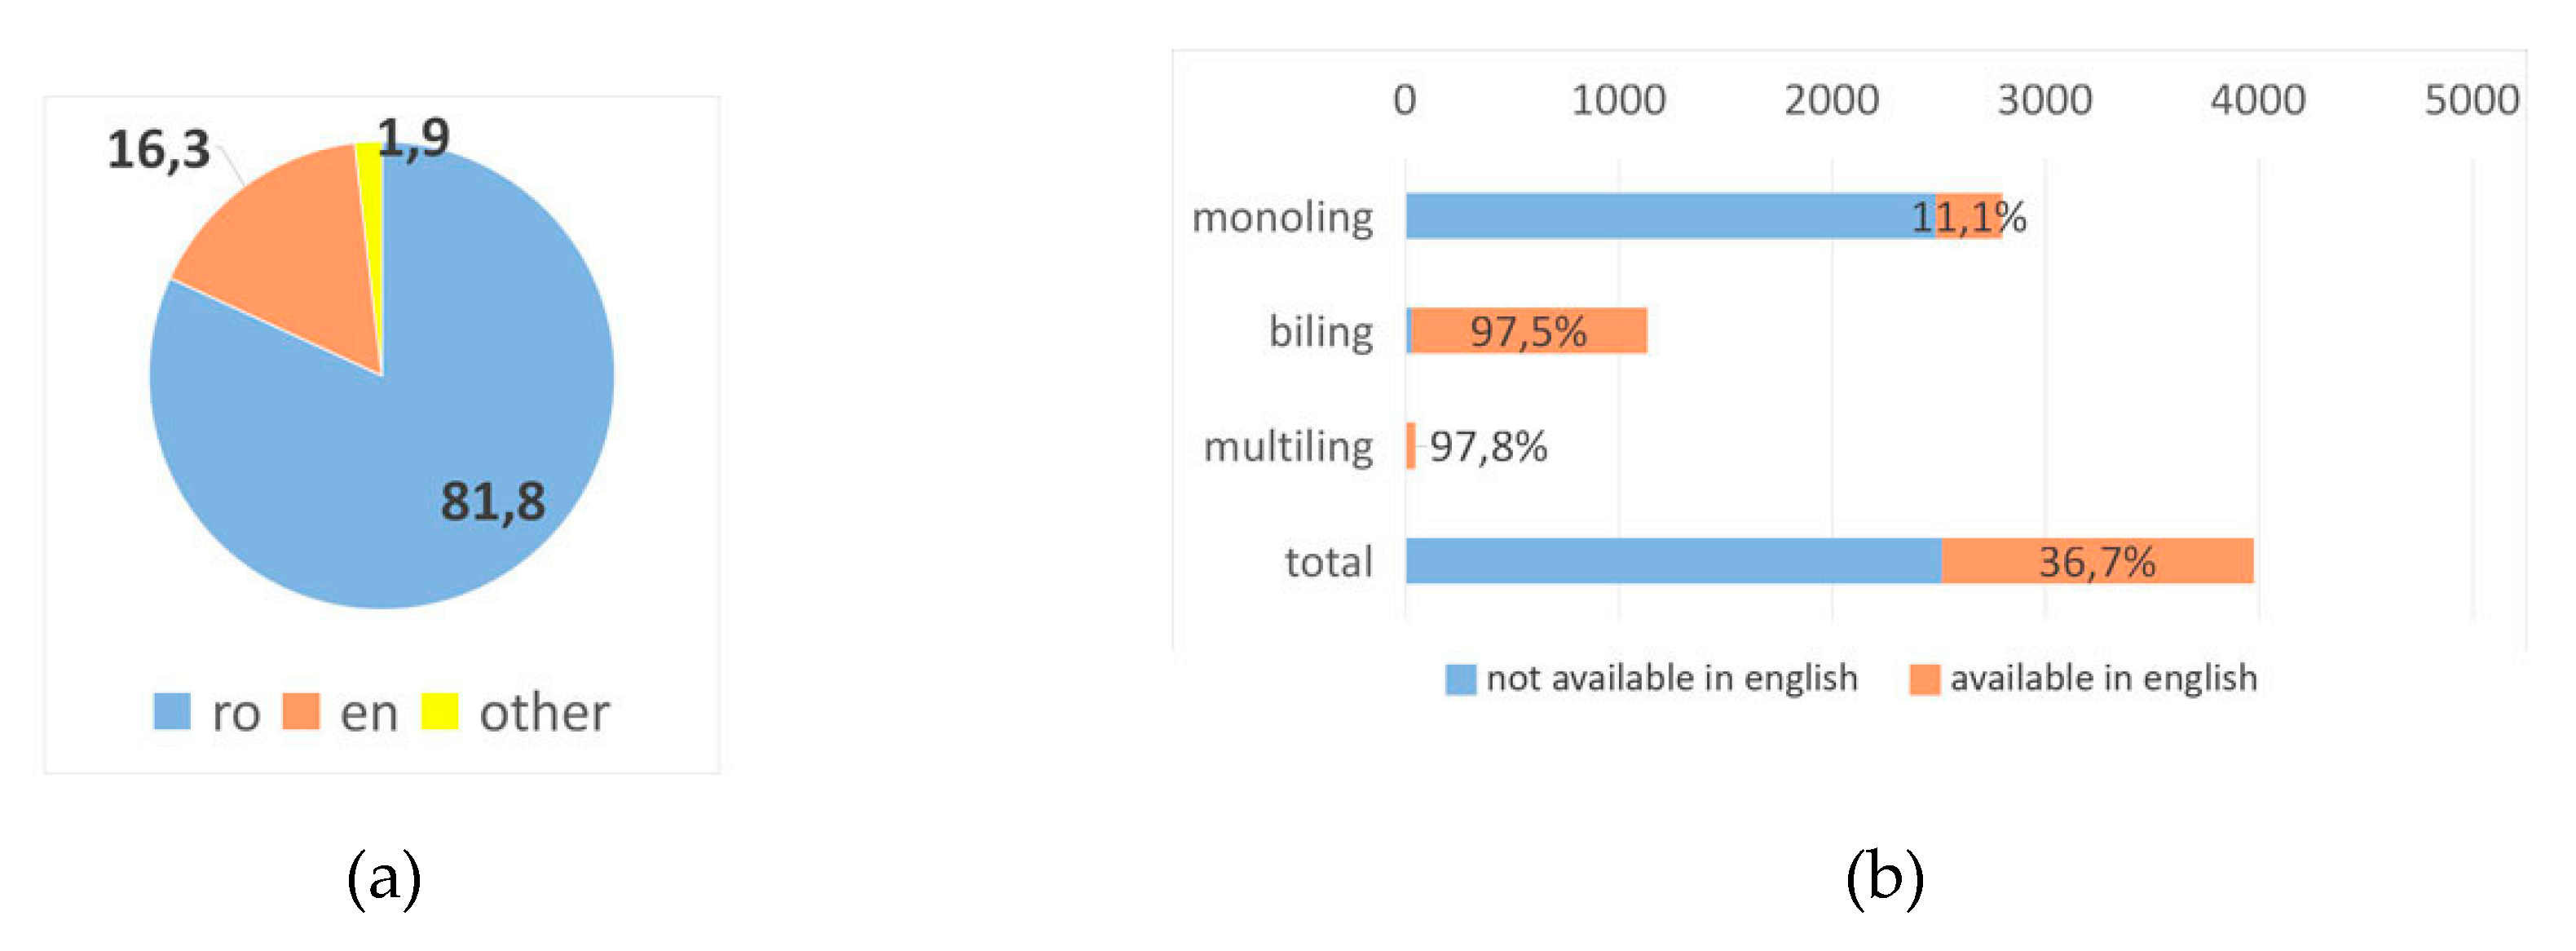
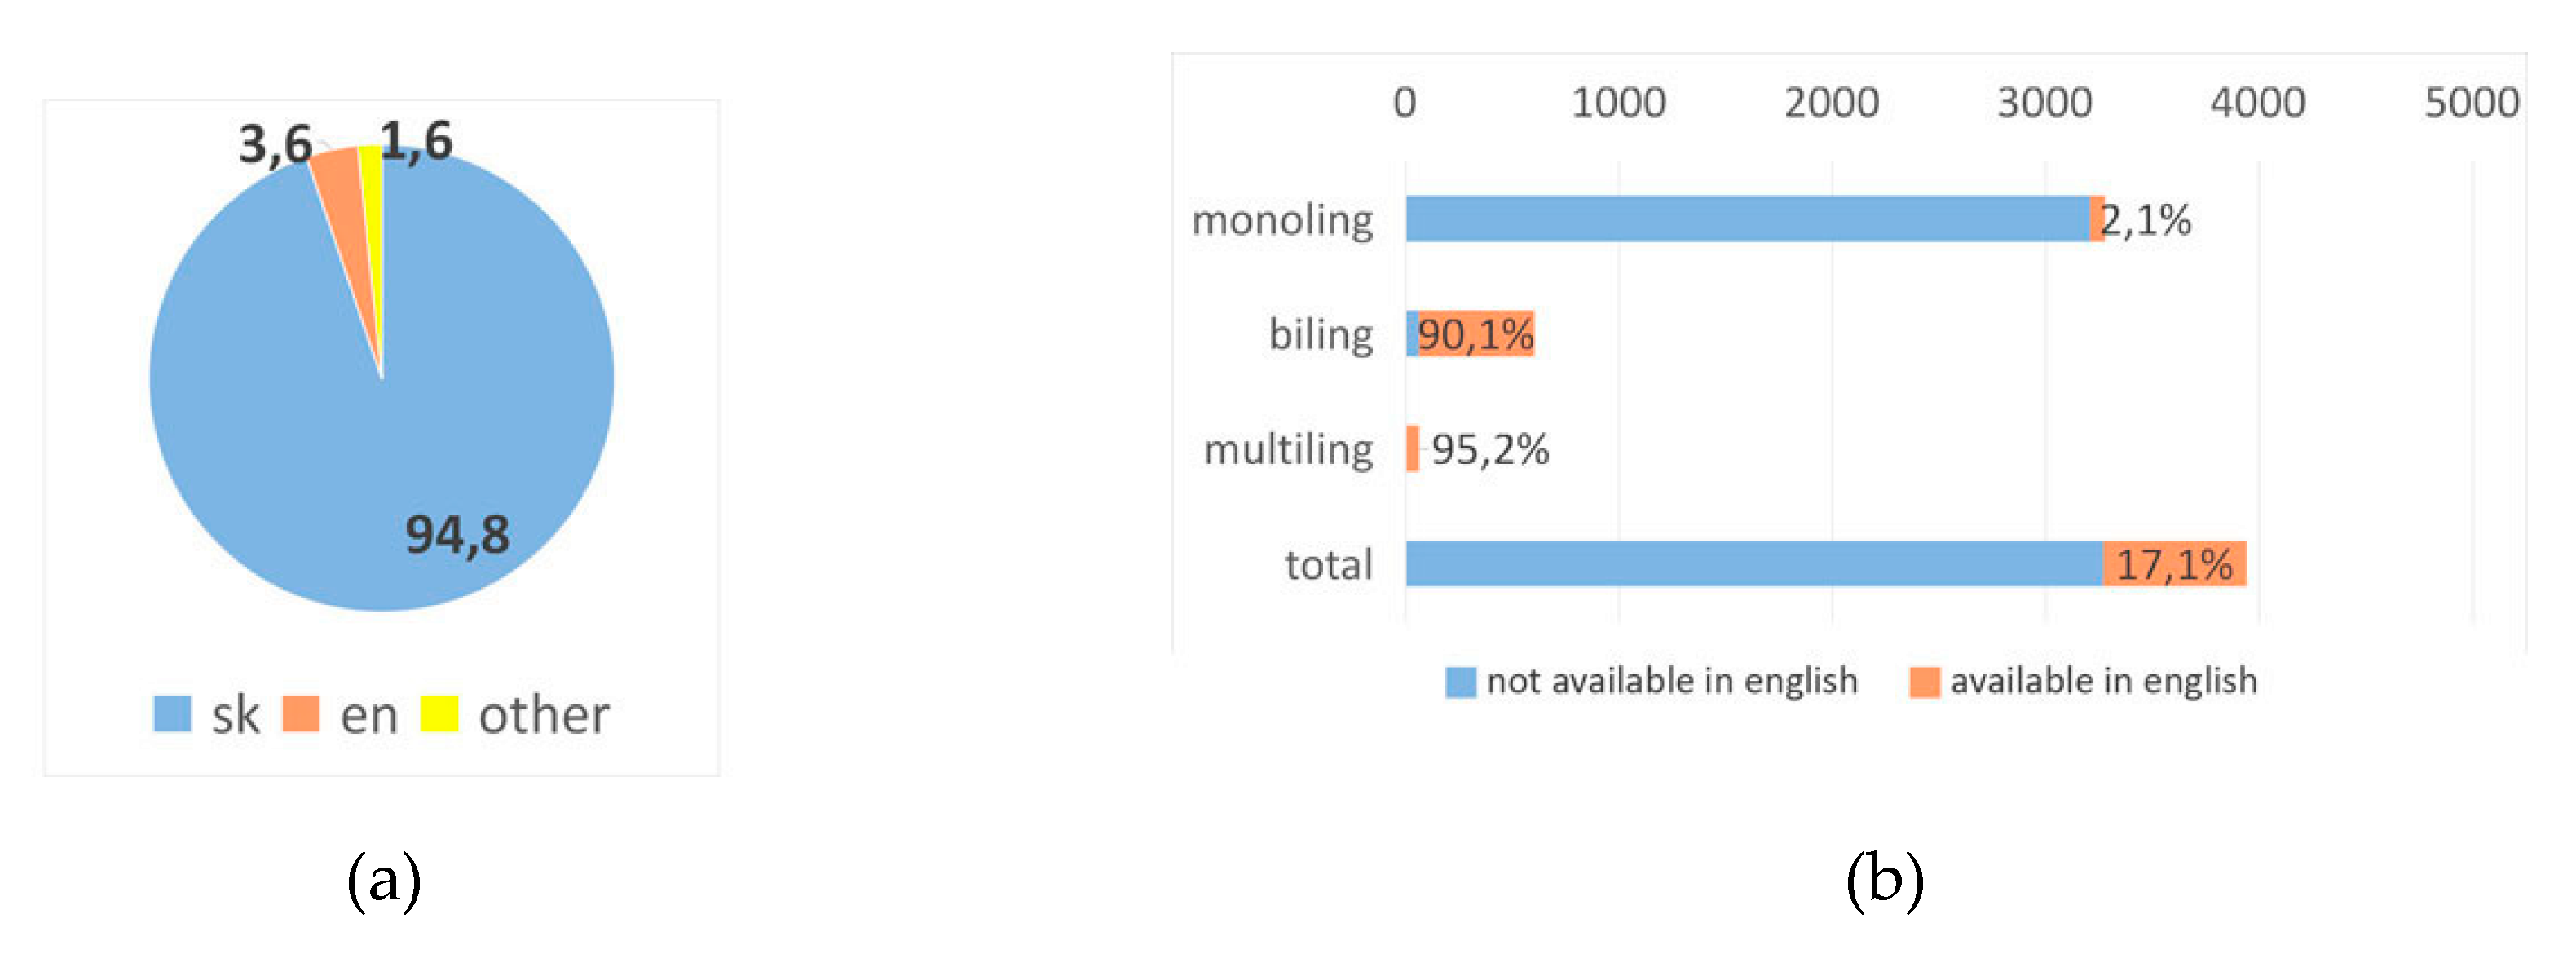
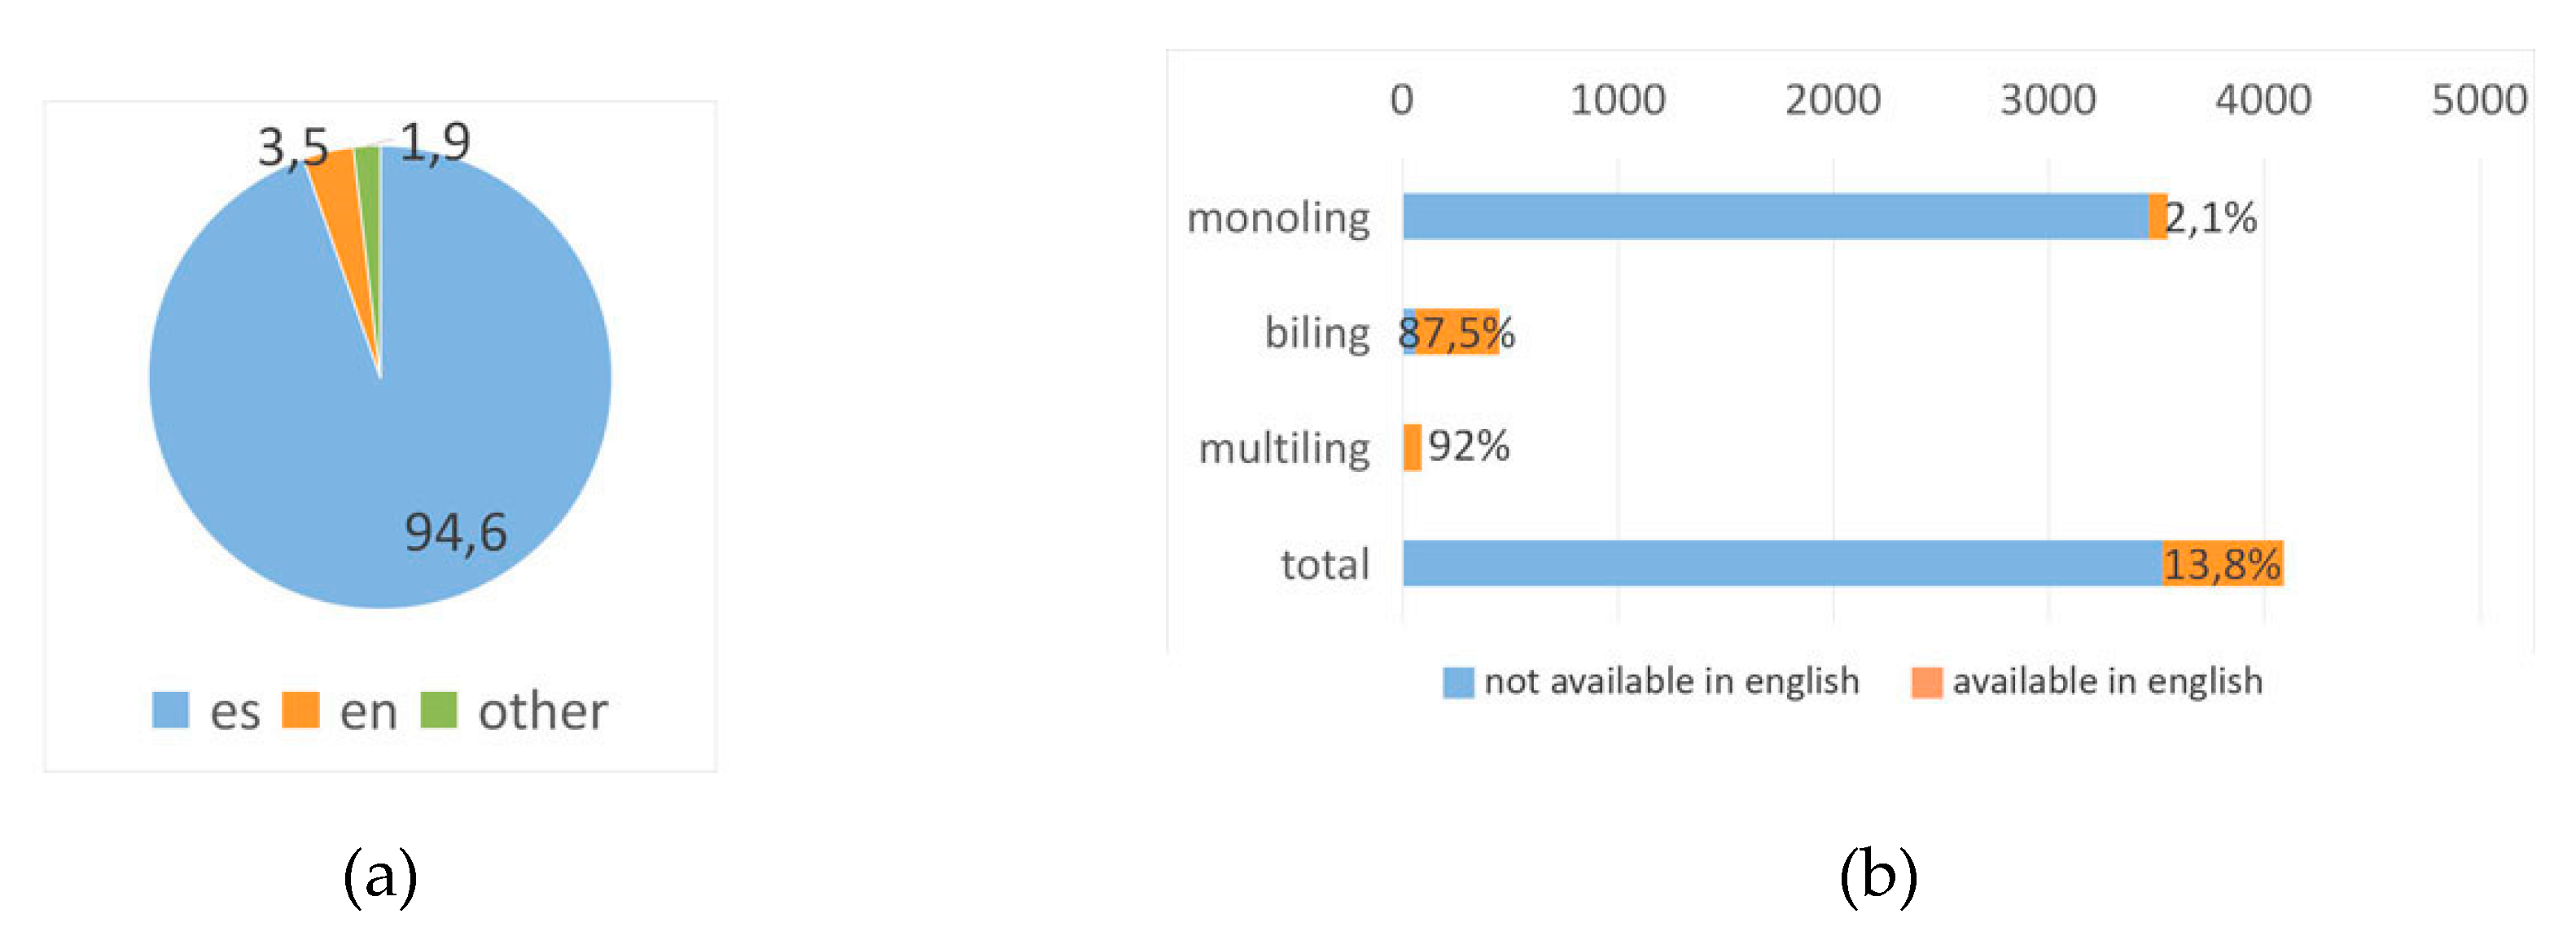
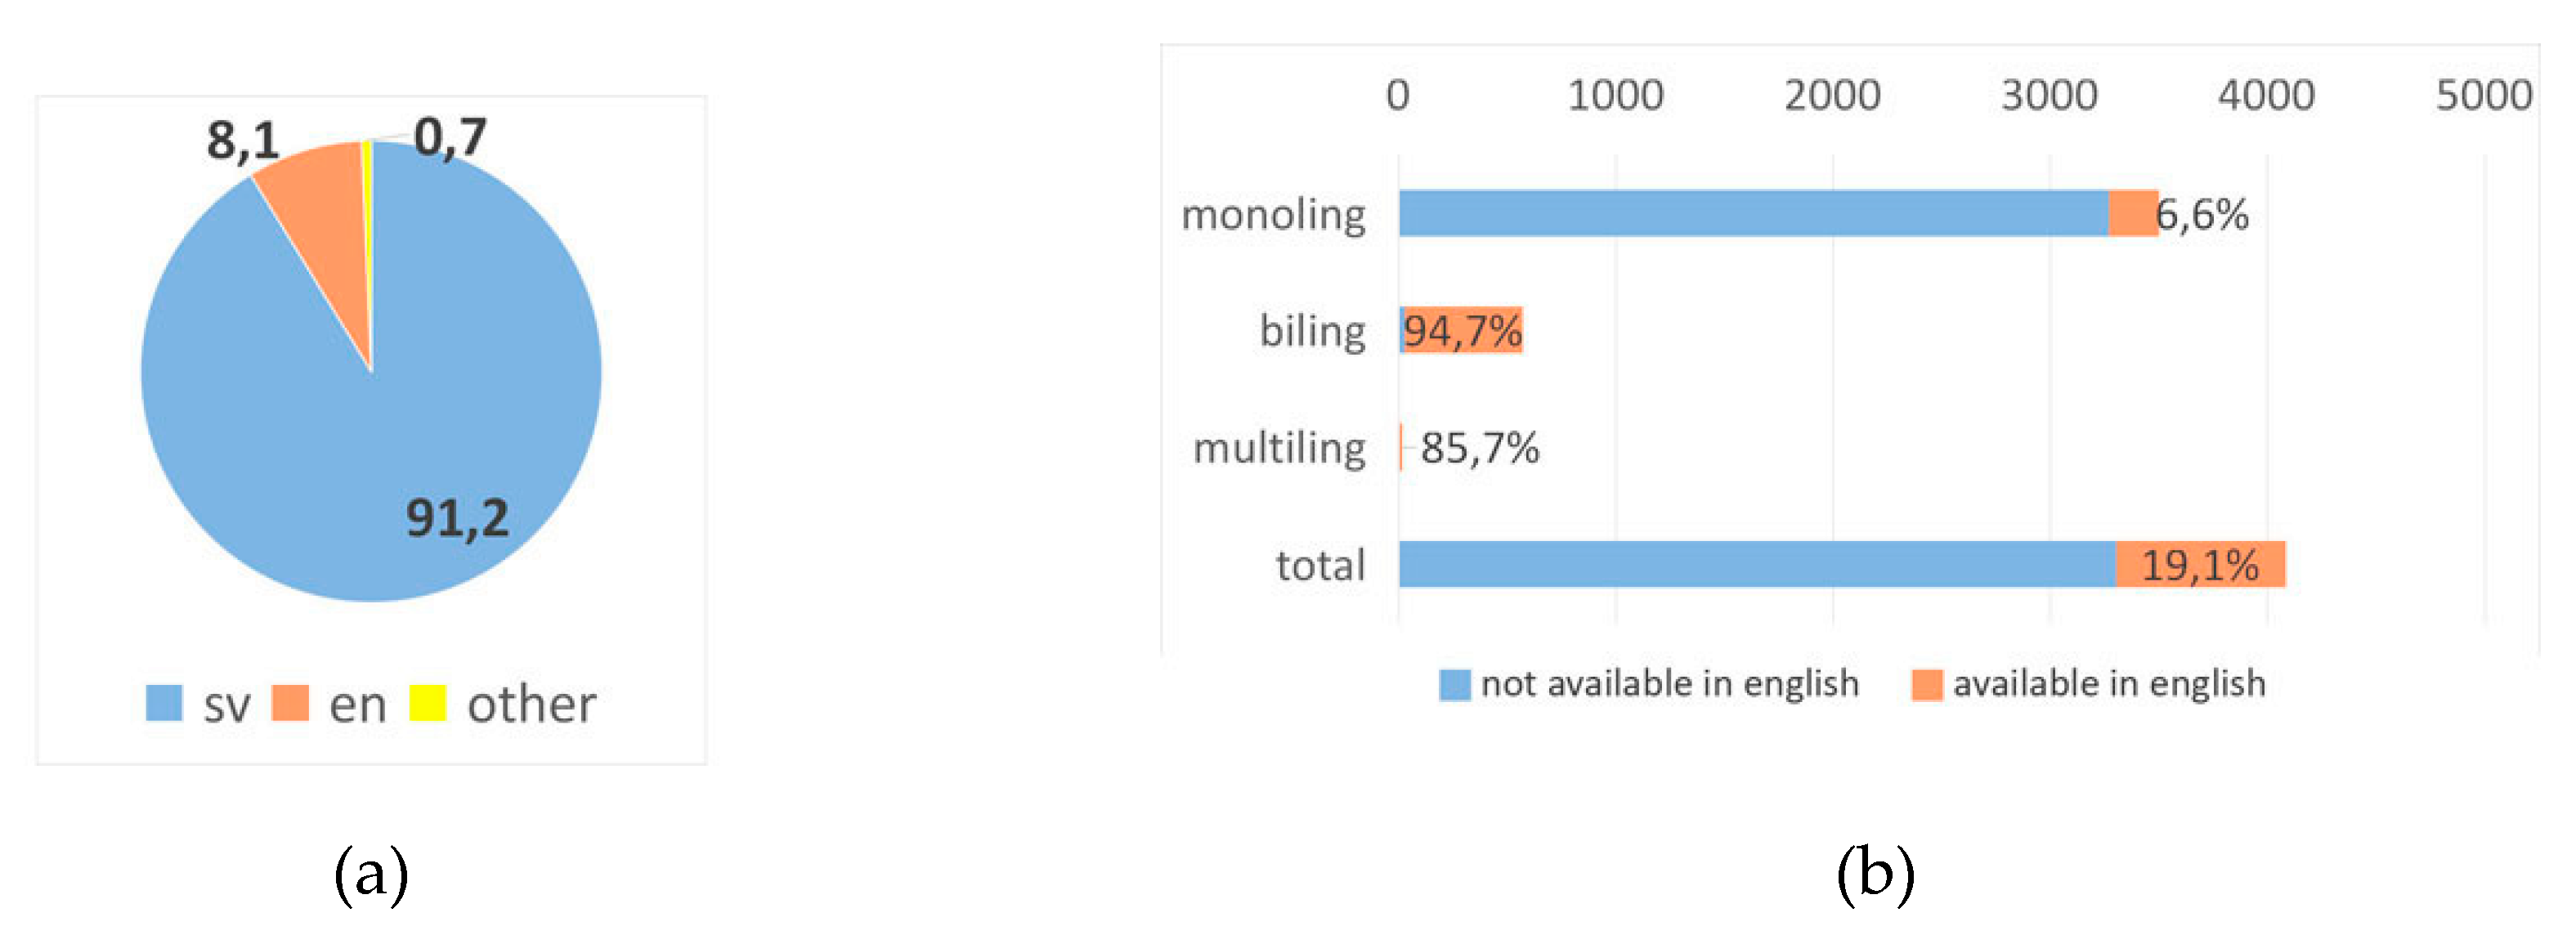
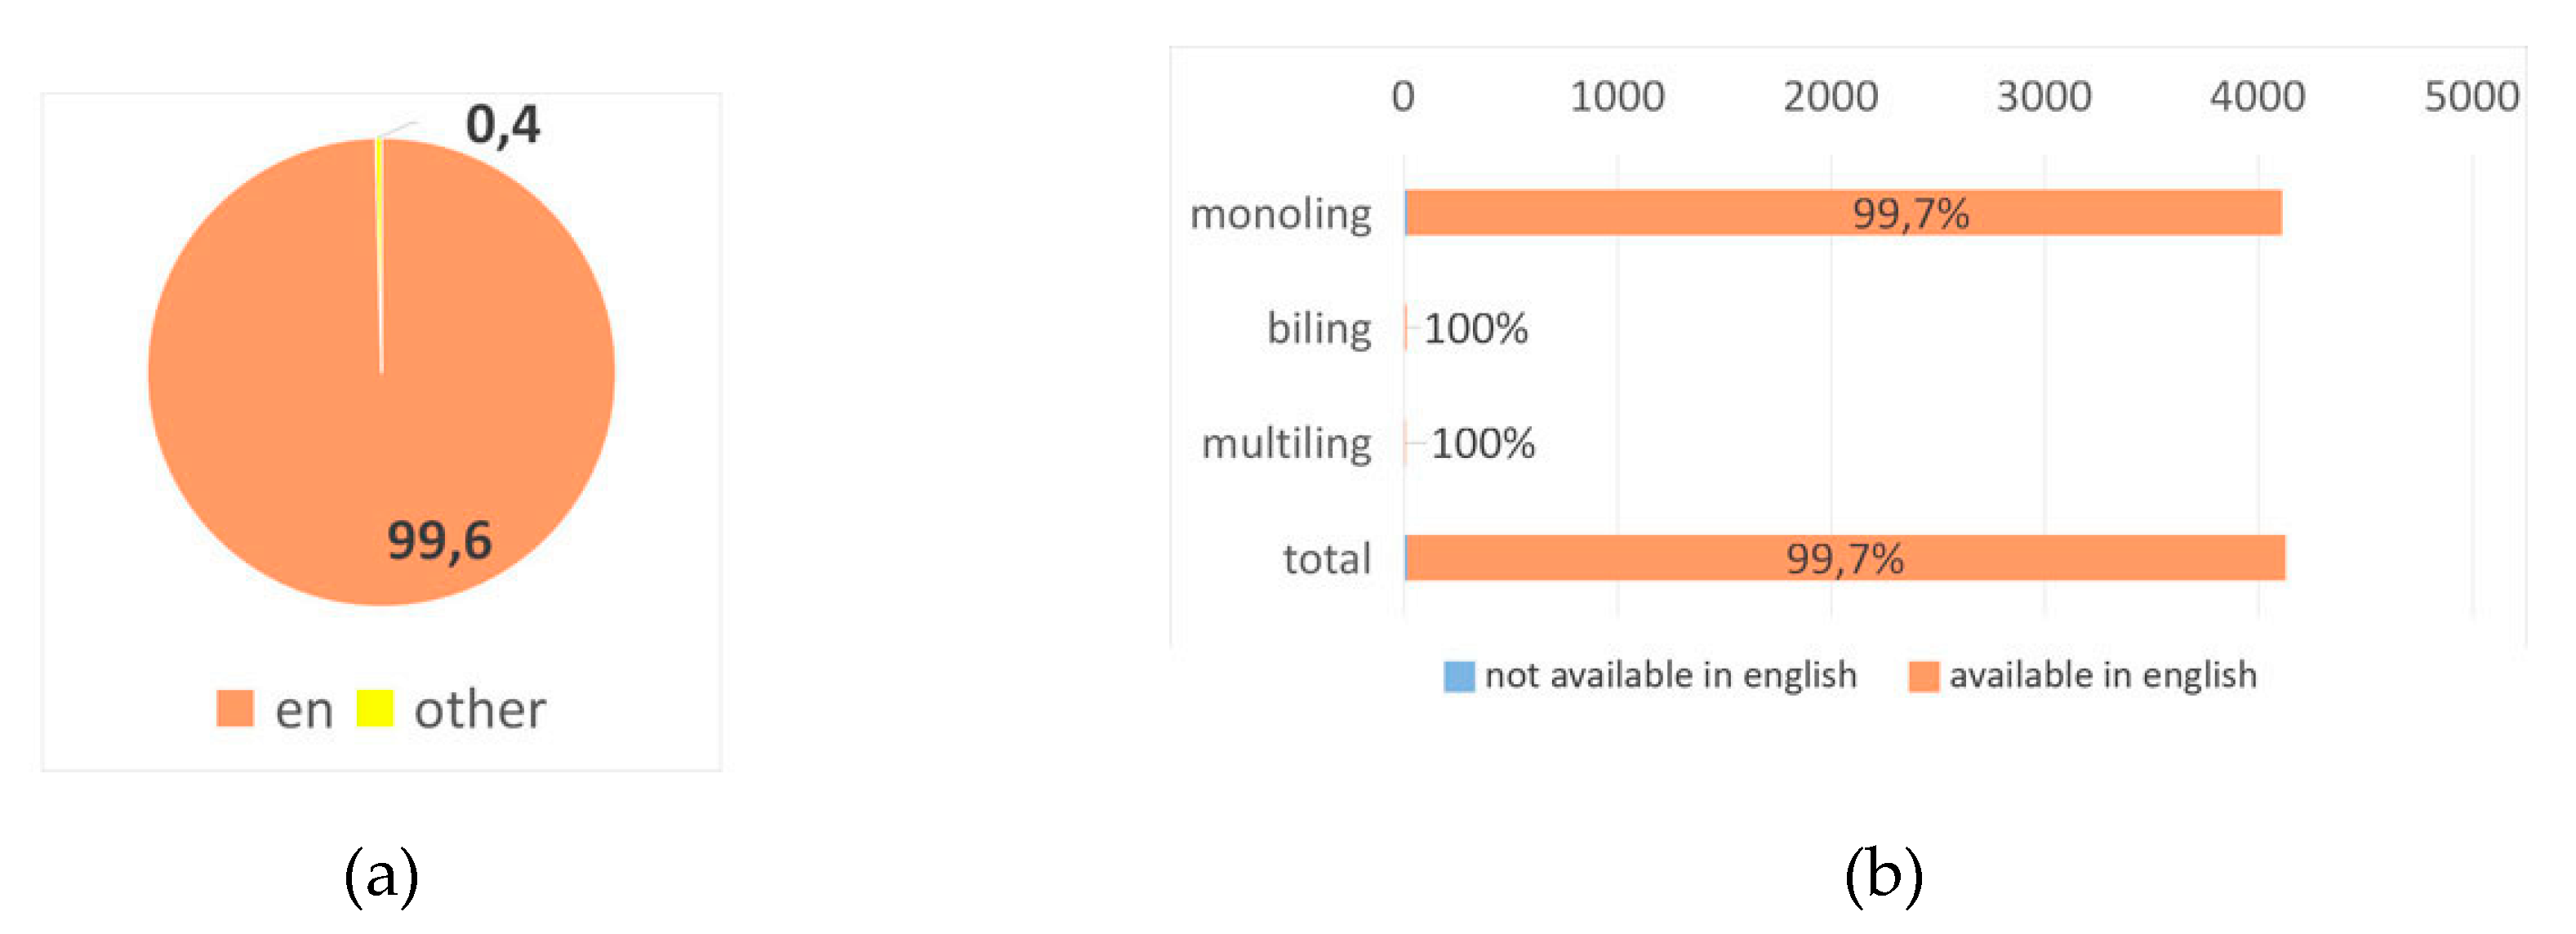
Figure 6a, the choice to forgo the official language of a country in order to accommodate English is not very popular, although it is still significant. On the other hand, when multiple languages are supported, it is very rare for English to be omitted as seen in
Figure 6b,c. This observation reinforces our earlier assumption that the availability of multiple languages is driven primarily by the need to include English in order to increase reach. The most popular choice that accommodates both the use of English for greater reach and the relatively low cost of adding a singular secondary language makes the model of a bilingual website that supports English the most popular model. This comes in line with the findings of Mongeon and Paul-Hus [
25] which also demonstrated the popularity of bilingual content with one of the two languages being English (in their case only in relevance to abstracts of scientific publications). On average 17.08% of all websites are bilingual websites that support the English language. This percentage comes really close to the total of bilingual websites and represents the largest part of all websites that are available in English.
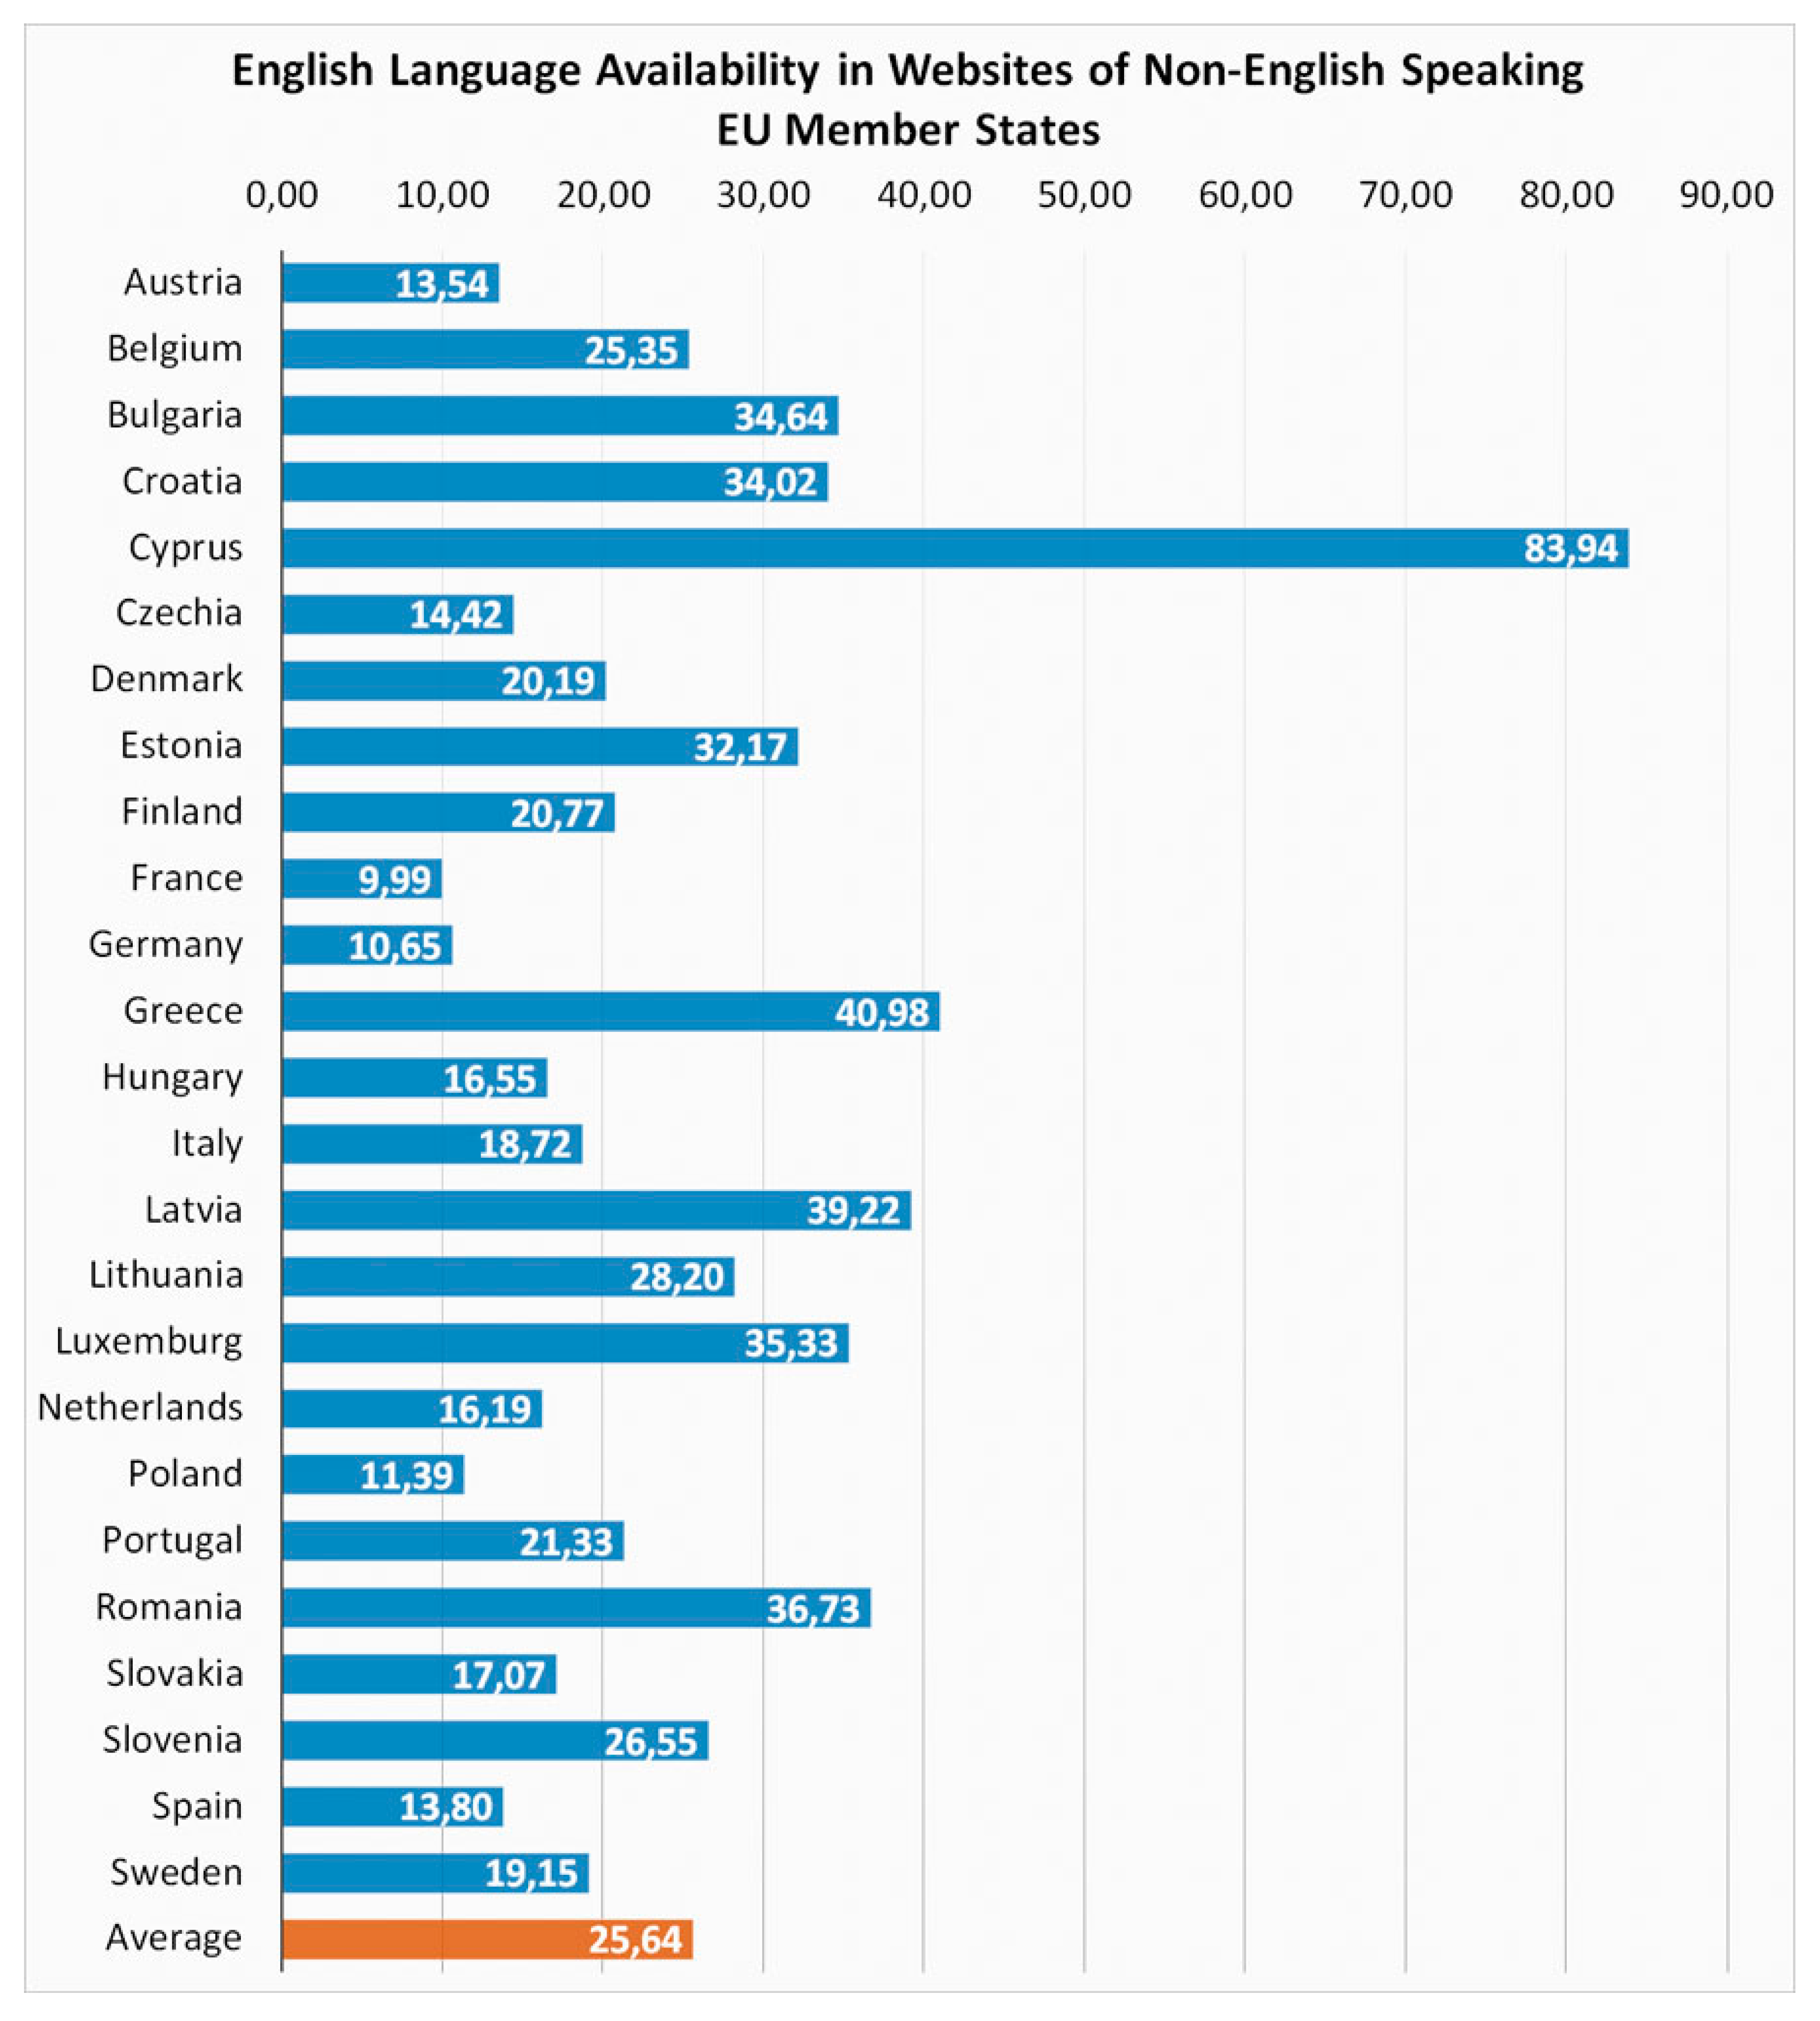
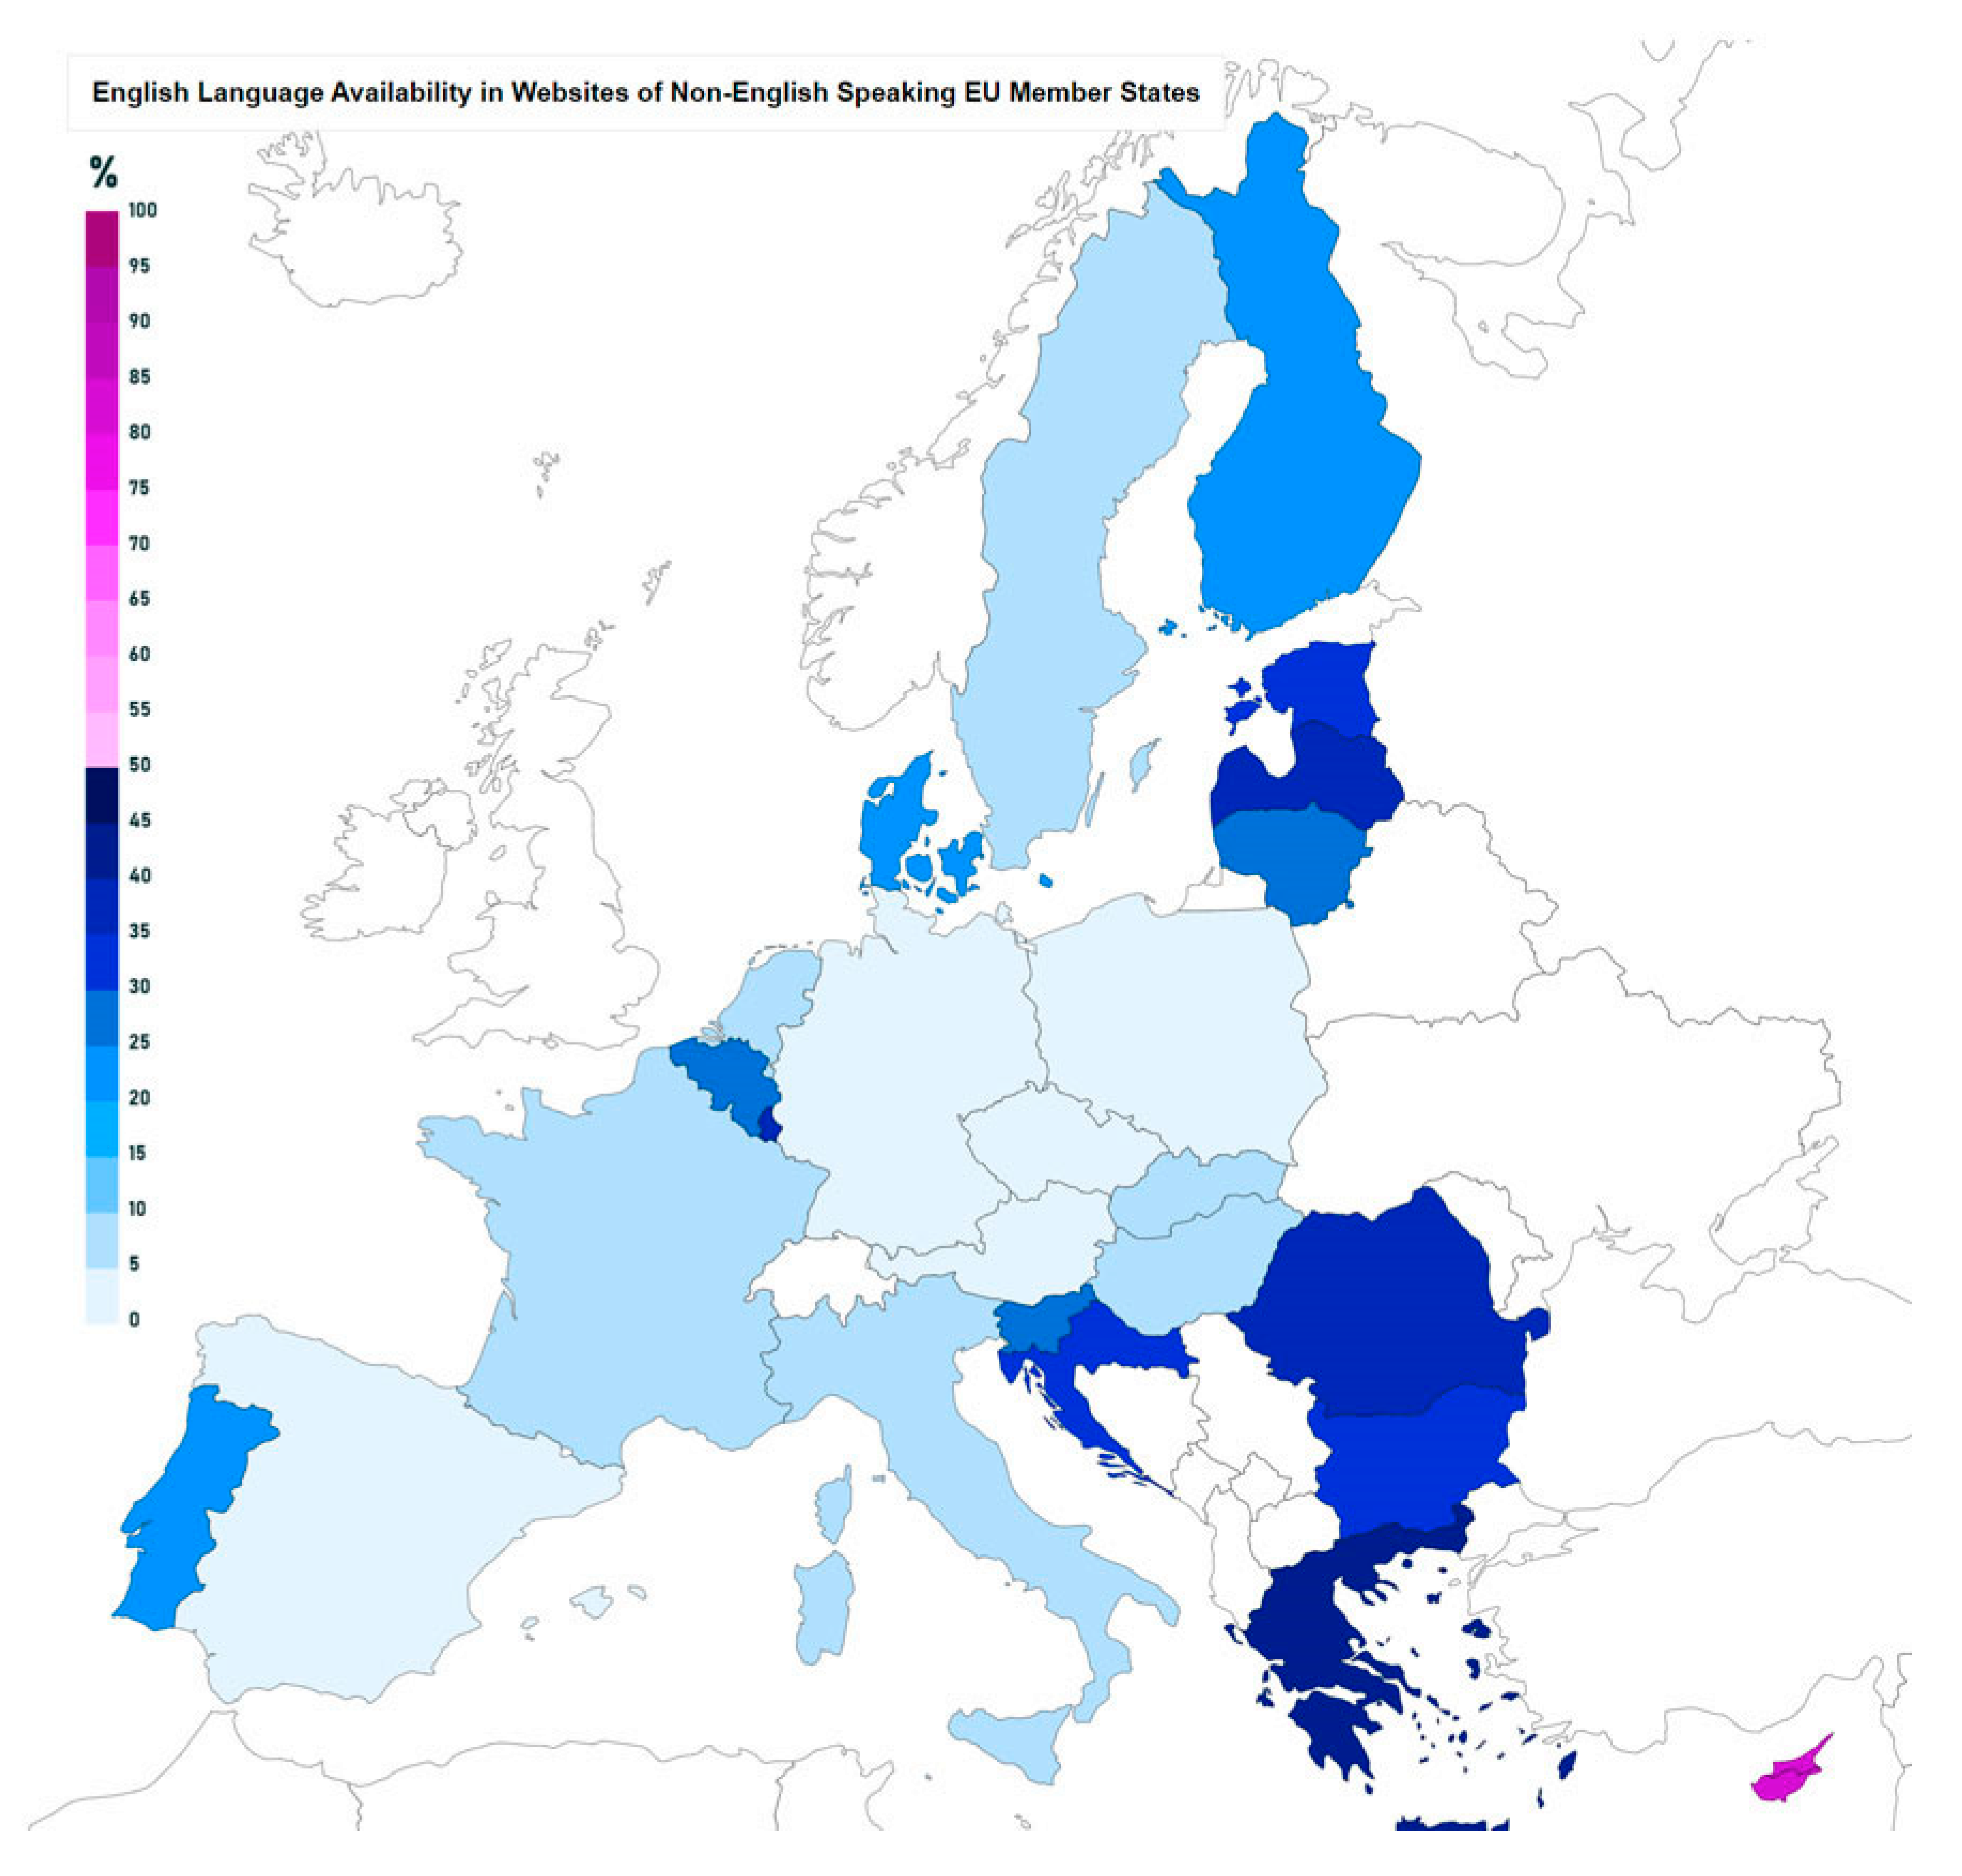
Studying both
Figure 7 and
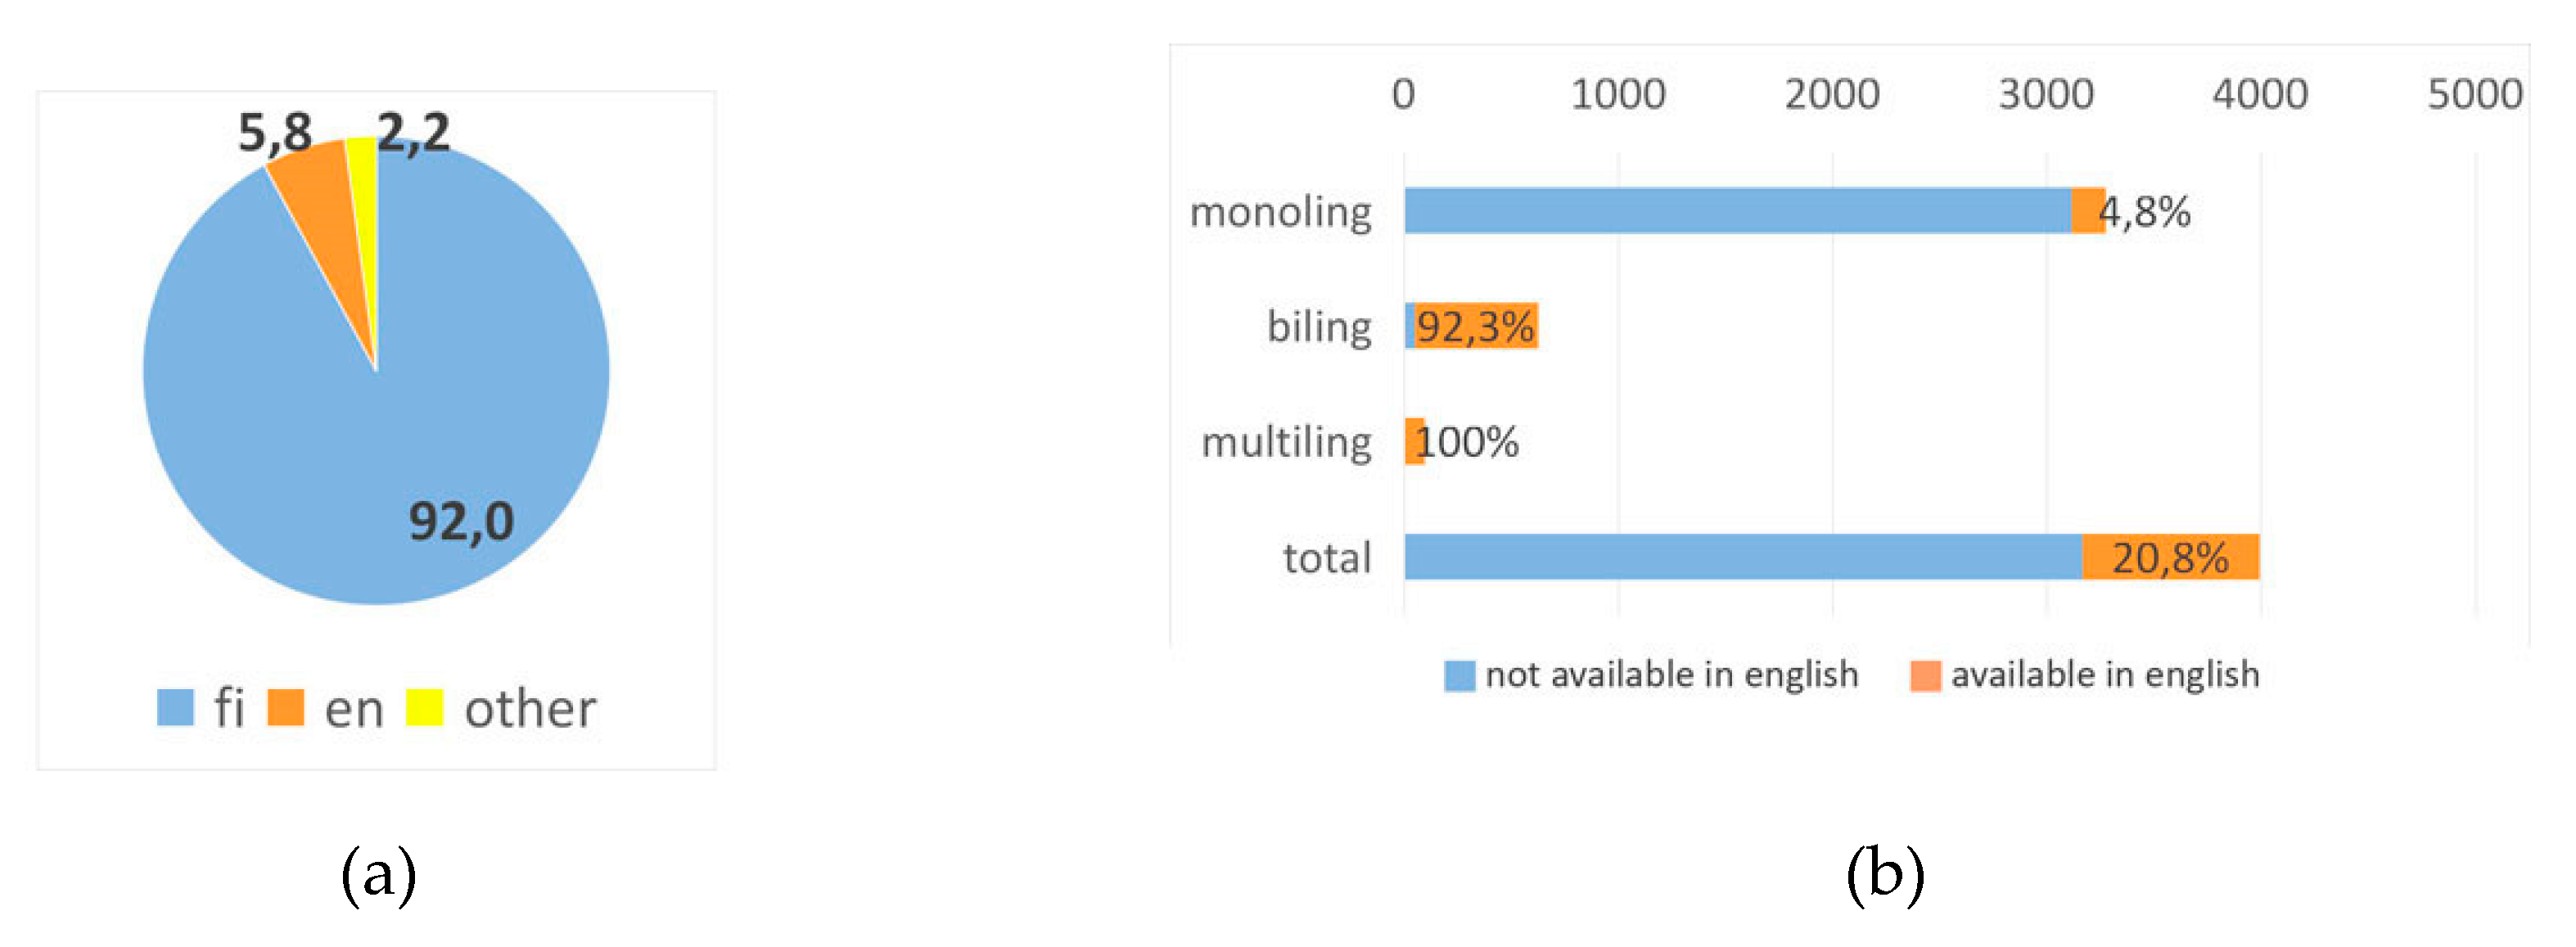
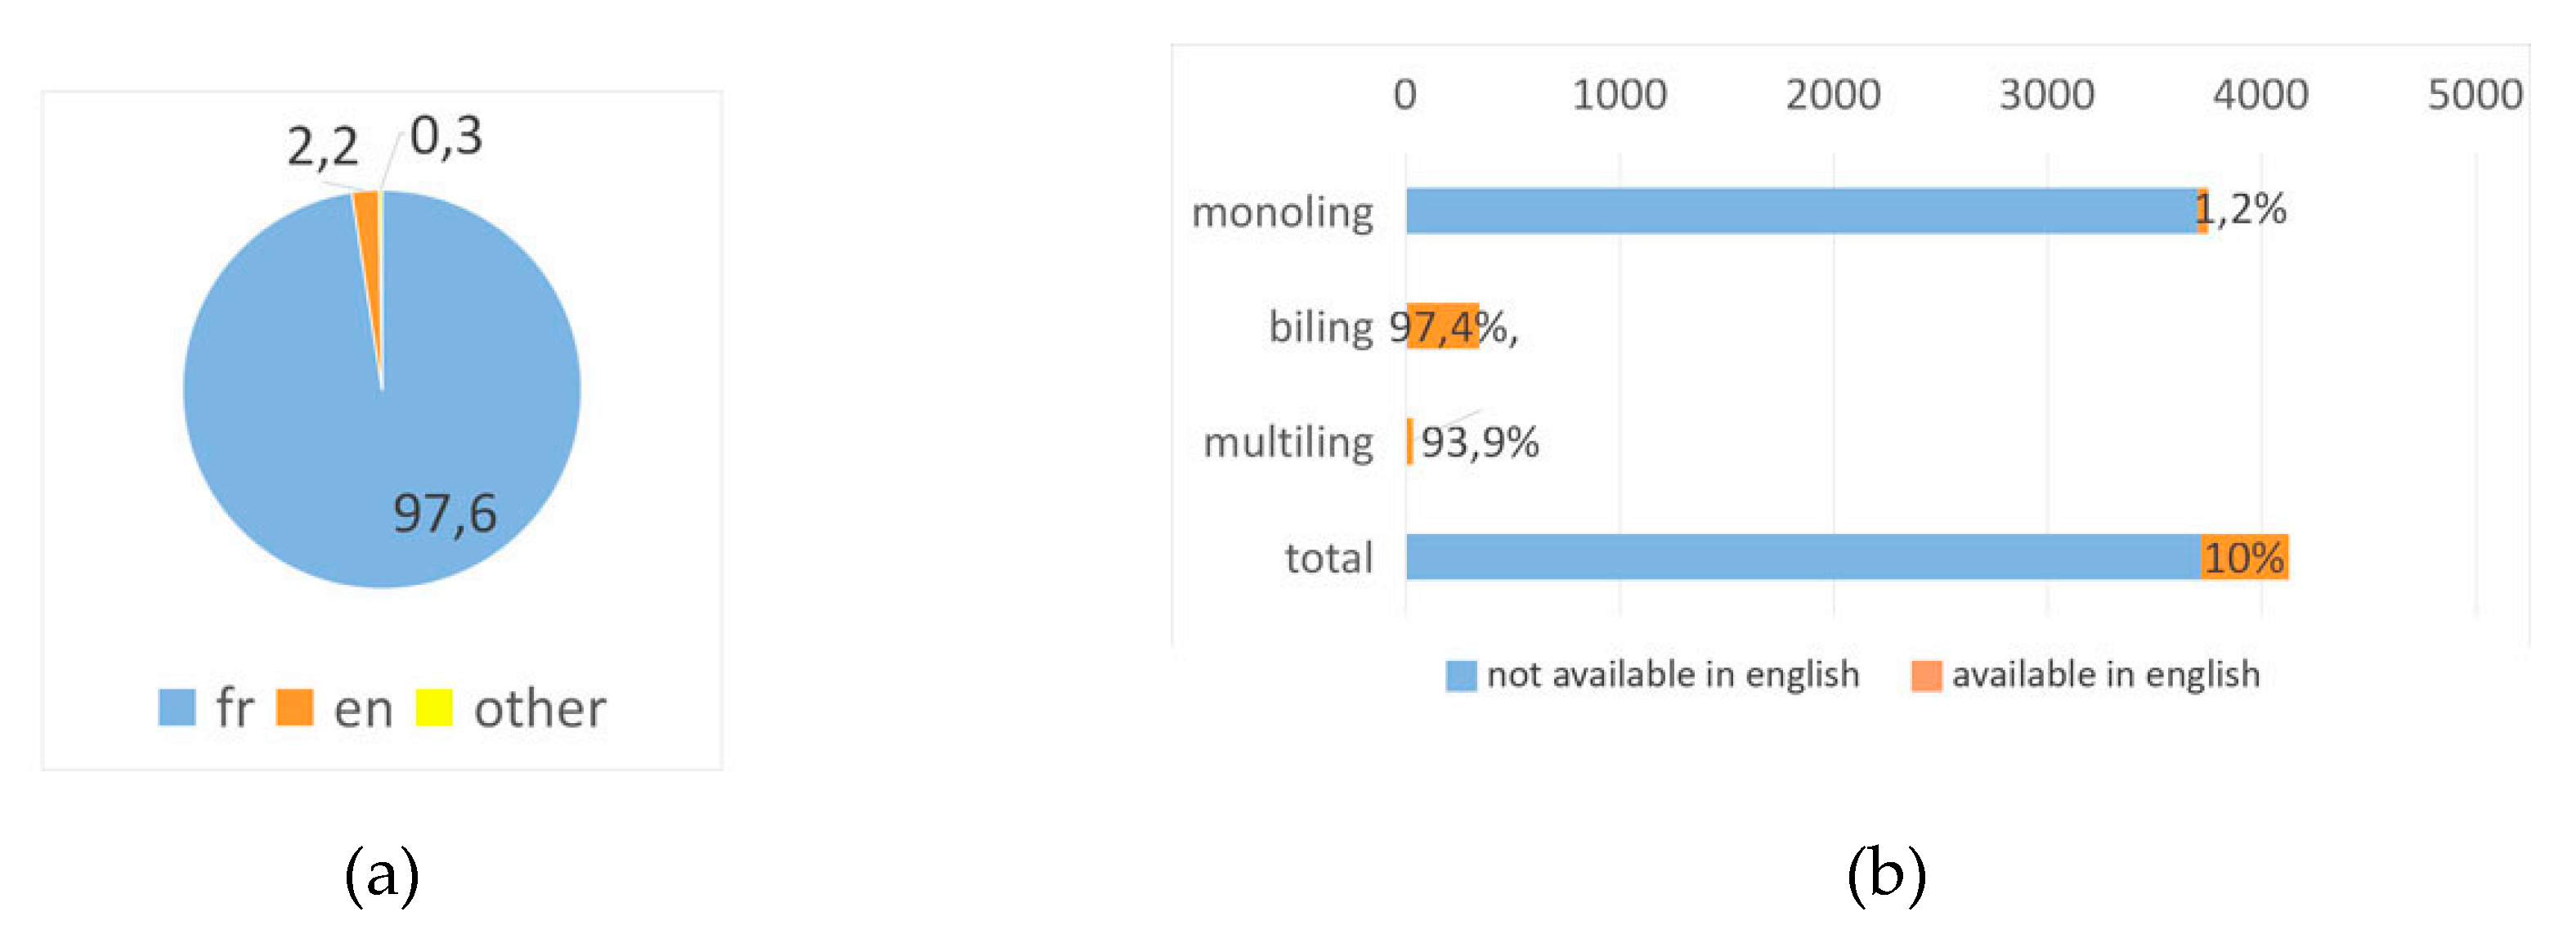
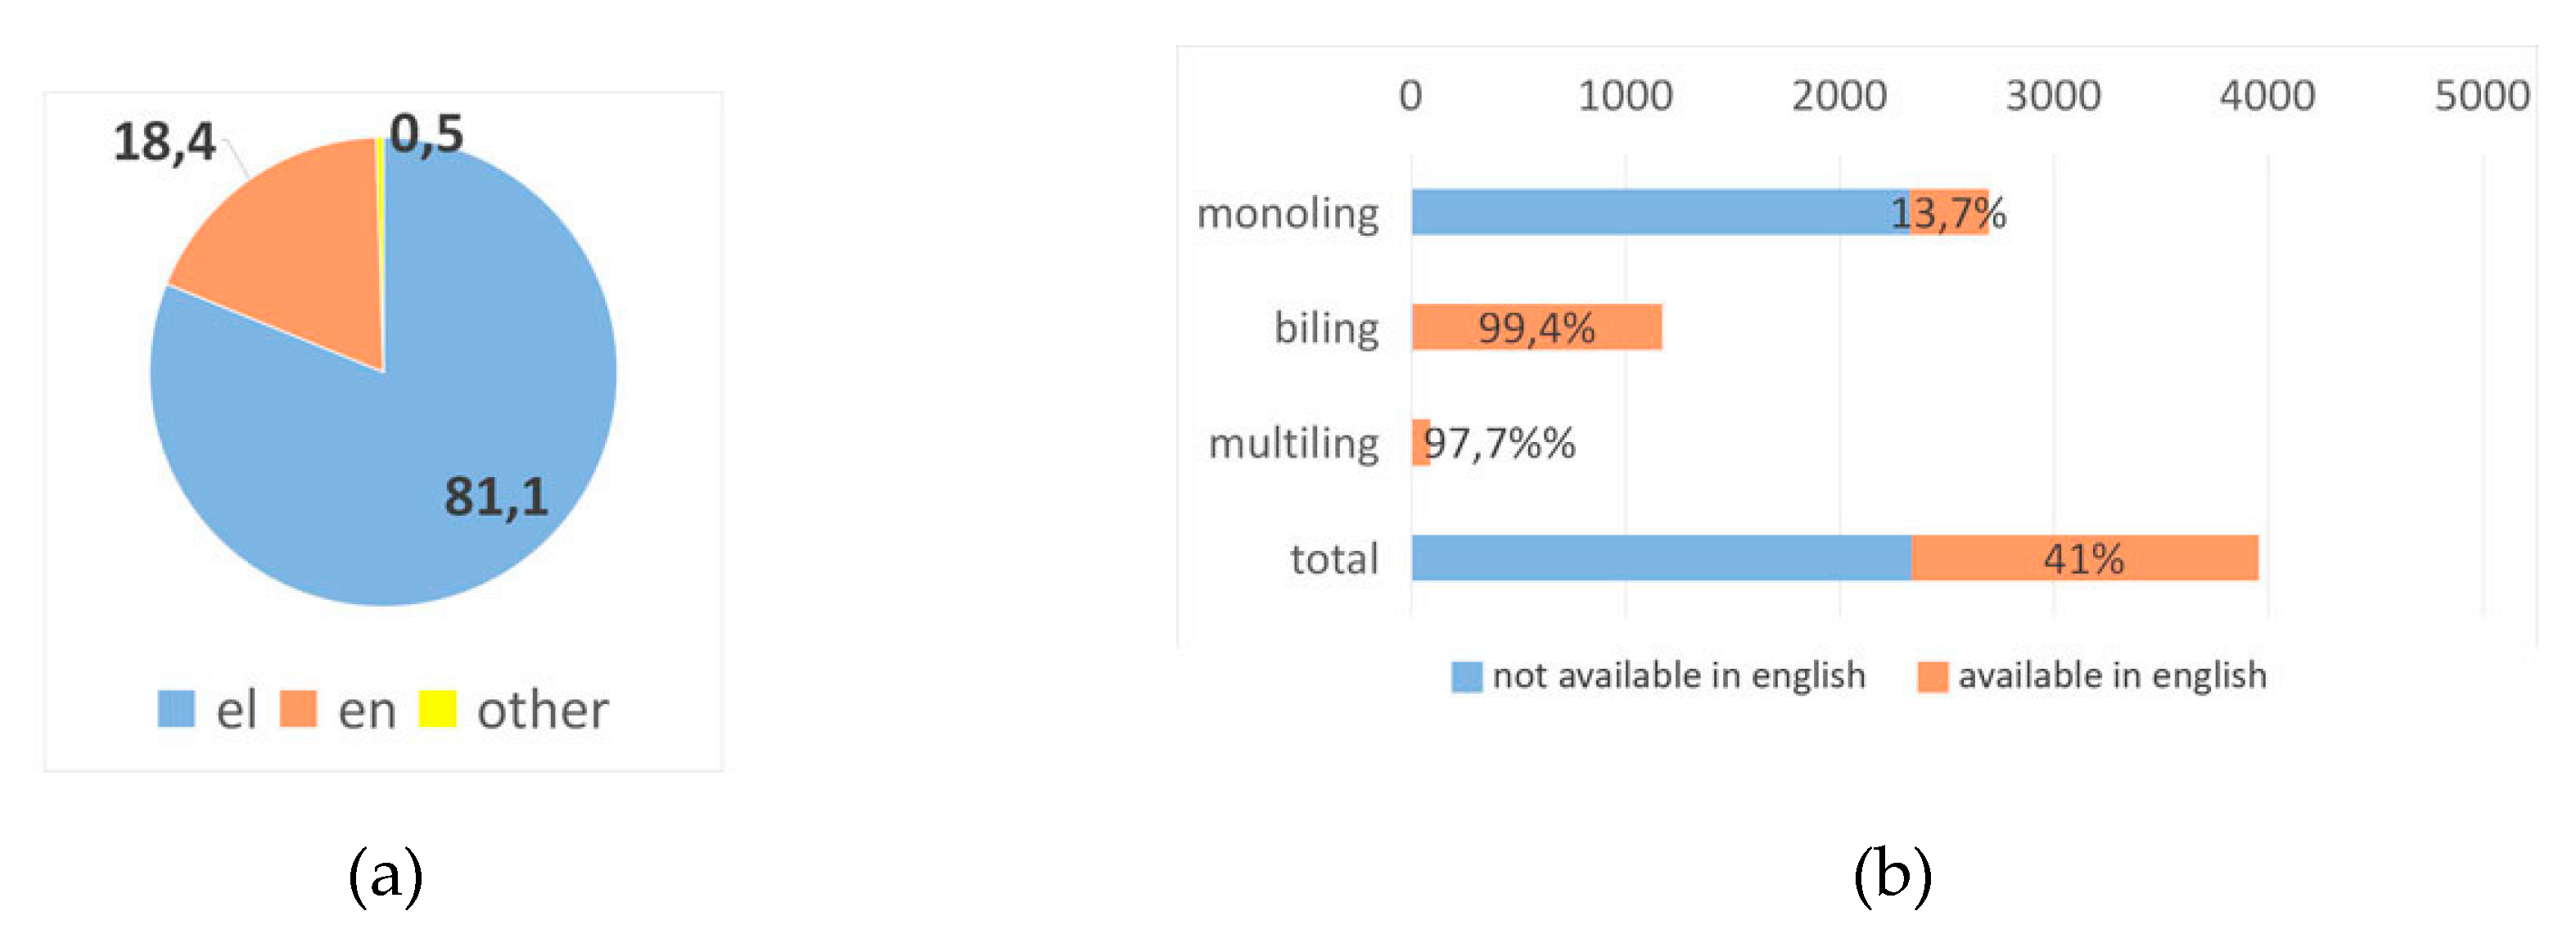
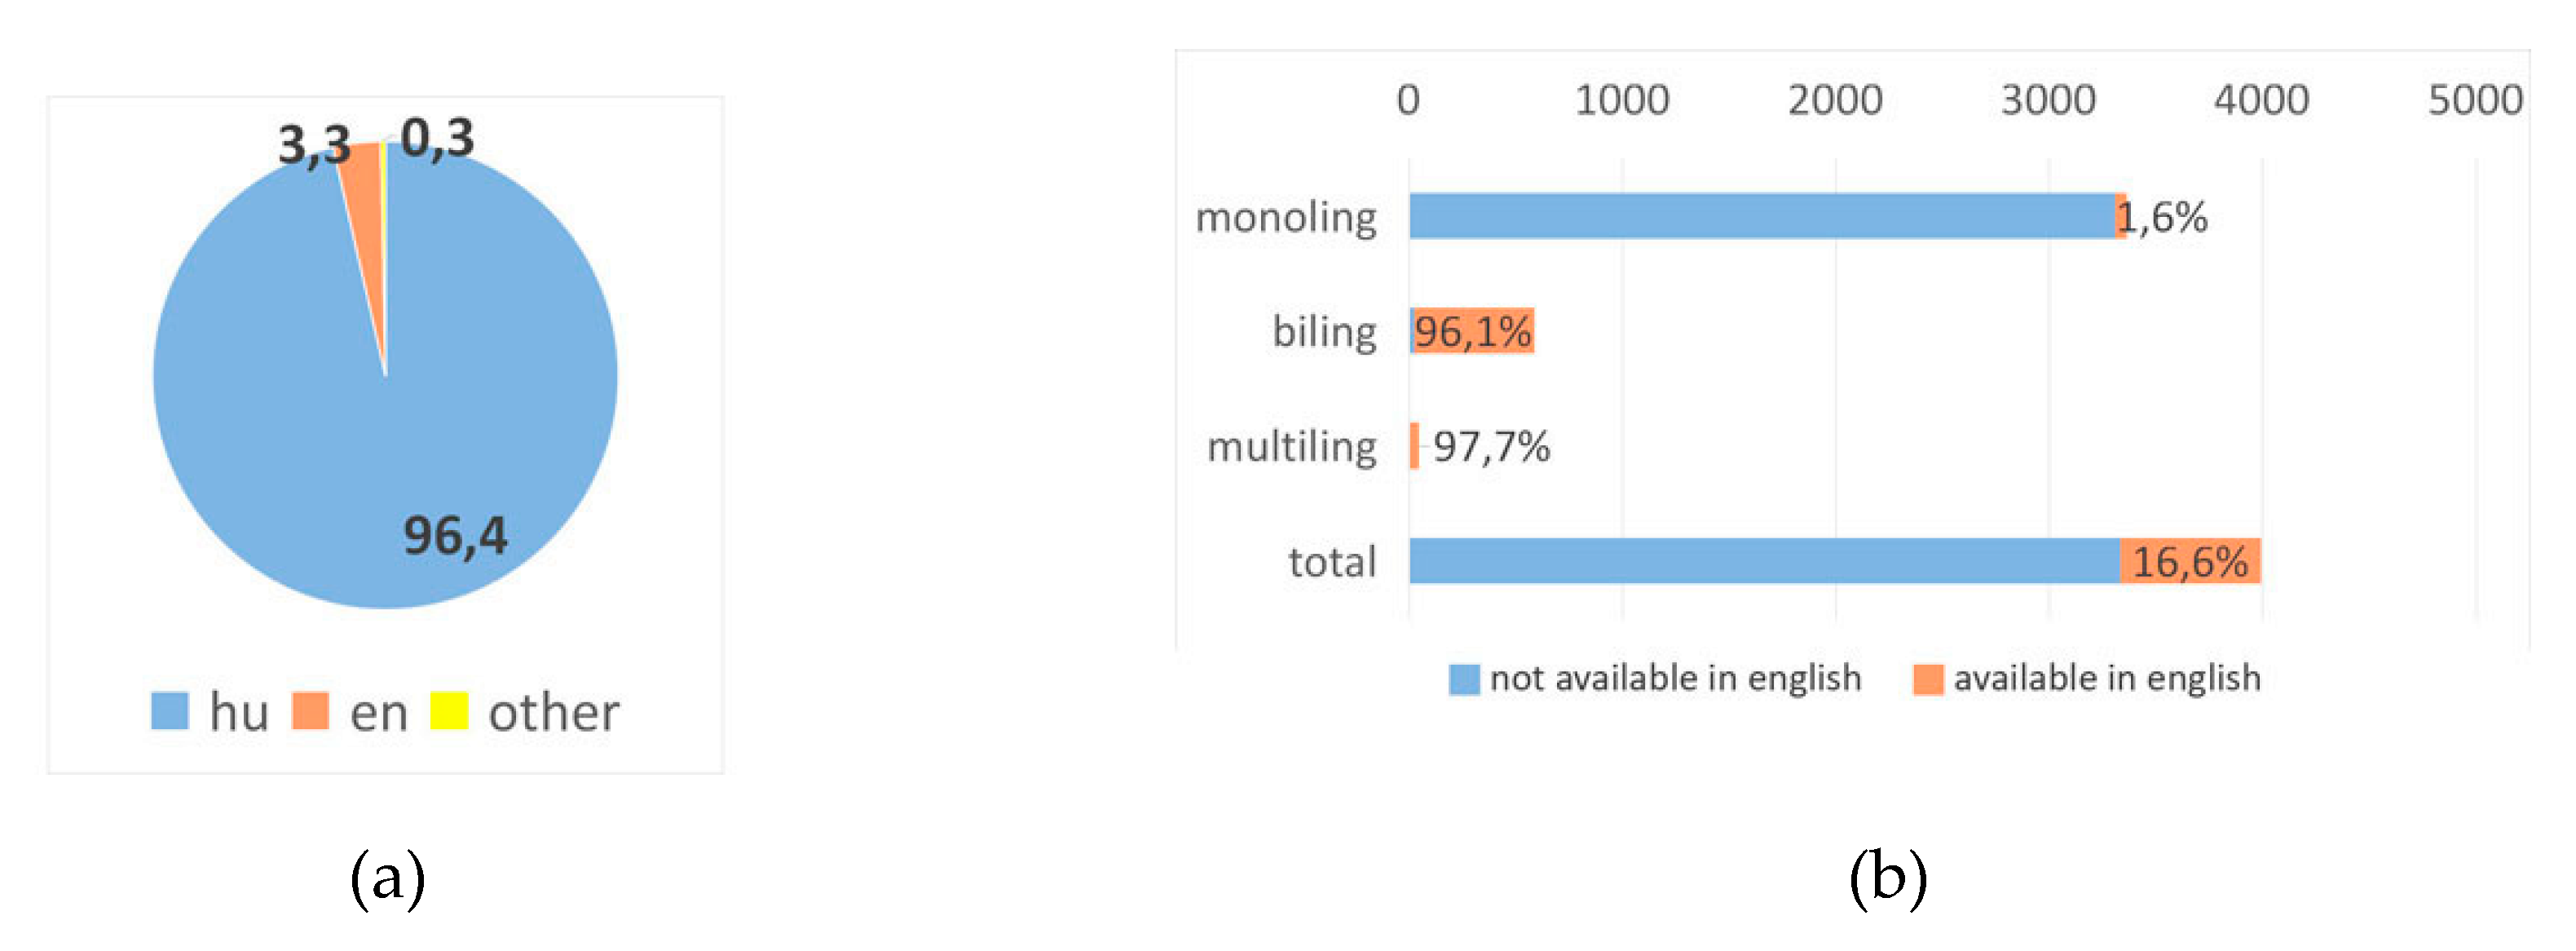
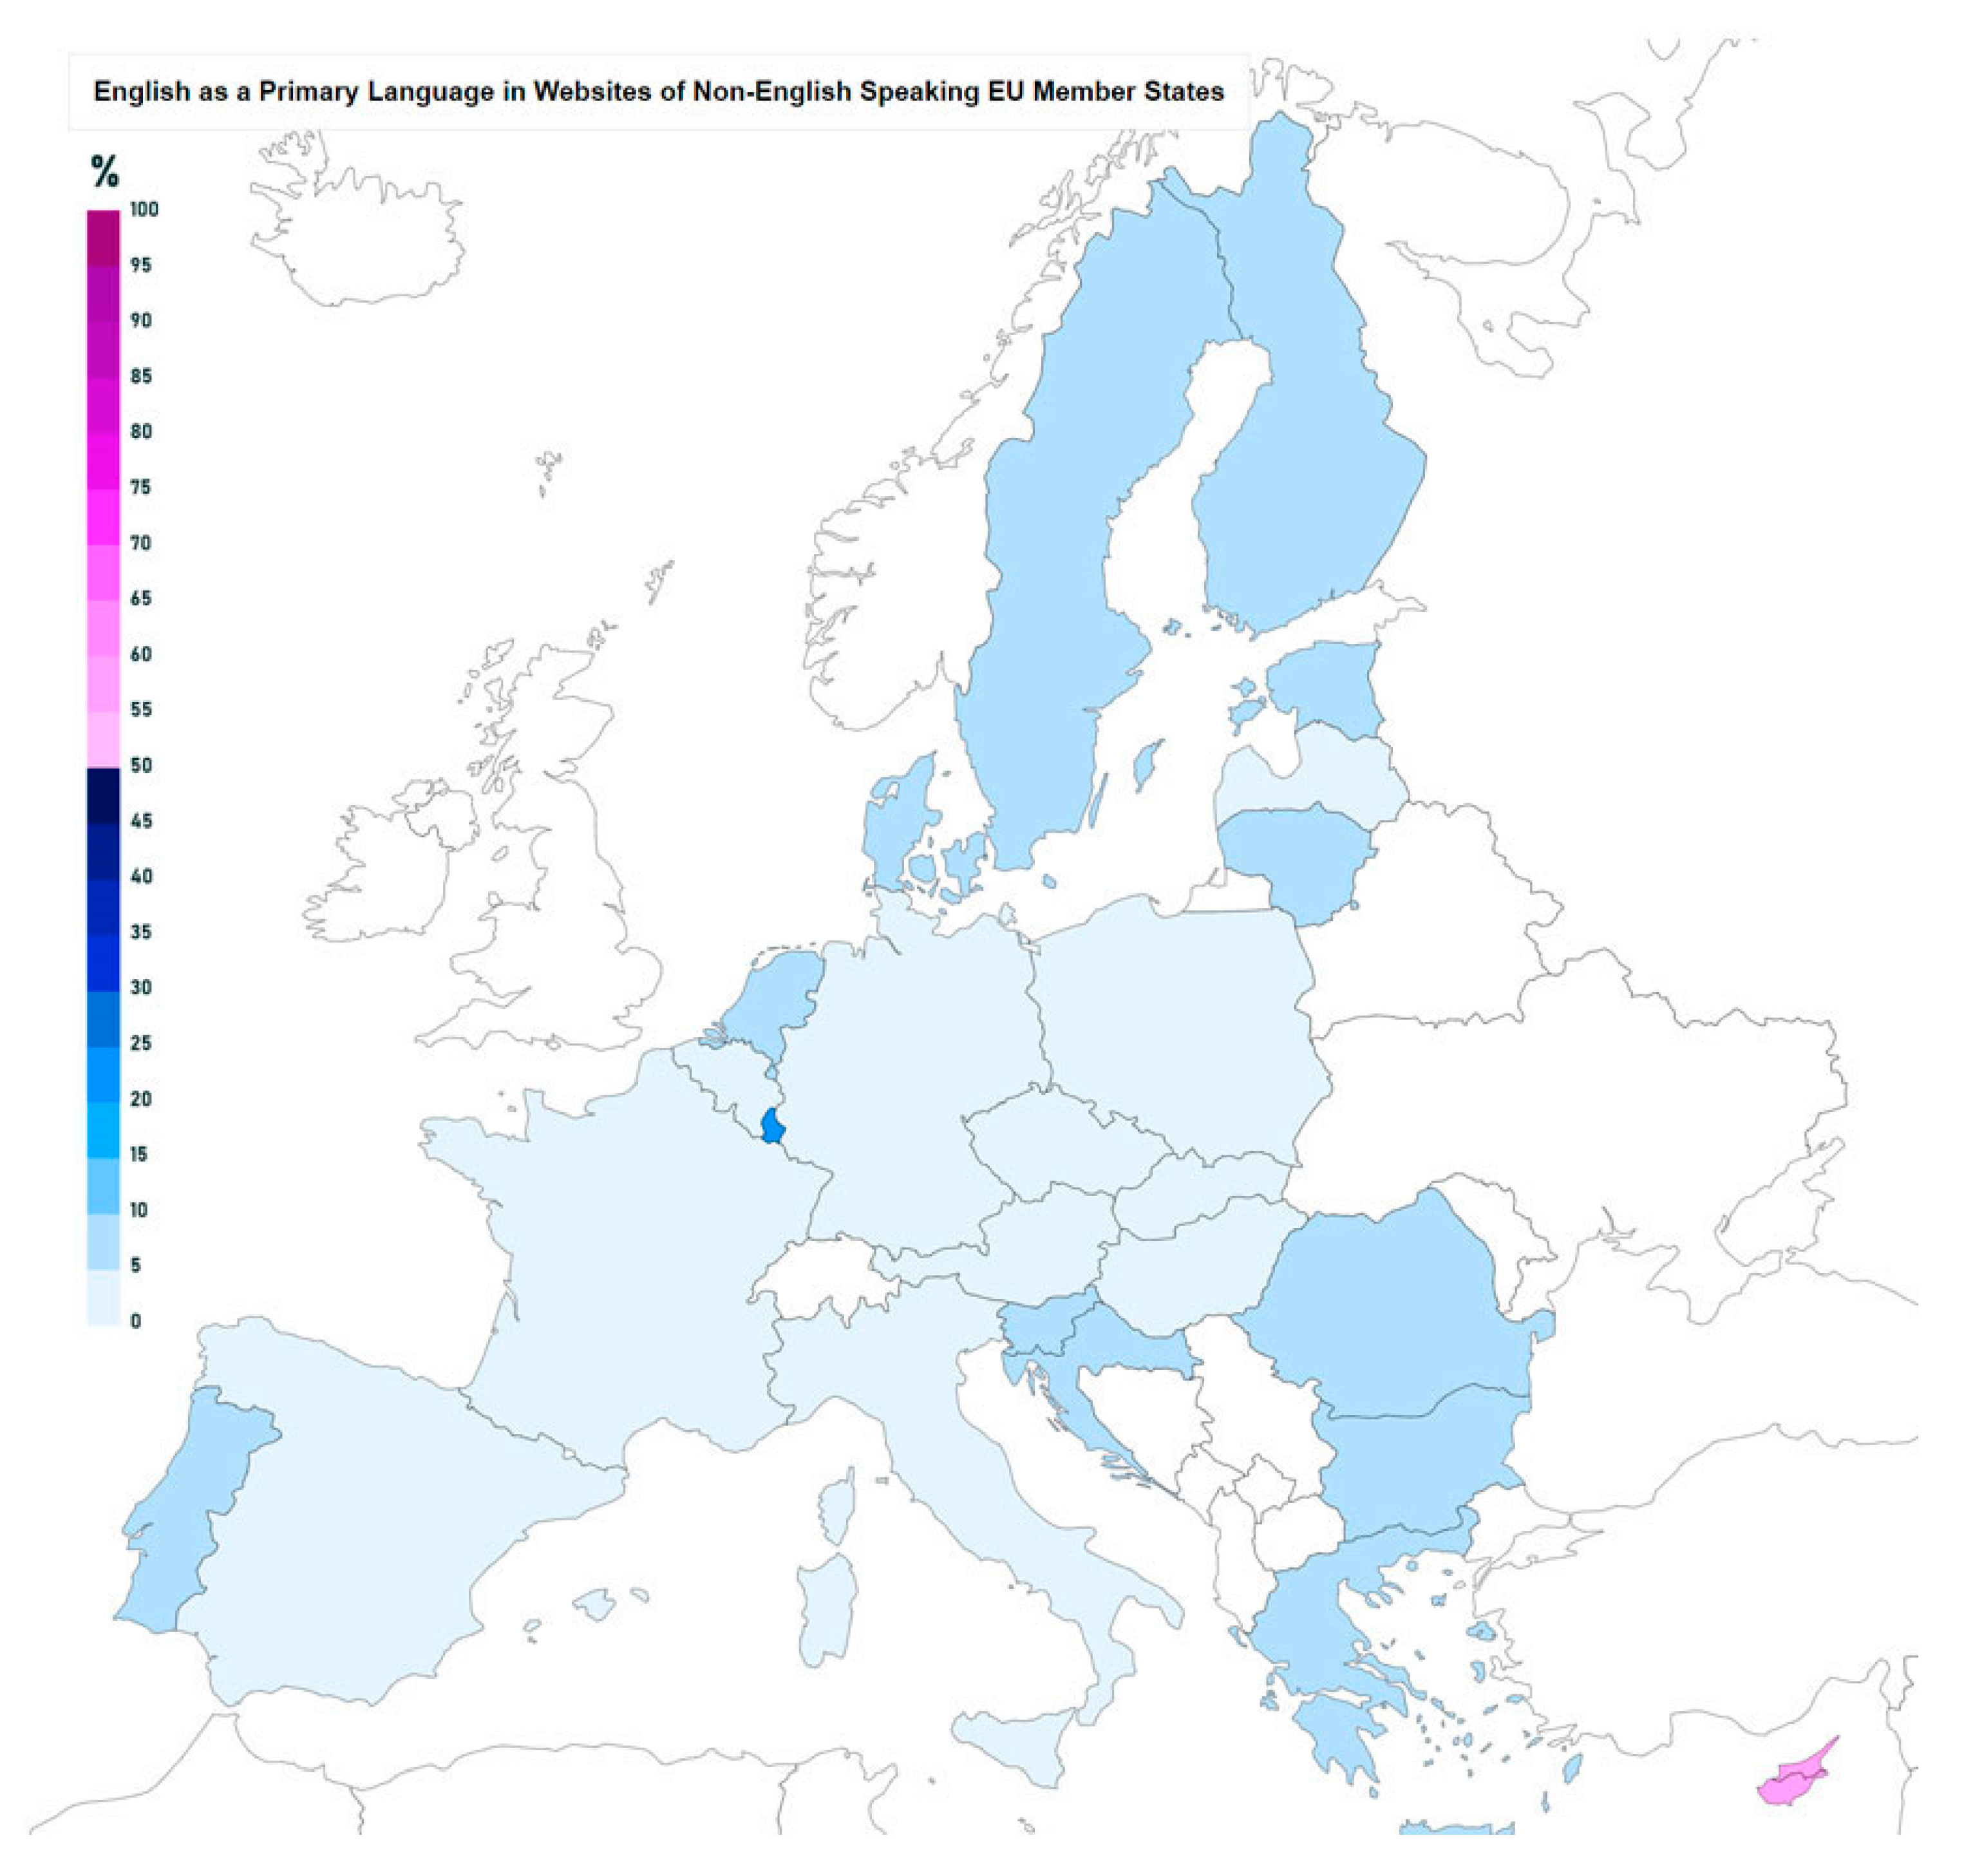
Figure 8, we can see that the lowest percentages of English availability come from the largest EU member states (Germany, France, and Poland). Websites of smaller countries seem much more eager to provide their content in the English language. More than 35% of websites in Latvia, Belgium, Romania, Greece, Luxemburg, and Cyprus have English as their primary language.
Reasons for the variation in percentages may include local culture, economy (for example focus on tourism or exports), and whether a country has more than one official language among others. However, a trend seems to be emerging in that smaller countries tend to put greater effort into making their websites available in English. In order to further investigate this trend, we proceeded to study the interrelation between both a country’s GDP and a country’s total population in relation to the availability of its websites in English.
To analyze the interrelation between the population (population) variable and availability in English, Pearson’s correlation coefficient (Pearson’s r) has been applied [
44]. The results are shown in
Table 5 where there appears to be a negative correlation between population and availability in English (−0.462). This leads us to reject the null hypothesis (there is no correlation between population and availability in English). The significance level is 0.01, confirming the statistically significant negative moderate correlation.
In order to investigate if there is a correlation between the availability in English and the economic situation for each member state of the EU, we decided to use the gross domestic product (GDP) indicator. Information about each country’s GDP was gathered from Eurostat [
45]. Pearson’s correlation coefficient (Pearson’s r) has been applied in order to see if there is a correlation between GDP and availability in English. As we can see in
Table 6, the Pearson correlation is −0.446 at 0.013 one-sided significance, which shows a negative correlation between the two variables.
The moderate negative correlation observed between both population and GDP in relation to the availability of the English language in non-English speaking countries of the EU indicates that smaller and less affluent countries offer higher English language availability in their websites. From a cultural perspective, the largest countries often carry a heavier cultural impact which manifests itself in the form of national pride, while smaller countries might be keener to facilitate communication beyond their own borders. In addition to the cultural perspective, the economy is also a major driving force for internationalization. Countries with a smaller GDP offer a smaller marketplace, which would create the need for businesses to try and increase their reach beyond the country’s limitations. As a result, business websites would put extra effort in providing their content in English, something that might not be necessary for a business in a larger country and hence a wider marketplace. In other words, the room to grow as an economic entity is larger in a bigger country which makes the incentive to grow internationally less impactful.
5.2. English Language as a Primary Language in Websites
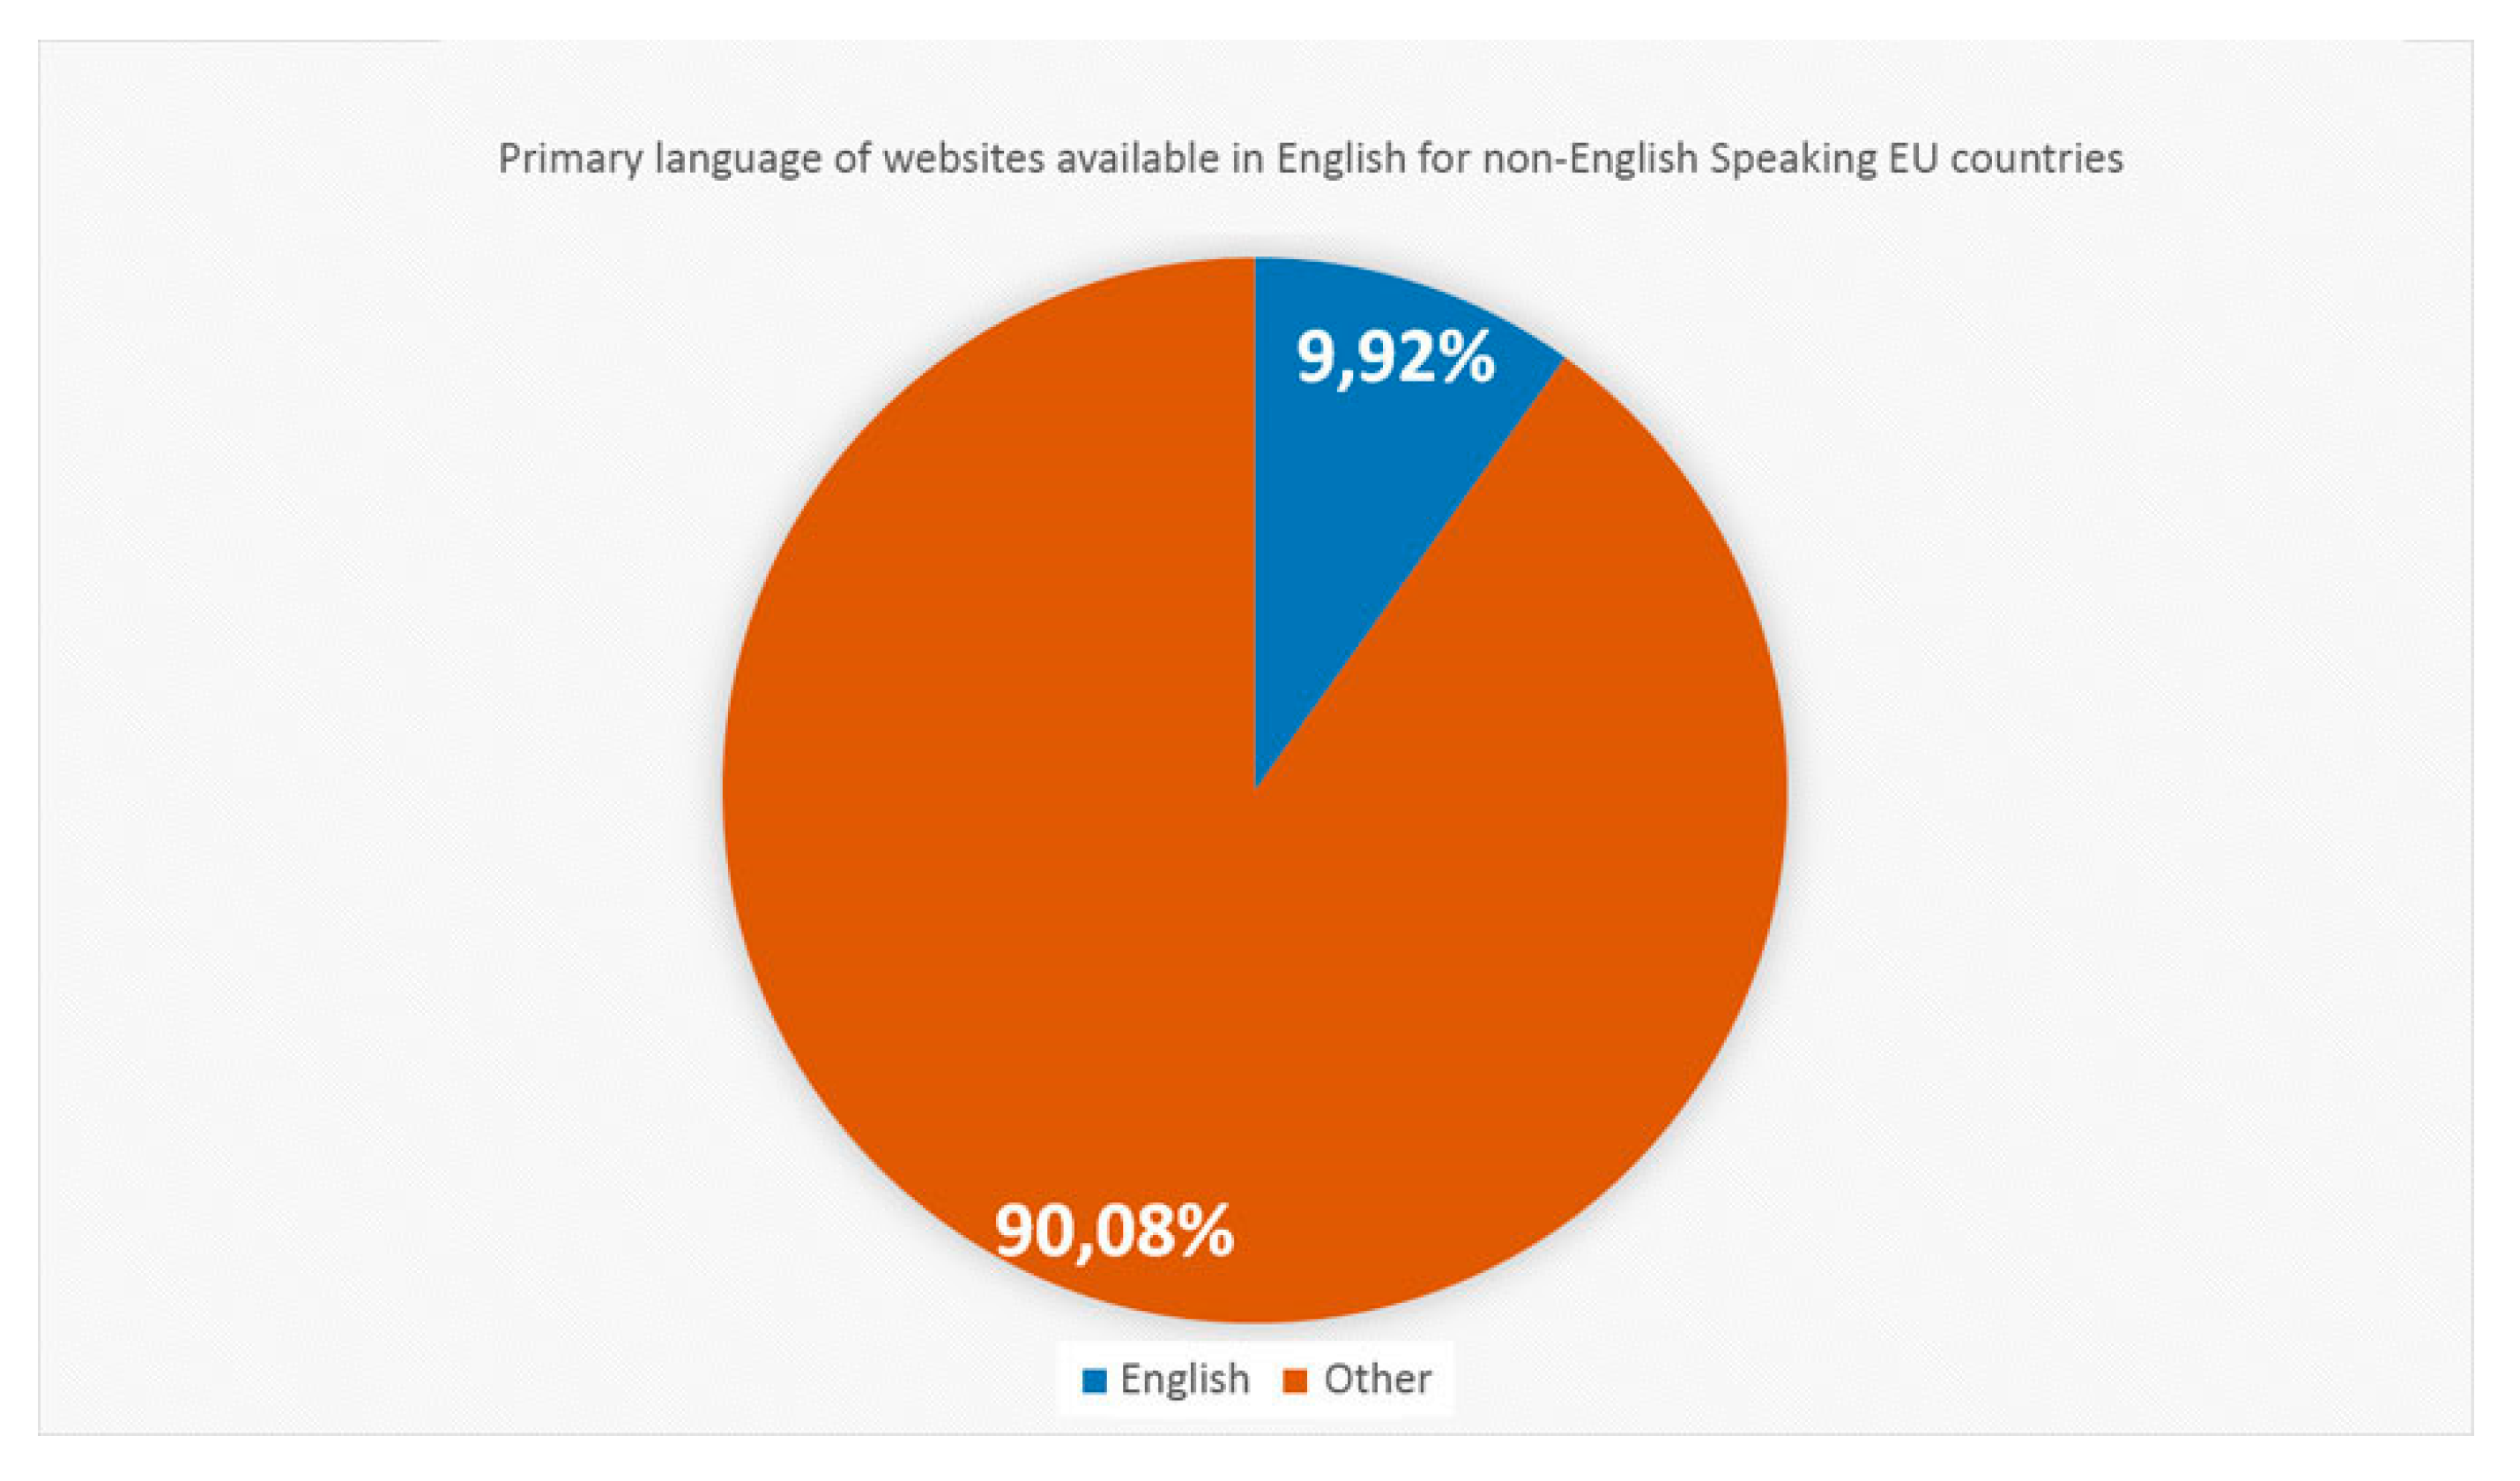
As mentioned in the results section we consider the first language that a user encounters on a website’s landing page to be the primary language of that website. In
Figure 9, we saw that the English language appears as the primary language in 9.92% of all websites on average in non-English speaking EU member-states, making this another metric of the prevalence of the English language throughout the European part of the World Wide Web.
Despite this percentage being relatively low, it is still a significant percentage. On average, almost one out of ten websites on the TLD of non-English speaking EU member states do not use its own official language as the language of choice for its homepage, but the English language.
Furthermore, studying that percentage on individual member states through
Figure 10 and
Figure 11 we can determine that the lowest percentages of English availability come from the largest EU member states (Germany, France and Poland), while more than 10% of websites in Latvia, Belgium, Romania, Greece, Luxemburg, and Cyprus have English as their primary language. Comparing these results with their equivalents regarding English language availability makes it safe to say that the same values that govern the availability of English also govern, to some extent, whether a website has English as its primary language or not.
In an effort to prove this, Pearson’s correlation coefficient (Pearson’s r) has been applied between English as primary language and availability in English in order to examine the null hypothesis that there is no linear relationship between these two variables. The results are shown in
Table 7, where there appears to be a strong correlation [
44] between them, which leads us to reject the null hypothesis. The significance level is 0.00, confirming a statistically significant correlation.
English being the first language a user encounters on a website’s landing page (i.e., the primary language) in any website that intentionally exists in a national TLD is not something that one would expect. Despite this fact, the percentage of such websites is consistent in most EU countries and although small, it is still significant. The strong correlation between the availability of the English language and English language as a primary language in a website indicates that the variable of English as a primary language follows similar trends. This means that it can also be used as an objective metric in order to study the prevalence of the English language throughout the World Wide Web. Given all the above, it would come as no surprise if this particular metric increases in the course of time.
5.3. National and Regional Factors
As mentioned above, cultural and geographical factors, besides a country’s population, may play a role in the influence of the English language in its websites. Having established a strong correlation between website availability in English and English as a primary language for a website, it is safe to assume that whatever conclusions we draw from differences in specific member states will play a strong role in both these metrics.
Looking at individual countries, we note that Cyprus appears to be an outlier, having 83.94% of websites available in English and 67.6% using it as a primary language. This occurs despite the fact that English is not an official language in Cyprus. This can be attributed mostly to cultural factors. Cyprus was a British colony up until 1960, so both the cultural and the linguistic influence of the British Empire are strong. Additionally, international banking and tourism are both prevalent in Cyprus, creating an environment that encourages the use of English as a primary language in websites. This, combined with the small population of Cyprus and its position in the periphery of the EU, create the conditions which make the English language more popular than even the island nations’ official languages.
Taking a country’s geographical location in relation to the EU more into consideration, we notice the highest percentages of English availability and prevalence are noticed in peripheral countries. Countries of the Balkan peninsula, countries of the Baltic Sea and Scandinavia, as well as Portugal all have higher percentages than the EU average both in English availability and in English as a primary language. This might indicate an effort from peripheral countries to achieve greater integration with both European culture and the common marketplace. Most peripheral countries tend to also be later additions to the EU roster, which reinforces their need to put more effort into internationalization and EU integration.
On a different note, Belgium and Luxemburg also seem to display a high influence of the English language. Both these countries have more than one non-English official language. This creates a multilingual culture and somewhat diminishes the sense of national pride that might be otherwise connected with language. Additionally, the cost of integrating a secondary language into a website is lower if the website already has support for more than one language. The multilanguage functionality is there and all that remains is the addition of the translated content.
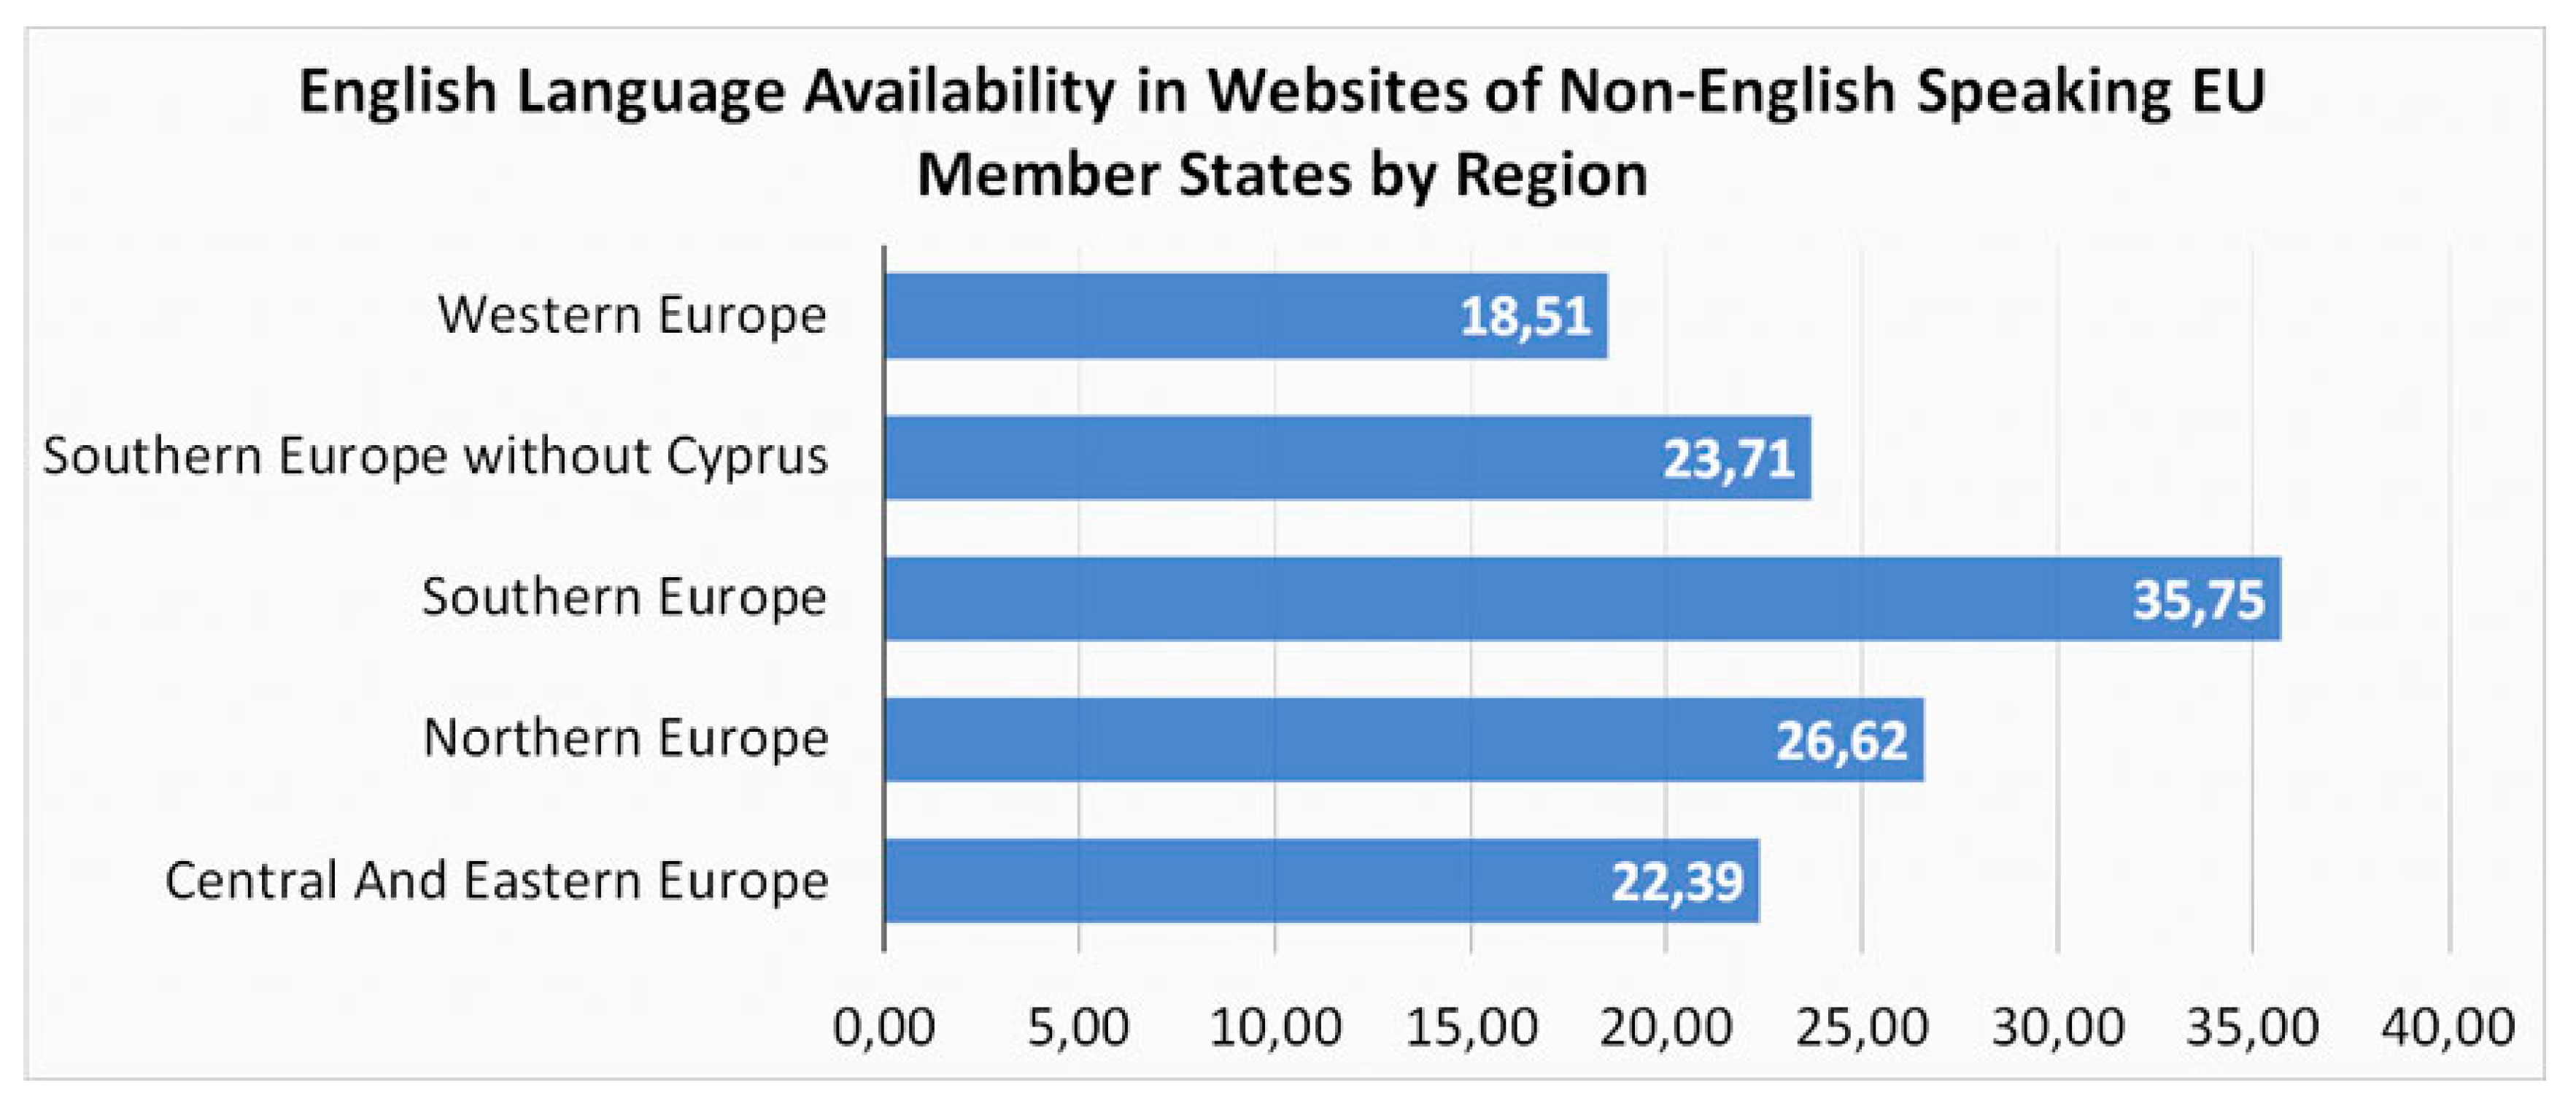
In addition to observing each country individually, some of the factors that influence the availability or status of the English language in the websites of non-English speaking EU member states might be attributed to the wider region. Cultural relations often arise from common history or the geo-political status of a wider region, all of which may play a part in the adoption of English in the World Wide Web. In order to better understand regional factors, we separated the 25 non-English speaking countries of the EU to four different regions based on how they are defined by the European Vocabularies [
46] of the Publications Office of the European Union, which is an “interinstitutional office whose task is to publish the publications of the institutions of the European Union” [
47].
Table 8 shows how the countries were divided.
The average percentage of websites that have English available and the average percentage of Websites that have English as their primary language in each different region are shown in
Figure 12 and
Figure 13, respectively.
Southern Europe appears to be noticeably keener to include English either as a primary language or as just an available language in most cases. This is in large part due to the influence of Cyprus, which is an outlier. Calculating Southern Europe without Cyprus will lead to 23.31% instead of 35.75% on availability and 8.33% instead of 20.19% on primary language. This brings Southern Europe in tow with the other regions. Western Europe seems to be somewhat more reluctant to provide English as an available language, but seems to be keener to have it as a primary language.
6. Conclusions
The present study has demonstrated explicitly that the English language represents the number one choice for international communication in the European Union through the World Wide Web. More than one quarter of websites belonging to NTLDs of non-English speaking countries, on average, offer their content in the English language. On the other hand, websites of English speaking countries very rarely offer the option for any other language besides English. This clearly indicates that, for both English speaking countries and non-English speaking ones, the use of the English language is viewed as the most efficient way to attain international reach. On top of that, a significant number (almost 10%) of websites from non-English speaking countries prioritize English over their own official language or languages. This further reinforces the status of English as the most prevalent language for international communication in the wider European Union.
When studying the reasons that lead to a greater or lesser availability of the English language in websites of non-English speaking EU member states, a statistically significant moderate negative correlation was discovered between both the population and GDP of a member state and the availability of English in its websites. This signifies that, in general, larger countries population-wise and more affluent countries put less effort into providing their website content in English than smaller countries. This correlation reinforces the notion that language is a hard barrier in achieving greater reach. Countries with a smaller number of people speaking their official language need to compensate by putting more effort into providing their content in English, in order to attain the reach that an equivalent website in a larger non-English speaking country or in an English speaking country would have.
Besides population and GDP, some characteristics that were identified to influence the prevalence of the English language were: i) a country’s position in the EU periphery (in the Balkans, the Baltic states, Scandinavia, and Portugal), ii) an already existing multilingual culture due to more than one official language (in Belgium and Luxemburg), and iii) a close historical connection with British culture (in the case of Cyprus).
The fact that, to the best of our knowledge, there are no directly related works, makes it difficult to compare the results of this study to previous research on the field, Yet, it is clear that the quantified information presented in the Results section, as well as the hermeneutical insights elaborated in the Discussion section provide numerical evidence of i) the theoretical approaches regarding national identities in the era of globalization, ii) the discussion about the use of English language as a means of international communication, and iii) the political analysis of the role of national identities in the multinational environment of the EU. Thus, the study is in common perspective with loosely related works along the above-mentioned axes. The main contribution of this study lies in the provision of quantified information regarding the usage of the English language in the websites of EU, obtained from a large-scale data research all over the web of EU member states. In addition, this research paves the way for the exploration of the current status of European integration in quite a different way to the traditional approaches. Instead of opinion polls and theoretical analysis, this study indicates that more accurate results may be achieved by the use of unintentionally and freely provided data on the web.
Pushing this research further, it would be interesting to examine the language situation of the .eu top-level domain which was launched in 2005. Although not explicitly an NTLD, it acts as a representation for the EU. Its popularity in different member states or the popularity of different languages in websites using that particular TLD might lead to some interesting conclusions. Additionally, applying the same or a similar methodology, the prevalence of other languages in different parts of the world can be studied. For example, the use of Chinese in the Far East and Indonesia or a comparison between English and Spanish in Latin America can be explored (continent-wide reach versus local/international reach). The World Wide Web and the Internet in general provide a vast amount of data that can be used to study the diffusion of language world-wide through clearly defined metrics and can help reach conclusions about language which also hold true in the offline world.
