Article

Aggregated Indices in Website Quality Assessment

1
Department of Land Management and Landscape Architecture, Faculty of Environmental Engineering and Land Surveying, University of Agriculture in Kraków, Balicka 253c, 30-149 Kraków, Poland
2
Department of Economics and Informatics, Faculty of Organization and Management, Silesian University of Technology in Gliwice, Akademicka 2A, 44-100 Gliwice, Poland
*
Author to whom correspondence should be addressed.
Future Internet 2020, 12(4), 72; https://doi.org/10.3390/fi12040072
Submission received: 31 March 2020 / Revised: 15 April 2020 / Accepted: 16 April 2020 / Published: 17 April 2020
(This article belongs to the Special Issue Social Web, New Media, Algorithms and Power)

Abstract

:
Website users have increasingly high expectations regarding website quality, starting from performance and ending up with the content. This article provides a list and characteristics of selected website quality indices and testing applications that are available free of charge. Aggregated website quality indices were characterised based on a review of various source materials, including the academic literature and Internet materials. Aggregated website quality indices are usually developed with a less specialised user (customer) searching for descriptive information in mind. Their presentation is focused on aesthetic sensations. Most frequently, their values are expressed in points or percent. Many of these indices appear to be of little substantive value, as they present approximate, estimated values. These indices, however, are of great marketing value instead. Specific (“single”) indices are of a specialised nature. They are more difficult to interpret and address the subtle aspects of website and web application functioning. They offer great value to designers and software developers. They indicate critical spots which affect the website quality. Most of them are expressed precisely, often up to two or three decimal places, in specific units. Algorithmic tests for website quality, whose results are presented using indices, enable a reduction in the cost intensiveness of tests as well as an increase in their number and frequency, as the tests are repetitive and their number is not limited. What is more, they allow the results to be compared.

1. Introduction

The quality of websites and web applications has always been very important, regardless of the area of applications. Over the years, this quality has been perceived differently. With the advent of mobile devices, attributes such as performance and usability as well as the range of applications and the search engine optimisation level have gained in importance. The use of the Internet on various levels, including broadly understood communication, has resulted in the quality of both the content and its presentation becoming more important. The broadly understood quality of a website has become a source of competitive advantage for the operators being able to provide and maintain it [1]. The list of attributes that define website quality is very long and appears to still be incomplete.
In order to provide and maintain a high website quality, it is required to specify what value of a particular attribute or what number of particular objects (as well as their application or failure to apply) indicates a “high value” of a website. Consequently, a number of quality indices were formed, that were very diverse and expressed in various, more or less precise units. The values of selected indices can only be recorded manually, while the values of others are recorded algorithmically. This resulted in the emergence of numerous applications which enabled automated quality measurement. In this way, it became clear that the quality of a website can be measured and described [2]. The aim of this study is to provide an overview of indices whose measurement may be helpful in assessing the quality of a website. This study focused on the indices which are often taken into account when carrying out website audits.
In the first place, the concept of “website quality” was defined, including the role served by standards and design guidelines in quality assurance. In order to facilitate understanding of what a “high-quality website” is, specifications for such a website were prepared, and an overview of research into website quality was carried out. Further on, it was demonstrated that various types of indices are helpful in quality assurance; they were divided and characterised, and their advantages and disadvantages were specified. Moreover, a discussion was started on how to interpret the values of aggregated indices.

2. Website Quality

The quality of a website is reflected on many planes, starting from the development technique and ending up with the content. The concept of website quality is particularly broad-ranging and ambiguous; it can be analysed in the technical, economic, ergonomic and legal context. In technical terms, quality is specified without reference to the customer. The standard is a norm, a set of guidelines or good practices. High technical quality means that a particular product only slightly deviates from the well-known technical standards. The extension of the strictly technical approach to include the user/purchaser enables the specification of quality in technical and economic terms as the preference of certain characteristics which should be assigned to products in order for them to meet users’ expectations [3]. From the consumer’s point of view, quality means meeting the needs, which can be divided into functional and non-functional. As regards websites, functional needs are directly related to the scope of operations that can be carried out using them. Non-functional needs are related to website use, operation or availability, and include the convenience of use. Non-functional needs also relate to aesthetics, ergonomics and the image as well as flexibility (multi-platformness, responsiveness), performance, interoperability and security [4].
Of the many meanings of the word “quality,” two are of critical importance to managing for quality. “Quality” encompasses those product characteristics that meet customers’ needs, and thus make sure that the customers are satisfied. In this sense, the meaning of quality is income-oriented. The goal of “high quality” understood in this way is to ensure greater customer satisfaction, which is supposed to translate into increased income. However, ensuring a “higher number” and/or “higher quality” usually requires investments, and thus usually involves higher costs. In this sense, higher quality usually “costs more”. “Quality” also means freedom from deficiencies—freedom from errors that require doing work over again (rework) or that result in field failures, customer dissatisfaction, customer claims, and so on. In this sense, the meaning of quality is oriented to costs, and higher quality usually “costs less” [3].
Just with almost everything else, the concept of quality is also fundamental to software engineering, and both functional and non-functional characteristics must be taken into consideration in the development of a quality software system [4]. This also applies to websites and web applications.
Web applications have been used by many firms. Thus, it is crucial to know whether a firm’s website is giving an added advantage that could trigger online purchase intention [5]. For companies using their website for transaction generation, website quality may have a major impact on sales. Therefore, it is important to understand the dimensions of website quality so that sites can be developed to facilitate the online interaction between a consumer and the company. The website quality is a multidimensional construct [6]. The website quality influences consumers’ perceptions of product quality, which subsequently affects online purchase intentions [7].
The analytical results show that website design, interactivity, informativeness, security responsiveness, and trust affect customer satisfaction, while empathy does not have a statistically significant effect on customer satisfaction. Overall, system quality, information quality, and service quality are important antecedents of customer satisfaction [8]. Selected website functions are necessary but insufficient to induce a positive perception or prevent a negative perception of website quality, while other functions are not necessary but increase a positive perception of website quality. Zhang and von Dran [9] collected an extensive list of 42 website quality attributes which they grouped into eleven categories: (1) information content, (2) cognitive outcomes, (3) enjoyment, (4) privacy, (5) user empowerment, (6) visual appearance, (7) technical support, (8) navigation, (9) organisation of information, (10) credibility, and (11) impartiality. Loiacono [10] examined the quality of websites selling goods and services (books, music CDs, airline tickets, hotel reservations) and demonstrated that website quality was represented by 12 unique dimensions: (1) informational fit-to-task, (2) tailored communication, (3) ease of understanding, (4) intuitive operations, (5) response time, (6) visual appeal, (7) innovativeness, (8) emotional appeal, (9) trust, (10) online completeness, (11) relative advantage, and (12) consistent image.
The website quality is affected by many factors (Figure 1), which can be divided into two main groups: (1) on-site, which relate to the quality in use of a website and its content e.g., the quality and usefulness of contents and the way they are presented, and (2) off-site, which relate to the website’s environment e.g., the number of incoming links, and the number of signals in social media.
The better a website, the more backlinks i.e., external recommendations it contains. The same is true of “social media”. The better a website, the more references to it can be found in social media. Therefore, the specific “website strength” within the web ecosystem results, in a way, from the quality of the website itself (the on-site quality). The higher the quality of on-site attributes, the stronger the website’s position within the web ecosystem (the off-site quality) is. The off-site quality may affect the size of the selected global indices and stimulate the improvement in the on-site quality. In a certain sense, this is a “closed circuit”; however ultimately, the website quality is always determined by a human (administrator, editorial team, publisher, programmers etc., depending on the website).
Numerous website quality indices are closely related to search engine optimisation (SEO). Search engine optimisation (SEO) is a set of processes aimed at the improvement of website visibility in free-of-charge search results. SEO involves reorganising a website in such a way so as to encourage long-term content browsing, increase users’ involvement, generate sessions with multiple page views, and encourage users to go deeper into the website [11].

2.1. Design Standards and Guidelines

The foundation for meeting the minimum quality standards is compliance with regulations providing technical requirements. Due to the specificity of promotion and sales conducted via websites, it is the website design and development technique and the safety of website used that are of particular importance. The proper operation of a website is determined by the use of a specific technology and server infrastructure. In technological terms, website quality should be considered with regard to the following: (1) development technique including the website components and design standards, (2) availability understood as technical reliability, or visibility in search results as well as accessibility to persons with disabilities, (3) security as regards e.g., data encryption, monitoring and use of cybercrime safeguards as well as data backup and logging. Standards and regulations applicable to ensuring website quality can be divided into the following [12]:
  • de jure standards—ISO standards and other standards approved by an authorised organisational unit; documents laying down, inter alia, the principles, requirements, characteristics, parameters, methods or rule ensuring quality of a particular component, or other normative documents of legal regulation nature;
  • de facto standards—customary solutions which do not result from formal arrangements but, however, are often regarded as standard ones, for example the use of a particular graphic or colour to mark objects intended for a specific purpose.
For most users, the following three aspects of a system’s quality in use are most important: (1) functionality, understood as a range of activities that can be performed using the system; (2) ergonomics, understood as the possibility for achieving specified goals with the least possible effort, and (3) usability, i.e., the resultant of the extent of the specified goal achievement, the effort spent in the process, and the perceived level of satisfaction from use [12]. Functionality refers to the contents of a website, while usability relates to issues of design. More specifically, functionality relates to the information richness of a website, whereas usability refers to the degree of ease with which users can use a website [13].
While selected guidelines concerning website development are precisely described and made available in the form of technical and design documentation, others are not made public. These primarily include all attributes responsible for a website’s placement in search results.
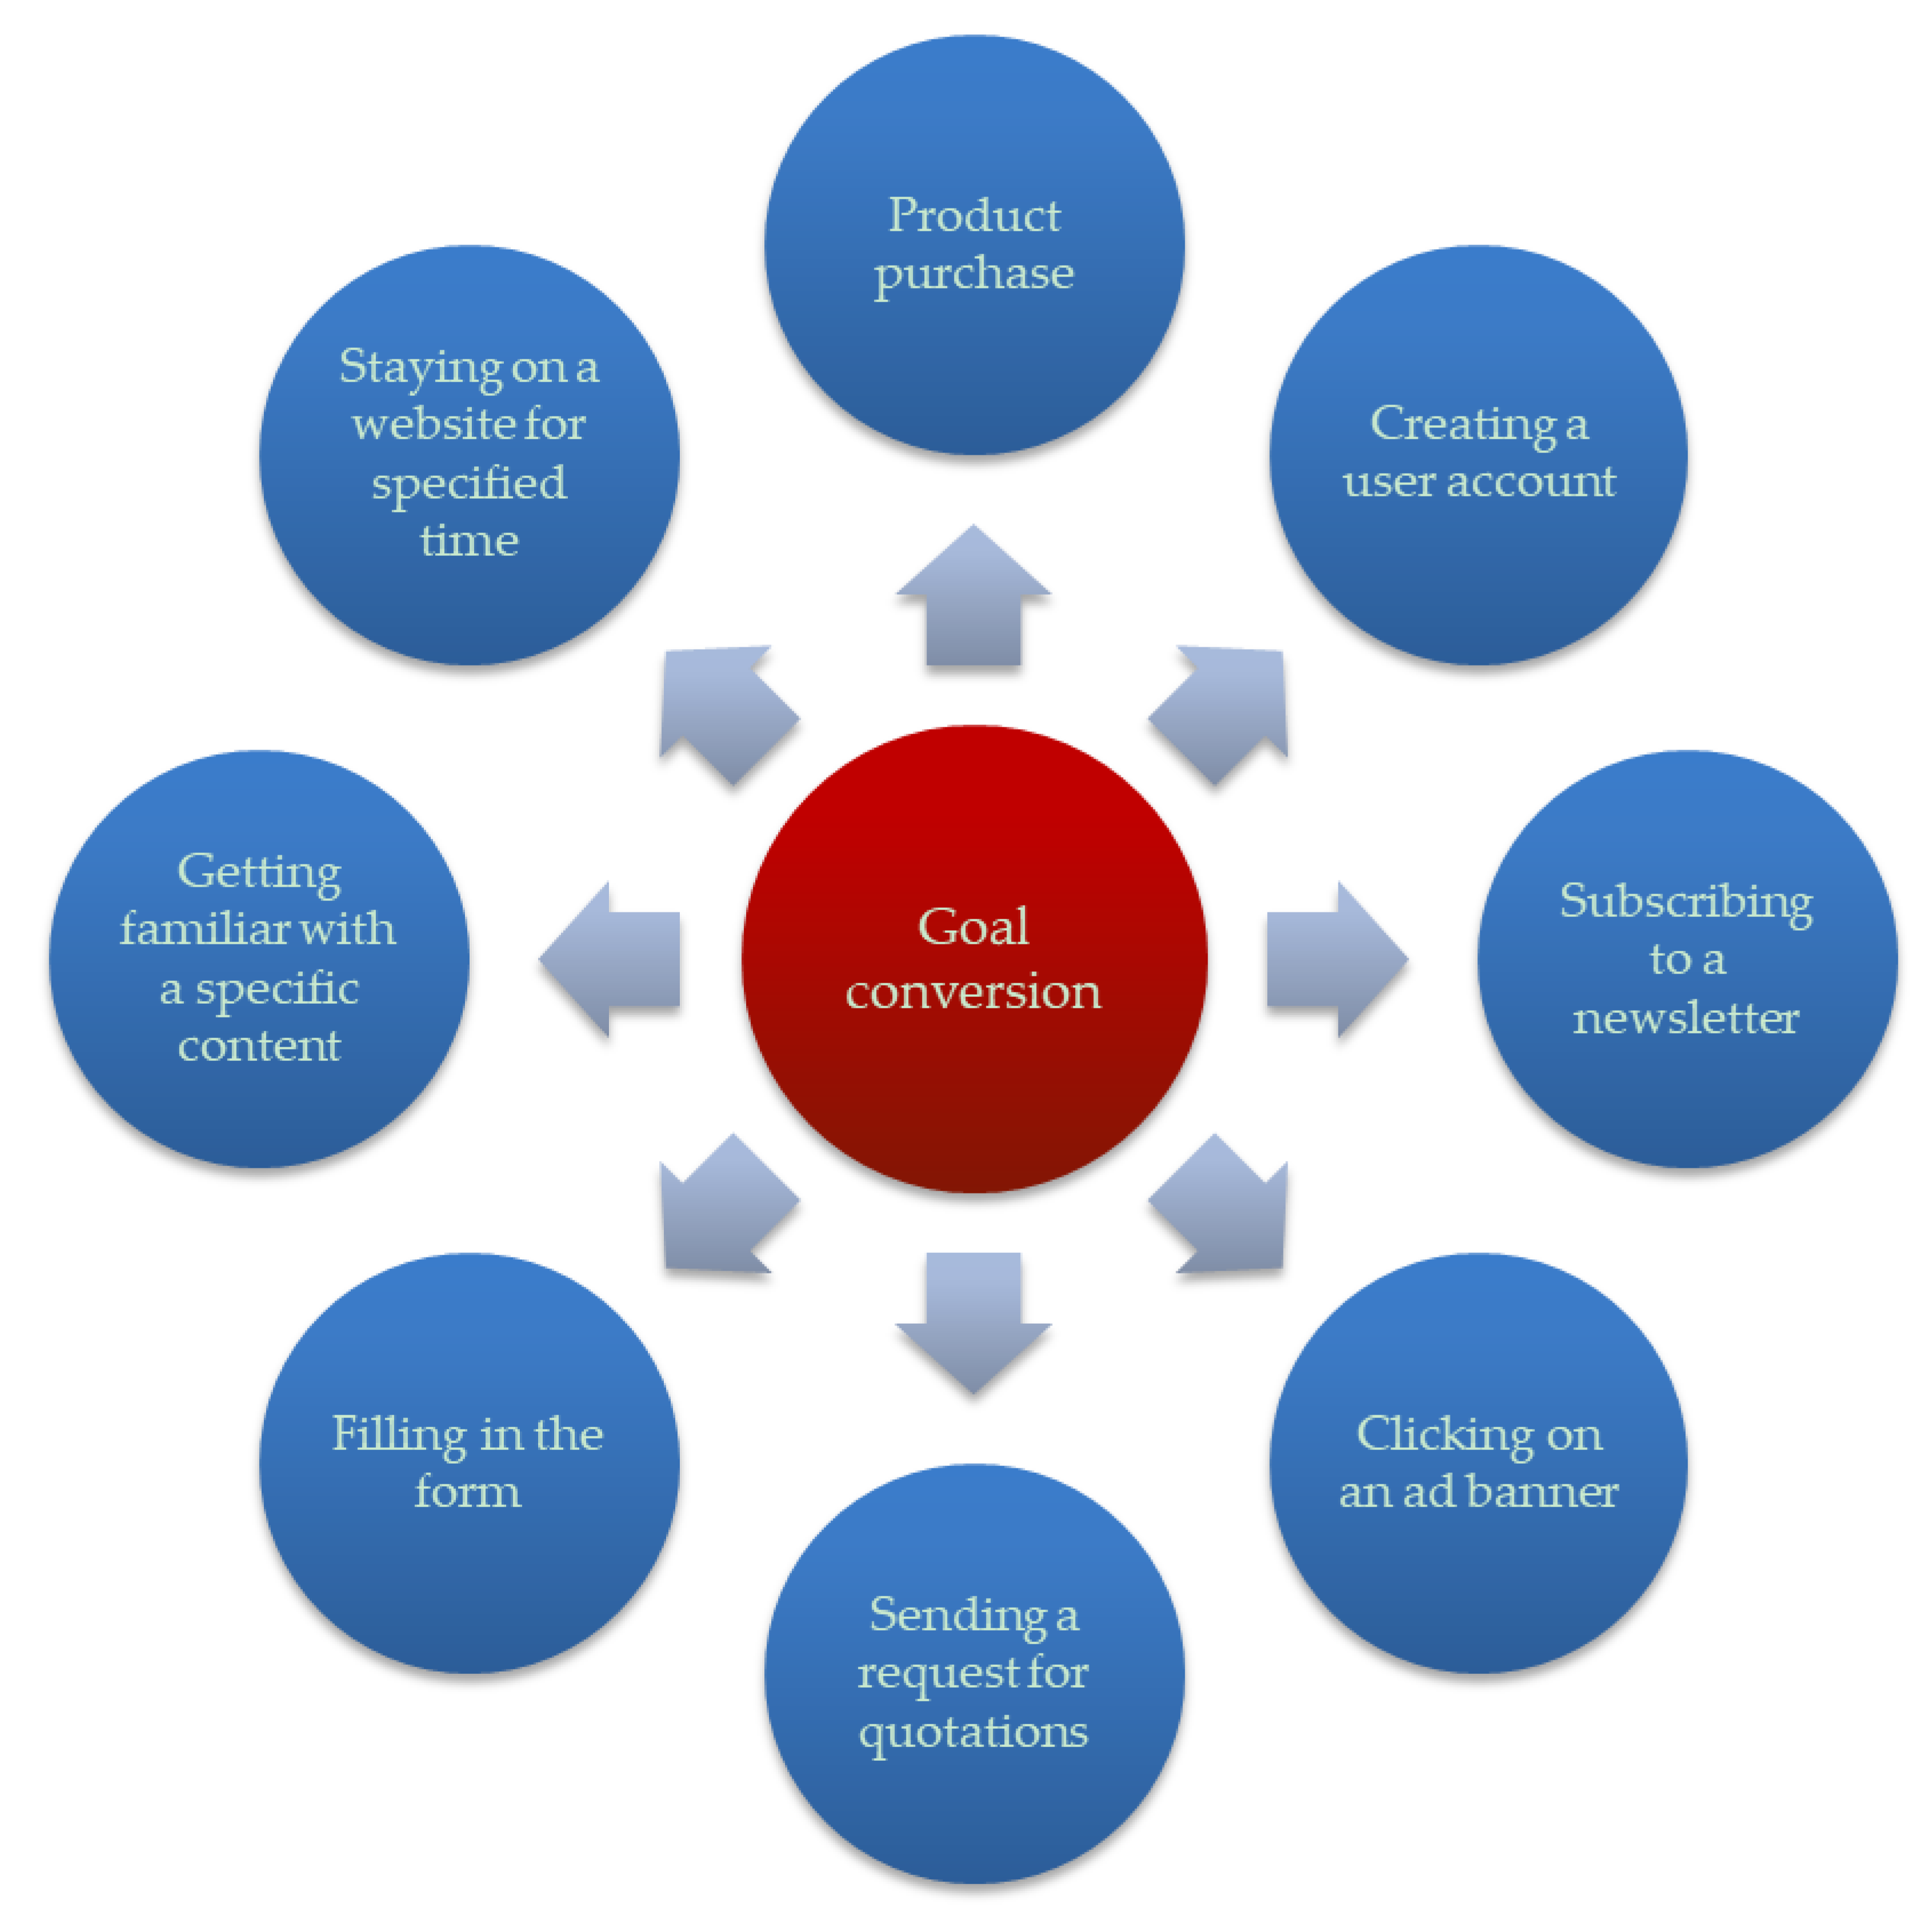
Websites are developed for a specific goal. This goal is usually included within the functions to be served by the website. The goals that can be achieved using a website include e.g., introducing the user to a specific message, a user’s visit to a specific website, e.g., one with an offer or a price list, filling in a contact form, purchasing a product or booking a service. The performance of a specified (expected) action by the user is referred to as “goal conversion” (Figure 2).
Goal conversion is the “transition from browsing content to doing shopping”, “transformation of a visitor into a buyer [14]. Goal conversion occurs when a website user performs a specific action—the website is designed to enable, encourage, persuade and induce the user to do so.

2.2. High-Quality Website Specification

Website quality is related to efficiency and effectiveness. Efficiency is one of the basic categories used to describe the condition, operation and development opportunities of various types of organisations. The concept of efficiency most often refers to the rational management principle and includes maximising the effect while minimising expenditure. Efficiency refers to doing things right, while effectiveness refers to doing the right things [15]. Efficiency is also a metric of website and web application quality. In this context, it is most often considered equivalent to performance (specific technical efficiency), often associated with the rate of website loading in a browser window [16], but also with sales effectiveness, understood as goal conversion [14].
High website quality has a direct and positive effect on the customer’s satisfaction, and the customer’s satisfaction has a direct and positive effect on the intention to purchase [13]. A high-quality website is usable and useful. The usability and usefulness of a website may affect the satisfaction of using it, develop users’ loyalty and increase goal conversion [17]. Usability means the convenience of website use [18]. Currently, when most users browse websites on mobile devices, usability is related to the responsiveness which enables convenient browsing of a website regardless of the size of the device with Internet access [19]. The browsing convenience is also determined by the website rendering rate. Therefore, a “high-quality” website is a high-performance one which loads fast in a browser window [20]. The convenience of use is also determined by the graphical interface design [21]. A high-quality website has an attractive design, is aesthetically pleasing, and inspires credibility [22]. Graphic elements e.g., the so-called call to action, may arouse users’ interest and induce them to perform a specific action [23]. A high-quality website produces sensations using multimedia materials (Figure 3). A high-quality website should also be accessible to the disabled [24]. It should be clearly structured and provide information in a way that is clear and understandable to each user. The interface aesthetics and ergonomics, website usability, and the quality of interactions create a belief in customers/users that the service or product quality will be equally good. These factors may also have a tangible effect on website visibility in search results and on goal conversion [25].
A high-quality website provides useful functionalities and is interactive. This means that using the website, a user can perform specific actions, e.g., leave a comment, book or order a service, or purchase a product and pay for it. Interactivity manifests itself in the system’s response to the actions performed by the user. It ensures self-service and allows a particular action to be performed in real time [26]. A high-quality website presents useful and reliable contents edited in simple language [27]. Only useful contents are able to make users find the website and stay on it. Non-updated websites providing little content may be placed at distant positions in search results [28]. A high-quality website presents texts which are properly formatted using headers and numbered lists. These texts are enriched with graphics and video materials [29]. A high-quality website is also promoted on social media, on blogs and specialist fora [30]. Due to all the above-mentioned factors, there are many links from other high-quality websites, which lead to such a website. These links are a specific recommendation [31].
A high-quality website is a monitored website [32], improved and optimised with regard to performance and search engines [33]. Ensuring and maintaining the high quality requires continuous improvement and responding to the changing environment, including changes in search engine algorithms and the competitors’ actions [34]. Therefore, a high-quality website is distinguished by the navigability ergonomics, i.e., the possibility for accessing information quickly; functionality which determines the scope of a particular website’s functions; consistency, i.e., repeatability, integrity of the website structure; simplicity, which means the moderation and the lack of superfluous ads, embellishments and components; readability resulting from the perceptual accessibility of the text and formatting; and supportability, i.e., support for the user in the form of e.g., FAQs, a website map, a search engine etc.

2.3. Research Into Website Quality

Website quality is defined as a multi-dimensional interface stimulating a positive or negative user response that results from the interaction between user and website [35,36]. In the academic literature, website quality has generally been recognised as a critical step to drive business online. As such, numerous studies have been devoted to website quality and evaluations. These studies have been carried out in various areas and to a different extent. Bai et al. [13] developed and tested a model of the website quality effect on customers’ satisfaction and the intention to purchase. They also demonstrated that website quality had a direct and positive effect on the customer’s satisfaction, and the customer’s satisfaction had a direct and positive effect on the intention to purchase. Liu et al. [37] identified certain crucial design factors for e-commerce websites. These factors included e.g., information quality, services quality, design quality, and the convenience of use. In their study, Liu et al. [37] demonstrated that a well-designed website evoked a favourable attitude towards the producer/brand and the products/services offered.
Giannakoulopoulos et al. [11] examined the relationships between academic excellence, website quality, and SEO performance. They assessed website quality and search engine optimisation (SEO) performance of university websites of the top 100 universities in the Academic Ranking of World Universities (ARWU) Shanghai list. The websites were tested on three planes: (1) website structure (validity of HTML; validity of CSS; Google’s mobile friendliness test; and Google lighthouse best practices audit), (2) website accessibility (WCAG 2.0 compatibility problems as indicated by aChecker; WCAG 2.0 compatibility problems as indicated by the WAVE accessibility tool, and Google Lighthouse accessibility audit), and (3) website performance (performance indices WebPagetest, Google PageSpeed Insights for cell phones and computers). They also carried out SEO tests using five selected web tools. The results were aggregated and represented as indices. For example, based on the adopted attributes, they developed a consolidated website structure evaluation metric. Various aspects were consolidated in a single metric of website accessibility assessment. This single metric was calculated as a weighted average of all individual metrics.
Joury et al. [38] examined 27 websites supporting the diagnostics of persons with chest pain symptoms. They assessed the websites using the following tools: DISCERN [39,40], JAMA benchmarks [41], HONcode, website readability (automated algorithms available at https://readable.com), popularity of the websites (using https://www.alexa.com), and LIDA instrument. They demonstrated that the quality of websites varied. Many websites were unreliable. What is more, in many cases, the information made available was too specialised, which made them difficult to understand. On the other hand, Dueppen et al. [42] used the DISCERN tool to investigate the English-language Internet information related to vocal hygiene, vocal health, and prevention of voice disorders. Although websites for people with voice disorders were of a satisfactory quality, the researchers concluded that highly rated Internet information related to voice care should be made more accessible to voice clients through Health on the Net Certification.
Galati et al. [43] analysed the quality of 84 websites of Italian vineyards. They made use of the assumptions of the Web Assessment Index (WAI) model [44] which is comprised of five components—categories, factors, weights, ratings and total score—and is based on a limited number of attributes pooled in four broad categories—accessibility, speed, navigability and site content. The researchers searched for a link between website quality and the revenues from business activity and managers’ characteristic features. Moreover, they demonstrated that e-commerce websites were usually of higher quality than e-marketing websites, and business revenues and the managers’ education level had a positive effect on the quality of websites. The WAI model was also used in the assessment of e-banking [45], municipal web sites [46], rural firms’ websites [47], and restaurant websites [48]. For the assessment of website quality, Ecer [49] proposed using a hybrid model comprised of the analytic hierarchy process (AHP) [50] and complex proportional assessment of alternatives with grey relations (COPRAS-G) [51]. The studies demonstrated the great importance of the weights of particular criteria in the assessment of website quality.
The quality of a website translates into usefulness for customers, which develops trust in sellers and producers. Therefore, website quality may have a direct effect on the efficiency of business activity. A reliable assessment of website quality is of importance to business owners, as its results allow them to make decisions on modifications to enhance website effectiveness [52]. Table 1 lists the criteria considered in the research into website quality in different sectors.
Hsu et al. [64] examined the usability and functionality of websites of Taiwanese local health centres (LHCs). They verified inter alia the completeness of information, interactivity, and links to external resources. What is more, they assessed selected technical attributes of the websites, including accessibility and efficiency. In the study, they used statistical methods as well. They showed that most LHCs in Taiwan do not seem to take full advantage of the Internet, with their websites typically serving as static bulletin boards instead of new channels of communication. Saverimoutou et al. [65] pointed out that the quality of experience (QoE) is of major interest to large service-providing companies and web browser providers. They demonstrated that there was a strong need to measure the temporal quality of web browsing by using user-representative web browsers, different Internet protocols and types of residential network access. The results of such measurements may provide information as to which parameters are likely to affect the current quality of website browsing. Garcia-Madariaga et al. [66] demonstrated that website quality played a determinant role in users’ behavioural outcomes. Moreover, website quality has the potential of influencing e-loyalty, trust and perceived control. In addition, trust has a positive influence on e-loyalty and perceived control, on trust. Dueppen et al. [42] examined the quality and readability of English-language internet information for voice disorders. Law [67] reviewed website evaluation models and pointed out that in recent years, website audits have most frequently focused on content quality. On the other hand, Windhager et al. [68] demonstrated that the quality of data and the quality of their visualisation were of significance in the presentation of large data sets.
The quality of websites is assessed using survey questionnaires and expert assessments. Specialised software, the so-called validators which perform analyses by automated means, is also used [69,70].

3. Materials and Methods

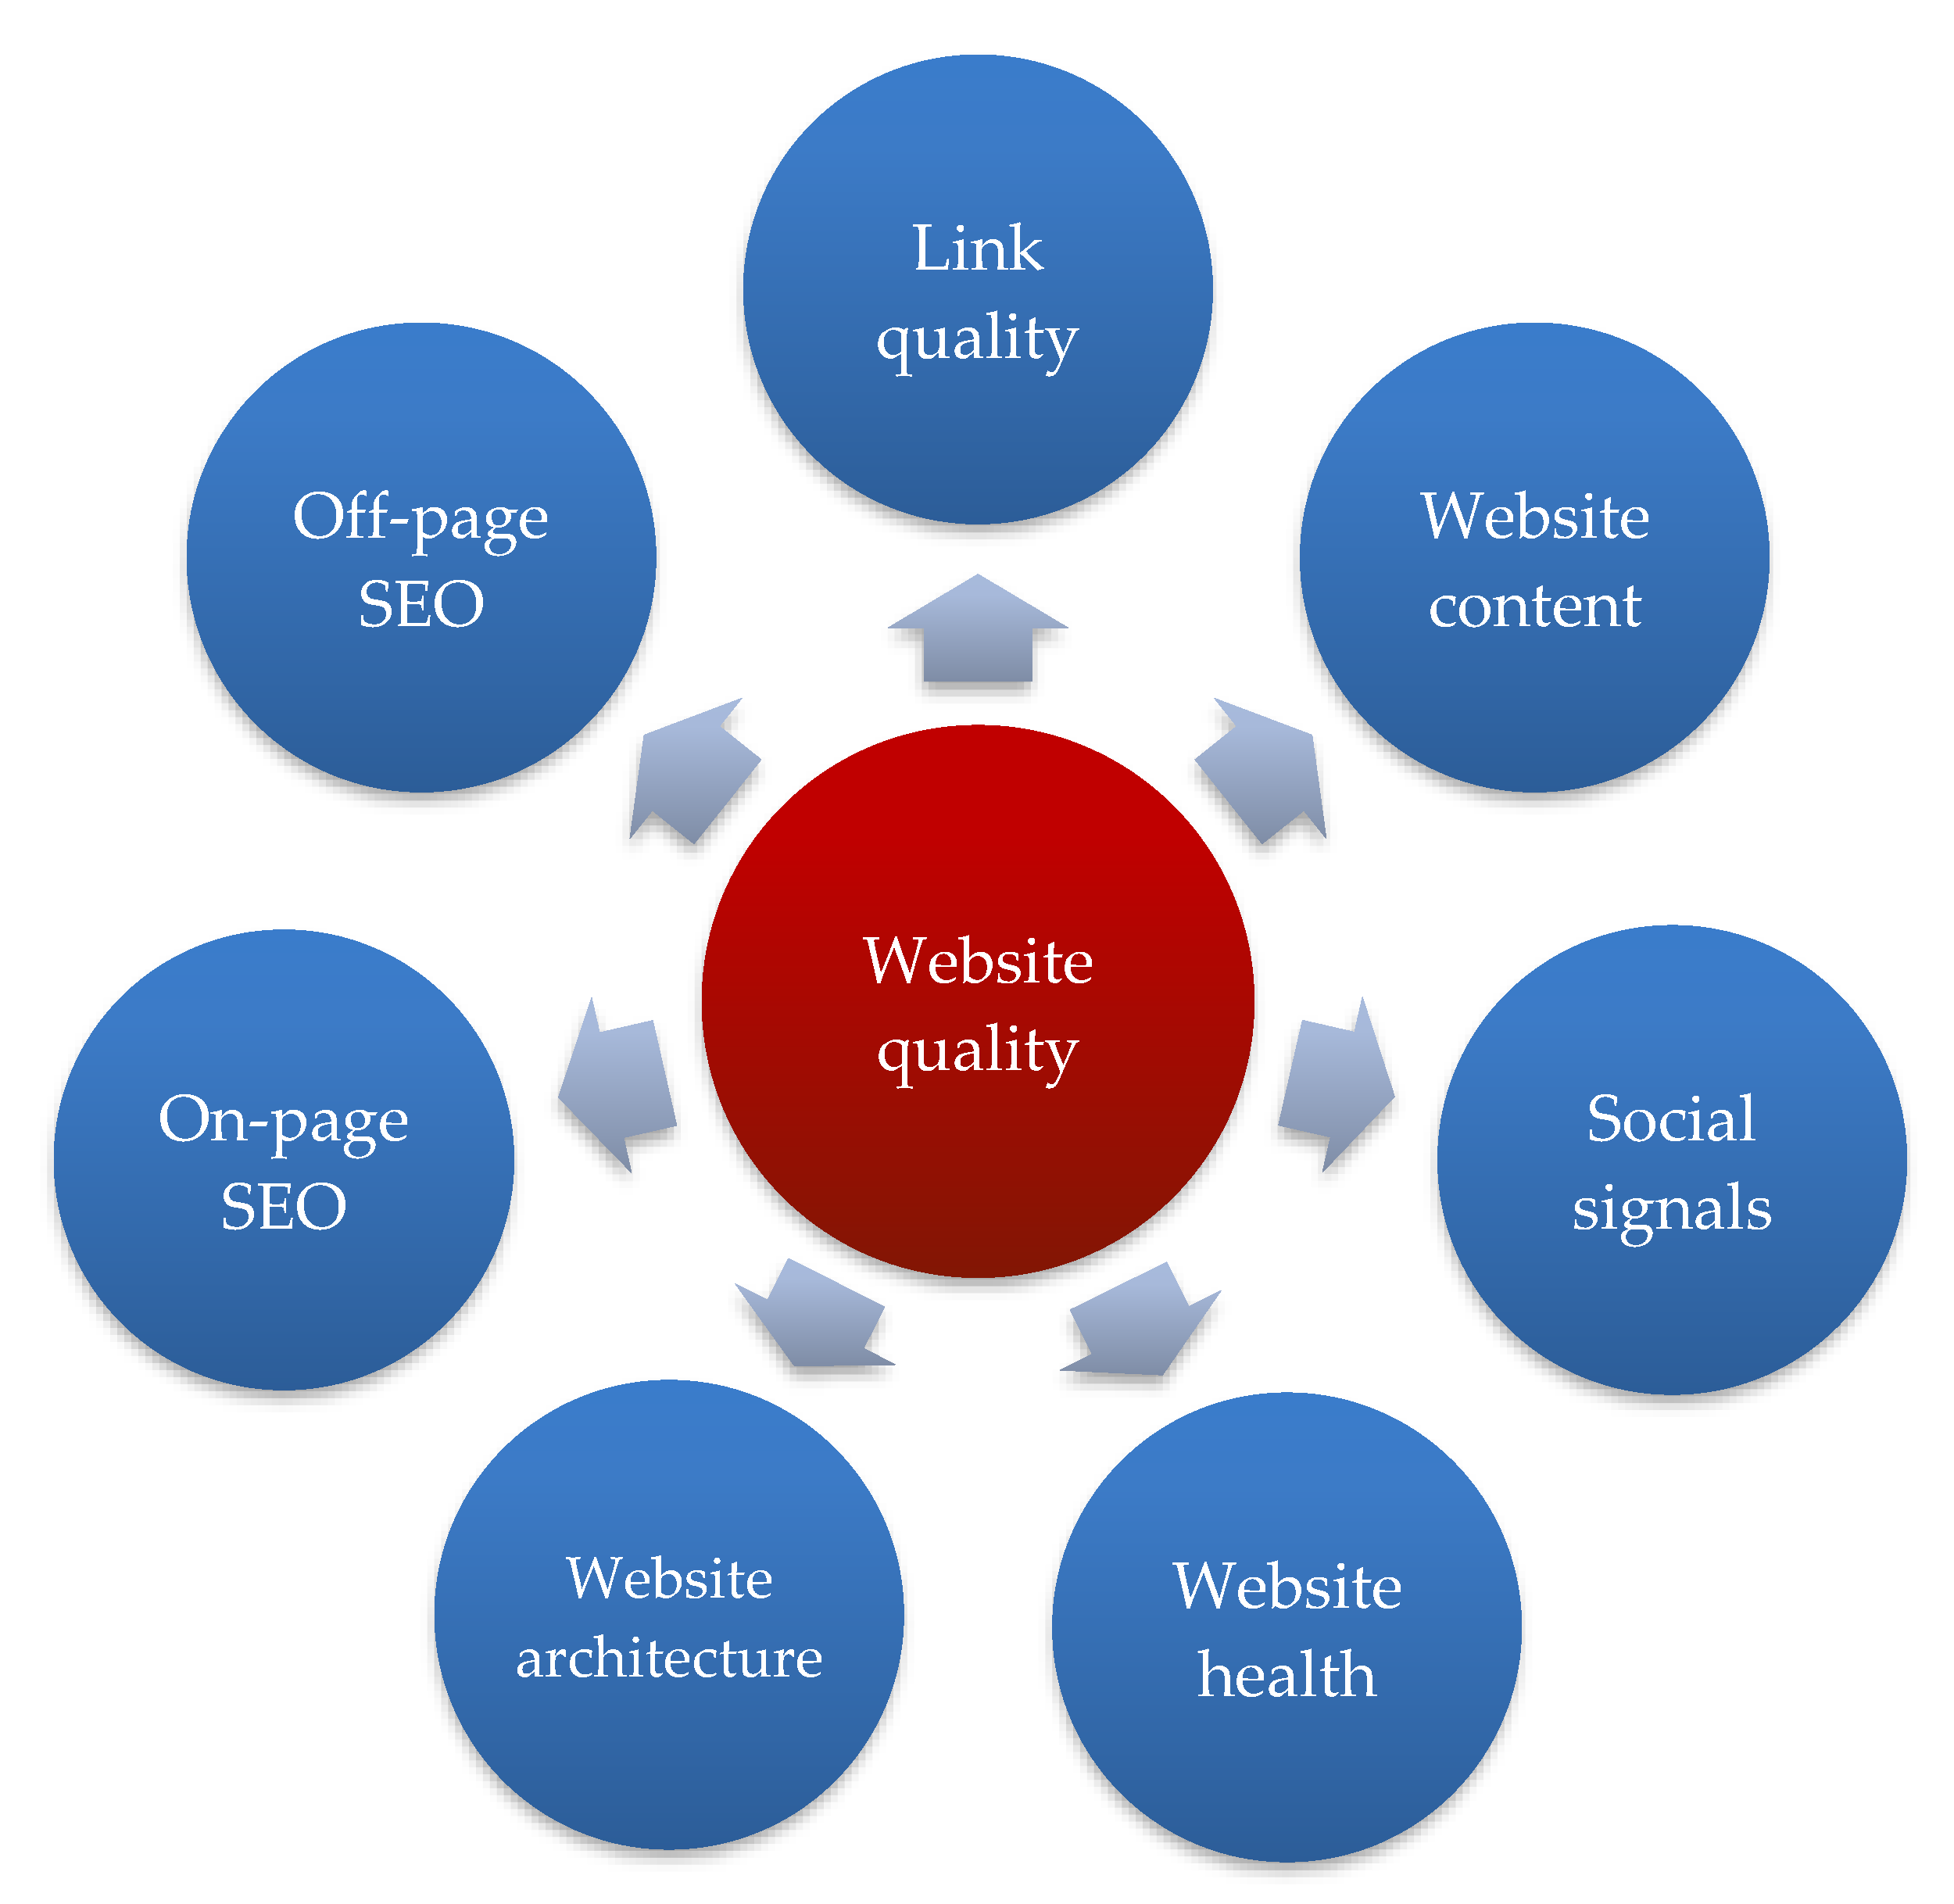
Aggregated website quality indices were characterised based on a review of various source materials including the academic literature and Internet materials. The overview focused on synthetic notes which enable the comparison of multiple websites or the comparison of results obtained using various testing tools. Selected applications available free of charge and run in a web browser (free SEO webservices) were taken into account; however, it should be stressed at this point that there are also applications extending browser functionality (free SEO browser extensions), and installed on computers (free SEO desktop tools). The overview of indices and the analysis of testing tools were carried out in six categories (Figure 4), which were selected for their crucial significance in ensuring website quality.
Search engine optimisation (SEO), performance, content quality, link quality, website accessibility for the disabled, and the website location within the Internet ecosystem (the global potential)—all these factors determine the website quality and can translate into business success. The refinement of such website attributes such as contents, metainformation, browsing convenience on mobile devices, the number of Internet recommendations including backlinks, and the presence in social media is responsible for the broadly understood website quality. Not without significance is the website performance, which is particularly important in the age of mobile devices. “Content is King” is a phrase known to every marketing specialist, which only strengthens the belief that website quality results from valuable contents. However, even the best contents will remain unnoticed if no website refers to them. That is why it is so important to build the so-called link resource base containing links from high-quality websites. Not only does Google search engine’s algorithm promote websites that are responsive, efficient and rich in content; website accessibility for the disabled is also of importance. Most of these attributes can be described using quality indices whose value can be precisely measured. Moreover, most of these attributes build the website’s global potential within the web ecosystem. Great “global potential” results from the high quality of a website.

4. Results

Many tools that are used to carry out various tests by automated means, including website audits, make use of indices. These indices synthetically refer to the attributes describing the website quality e.g., the SEO level or performance. Final notes speak to the customer’s imagination in a special way, as they reflect the scale of a particular phenomenon’s intensity in an accessible manner. They often summarise measurements and, last but not least, are practical. They enable the development of a website ranking, or the grouping of websites into quality ranges.

4.1. The Form of Presentation Matters

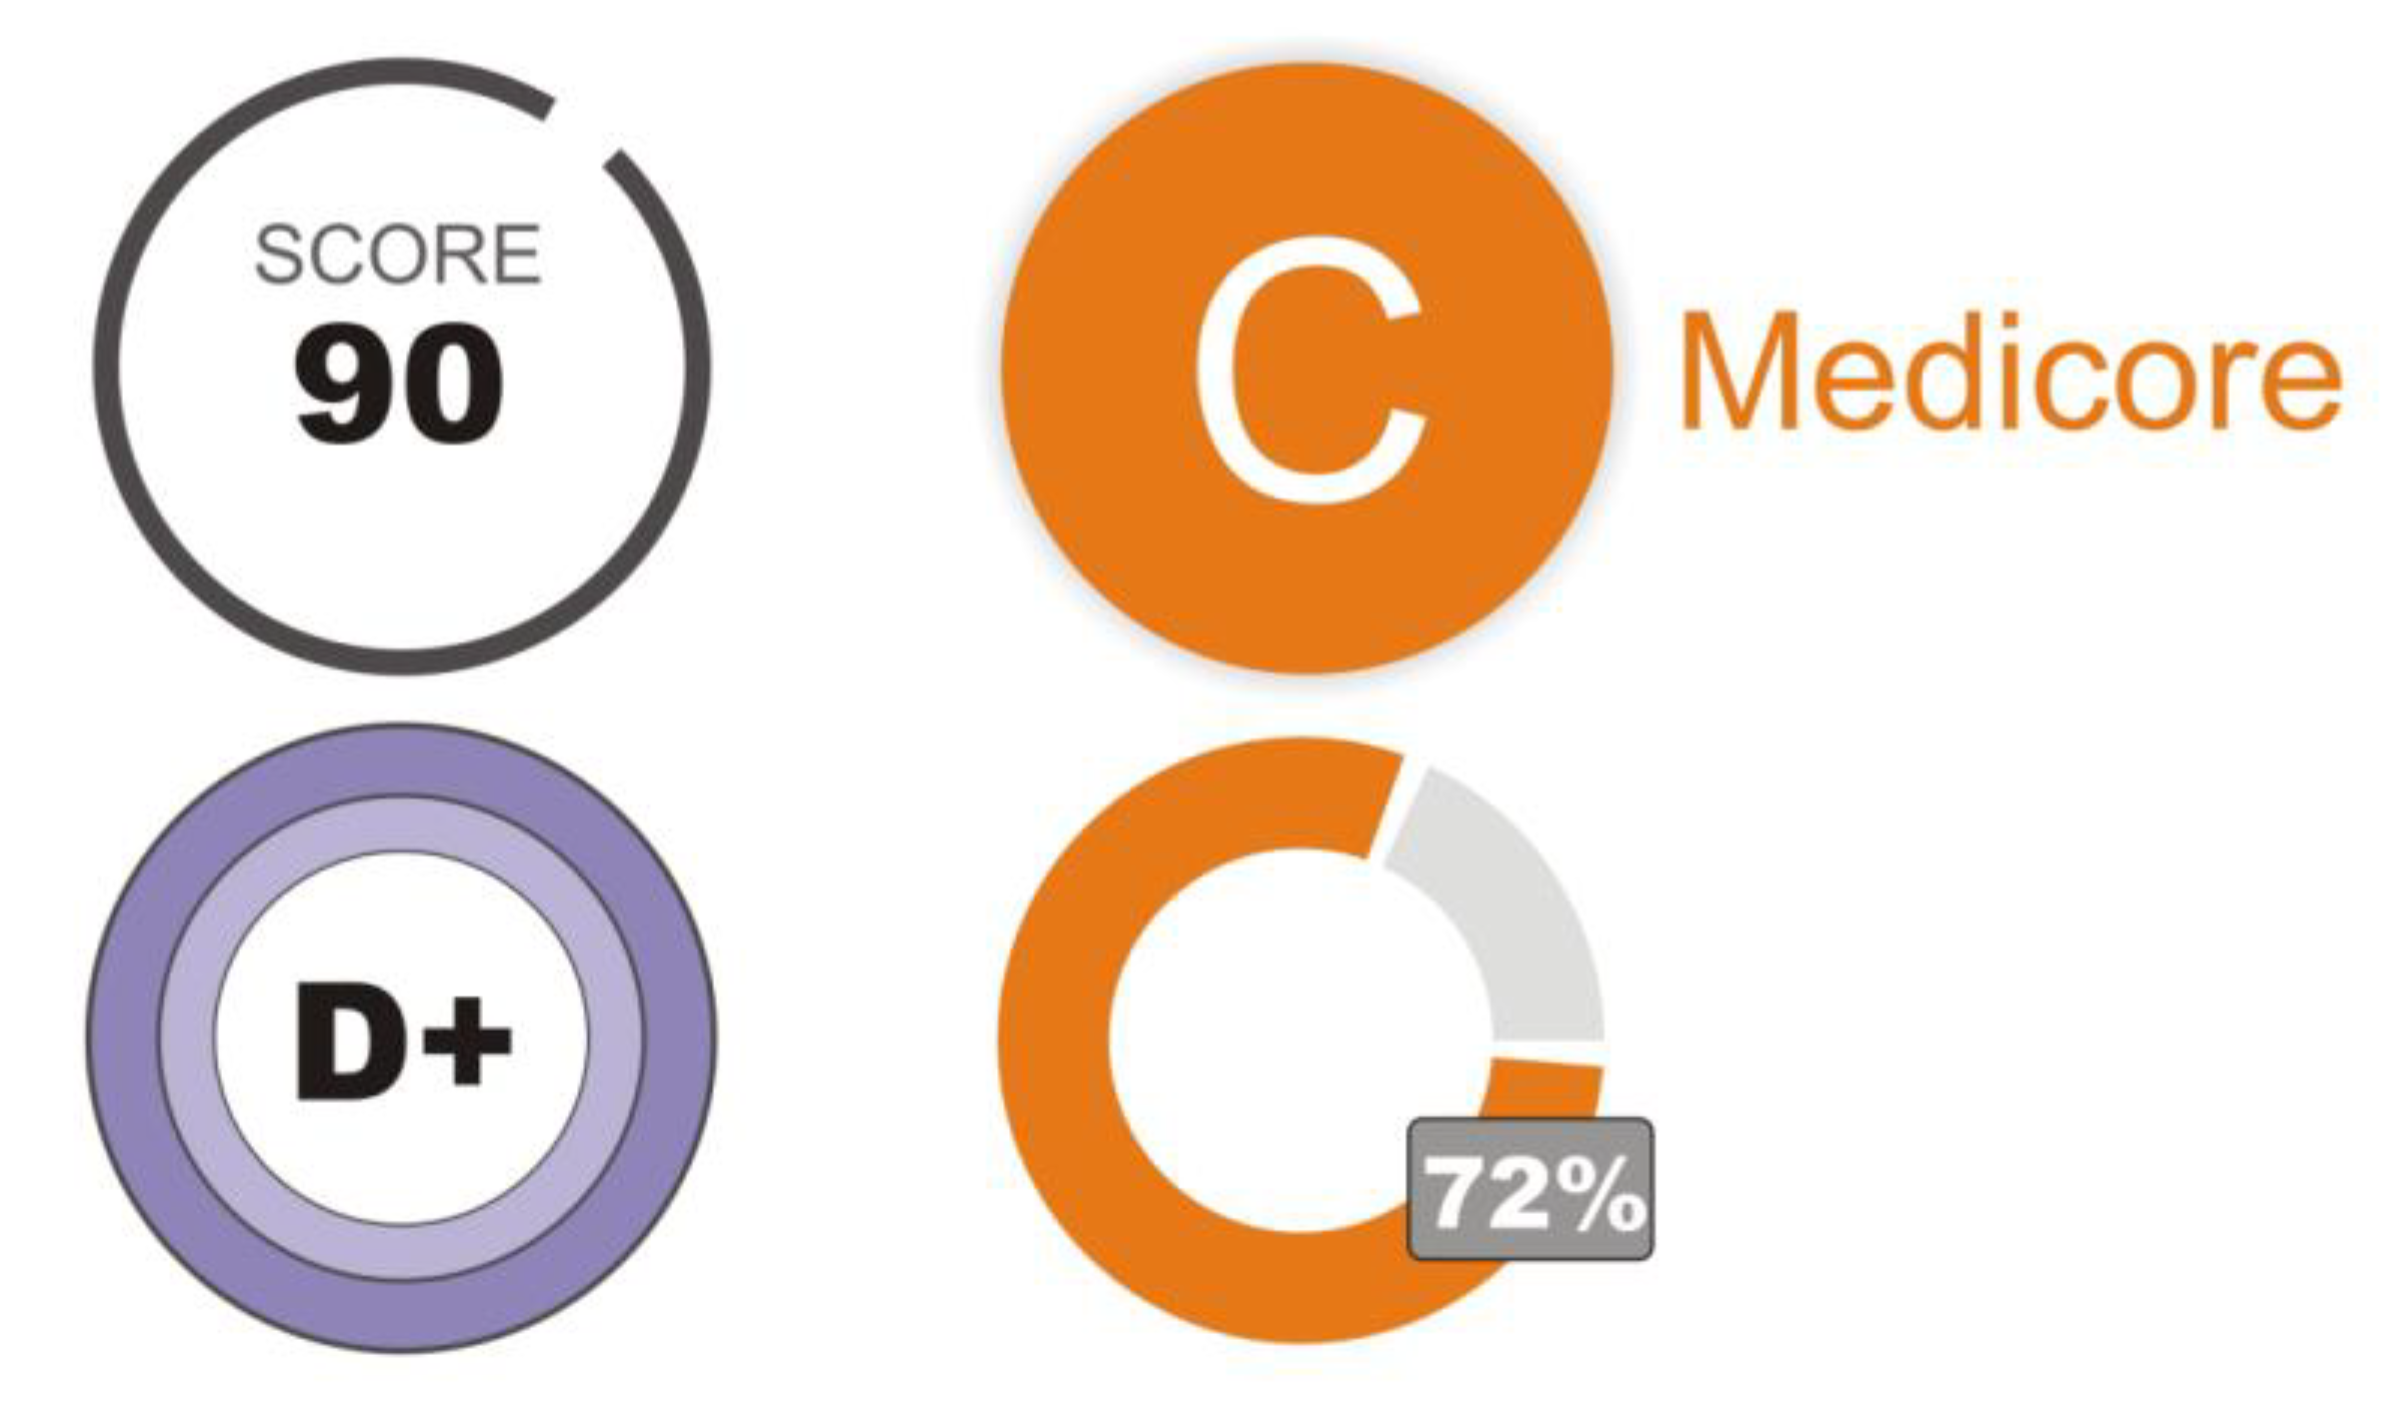
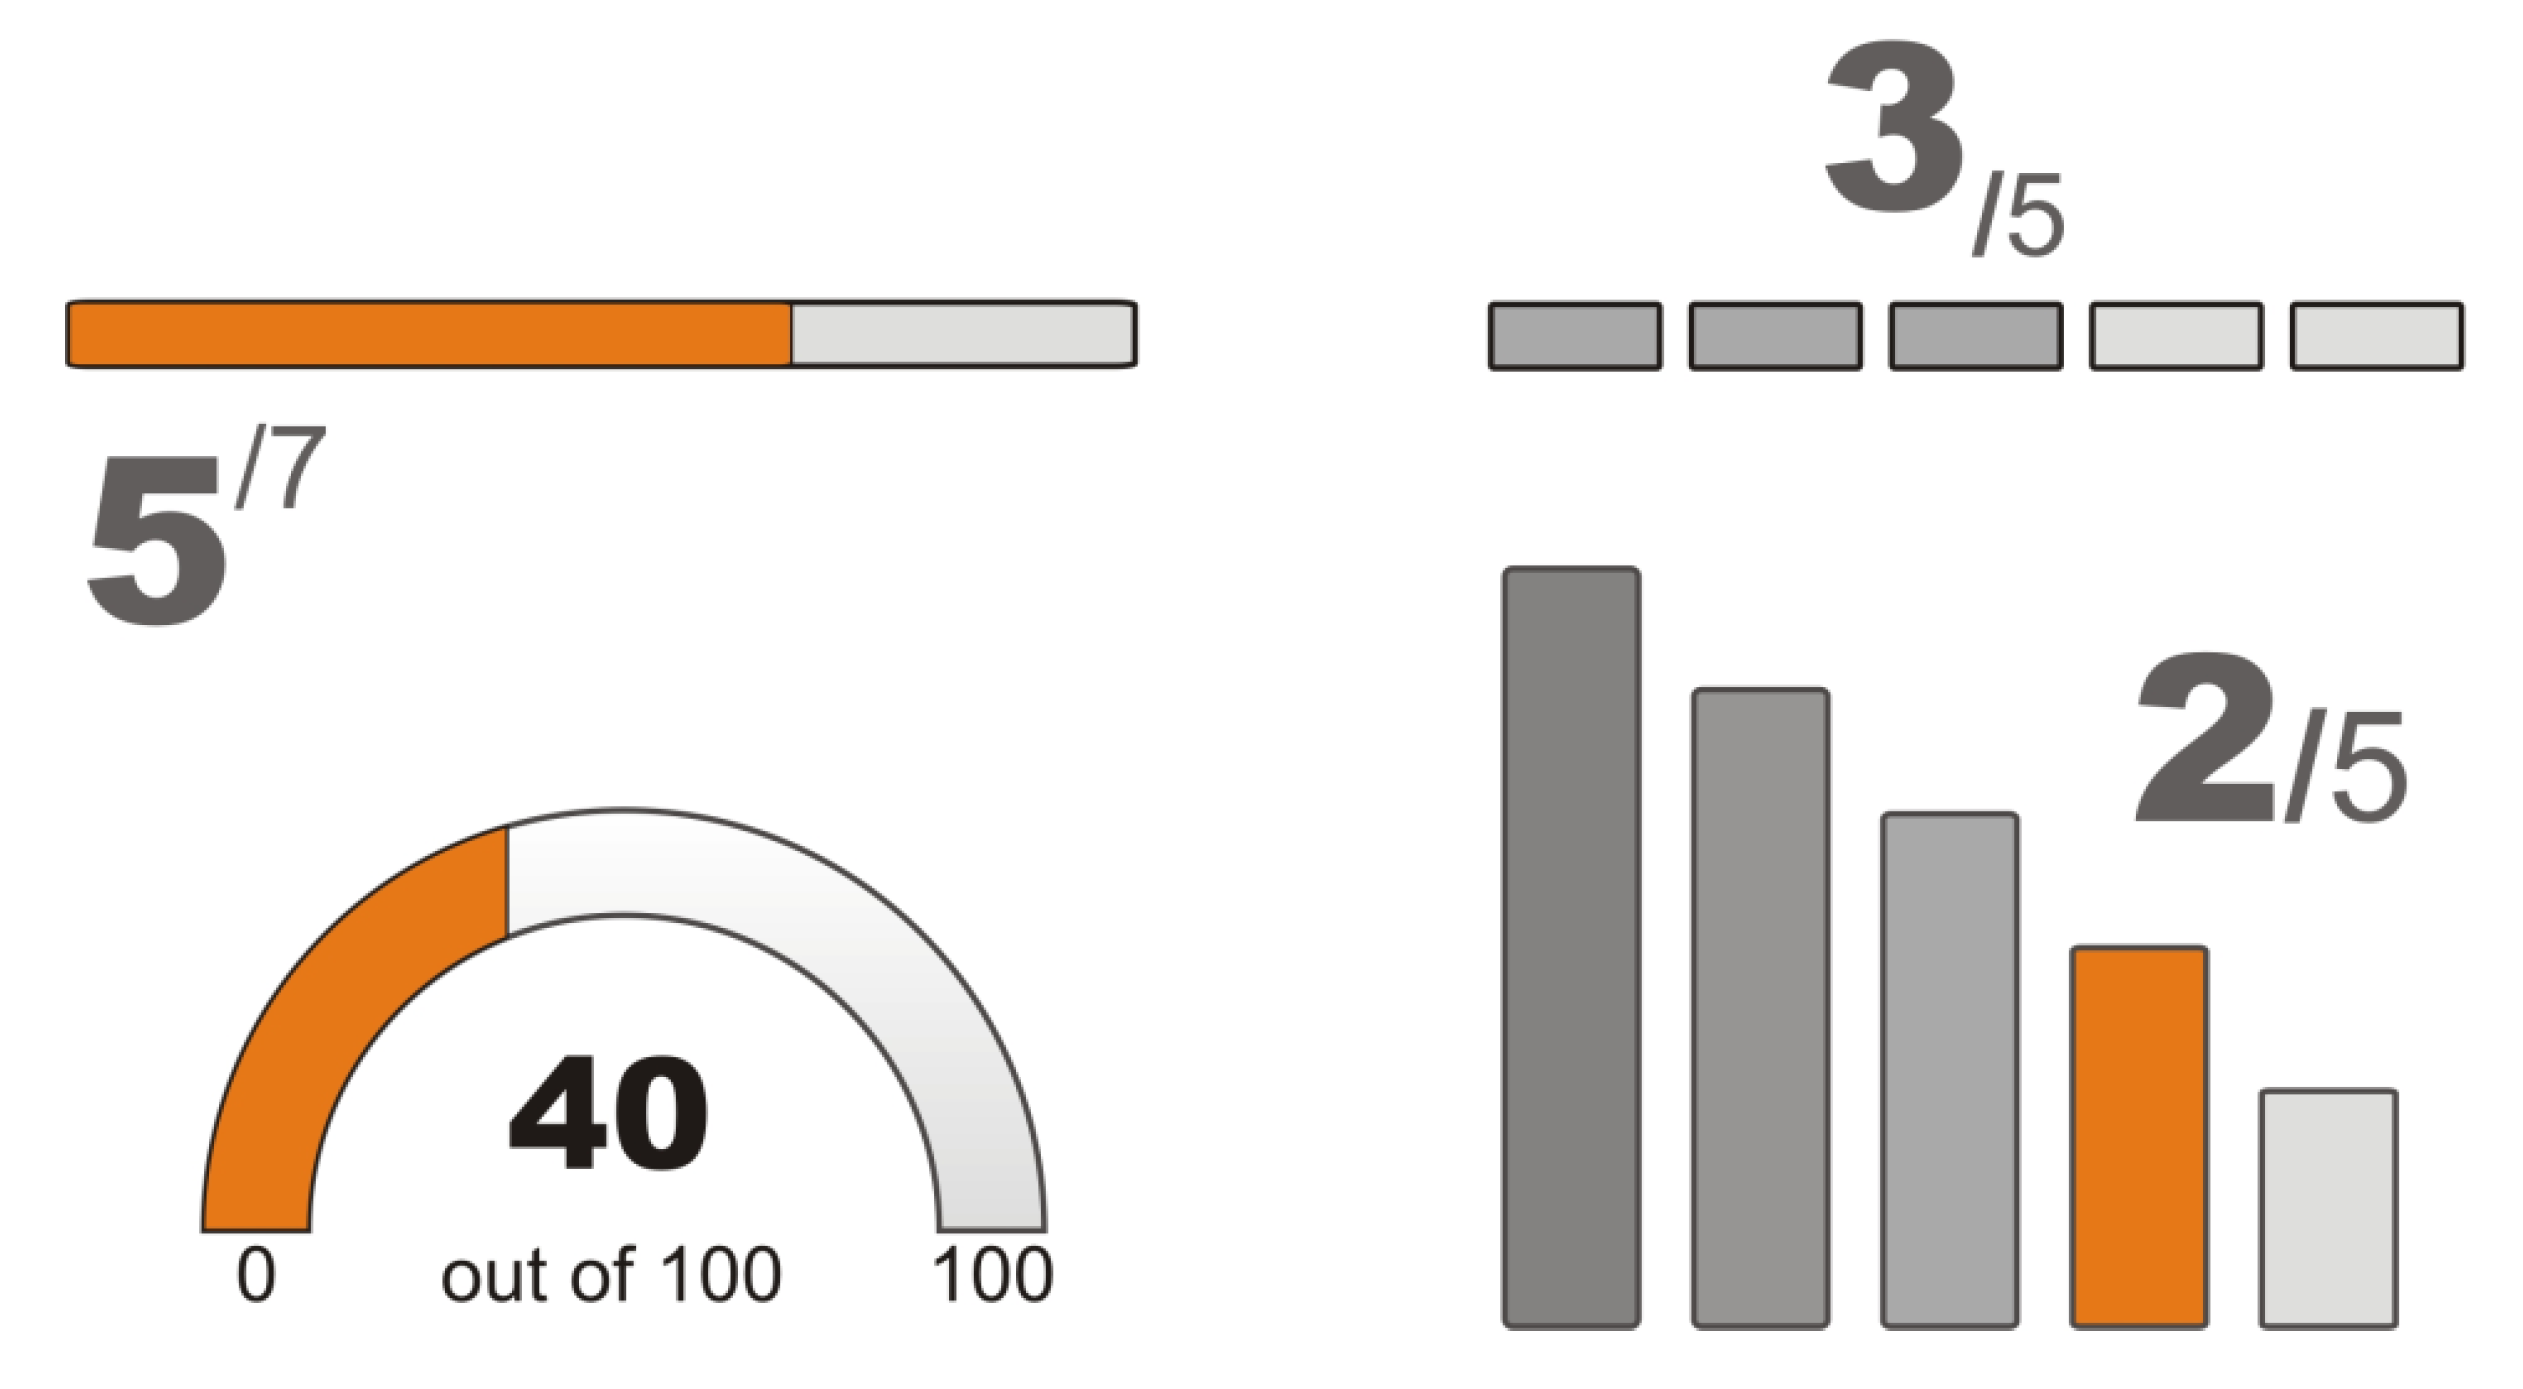
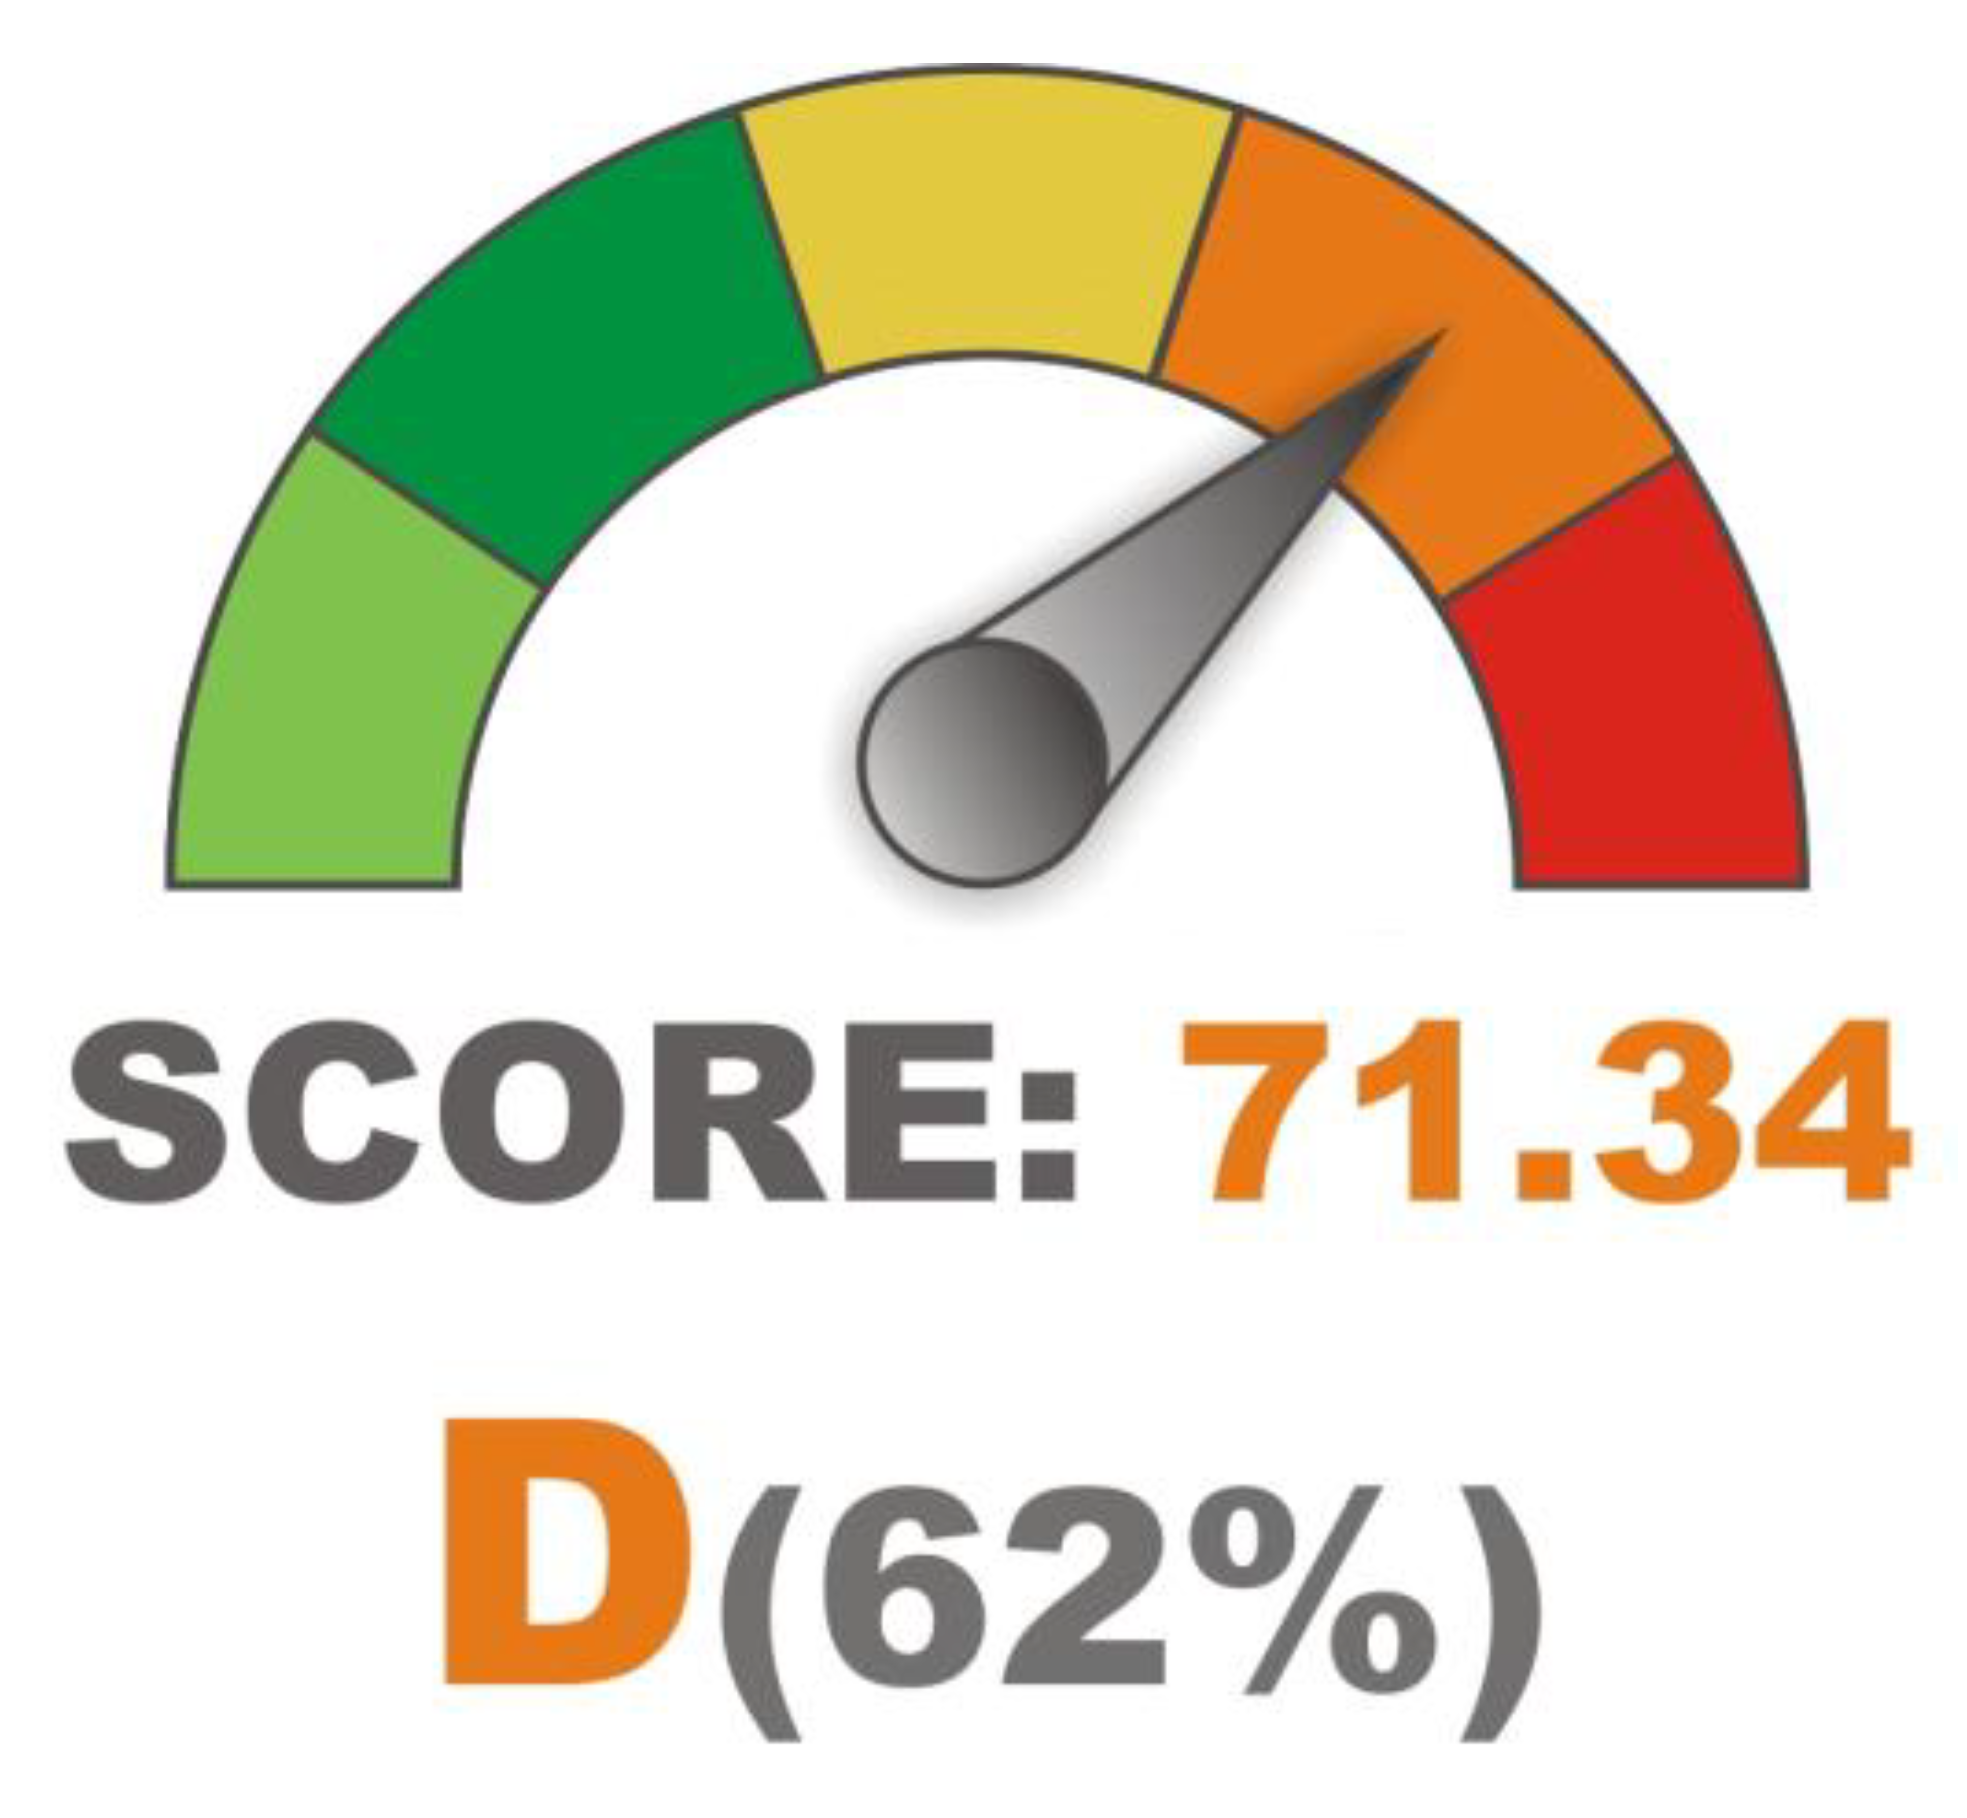
Website quality indices take on various forms (Figure 5). Measurement results are presented with various colours and geometric figures (Figure 6), with numbers or letters, expressed in integers or fractions, in various units and in different ranges (e.g., from 0 to 100, or from 1 to 5).
Generally, measurement results are presented using numbers and graphics (Figure 6); this provides a professional look, and increases the message readability and attractiveness.
Aggregated index values are obtained by automated means, using web applications, applications installed in the computer memory or manually, by means of the so-called cognitive walkthrough (expert assessment). Tests can be performed in desktop or mobile mode. Selected indices are global in nature, e.g., YSlow or the website loading time. Others are related to specific testing software e.g., on-page SEO Score (Neil Patel SEO Analyzer).
Selected indices reflect the quality of a single, specific website attribute e.g., the number of incoming links, while others take on the form of an aggregated note. Aggregated notes are the total of measurements of multiple website attributes. A specific value of one index reflects the quality of the entire website (within the adopted test range) or a specific plane e.g., the search engine optimisation (SEO) level. The aggregation can be carried out directly by a testing algorithm or by statistical methods e.g., zero unitarisation [71].

4.2. SEO Indices

Search engine optimisation (SEO) is a set of processes aimed at the improvement in website visibility in free-of-charge search results. SEO comprises a series of operations aimed at adjusting a website users’ expectations (user experience, UX), to the changing design standards and to the requirements imposed on websites by search engine algorithms (machine experience).
Search engine optimisation is associated with the term of “SEO audit”. A SEO audit involves an assessment of inter alia the development technique and website performance, selected content attributes, and the use of social media. Comprehensive SEO audits take the cross-sectional form and allow the website’s components, which may adversely affect its position in search results, to be found. A SEO audit can be carried out using various types of application (web, desktop or browser components) which automatise tests. Most frequently, the audit result is presented in the form of a score (the so-called SEO Score) which reflects the search engine optimisation level according to the testing algorithm (Figure 7). Analysis details are usually included in the report which also provides a list of follow-up recommendations [18].
Although the final note describing the search engine optimisation level is most often placed within the range of 0–100 points (Table 2), it is also sometimes presented in greater detail. The values of selected SEO indices are expressed in integers; the other ones, e.g., ZadroWeb SCORE, are provided with an accuracy of two decimal places.
SEO score is an index characteristic of the highest-level measurements i.e., those carried out for the entire website (page-level metrics). This metric represents the overall website quality level at the moment of measurement. In most cases, the final mark is comprised of partial notes obtained during the tests performed in various planes: usability (including responsiveness), development technique (including the identification of the content management system (CMS) and the website components), metainformation, performance, and the use of social media. However, the scope of tests varies, and may also include the estimation of use statistics, the number of incoming links, the measurement of text volume, or even an assessment of its perceptual accessibility. Therefore, the final note synthetically represents the level of search engine optimisation, and results from the accumulation of multiple various tests.

4.3. Aggregated Performance Indices

One of the crucial aspects of website optimisation is the improvement in their performance [11]. Recent years have seen a great deal of pressure for performance optimisation, which makes software developers compete against one another in limiting the website volume, inter alia through graphic file compression and code minification. This is justified because research showed that a delay of even a few seconds was sufficient to create negative impressions in a website user [72]. During the delays, the system’ operational smoothness is lost; the users lose full control and are forced to wait for the computer. Therefore, when (even short) delays repeat, the users often give up browsing the website, unless they are exceptionally involved in the performance of the task. This may result in an increase in the bounce rate and a decrease in goal conversion.
Quality indices are also used in measurements of performance and usability. The performance of websites and web applications is usually expressed in two ways: using a synthetic aggregated note e.g., YSlow (Table 3), or using single, specific indices e.g., Fully Loaded Time, Load Time, First Byte or Start Render (Table 4).
Aggregated performance indices are usually developed with a less specialised user (customer) searching for descriptive information in mind. They often have more marketing value than engineering or design value. Moreover, they are usually devoid of a specific unit, and are expressed in points or percent. Hence, their presentation is usually more fine-tuned in terms of graphics, colourful and distinctive.
Specific (“single”) indices are of a specialised nature. They are more difficult to interpret, and address the subtle aspects of website or web application functioning. They are of great value to designers and programmers, as they indicate critical spots which contribute to the deterioration in performance. Most of them are expressed precisely, up to two or three decimal places, in specific units e.g., seconds. Their presentation is usually straightforward and takes the form of numbers or cascade diagrams. Such indices may be obtained using, for example, the WebPageTest application.

4.4. Content Quality Indices

The effectiveness of a website may be determined by a properly edited and presented description of a service or product offer. The texts published on the Internet should be edited in accordance with the rules dictated by the way they are received, as they are usually browsed quickly and superficially [73]. Difficult texts, full of specialist terminology and devoid of crossheads are more difficult to receive, while texts written in simple language are more likely to be properly understood. Simplification and a concise form of the message may translate into goal conversion.
Perceptual accessibility is a feature of a text that can be measured. Research into the accessibility of various types of text is commonly carried out in many countries worldwide [74,75]. The research into text accessibility is based on the assumption that it is objectively measurable. This is because it has been noted that the understanding of a text is hindered by, inter alia, complicated syntax, difficult, specialised jargon, and the use of complex metaphors [76].
The perceptual accessibility of a text can be assessed by means of surveys. This approach draws on the achievements of psycholinguistics. The text difficulty can also be examined using analytical methods; these apply formulas, based on which the text difficulty level is calculated. There are many indices which allow the text accessibility to be determined. The most popular ones include the Flesch Reading Ease index, the Coleman-Liau Index, or the SMOG index. However, the best known one is the Gunning Fog Index (FOG) [75].
Text quality measurement is facilitated by web applications. The effect of an algorithmic measurements is the score indices which reflect, for example, the perceptual accessibility of a text, or even its marketing usefulness (Table 5). These indices’ values may be indicative of the quality of online publications. The indices’ values may be determined by e.g., the text volume, the saturation of the text with marketing terminology, or the use of too many specialist phrases.
The quality of contents published on websites is also measured using the Text to HTML Ratio (THR) index. The THR index value is estimated based on the measurement of the text-to-website code (HTML, CSS, JS, etc.) ratio. THR at a level of approx. 15%–20% is regarded as “good”, while that at a level of approx. 30%–35% as “very good”. Websites with too high a THR index value (e.g., 70%) may be considered to be ‘spam’ by search engine robots. Such high THR values are not typical, therefore it may raise suspicion as to attempts to manipulate search engine rankings.
The technological progress, convergence processes and the development of visual communication encourage the establishment of new, alternative ways of presenting information. In recent years, the popularity of product and service interactive visualisations has significantly increased. The specificity of the Internet focused on visual communication forces, so to speak, content creators to make use of no text itself but of multimedia instead. Their main task is to enhance the attractiveness of a message. The most popular forms of digital presentation of objects and the space, made available as website components, include various interactive maps [77], charts and diagrams, infographics and multimedia materials including films and animations, and interactive visualisations e.g., panoramas or the so-called virtual walks or tours. Not only should a full content audit include a synthetic analysis of texts but also an analysis and recording of video materials, photographs and graphics (including panoramic ones), spherical panoramas and virtual walks, and the material produced using drones [78]. An audit of the content should also include an analysis of the contents published in social media, and references published in other electronic media.

4.5. Link Quality

Network resources are connected to each other by hyperlinks [79]. Hyperlinks can be divided into three main types: (1) incoming links (inbound links, backlinks) are a sort of “vote of confidence” from one website to the other; (2) outbound links which direct users to other websites, and (3) internal links which connect individual subsites of a particular website. Moreover, links are divided into textual and graphical, as well as “natural” and advertising (purchased). Links may be “good” i.e., those which are a form of recommendation and may contribute to an increase in website visibility in search engines, and “bad” i.e., those which are the opposite of “good links”.
It is natural for hyperlinks to get broken after some time passes from their emergence on the Internet [80]. Outbound links that are “damaged” (broken links, dead links) lead nowhere. Mary P. Benbow [79] described the phenomenon of a click on a non-functional link as a “transfer of the user to cyber-no-man’s-land”. Broken links adversely affect website quality. It is therefore advisable to regularly audit links in order to detect and remove or repair those broken ones. Moreover, the quality and number of links are indices of website quality, even though it is the quality of websites on which incoming links are provided that is the most important [80]. The values of these indices can be measured using selected web applications (Table 6).
The ‘link rot’ phenomenon carries adverse practical implications. Too high a number of broken links may be an indication for search engine robots that the particular website is of poorer quality [81]. Moreover, non-functional links may reduce confidence in the website, cause user frustration, and have a negative effect on the website use statistics. This, in turn, may lead to a reduction in marketing (sales) effectiveness, and a decrease in goal conversion.

4.6. Website Accessibility for the Disabled

The modern world is moving towards the knowledge and information-based economy. Information also plays a special role in the lives of people with disabilities. More and more information, including official information, is being made available via the Internet. Website accessibility to persons with disabilities may be considered on many planes; however, in classical terms, it indicates the possibility for convenient browsing of contents in a web browser window regardless of the physical constraints [81].
Research on website accessibility to persons with disabilities has most often been carried out using test-automatising web applications but also with the participation of experts and the disabled [82]. Algorithmic tests usually produce an aggregated result in the form of a synthetic score (Table 7).
Aggregated indices of website accessibility to persons with disabilities enable the detection of these imperfections which may be unnoticeable to the disabled and may translate into the website usability, e.g., the number of syntactic code errors. The application of algorithmically obtained indices also enables a reduction in the cost intensiveness of tests as well as an increase in their number and frequency (tests are repetitive and their number is not limited), a comparison of the results, and their confrontation with other websites.

4.7. Measurement of the Global Website Potential

Of the numerous website attributes, the so-called “website authority” and the “website potential” can be distinguished. The website authority can be defined as the website’s “global quality”. This global quality is mostly due to the numerous aggregated attributes collected as a result of the so-called web monitoring. The indices which reflect the global (marketing and sales) potential of a website include Alexa Rank, Open PageRank or Serpstat Visibility (Table 8). Serpstat Visibility is an index describing “a website’s potential for generating traffic”. It is estimated based on website visibility in search results [83].
The Serpstat Visibility (SV) index value is determined by how often the website is displayed in Google search results. The SV is calculated as a ratio between the number and popularity of selected key words to the maximum possible website visibility index according to Serpstat (testing application). The number thus obtained is then multiplied by 1000, which facilitates its interpretation. The SV index is of an illustrative nature, and its value is estimated. The higher the SV value, the higher number of visitors is noted by the website. The SV index expresses “a website’s potential for generating traffic”, estimated based on the website visibility in search results. The Serpstat Visibility index value is presented up to the second decimal place. The value of an order of 0.00 indicates negligible visibility, low findability and a small range of the website’s impact (according to Serpstat). On the other hand, the Serpstat SE Traffic index value is determined by the estimated number of unique visits to a particular website per month. A low SE Traffic index value indicates the website’s low visibility in search results, and its low popularity [83].
Open PageRank has been developed on the initiative of the Internet user community. The PageRank Online Tool enables the estimation of the website “value”, the specific “capital of a particular domain”, or “brand power” on the Internet. The Open PageRank value ranges from 1 to 10 points. The higher the index value, the more popular the website is on the Internet.
The Alexa Rank provides an overview of how popular a particular website is worldwide. The lower a website’s position in the Alexa Rank, the less popular the website is [84]. The placement of a website at a hundred thousandth position in the Alexa Rank indicates that it is relatively popular among Internet users. The Alexa Traffic Rank index is based on the analysis of the traffic recorded by the Alexa Toolbar.

4.8. Aggregated Indices

Indices aggregated by statistical methods emerge from adding up the measurement results for multiple attributes. However, adding up the values of multiple variables is only possible when the variables are deprived of the unit in which they are expressed. For this purpose, standardising methods such as zero unitarisation are applied [85]. An example of an aggregated note which has resulted from adding up multiple variable values is the synthetic performance metaindex Estimated Speed Score (ES-SCORE). It is formed by adding up the values of several standardised diagnostic features. The higher a website’s performance, the higher the ES-SCORE index value. The ES-SCORE value is comprised of the measurements of the time of website loading in a browser window and the values of performance indices PageSpeed Score, Speed Index and YSlow [20]. In a similar manner, Król and Bitner [86] obtained the F-Score aggregated index value, which allowed them to assess the effect of raster compression on the map application performance.
There are also a number of indices that reflect the “overall” or “total” quality of a website. These include e.g., Woorank Score, Global score or the “Overall” index (Table 9).
Aggregated notes may be used for the assessment of various phenomena, starting from the performance of websites and map applications (technical issues) [85] and ending up with the quality of services provided (economic issues) [87]. In each case, however, in a more or less direct way, they are used to assess the quality.
In the context of the performed analysis, it is worth noting that neither the name of the aggregated index nor the components from which it has been formed are important. What is most significant is the method which allows any number of partial (diagnostic) variables (attributes) to be aggregated. Zero unitarisation enables the aggregation of any number of diagnostic variables; this method offers an infinite potential for creating more and more new aggregated indices. In this field, one can only be limited by their imagination.

5. Discussion

The indices related to the measurement of website quality may be difficult to verify, and non-objective. The methodology for calculating the selected indices, e.g., YSlow, is published [88]. However, that is not always the case. Reports and analyses are based on numerical data. Information results from the interpretation of numbers (data) which are provided by testing applications. However, the way in which the selected indices are calculated is not always shown, or even is not made available at all. The user obtains a final note but has no information on what has actually contributed to the measurement result. Moreover, the indices are not a perfect representation of reality, as they only describe the aspects that are determined by the circumstances (test parameters), e.g., link speed, testing algorithm or the server location.
At this point, it is worth considering the reliability of measurements obtained using the generally available, unauthorised testing tools which perform informal tests (formal tests are performed under laboratory conditions). The reliability of the assessment of selected website attributes may vary over time, and be dependent on the external factors (website environment). Therefore, the next question arises, concerning the aggregated note reliability. Testing applications are usually of a proprietary nature, and it is the programmers who know how they operate. The users are therefore left with either correlation or standardisation of the results obtained, with a reference to a specified source. This is proven by measurement results. Various testing applications provide various results of the measurement of the same phenomenon. SEO audit results are determined by the testing algorithm, similarly to performance audit results (Table 10). This is due to the fact that SEO audits are usually of a subjective nature, and are carried out based on proprietary checklists which, in turn, may be determined by the auditor’s skills and experience. Also, a performance audit may be of a different, more or less complex, nature. All that translates into the final mark.
Table 10 shows an example of the measurement of two website’s attributes, namely an aggregated SEO performance index and performance index. The measurements were carried out using various testing tools at different test settings. The experiment demonstrated that the value of an attribute may be different depending on the measuring tool and test settings. This is an experimental presentation (a case study) which is supposed to demonstrate that quality tests should be carried out with consideration given to the external circumstances (server location, time of measurement, Internet connection load and type, etc.).
The situation is similar for specific indices e.g., Fully Loaded Time. The measurement value may be determined by the test parameters. The range of measurement results for a single attribute may be great and amount to several seconds (Table 11).
The (synthetic) values of the automated measurement are a result of the previously adopted assumptions. These assumptions may be more or less accurate, or even erroneous. This confirms the reasonableness of carrying out “cross tests”. Cross measurement involves the testing of selected website parameters using at least two testing tools. In the interpretation of results obtained in this way, statistical methods, e.g., the structure similarity index, may prove helpful.
Although the scoring scale of the same tests (e.g., SEO) was the same for six tools (see Table 10), it is difficult to directly compare results obtained in this way. Each of the auditing tools provides a result based on a different range (set) of tests (various website attributes are subjected to the assessment).
Algorithms of testing applications omit website attributes that can only be assessed by the user, including the attractiveness, sales potential, recall, recognisability, associations, etc. Certain measured and aggregated attributes, e.g., visit statistics, are estimated. Therefore, the aggregated indices may have an approximate, estimated value.
It is the detailed follow-up reports that have real value for the improvement of the website quality. Aggregated indices are a sort of an introduction to the report which is of a detailed nature. Final reports provide design recommendations and a list of critical points whose improvement may translate into an improvement in website quality.

6. Conclusions

A large number of website quality indices are available to the users. There are just as many applications which enable their measurement. There are many limited, paid applications as well as many free-of-charge applications. Most operators who provide services in the field of Internet marketing and website optimisation make available a series of free-of-charge web tools, including website quality testing applications. This is a proven way to acquire traffic, absorb the user and build a brand in the user-consumers’ awareness.
Aggregated indices of website quality, obtained by automated means, are, to a large extent, reliable. These, however, should be taken with a grain of salt, as some of them are of a “playful” nature. These indices are professionally presented; however, they are developed as a result of an assessment of the basic website attributes, and therefore are of no great substantive value. They may be useless to programmers and software developers.
Usually, free-of-charge testing applications are of high quality. Not only do they have a specified value for the users but also provide benefits to their publishers. After all, anyone who has invested in a web application and made it available free of charge would like to reap some benefits from it. These applications are often part of the so-called diagnostic and information portal infrastructure. Websites assessing the website quality usually serve the role of the “surroundings”, a specific “resource base” for the main websites. They perform specific work for their creators as they serve a role of a digital funnel of sorts, i.e., their task is to acquire traffic in the web [89]. Brand awareness is built through a variety of services provided free of charge, and the page views are generated in the main website. Applications of this type are also used to leave cookies on customers’ devices, which are later used in remarketing.

Author Contributions

Conceptualisation, K.K.; Methodology, K.K.; Validation, K.K. and D.Z.; Formal Analysis, K.K. and D.Z.; Resources, K.K.; Data Curation, K.K. and D.Z.; Writing – Original Draft Preparation, K.K.; Writing – Review & Editing, K.K. and D.Z.; Visualisation, K.K.; Supervision, K.K.; Project Administration, K.K.; Funding Acquisition, D.Z. All authors have read and agreed to the published version of the manuscript.

Funding

Funded with a subsidy of the Ministry of Science and Higher Education for the Silesian University of Technology in Gliwice for 2020.

Conflicts of Interest

The authors declare no conflict of interest.

References

  1. Wells, J.D.; Parboteeah, V.; Valacich, J.S. Online impulse buying: Understanding the interplay between consumer impulsiveness and website quality. J. Assoc. Inf. Syst. 2011, 12, 3. [Google Scholar] [CrossRef] [Green Version]
  2. Kincl, T.; Štrach, P. Measuring website quality: Asymmetric effect of user satisfaction. Behav. Inf. Technol. 2012, 31, 647–657. [Google Scholar] [CrossRef]
  3. Juran, J.; Godfrey, A.B. Quality Handbook; Republished McGraw-Hill: New York, NY, USA, 1999. [Google Scholar]
  4. Chung, L.; do Prado Leite, J.C.S. On non-functional requirements in software engineering. In Conceptual Modeling: Foundations and Applications; Springer: Berlin/Heidelberg, Germany, 2009; pp. 363–379. [Google Scholar] [CrossRef] [Green Version]
  5. Sam, M.; Fazli, M.; Tahir, M.N.H. Website quality and consumer online purchase intention of air ticket. Int. J. Basic Appl. Sci. 2009, 9. Available online: https://ssrn.com/abstract=2255286 (accessed on 31 March 2020).
  6. Kim, S.; Stoel, L. Dimensional hierarchy of retail website quality. Inf. Manag. 2004, 41, 619–633. [Google Scholar] [CrossRef]
  7. Wells, J.D.; Hess, J.S.V.J. What Signal Are You Sending? How Website Quality Influences Perceptions of Product Quality and Purchase Intentions. MIS Q. 2011, 35, 373. [Google Scholar] [CrossRef] [Green Version]
  8. Lin, H.-F. The Impact of Website Quality Dimensions on Customer Satisfaction in the B2C E-commerce Context. Total. Qual. Manag. Bus. Excel. 2007, 18, 363–378. [Google Scholar] [CrossRef]
  9. User Expectations and Rankings of Quality Factors in Different Web Site Domains. Int. J. Electron. Commer. 2001, 6, 9–33. [CrossRef]
  10. Loiacono, E.T. WebQual™: A website quality instrument. Ph.D. Thesis, University of Georgia, Athens, Greece, 2000. [Google Scholar]
  11. Giannakoulopoulos, A.; Konstantinou, N.; Koutsompolis, D.; Pergantis, M.; Varlamis, I. Academic Excellence, Website Quality, SEO Performance: Is there a Correlation? Futur. Internet 2019, 11, 242. [Google Scholar] [CrossRef] [Green Version]
  12. Sikorski, M. Usługi On-Line: Jakość, Interakcje, Satysfakcja Klienta; Wyd. PJWSTK: Warszawa, Polska, 2012. [Google Scholar]
  13. Bai, B.; Law, R.; Wen, I.; Law, R. The impact of website quality on customer satisfaction and purchase intentions: Evidence from Chinese online visitors. Int. J. Hosp. Manag. 2008, 27, 391–402. [Google Scholar] [CrossRef]
  14. Schlosser, A.E.; White, T.B.; Lloyd, S.M. Converting Web Site Visitors into Buyers: How Web Site Investment Increases Consumer Trusting Beliefs and Online Purchase Intentions. J. Mark. 2006, 70, 133–148. [Google Scholar] [CrossRef]
  15. Helms, M.M. Encyklopedia of Management; Thompson Gale: Detroit, MI, USA, 2006. [Google Scholar]
  16. Dickinger, A.; Stangl, B. Website performance and behavioral consequences: A formative measurement approach. J. Bus. Res. 2013, 66, 771–777. [Google Scholar] [CrossRef]
  17. Belanche, D.; Casalo, L.V.; Guinaliu, M. Website usability, consumer satisfaction and the intention to use a website: The moderating effect of perceived risk. J. Retail. Consum. Serv. 2012, 19, 124–132. [Google Scholar] [CrossRef]
  18. Lee, Y.; Kozar, K.A. Understanding of website usability: Specifying and measuring constructs and their relationships. Decis. Support Syst. 2012, 52, 450–463. [Google Scholar] [CrossRef]
  19. Schubert, D. Influence of Mobile-friendly Design to Search Results on Google Search. Procedia - Soc. Behav. Sci. 2016, 220, 424–433. [Google Scholar] [CrossRef] [Green Version]
  20. Król, K. Comparative Analysis of the Performance of Selected Raster Map Viewers. Geomat. Landmanag. Landsc. 2018, 2, 23–32. [Google Scholar] [CrossRef]
  21. Luna-Nevarez, C.; Hyman, M.R. Common practices in destination website design. J. Destin. Mark. Manag. 2012, 1, 94–106. [Google Scholar] [CrossRef]
  22. Hasan, L.; Abuelrub, E. Assessing the quality of web sites. Appl. Comput. Inform. 2011, 9, 11–29. [Google Scholar] [CrossRef] [Green Version]
  23. Lowry, P.B.; Wilson, D.W.; Haig, W.L. A Picture is Worth a Thousand Words: Source Credibility Theory Applied to Logo and Website Design for Heightened Credibility and Consumer Trust. Int. J. Hum.-Comput. Interact. 2013, 30, 63–93. [Google Scholar] [CrossRef]
  24. Federici, S.; Bracalenti, M.; Meloni, F.; Luciano, J.V. World Health Organization disability assessment schedule 2.0: An international systematic review. Disabil. Rehab. 2016, 39, 2347–2380. [Google Scholar] [CrossRef]
  25. Baye, M.R.; Santos, B.D.L.; Wildenbeest, M.R. Search Engine Optimization: What Drives Organic Traffic to Retail Sites? J. Econ. Manag. Strat. 2015, 25, 6–31. [Google Scholar] [CrossRef] [Green Version]
  26. Djonov, E. Website hierarchy and the interaction between content organization, webpage and navigation design: A systemic functional hypermedia discourse analysis perspective. Inf. Des. J. 2007, 15, 144–162. [Google Scholar] [CrossRef]
  27. Griffiths, K.M.; Christensen, H. Quality of web based information on treatment of depression: Cross sectional survey. BMJ 2000, 321, 1511–1515. [Google Scholar] [CrossRef] [PubMed] [Green Version]
  28. Holliman, G.; Rowley, J. Business to business digital content marketing: Marketers’ perceptions of best practice. J. Res. Interact. Mark. 2014, 8, 269–293. [Google Scholar] [CrossRef] [Green Version]
  29. Rahimnia, F.; Hassanzadeh, J.F. The impact of website content dimension and e-trust on e-marketing effectiveness: The case of Iranian commercial saffron corporations. Inf. Manag. 2013, 50, 240–247. [Google Scholar] [CrossRef]
  30. Hudson, S.; Thal, K. The Impact of Social Media on the Consumer Decision Process: Implications for Tourism Marketing. J. Travel Tour. Mark. 2013, 30, 156–160. [Google Scholar] [CrossRef]
  31. Kenekayoro, P.; Buckley, K.; Thelwall, M. Hyperlinks as inter-university collaboration indicators. J. Inf. Sci. 2014, 40, 514–522. [Google Scholar] [CrossRef]
  32. Plaza, B. Google Analytics for measuring website performance. Tour. Manag. 2011, 32, 477–481. [Google Scholar] [CrossRef]
  33. Cui, M.; Hu, S. Search Engine Optimization Research for Website Promotion. In Proceedings of the 2011 International Conference of Information Technology, Computer Engineering and Management Sciences, Nanjing, China, 24–25 September 2011; Institute of Electrical and Electronics Engineers (IEEE): New York, NY, USA, 2011; Volume 4, pp. 100–103. [Google Scholar] [CrossRef]
  34. Król, K. Forgotten agritourism: Abandoned websites in the promotion of rural tourism in Poland. J. Hosp. Tour. Technol. 2019, 10, 431–442. [Google Scholar] [CrossRef]
  35. Gao, L.; Bai, X. Online consumer behaviour and its relationship to website atmospheric induced flow: Insights into online travel agencies in China. J. Retail. Consum. Serv. 2014, 21, 653–665. [Google Scholar] [CrossRef]
  36. Chi, T. Understanding Chinese consumer adoption of apparel mobile commerce: An extended TAM approach. J. Retail. Consum. Serv. 2018, 44, 274–284. [Google Scholar] [CrossRef]
  37. Liu, K.P.A.C.; Liu, C.; Arnett, K.P.; Litecky, C. Design Quality of Websites for Electronic Commerce: Fortune 1000 Webmasters’ Evaluations. Electron. Mark. 2000, 10, 120–129. [Google Scholar] [CrossRef]
  38. Joury, A.; Alshathri, M.; Alkhunaizi, M.; Jaleesah, N.; Pines, J.M. Internet Websites for Chest Pain Symptoms Demonstrate Highly Variable Content and Quality. Acad. Emerg. Med. 2016, 23, 1146–1152. [Google Scholar] [CrossRef] [PubMed]
  39. Charnock, D.; Shepperd, S.; Needham, G.; Gann, R. DISCERN: An instrument for judging the quality of written consumer health information on treatment choices. J. Epidemiol. Community Heal. 1999, 53, 105–111. [Google Scholar] [CrossRef] [PubMed] [Green Version]
  40. Griffiths, K.M.; Christensen, H.; Witteman, H.; Shepperd, S. Website Quality Indicators for Consumers. J. Med. Internet Res. 2005, 7, 55. [Google Scholar] [CrossRef]
  41. Silberg, W.M.; Lundberg, G.D.; Musacchio, R.A. Assessing, Controlling, and Assuring the Quality of Medical Information on the Internet. JAMA 1997, 277, 1244. [Google Scholar] [CrossRef]
  42. Dueppen, A.J.; Bellon-Harn, M.L.; Radhakrishnan, N.; Manchaiah, V. Quality and Readability of English-Language Internet Information for Voice Disorders. J. Voice 2019, 33, 290–296. [Google Scholar] [CrossRef]
  43. Galati, A.; Crescimanno, M.; Tinervia, S.; Siggia, D. Website quality and internal business factors. Int. J. Wine Bus. Res. 2016, 28, 308–326. [Google Scholar] [CrossRef]
  44. Mateos, M.B.; Chamorro-Mera, A.; González, F.J.M.; López, O.G. A new Web assessment index: Spanish universities analysis. Internet Res. 2001, 11, 226–234. [Google Scholar] [CrossRef]
  45. Miranda, F.J.; Cortés, R.; Barriuso, C. Quantitative evaluation of e-banking web sites: An empirical study of Spanish banks. Electron. J. Inf. Syst. Eval. 2006, 9, 73–82. [Google Scholar]
  46. Miranda-Gonzalez, F.J.; Sanguino, R.; Bañegil, T.M. Quantitative assessment of European municipal web sites. Internet Res. 2009, 19, 425–441. [Google Scholar] [CrossRef]
  47. Sanders, J.; Galloway, L. Rural small firms’ website quality in transition and market economies. J. Small Bus. Enterp. Dev. 2013, 20, 788–806. [Google Scholar] [CrossRef] [Green Version]
  48. Miranda-Gonzalez, F.J.; Rubio, S.; Chamorro, A.; Chamorro-Mera, A. The Web as a Marketing Tool in the Spanish Foodservice Industry: Evaluating the Websites of Spain’s Top Restaurants. J. Foodserv. Bus. Res. 2015, 18, 146–162. [Google Scholar] [CrossRef]
  49. Ecer, F. A Hybrid Banking Websites Quality Evaluation Model Using AHP and COPRAS-G: A Turkey Case. Technol. Econ. Dev. Econ. 2014, 20, 757–782. [Google Scholar] [CrossRef]
  50. Saaty, T.L. Decision making with the analytic hierarchy process. Int. J. Serv. Sci. 2008, 1, 83. [Google Scholar] [CrossRef] [Green Version]
  51. Zavadskas, E.K.; Kaklauskas, A.; Turskis, Z.; Tamošaitienė, J. Multi-attribute decision-making model by applying grey numbers. Informatica 2009, 20, 305–320. [Google Scholar]
  52. Gregg, D.; Walczak, S. The relationship between website quality, trust and price premiums at online auctions. Electron. Commer. Res. 2010, 10, 1–25. [Google Scholar] [CrossRef]
  53. Rolland, S.; Freeman, I. A new measure of e-service quality in France. Int. J. Retail. Distrib. Manag. 2010, 38, 497–517. [Google Scholar] [CrossRef]
  54. Hur, Y.; Ko, Y.J.; Valacich, J. A Structural Model of the Relationships Between Sport Website Quality, E-Satisfaction, and E-Loyalty. J. Sport Manag. 2011, 25, 458–473. [Google Scholar] [CrossRef] [Green Version]
  55. Islam, A.; Tsuji, K. Evaluation of Usage of University Websites in Bangladesh. DESIDOC J. Libr. Inf. Technol. 2011, 31, 469–479. [Google Scholar] [CrossRef]
  56. Chou, W.-C.; Cheng, Y.-P. A hybrid fuzzy MCDM approach for evaluating website quality of professional accounting firms. Expert Syst. Appl. 2012, 39, 2783–2793. [Google Scholar] [CrossRef]
  57. Zech, C.; Wagner, W.; West, R. The Effective Design of Church Web Sites: Extending the Consumer Evaluation of Web Sites to the Non-Profit Sector. Inf. Syst. Manag. 2013, 30, 92–99. [Google Scholar] [CrossRef]
  58. Al-Debei, M.; Akroush, M.N.; Ashouri, M.I. Consumer attitudes towards online shopping. Internet Res. 2015, 25, 707–733. [Google Scholar] [CrossRef]
  59. Wang, L.; Law, R.; Guillet, B.D.; Hung, K.; Fong, D.K.C.; Law, R. Impact of hotel website quality on online booking intentions: eTrust as a mediator. Int. J. Hosp. Manag. 2015, 47, 108–115. [Google Scholar] [CrossRef]
  60. Ali, F. Hotel website quality, perceived flow, customer satisfaction and purchase intention. J. Hosp. Tour. Technol. 2016, 7, 213–228. [Google Scholar] [CrossRef]
  61. Chi, T. Mobile Commerce Website Success: Antecedents of Consumer Satisfaction and Purchase Intention. J. Internet Commer. 2018, 17, 1–26. [Google Scholar] [CrossRef]
  62. Martínez, A.B.; López, O.G.; Sanguino, R.; Buenadicha-Mateos, M. Analysis and Evaluation of the Largest 500 Family Firms’ Websites through PLS-SEM Technique. Sustainability 2018, 10, 557. [Google Scholar] [CrossRef] [Green Version]
  63. Liang, D.; Zhang, Y.; Xu, Z.; Jamaldeen, A. Pythagorean fuzzy VIKOR approaches based on TODIM for evaluating internet banking website quality of Ghanaian banking industry. Appl. Soft Comput. 2019, 78, 583–594. [Google Scholar] [CrossRef]
  64. Hsu, Y.C.; Chen, T.-J.; Chu, F.Y.; Liu, H.-Y.; Chou, L.-F.; Hwang, S.-J. Official Websites of Local Health Centers in Taiwan: A Nationwide Study. Int. J. Environ. Res. Public Heal. 2019, 16, 399. [Google Scholar] [CrossRef] [Green Version]
  65. Saverimoutou, A.; Mathieu, B.; Vaton, S. Web View: Measuring & Monitoring Representative Information on Websites. In Proceedings of the 2019 22nd Conference on Innovation in Clouds, Internet and Networks and Workshops (ICIN), Paris, France, 9–21 February 2019; pp. 133–138. [Google Scholar] [CrossRef] [Green Version]
  66. Garcia-Madariaga, J.; Virto, N.R.; López, M.F.B.; Manzano, J.A. Optimizing website quality: The case of two superstar museum websites. Int. J. Cult. Tour. Hosp. Res. 2019, 13, 16–36. [Google Scholar] [CrossRef]
  67. Law, R. Evaluation of hotel websites: Progress and future developments (invited paper for ‘luminaries’ special issue of International Journal of Hospitality Management). Int. J. Hosp. Manag. 2019, 76, 2–9. [Google Scholar] [CrossRef]
  68. Windhager, F.; Salisu, S.; Mayr, E. Exhibiting Uncertainty: Visualizing Data Quality Indicators for Cultural Collections. Informatics 2019, 6, 29. [Google Scholar] [CrossRef] [Green Version]
  69. Ismailova, R.; Inal, Y. Web site accessibility and quality in use: A comparative study of government Web sites in Kyrgyzstan, Azerbaijan, Kazakhstan and Turkey. Univers. Access Inf. Soc. 2016, 16, 987–996. [Google Scholar] [CrossRef]
  70. Sinha, P. Web Accessibility Analysis of Government Tourism Websites in India. SSRN Electron. J. 2018, 26–27. [Google Scholar] [CrossRef]
  71. Król, K. Stopień optymalizacji witryn internetowych obiektów turystyki wiejskiej dla wyszukiwarek internetowych. Roczniki Naukowe Ekonomii Rolnictwa i Rozwoju Obszarów Wiejskich 2018, 105, 110–121. [Google Scholar] [CrossRef] [Green Version]
  72. Nielsen, J. Website Response Times. Nielsen Norman Group. Available online: https://goo.gl/MymMco (accessed on 31 March 2020).
  73. Rasmusson, M.; Eklund, M. “It’s easier to read on the Internet—You just click on what you want to read…”. Educ. Inf. Technol. 2012, 18, 401–419. [Google Scholar] [CrossRef]
  74. Broda, B.; Ogrodniczuk, M.; Nitoń, B.; Gruszczynski, W. Measuring Readability of Polish Texts: Baseline Experiments. In Proceedings of the 9th International Conference on Language Resources and Evaluation, Reykjavik, Iceland, 26–31 May 2014. [Google Scholar]
  75. Lo, K.; Ramos, F.; Rogo, R. Earnings management and annual report readability. J. Account. Econ. 2017, 63, 1–25. [Google Scholar] [CrossRef] [Green Version]
  76. Loughran, T.; McDonald, B. Measuring Readability in Financial Disclosures. J. Finance 2014, 69, 1643–1671. [Google Scholar] [CrossRef]
  77. Sehra, S.S.; Singh, J.; Rai, H. Assessing OpenStreetMap Data Using Intrinsic Quality Indicators: An Extension to the QGIS Processing Toolbox. Futur. Internet 2017, 9, 15. [Google Scholar] [CrossRef] [Green Version]
  78. Król, K. Wirtualizacja oferty agroturystycznej. Handel Wewnętrzny 2018, 1, 274–283. [Google Scholar]
  79. Benbow, M. File not found: The problems of changing URLs for the World Wide Web. Internet Res. 1998, 8, 247–250. [Google Scholar] [CrossRef]
  80. Król, K.; Zdonek, D. Peculiarity of the bit rot and link rot phenomena. Glob. Knowl. Mem. Commun. 2019, 69, 20–37. [Google Scholar] [CrossRef]
  81. Vollenwyder, B.; Iten, G.; Brühlmann, F.; Opwis, K.; Mekler, E. Salient beliefs influencing the intention to consider Web Accessibility. Comput. Hum. Behav. 2019, 92, 352–360. [Google Scholar] [CrossRef]
  82. Yoon, K.; Dols, R.; Hulscher, L.; Newberry, T. An exploratory study of library website accessibility for visually impaired users. Libr. Inf. Sci. Res. 2016, 38, 250–258. [Google Scholar] [CrossRef]
  83. Król, K. Marketing Potential of Websites of Rural Tourism Facilities in Poland. Econ. Reg. Stud./Stud. Èkon. i Reg. 2019, 12, 158–172. [Google Scholar] [CrossRef] [Green Version]
  84. Thakur, A.; Sangal, A.L.; Bindra, H. Quantitative Measurement and Comparison of Effects of Various Search Engine Optimization Parameters on Alexa Traffic Rank. Int. J. Comput. Appl. 2011, 26, 15–23. [Google Scholar] [CrossRef]
  85. Król, K. Jakość witryn internetowych w zarządzaniu marketingowym na przykładzie obiektów turystyki wiejskiej w Polsce. Infrastruktura i Ekologia Terenów Wiejskich; Komisja Technicznej Infrastruktury Wsi Oddziału Polskiej Akademii Nauk: Kraków, Polska, 2018; Volume III, p. 181. [Google Scholar] [CrossRef]
  86. Król, K.; Bitner, A. Impact of raster compression on the performance of a map application. Geomat. Landmanag. Landsc. 2019, 3, 41–51. [Google Scholar] [CrossRef]
  87. Król, K.; Ziernicka-Wojtaszek, A.; Zdonek, D. Polish agritourism farm website quality and the nature of services provided. Organ. Manag. Sci. Q. 2019, 3, 73–93. [Google Scholar] [CrossRef]
  88. YSlow. Available online: http://yslow.org/ (accessed on 31 March 2020).
  89. Król, K.; Strzelecki, A.; Zdonek, D. Credibility of automatic appraisal of domain names. Sci. Pap. Sil. Univ. Technol. Organ. Manag. Ser. 2018, 127, 107–115. [Google Scholar] [CrossRef]
Figure 1. Factors affecting website quality; Source: Own research.
Futureinternet 12 00072 g001
Figure 2. Examples of goal conversion on a website; Source: Own research.
Futureinternet 12 00072 g002
Figure 3. Factors affecting website quality; Source: Own research.
Futureinternet 12 00072 g003
Figure 4. The categories in which the quality index overview was carried out; Source: Own research.
Futureinternet 12 00072 g004
Figure 5. Examples of the presentation of website quality audit results using circles; Source: Own research.
Futureinternet 12 00072 g005
Figure 6. Examples of the website quality presentation using specific “progress bars” and scores; Source: Own research.
Futureinternet 12 00072 g006
Figure 7. An example of website quality measurement presentation using an index graph as well as numbers and letters; Source: Own research.
Futureinternet 12 00072 g007
Table 1. The criteria considered in the research into website quality.
SourceDimensionsArea
[52]Information quality, web designAuction website
[53]Ease of use, information content, security/privacy,
fulfilment reliability, post-purchase customer service
French “e-tail” market
[54]Information, interaction, design, system, fulfilmentSport website
[55]Content, organisation, readability, navigation and links, user interface design, performance and effectiveness, educational informationUniversity websites in Bangladesh
[56]System quality (accessibility, navigability, usability, privacy), information quality (relevance, understandability, richness, currency), service quality (responsiveness, reliability, assurance, empathy)The top-four CPA (certified public accountant) firms in Taiwan
[57]Technical adequacy (ease of navigation, interactivity, search engine list accuracy, valid links)
Web content presentation (Usefulness, Clarity, Currency, Conciseness, Accuracy)
Web appearance (Attractiveness, Organization, Effective use of fonts, Effective use of colours, Innovative use of multimedia)
Church web sites
[58]Functionality (ease of navigation, responsiveness, interactivity, ease of accessing the site)
Search facilities (simplicity, speed, and effectiveness of the process of collecting data and information about prices, performance, attributes, and other aspects of products)
Online
shopping web site in Jordan
[59]Usability; functionality; security and privacyHotel website
[60]Usability (clear language, easily understandable information, user-friendly layout, well-organised information, graphics matched with texts, simple website navigations)
Functionality (hotel reservation information, hotel facilities information, information on promotions/special offers, price information on hotel rooms, information on destination where hotel is located)
Security and privacy (privacy policy relating to customers’ personal data, information of secured online payment system, information of third-party recognition)
Hotel website
[61]System quality, information quality, service qualityChines e-commerce website
[62]Content (about us, blog, newsletter Copyright, legal disclaimer, FAQ, news, private policy trust mark, terms of use)
Form (animation, color background, pictures, color text, video)
Function (search, e-mail, fax, postal address, telephone, last update, forums, languages, site map, navigation menu, register, rss)
Social network (Facebook, Flickr, Instagram, linkedin, Pinterest, Tumblr, Twitter, Weibo, Xing, Youtube)
Corporate website
[63]Product quality; ease of use; security; responsiveness; privacyBanking website in Ghana
Source: Own research.
Table 2. Aggregated assessment of the search engine optimisation (SEO) level.
ItemQuality IndexTesting ApplicationResult RangeUnit
1.On-page SEO ScoreNeil Patel SEO Analyzer0–100points
2.SEO ScorePositioning0–5points
3.ScoreZadroWeb0–100%
4.SEO ScoreWebsite Grader0–100points
5.SEO ResultsSEOptimerA–Fletter
6.SEO ScoreSEO Tester Online0–100points
7.SEO Site Checkup scoreSEO Site Checkup0–100points
8.SEO ScoreGeekflare0–100points
9.SEO ScoreSemtec0–100points
Table 3. Aggregated performance indices.
ItemQuality IndexTesting ApplicationResult RangeUnit
1.YSlow Score, PageSpeed ScoreGTMetrix0–100%
2.Performance gradePingdom Website Speed Test0–100points
3.SCOREDareboost0–100%
4Speed IndexDareboost>0points
5.Optimum ScoreGiftOfSpeed0–100points
6.Performance ScoreGeekflare0–100points
7.PageSpeed InsightsGoogle PageSpeed Insights0–100points
8.Google PageSpeed scoreUptrends Website Speed Test0–100points
Table 4. Specific performance indices.
ItemQuality
Index
Subject under AssessmentTesting ApplicationResult RangeUnit
1Fully Loaded Time, Load Time, First Byte, Start RenderWebsite loading timeGTMetrix, Dareboost, Pingdom Website Speed Test>0seconds
2Time spent on the websiteEstimation of the time spent by users on the websitePositioning>0seconds/minutes
3BacklinksHyperlinksNeil Patel SEO Analyzer>0pcs
4Total Page SizeWebsite volume in bytesPingdom Website Speed Test>0KB/MB
5RequestsNumber of website componentsPingdom Website Speed Test>0pcs
6Organic KeywordsNumber of keywordsNeil Patel SEO Analyzer>0pcs
7Organic monthly trafficTraffic estimationNeil Patel SEO Analyzer>0pcs
8HTTP transmission time; Average latency time (ping)Server parametersWebspeed Intensys>0seconds
9Fully Loaded and othersWeb Page Performance TestWebPageTestA-F
>0
letters
seconds
Table 5. Selected indices of the text quality algorithmic measurement.
ItemQuality
Index
Subject under AssessmentTesting ApplicationResult RangeUnit
1.Semantic resultText semantics audit (qualitative metric); assessment of marketing usefulnessBlink Audit Tool0–100%
2.Perceptual accessibility of a textMeasurement of the comprehensibility of Polish non-literary textsJasnopis0–7points
3.Text to HTML Ratio (THR)Measurement of the content-to-code ratio (a quantitative measure)Siteliner0–100%
4.Perceptual accessibility of a textText comprehensibility measurementLogios0–22points
5.Code to Text RatioCode-to-text ratioWebanaliza0–100%
6.Perceptual accessibility of a textReadabilityReadableA–Fletters
Table 6. Selected indices which reflect the link quality.
ItemIndexSubject under AssessmentTesting Application
1.Broken linksNumber of broken links (‘link rot’ phenomenon assessment)Broken Link Checker
2.BacklinksNumber of backlinksNeil Patel SEO Analyzer
3.Total links, link types, Dofollow/Nofollow, otherAssessment of internal and external link profileDr. Link Check
4.Site Checker: Free Broken Link ToolNumber of broken linksDead link checker
Table 7. Selected indices which reflect the link quality.
ItemIndexSubject under AssessmentTesting ApplicationResult RangeUnit
1.AccessibilityWebsite accessibility for the disabledUtilitia0.00–10.00points
2.Errors, Contrast ErrorsWeb content availabilityWAVE Web Accessibility Evaluation Tool>0points
3.Number of Rules: Violations, Warnings, Manual Checks, PassedRuleset: HTML5 and ARIA TechniquesFunctional Accessibility Evaluator (FAE)0–100Score, Status
Table 8. Indices of the website marketing potential.
ItemIndexTesting Tool or Measurement Method
1.Serpstat Visibility (SV), Serpstat
SE Traffic
Serpstat
2.Alexa Global Rank,
Alexa Rank in Country (Poland)
Alexa Tool
3.SimilarWeb Global Rank,
SimilarWeb
Traffic Overview (Total Visits)
SimilarWeb
4.Open PageRankOpen PageRank Online Tool
Table 9. Selected indices which reflect the “overall website quality”.
ItemQuality
Index
Subject under AssessmentTesting ApplicationResult RangeUnit
1.Woorank ScoreWebsite qualityWoorank Website Review Tool & SEO Checker0–100points
2.OverallWebsite qualityNibbler0–10points
3.Global scoreWebsite qualityYellow Lab ToolsA–F
0–100
letters and
points
4.Best Practices ScoreWebsite qualityGeekflare0–100points
5.Page AuthorityScore developed by MozPage Authority Checker0–100points
6.Domain AuthoritySearch engine ranking score developed by MozMoz Free Domain SEO Analysis Tool0–100points
7.Domain RatingWebsite authority metric based on the backlink profileAhrefs0–100points
Table 10. Selected quality index measurement result.
Testing ApplicationSEO Measurement Result *Testing ApplicationPerformance *
Neil Patel SEO Analyzer85PageSpeed Insights64
ZadroWeb71.03GTMetrix PageSpeed Score79
Website Grader74GTMetrix YSlow74
Blink Audit Tool77Pingdom Performance grade82
SEO Tester Online57.3GiftOfSpeed53
Positioning3+ (3.5)Geekflare100
Semtec65Uptrends Website Speed Test (Google PageSpeed score)94
* Measurements carried out for the website http://homeproject.pl; Source: Own research.
Table 11. “Fully Loaded Time” index measurement result.
Testing ApplicationFully Loaded Time (s) *
GTMetrix2.9
Pingdom Website Speed Test1.0
GiftOfSpeed1.8
Geekflare1.3
Dareboost1.96
WebPageTest4.617
Uptrends Website Speed Test1.6
* Measurements carried out for the website http://homeproject.pl; Source: Own research.