1. Introduction
The compulsory use of Automatic Identification System (AIS) for many vessel types, which has been enforced by naval regulations, has opened new opportunities for maritime surveillance (according to the Regulation 19 of SOLAS Chapter V (
http://solasv.mcga.gov.uk/regulations/regulation19.htm), since 2002 all vessels over 300 Gross Tonnage and all passenger vessels must carry an AIS transmitter). As a result, vessels become rich sources of AIS information that everyone can collect using an RF receiver. The collection, processing and visualisation of AIS data from multiple vessels has been the main business for many companies, such as MarineTraffic (
https://www.marinetraffic.com/), VesselTracker (
https://www.vesseltracker.com/), MariWeb (
https://imisglobal.com/mariweb/) and others that have develop and maintain their own world-wide networks of shore-based stations and regional data aggregators. Such platforms provide real-time information on ship’s position and information on arrivals and departures from ports, using a network of shore stations that collect and pre-process AIS signals (for missing values, errors and redundancies) and forward the result to a centralized processing server for further cleaning, post-processing and visualization.
Motivated by the abundance of AIS data and the rich information that they contain, a lot of data mining applications have been developed by researchers on top of historic AIS data, ranging from the automatic detection of events [
1,
2] to the prediction of future vessel position [
3] and estimation of the time of arrival at the port [
4]. In a parallel line of research, several works on trajectory data analytics have contributed platforms for the visualisation of vessel trajectories [
5,
6], efficient handling of large volumes of such spatio-temporal data streams [
7,
8] and methodologies for the abstraction of AIS data collected for a period and a region [
9].
Maritime surveillance has been a topic that has attracted a lot of research and commercial interest over the last few years. The primary reason for this is that surveillance systems have significantly contributed to increasing the efficiency and safety of operations at sea. However, the analysis of AIS data collected for a region is a hard task to be performed manually, especially when it has to be performed for thousands of vessels that periodically transmit their position with high rates. It is therefore of utmost importance to support the maritime authorities with tools and methods that automatically process AIS data and provide automatic alerts that require human intervention [
10,
11]. A critical requirement for such tools is that they exhibit the ability to foresee unfolding cautious and potentially hazardous situations, so as to propose measures of danger avoidance.
Search and Rescue (SAR) missions constitute a typical example that requires an automatic awareness system, in order to be detected directly from AIS data.
Search and Rescue (SAR) missions are taking place in the context of the refugee crisis in the Central and Eastern Mediterranean since 2015 [
12]. The unnecessary loss of so many human lives indicates that SAR operations can benefit from situational awareness information either with the intention to identify them on time and to assist in the coordination of rescue ships but also in order to clarify the role of the involved vessels. At the macroscopic level, this knowledge can be even used to assess the impact of related policies. The problem of detecting SAR missions becomes particularly challenging since the trajectory of a vessel in a mission is decomposed into multiple smaller operations, such as patrolling, rushing to the event, directly collecting people at sea, collecting people by other means such as floating devices or smaller boats, safely returning the collected people to the port and so forth. Recognizing a vessel performing any of those operations is critical into timely understanding incidents, their details and how the complete SAR operation evolves.
In our previous work [
13], we proposed an unsupervised method for detecting vessels potentially engaged in SAR missions, which was mainly based on the fact that when the vessel is performing a search or a rescue maneuver it is expected to change its course several times within a spatial and temporal distance. In that work, a trajectory simplification algorithm allowed to limit the trajectory points only to those representing major changes in the vessel’s course over ground and a density based clustering algorithm allowed to locate the segments of the trajectory that contain many turn points at a close distance (the two parameters of the DBScan density based clustering algorithm,
and
actually define how many points at least must appear in a small radius around any point in order for it to be considered as core cluster point).
In this paper, we revisit the problem of SAR mission identification with an emphasis on the detection of the specific type of maneuvers performed by a vessel. For this reason, we train a classifier that is able to process certain features of the vessel trajectory and distinguish between the different maneuver types. Since it is hard to find and manually annotate lots of SAR trajectory data, we develop a synthetic trajectory generator, which is configured to generate various maneuver patterns and also introduces noise to them in order to simulate real world examples. Using synthetic trajectories only, we train and evaluate our classifier and evaluate it on synthetic and real data. The classifier builds on a shapelet transformation of the original AIS data, which comprise vessels’ latitude and longitude for consecutive timestamps and on the extraction of useful features from the resulting time-series data, with the use of a genetic algorithm.
The current work focuses on the classification of SAR maneuvers that may happen during a vessel’s trip and thus cannot be directly compared to methods that classify the whole voyage as a SAR mission or not (e.g., References [
14,
15]) or methods that search for more composite naval events that examine more than one vessels in tandem (e.g., References [
1,
2]). However, it proposes a new classification approach for documented maneuvers such as the SAR ones, in the absence of annotated data. The contributions of this work can be summarized as follows:
A method for the classification of composite vessel maneuvers to different types of SAR patterns. The method is supervised but is trained using synthetic data and is based on shapelet features extracted using a genetic algorithm.
A synthetic trajectory generator.
A sampling technique for trajectory data that selects only a few interesting points from a long vessel trajectory, that are still capable of representing the maneuvers contained in it.
The following section, highlights some key research works in the field of maritime surveillance and briefly describes the key algorithms that we extend in our work. In
Section 3 we give an overview of the proposed framework and in its subsections we provide the details of our work. In
Section 4 we illustrate some first results on synthetic and real data and in
Section 5, we discuss the next steps of this work.
2. Related Work
The identification and management of SAR operations’ patterns is a well-known research topic that has attracted a lot of interest [
13,
14,
15]. The task of automating the surveillance of vessel trajectories in a region to detect when SAR patterns occur can be valuable for identifying when vessels perform a SAR mission or they may behave suspiciously.
The general patterns followed by vessels involved in a search-and-rescue mission are generally pre-defined as “Norms”, in terms of Maritime Safety/Safety Regulations, although in many cases these patterns need to be modified based on the needs and the area of each SAR mission. Based on the idea of adjusting the SAR pattern to fit the area to be searched, Reference [
16] examined a heuristic method to implement a tool for automatic search pattern generation.
As part of this work, the problem of vessel pattern identification can be treated as a task of classifying time-series shapelets. The main drawbacks of this task is the computational cost for measuring the accuracy of all possible shapelet candidates as well as the fact that this is a time consuming process. In this context, the authors of Reference [
17] proposed an algorithm for shapelet discovery by transforming the raw real-valued and high-dimensional data into a discrete and low-dimensional representation which allows hashing of the data and the use of collision history for searching.
In a similar context, the authors of Reference [
18] introduced the idea of a shapelet transformation in order to disconnect the task of identifying shapelets from the classification algorithm. To do so, they propose the extraction of the k best shapelets from a dataset in one pass and use the identified shapelets to transform the data using the distance calculation from a series to each shapelet. Another approach to overcome the time complexity of shapelets classification, as described in Reference [
19], which introduces FSS algorithm (Fast Shapelet Selection), is to start by sampling the time series of a training dataset, identify the Local Farthest Deviation Points (LFDPs) and select the subsequences between two non-adjacent points. In
Section 2.1,
Section 2.2 and
Section 2.3, which follow, we elaborate more on the details of SAR maneuvers and shapelets used in our experiments and other works that are related to these methods.
2.1. SAR Maneuvers
This work presumes a list of SAR patterns as described in the “U.S. Coast Guard addendum to the United States National Search and Rescue supplement NSS” [
20] which is extended with the patterns detected in Reference [
13]. The list comprises the following SAR patterns:
Creeping line (and parallel track): A creeping line pattern is constructed with the sequence of two turn left and two turn right (or two turn right and two left) with fixed size of 3 loops. The creeping line and the parallel track have very similar shapes with the only different that in the former case, the search legs are at right angles to the major axis of the search area, whereas in the latter search legs are parallel to the major axis of the search area.
Sector: A Sector Search aims to cover a limited area, with the first leg usually orientated in the probable direction of the target drift. Once the length of the search legs exceed 3× the sweep width, ‘gaps’ start to appear in the pattern. The pattern is constructed with a random choice of loop value between 2 to 4 and with the constant sequence of a go-straight, turn left, turn left (or go-straight, turn right, turn right) movements with a random turning value between 110 to 130 degrees. This is the most difficult SAR pattern to be constructed and the geometry, as well as the full completion of pattern is loosely achieved, without change the extensively the noise parameters and thus not succeed of making a solid randomly real sector pattern trajectory.
Box or Expanding square: An expanding square pattern is a complicated movement to carry out due to the constant changes in distance and times for the search legs. Unlike the Sector Search it is not limited in the area it can cover. It is constructed with the use of turn left (or turn right) movements with incremental value of loops from 1 to 6 at most, with step 1 at every iteration. This kind of pattern has certain number of turns and a fixed turning value in order to succeed the geometry required, just like the real SAR patterns has.
Spiral movement: Visually, it resembles the expanding square pattern but with a decreasing radius at each step and without performing almost orthogonal turns. The spiral movement pattern is constructed with the use of a constant turn left (or turn right) movement with a random value of turning between 45 to 80 degrees.
Steps: A steps maneuver usually follows a presumed track but with orthogonal changes in direction and its main purpose is to patrol/scan a large are in the sea. The step up pattern is constructed with the use of a turn left movement with a turn right movement that follows. This pattern is better described as “step up left”. In order to create a “step up right” pattern the sequence of turns is change to a turn right and then a turn left movement.
A visualization of the aforementioned patterns is presented in
Figure 1.
In addition to the above patterns, we assume a random movement, which simulates the random trajectory of a vessel, with small or no changes at all in course and speed. It’s a straight line trajectory, with small distortions because of bearing noise that simulates the trajectory of a vessel heading to its destination. It is important to clarify here that this random movement corresponds to the trajectory of a vessel in the open sea, on the move to its destination and not on the trajectory of the vessel near a port, where many bearing and speed changes may occur.
2.2. Shapelets
According to the pioneering work of Ye and Keogh [
21] shapelets are time series subsequences that are identified in any time-series or 1-D series generated from image outlines. The shapelet identification process can be disconnected from the classification algorithm by performing a shapelet transformation. The result of this separation is that the k best shapelets extracted in a single pass can be used as features in the time-series classification tasks as representatives of class membership. The transformation into the new feature space can improve classification accuracy whilst still retaining the explanatory power provided by shapelets [
18].
The concept of shapelets has recently been introduced in the domain of trajectory classification, by the Movelets method [
22], which discovers relevant sub-trajectories for trajectory classification, without a pre-defined criteria for trajectory partition. In that work, authors generalise the basic concept of Shapelet Analysis, which is defined for only one variable over time, to the multi-dimensional (actually 2-D position over time) Movelet Analysis. The Movelet method is based on the computation of distances between trajectory points, which is then generalised to the distance between points and trajectories, or sub-trajectories and trajectories.
In our work, we build on the two step process of the original Shapelet Analysis for 1-D series. We apply different shapelet transformations to the various features of a vessel trajectory (e.g., course over ground, bearing, speed, etc.) and concatenate the resulting feature vectors in an ensemble vector that contains all the respective shapelet features. Then we train a classifier to distinguish between SAR maneuvers and random movements.
2.3. GENetic DIscovery of Shapelets
As described in the previous paragraphs, in the case of time series classification, shapelets can be considered as subseries that are discriminative for a certain class. Similarly, in vessel trajectories classification, shapelets are important sub-trajectories within a trajectory and in our case are the parts of trajectory that can be used for discriminating between the various SAR maneuvers. The projection of a dataset comprising normal and SAR trajectories to a new feature space, where each feature corresponds to the distance from a certain shapelet, allows any classifier to be used for this task.
GENDIS (GENDIS is available as an open source Python project at
https://github.com/IBCNServices/GENDIS) is an implementation of a genetic algorithm for extracting the most discriminating shapelets from a dataset comprising time-series from two or more classes. According to its author “
The algorithm is insensitive to its parameters (such as population size, crossover and mutation probability, ...) and can quickly extract a small set of shapelets that is able to achieve predictive performances similar (or better) to that of other shapelet techniques.”
More specifically, GENDIS takes as input the training data, which comprises one set of time-series for each class and applies a genetic algorithm that extracts the representative shapelets per class. The genetic extractor starts with creating an initial population comprising randomly selected shapelets (i.e., sub-series) from the input time-series sets. The shapelets are then evaluated on their ability to separate instances from different classes using the cross-entropy loss fitness function. The best shapelets survive to the next generation, where cross-over and mutation is applied to fill the remaining places. Random shapelets are added and removed at each iteration and Gaussian noise is added to the randomly inserted shapelets in order to increase population variety. At the end of this training process (i.e., if the best fitness score remains the same for several iterations or if the maximum number of iterations has been met) the extracted model comprises the representative shapelets (for all classes) for the specific classification task.
By applying the extracted model (shapelet feature set) on unknown time-series, GENDIS produces a distance matrix of size
, where
N is the number of classes in the classification task and
M is the number of the extracted shapelets. The matrix comprises the distances (using Euclidian distance) of every time series from every shapelet. Although the way this distance is calculated is not the subject of this research, it gives a strong evidence that modern and more sophisticated algorithms for this calculation can produce better results. The produced matrices are the representations of the time-series in the shapelet feature space and can be fitted into a plethora classifications machine learning algorithms. As discussed at
Section 4 even with a simple classifier such as Logistic Regression, high accuracy scores can be achieved in a cross validation experiment on the training trajectory dataset. However, the use of more sophisticated classifiers will probably lead to even better classification models and will produce better results.
An advantage of GENDIS over other algorithms that are used for time-series classification (a long list of algorithms and implementations can be found at the Timeseries Classification website:
http://timeseriesclassification.com/code.php) is that it seems more appropriate for handling noisy time-series and time-series in which the same patterns is repeated at a different scale in time, as is the case with SAR maneuvers, which can vary in scale depending on the vessel type. The former can be handled using the Learned Shapelets variation described in Reference [
23] whereas scale variations can be handled using Dynamic Time Warping [
24] approaches. The genetic approach of GENDIS seems to cover them both, by generating/learning shapelets and shapelet combinations as features, which are then fed to a classification algorithm. However, an in depth experimental study that compares GENDIS against shapelets algorithm or other time-series classifiers is needed in order to validate this.
3. Proposed Methodology
The detection of SAR maneuvers in AIS data can easily be considered as a time-series classification task. In this case, the position of the vessel at consecutive timestamps and/or other navigation features, such as speed, bearing or bearing change are the input to a time-series classifier, that distinguishes between a normal trajectory and a SAR trajectory. The main pre-requisite of any classification task is the existence of a training dataset, that will be used to create the appropriate model that will later be used for the classification of an unknown instance to a class.
The main problem concerning the classification of vessel trajectories, either to SAR maneuver types, or to normal or outlying patters, is the lack of labeled trajectory instances that can be used for the training and validation of a classifier. In order to tackle this problem, in this work, we developed a trajectory generator, which is employed in the first step of the training process, as depicted in
Figure 2. The details of the trajectory generator are explained in
Section 3.1.
The second step of the training process comprises some data pre-processing tasks, that are necessary for formatting the data to the format required by GENDIS. The AIS data comprises latitude and longitude information as well as course over ground and bearing at different timestamps, which are not always at equal distances. Additionally, it contains a lot of redundant information in the form of consecutive positions in which the vessel have the same speed, bearing and so forth. So, it is necessary to pre-process trajectories in order to keep only the useful information, correct any missing or wrong values, or even calculate more features (such as bearing change). Another problem that has to be handled at this step, is the complexity of the GENDIS shapelet transformation, which makes it impossible to train using very long time series without enough hardware resources. A vessel’s trajectory can have several thousand samples and a meaningful and fully recognizable pattern can be observed to trajectories with hundreds of samples. So several techniques are used and a certain original scale down technique is introduced, which even if it’s not optimal, produced undoubtedly good results. The details of this preprocessing process are explained in
Section 3.3.
The third step, comprises the shapelet extraction using the Genetic extractor and is strongly connected to the last step, that trains a Logistic Regression classifier using the trajectories transformed into the shapelet feature space. The output of this process comprises two models: (i) the time-series transformer, which has been fitted to the training data and can take any time-series and map it to the shapelet feature space, (ii) the Logistic Regression classifier that can take any time-series represented in the shapelet feature space and assign it a class label. The details of this step are given in
Section 3.2.
More than one time-series transformers (shapelet models) can be trained, using different features of the labeled trajectories (e.g., speed, bearing, bearing change, etc.) so that they can map a trajectory to vectors in the respective shapelet feature spaces. The concatenated vectors can then be used as input to the trained classification model in order to improve the classifier performance, through the introduction of more shapelet features. The whole process is depicted in
Figure 3. The shaded boxes represent the models trained in this process (both the shapelet transformation models and the classifier). Dashed arrows represent the use of the trained models for the transformation of time-series to vectors in the shapelet space and for the classification of unknown shapelet vectors respectively (pointed by thick arrows that connect the model to the transformation or classification action).
In the case of synthetic time-series data, the genetic algorithm of GENDIS is applied to learn the important shapelets, which are then used to extract the shapelet feature representation of the time-series. The same extracted shapelets (model) are used to transform the real time-series to feature vectors. Any classifier can be trained using transformed annotated data (either manually annotated real data or synthetic data) and applied on the vector representations of real trajectories.
All the code that implements the aforementioned workflow, as well as our synthetic datasets and all other data used in the experiment are publicly available on GitHub (
https://github.com/gustrip/hua-thesis/). The ’tools’ folder contains the core code for our experiments, comprising: (i) code for generating synthetic trajectories (trajectory_generator.py), (ii) code for reading csv files that contain multiple vessel points and convert them to time-series (data_extraction), (iii) a library of utilities for down-sampling a real dataset, for converting, standardizing and fitting the data (utils.py), (iv) code for setting up and running the experiments on synthetic data (experiments.py) and so forth. The ’notebooks’ folder contains a series of Jupyter notebooks that demonstrate the usage of the developed code and visualize some plots, which can be found at the ’notebooks/figures’ subfolder.
3.1. Generation of Synthetic Datasets
The limitations in annotated vessel trajectory data makes the application of supervised machine learning techniques really difficult [
25]. However, the generation of synthetic trajectories can be a solution for the cases that the movement patterns are well defined, as is the case of SAR maneuvers. In this work, we developed a trajectory generator that is able to produce realistic AIS datasets that contain SAR maneuvers, with a certain amount of noise and random movements. For the moment, the trajectory generator produces values only for the features that are essential for the trajectory classification process. More specifically, it generates trajectories that contain the following 6 features:
Timestamp: It is used for the temporal ordering of the trajectory points.
Latitude: The vessel’s latitude at that timestamp.
Longitude: The vessel’s longitude at that timestamp.
Bearing: The vessel’s bearing (i.e., the angle in degrees between North and the vessel’s course) at the same moment. It’s important to state that bearing, is more preferred than heading, which demonstrates the direction that the vessel is pointing and changes more frequently.
Speed: The actual vessel speed over ground in knots.
Distance: The distance covered since the previous position reported by the AIS.
The last two features have not been used in our experiments but will be integrated into future versions of the classifier.
The trajectory generator has several parameters that allow to generate trajectories with less or more noise at bearing, speed and sampling frequency, in order to better simulate real datasets. The starting timestamp has been arbitrary set to be 1 February 2015 12:00:00 and the starting longitude and latitude values are set to be in the center of the Aegean sea, in Greece. However, any values can be used in place.
The trajectory generator can produce datasets with information about SAR patterns and random trajectories. The SAR patterns that are supported comprise: (i) Step up, (ii) Spiral movement, (iii) Expanding square, (iv) Creeping line, (v) Sector. These patterns are composed from the following simple vessel movements:
Left turn: A left (anti-clockwise) turn is defined as a change (subtraction) in the vessel’s bearing by a desired number of degrees. The default value is 90 degrees.
Right turn: A right (clockwise) turn is defined as the addition of a number of degrees to the current vessel’s bearing. The default value is 90 degrees.
U-turn: A u-turn is the subtraction of 180 degrees from the current vessel’s bearing.
Straight-forward: This refers to a vessel that continues its course with no change in its bearing.
The resulting bearing values at any moment are expressed in degrees and cannot be lesser than 0 degrees and greater than 360 degrees. These four movements are combined in a specific order in order to synthesize the respective maneuver and are repeated depending on a given loop value. The loop value represents the times that this kind of movement must be performed. If it’s mentioned otherwise, the loop value is a random integer between 2 to 6 (in the experiments, values 2, 3, 4 have a higher probability). Every simple movement can have speed, frequency and bearing noise. Limits for these kind of noise are ±2–60 m/s, ±3–15 min, ±0–3 degrees respectively.
Figure 4 presents an example of the resulting synthetic pattern for an expanding square maneuver (left) and the respective plot for the bearing (right).
3.2. Fine Tuning of GENDIS and Classification Models
This stage refers to the training phase of GENDIS and the Logistic Regression classifier using the synthetic data. The trajectory generator is used to create enough and meaningful data for the tuning of the models’ parameters and the cross-validation evaluation of the resulting models. Since we have five different maneuver types, we choose to train five different binary classifiers instead of a single multi-class classifier. Each classifier is trained using a different synthetic dataset comprising trajectories that contain a certain maneuver and trajectories containing a random movement. As already depicted in
Figure 2 the synthetic trajectories are converted to time-series, are normalised and standardised and used to fit the GENDIS shapelet model. We train our models using: (i) only the vessel bearing time-series, (ii) only the vessel bearing change time-series and, (iii) both time-series (mixed). This last case, supports the multi-timeseries model depicted in
Figure 3.
The GENDIS algorithm has several parameters that allow to set the number of individuals in the population, the number of generations to use, the existence of noise in the generation of shapelets and so forth. The optimal values for all these parameters are subject of a hyperparameter tuning process. In order to improve the discriminating power of our classification model, we experiment with several parameters of the trajectory generator, the GENDIS algorithm, as well as with parameters of the Logistic Regression classifier. This hyper-parameter tuning process, allowed us to better simulate the real-trajectories that comprise SAR maneuvers and consequently to adapt the extracted shapelet features to the characteristics of each pattern.
GENDIS fits the training data to its genetic extractor and finds the best shapelets that constitute its model. The training data are then transformed to distance matrices (one for each class) containing the distances of each training sample from the selected best shapelets. A similar distance matrix is generated for any trajectory in the test dataset during the shapelet transformation step. The resulting matrices can be fitted to a plethora of classifications algorithms. As shown in the experimental evaluation section, even with a simple classifier, such as Logistic Regression, high accuracy scores can be achieved in a cross validation setup that comprises synthetic trajectories only.
3.3. Pre-Processing of Real Trajectories
The synthetic trajectory data and so the time-series that are fed to the GENDIS algorithm, comprise only a few values that correspond to the major points in a vessel trajectory that define the pattern. In a real trajectory, the length of the time-series is much bigger and thus it is important to properly pre-process it in order to capture the sub-segment that contains the pattern and extract the shapelets that can assist in its correct classification. For example, the creeping line pattern in the real dataset has been recorded in a trajectory of more than 500 points, whereas the GENDIS algorithm has been trained with time-series of length 25. In order to scale down real data trajectories (or large segments of these trajectories) to the time series of appropriate length without loosing useful information, we propose a scale down algorithm that focuses on the interesting points of the trajectory. More specifically, the algorithm considers as interesting points:
those that have a bearing change above a threshold (a predefined parameter). In our experiments, the bearing change threshold is set to 30 degrees, expressing that a point is kept when the difference in bearing from its previous step is larger than this threshold.
those that have a distance from their previous point greater than the half of the mean distance value so far. For this purpose the distance covered between every two consecutive points is calculated and the mean distance is updated every time a new point is examined. With this technique all the points that are spatially close are ignored (especially, when the vessel is stopped).
the points that can be of interest for any of the two previous reasons but have not been recorded right after (or a few recordings after) point already marked as interesting.
When a trajectory comprises points in a straight route, without any stops or turns, then there is a chance that it will be scaled down to a time-series with only a few interesting points. In this case, the algorithm tries to fit more points between the selected points, at equal distance, so that the final time series is more representative of real data and adjusts perfectly to the target length. Even in that case, when the final time series does not have the proper length it is rejected from the classification process. In other words, the scale down algorithm, not only acts as a mean to reduce the size of real data trajectories, without losing meaningful information but also as a filter that can separate interesting trajectories from trajectories that have too few or too many values to be predicted as SAR patterns.
Other alternatives tried in this work, was the Ramer-Douglas-Peucker trajectory simplification algorithm [
26] and a simple segmentation to smaller trajectories, as well as combinations of the scale-down and simplification techniques. More specifically, we evaluated four different techniques, as depicted in
Figure 5. In the “Scale-down” technique, the whole time-series of a vessel’s trajectory is first extracted and then our proposed method is applied to select only the most representative values (values of high change). In the “RDP & Scale-down” strategy, the RDP algorithm is first applied to remove redundant trajectory points and then the scale down technique is applied to further reduce the time series length. In the “Trajectory segmentation & Scale-down” technique, the large trajectory is split to subtrajectories of smaller size and then the Scale-down technique is applied. In the “RDP only” technique, the RDP algorithm is applied, with a parameter that results in a time-series of the apropriate length, so the scale-down is not necessary.
The complexity of the shapelet discovery algorithms, is upper bounded by the number of candidates in a dataset (the authors of Reference [
23] say that it is
, where N is the number of training series and M is their length). This complexity is evident at training time, when many synthetic trajectories and hundreds of interesting points are employed. However, at test time the shapelet feature extraction can be easily parallelized for the trajectories of different vessels and is quite fast when only the important points of the trajectory are processed (after scale-down is applied). As far as it concerns the training of the classifiers on synthetic data and their application on real trajectories at test time, the classifier complexity (in our case the logistic regression) is not a bottleneck.
4. Experimental Evaluation & Results
The unsupervised approaches that already exist in the literature, show that using some simplistic rules [
2] that seek for repetitive changes in speed and orientation or using a spatial clustering of important trajectory points [
13] is enough for distinguishing between a normal movement and a potential SAR maneuver. However, when we need to detect the type of maneuver and decide whether it is a Search one (e.g., a step-up pattern) or a Rescue one (e.g., a spiral) it is necessary to classify the maneuver to the nearest document pattern. Since there is no previous work that focuses on this level of detail and there is no manually annotated dataset that contains information about the type of maneuvers performed be the vessels, we evaluated our approach mainly on synthetic data and we demonstrate its use of a real dataset that comprises trajectories of vessels that have been engaged in SAR missions.
In our experiments, we worked on three different scenarios:
Optimization scenarios on synthetic data of a single pattern. At this type of scenarios, the best accuracy score it’s evaluated for the cross validation of test data with different settings of trajectory generator and GENDIS module. There are 8 different scenarios.
Binary classification scenarios on synthetic data: For these scenarios the best values from the above optimization have been used and different binary classification tasks (one per SAR pattern) have been evaluated. The classes are balanced in all synthetic data scenarios both in training and test datasets. The scenarios just give accuracy scores between the different kind of movement. We run two binary classification scenarios for eacg pattern. In the first type of scenario the classifier had to decide between the pattern and the random movement, whereas in the second, had to decide between the pattern and the step up pattern. The aim of the second type of experiments was to evaluate the ability of the classifier, which uses the shapelet feature representation, to distinguish between two SAR patterns. The step up pattern was selected as the basis for this type of experiments, because it is the most general and simple pattern of all.
Multi-class classification scenarios on real data: For these experiments we evaluated all the pre-processing techniques described in
Section 3.3 and manually examined the identified SAR patterns.
The invariable setting of the optimization scenarios are:
Kind of movement: with a Steps vs Random movement.
Time-series length: this setting was always 25 due to hardware restriction and due to the complexity of the GENDIS algorithm.
Sampling frequency: using 1 sample per 3 min
Trajectory feature: Bearing was the only feature used.
Population size: It was selected to be 20 because of hardware limitations.
add_noise_prob, add_shapelet_prob, crossover_prob, remove_shapelet_prob (of GENDIS module) with values 20, 0.3, 0.3, 0.66, 0.3 respectively, which are the proposed default settings of the GENDIS algorithm.
The varying parameters in the optimization scenarios are:
The number of time series to produce (using the trajectory generator), with values of 100 and 150
The number of GENDIS iterations, with values of 5, 10, 15 and 20.
4.1. Optimization on Synthetic Data
For evaluating and optimising the parameters of our setup, we used the “Steps” vs. “Random” pattern case in all the optimisation scenarios. As explained above, there are eight different scenarios, for different numbers of input time series (training samples) and a different number of iterations for the genetic extractor. Every scenario has been repeated 100 times and the 800 accuracy results (using 10-fold cross validation in each experiment) have been recorded. In order to summarize our results, we measured the average accuracy for all the experiments, which was 86.76% and used the following labels to annotate the performance of each experiment:
Bad: results with prediction’s accuracy score smaller than 80%.
Acceptable: results with prediction’s accuracy score from range 80% to 90%.
Excellent: results with prediction’s accuracy score from range 90% to 99%.
Perfect: results with perfect prediction’s accuracy score with value 100%.
Table 1 summarizes the results of our optimization experiments. In most of the experiments (83.5%) the accuracy is above the level of 80%.
Table 2 shows the best performance achieved for each scenario, the times it has been achieved (in the 100 repetitions) and the average execution time. It can be observed the scenarios that have been trained with more time-series (scenarios 5–8) have better results than the others and among them, the scenario that performed the maximum number of iterations in the GENDIS algorithm (20 iterations) is signifficantly better that all the scenarios 1–4. The execution time, which comprises both the shapelet fit and extraction and the training and testing of the classifier, is less than 5 min per scenario, which is considered acceptable for this task. The parameters training samples and number of GENDIS iterations have been set to 150 and 20 after this experiment.
4.2. Binary Classification on Synthetic Data
After setting up the parameters for the GENDIS algorithm and the synthetic data generator in the first experiment (i.e., Steps vs. Random classification), we perform additional experiments for better understanding the nature of every pattern. We evaluated (100 repetitions each) two types of scenarios: (i) binary classification scenarios (scenarios 9–12), where we have to distinguish between a certain SAR maneuver and a Random movement and (ii) binary classification scenarios (scenarios 13–16), where the aim is to distinguish between the Step maneuver and other types of SAR maneuvers. The results in all experiments are very promising as depicted in
Table 3, with more than 87% of the runs to have an accuracy score above 90%.
The detailed results per experiment, as depicted in
Table 4, show an impressive classification performance (above 97%) in distinguishing the spiral and expanding square patterns from the random movement and an average accuracy above 90% in distinguishing the Creeping line and Sector patterns from random movement. The results are even better in the binary classification tasks that refer to the Steps pattern and distinguish it from other SAR patterns, which are more complicated and thus easier to detect. This performance can be explained by the major differences that the various SAR patterns have in the bearing and bearing change which result to totally different shapelets being extracted. However, the results in the real trajectories dataset show that there is still place for improvement as explained in the following paragraph.
4.3. Classification on Real Data
After the models have been trained on the synthetic data they can be used for identifying SAR patterns in real vessel trajectories. In our experiments we employed the trajectory data from 5 vessels, for the period between 1 July 2015 and 29 July 2015 and focused on the special case of the vessel SIEM PILOT (this vessel is a cargo vessel that has been hired by European NGOs to patrol in the Mediterranean sea and rescue immigrants who are in danger), which in our previous study, was found to exhibit a clear creeping line pattern at its trajectory.
To test our classification approach in real data, we selected 5 cargo vessels (BOURBON ARGOS-BA, DIGNITY I-DGN, PHOENIX-PHO, SIEM PILOT-SP, VOS HESTIA-VH) that have been reported in the news as vessels that took part in SAR missions. The trajectories of these vessels had a size between 10,000 to 22,000 samples, which is too large even for the Scale-down algorithm to fit to the required time series length (of 25). So we decided to segment the trajectories to chunks of 500 points, which are considered enough for a SAR maneuver to occur (since for every vessel we had one point every 3 min, 500 points correspond to an approximate duration of the trajectory of one day).
After the creation of each chunk, we evaluated the different pre-processing strategies to scale them down to time series of length 25 and classified them using all the binary classifiers defined in the previous section. As depicted in
Figure 5 when more than one pattern have been matched with probability higher than 0.75 the pattern with the higher probability has been selected.
Figure 6 depicts an example from a trajectory of the SIEM PILOT vessel, which has been pre-processed with the four different methods. The plot on the left (
Figure 6a) shows how the Scale-down and RDP methods compare to the original trajectory (of 500 points length), whereas the plot on the right (
Figure 6b) shows the result from the application of the trajectory segmentation method to small chunks (of 180 points length). The RDP & scale down method had the same result as the Scale down method and thus has been omitted from the plot. In the first case the classification method detected the creeping line pattern, whereas in the second case a steps pattern has been detected in the smaller chunk. It is worth mentioning that all other chunks have not been classified as any SAR pattern.
The classifier we applied in all experiments was the logistic regression classifier trained on the synthetic data. In
Table 5, we report on the number of trajectory chunks in which a SAR maneuver has been detected, using only the bearing (left part) and using both bearing and bearing change features (right part) as input. We report the numbers for the 5 cargo vessels that we processed. The table contains pairs of rows referring to the right (clockwise) and left (anti-clockwise) movement of the vessel during the maneuver. In the plots that we provide, this difference is not obvious but is clearly depicted in the bearing and bearing change patterns.
The first message conveyed from the results is that the Spiral movement pattern was never detected in the trajectories of these vessels. Furthermore, the Sector and Steps patterns are the most frequently detected in the dataset. A careful examination of the detected cases reveals several false positives, which is mainly due to the simplicity of the Steps maneuver. The result of this simplicity is that even when a vessel is performing a random maneuver that contains a step at some point, the classifier matches the respective shapelets and recognizes a Steps pattern. On the contrary, in the case of the Sector and Spiral movements, the SAR pattern is too complex and probably in the real case hard to perform perfectly. A last but most important fact is that when bearing change is used together with bearing, the ensemble of shapelets allows to capture more features of the pattern and reduce the number of detected cases, thus reducing recall but increasing the precision of the pattern detection task.
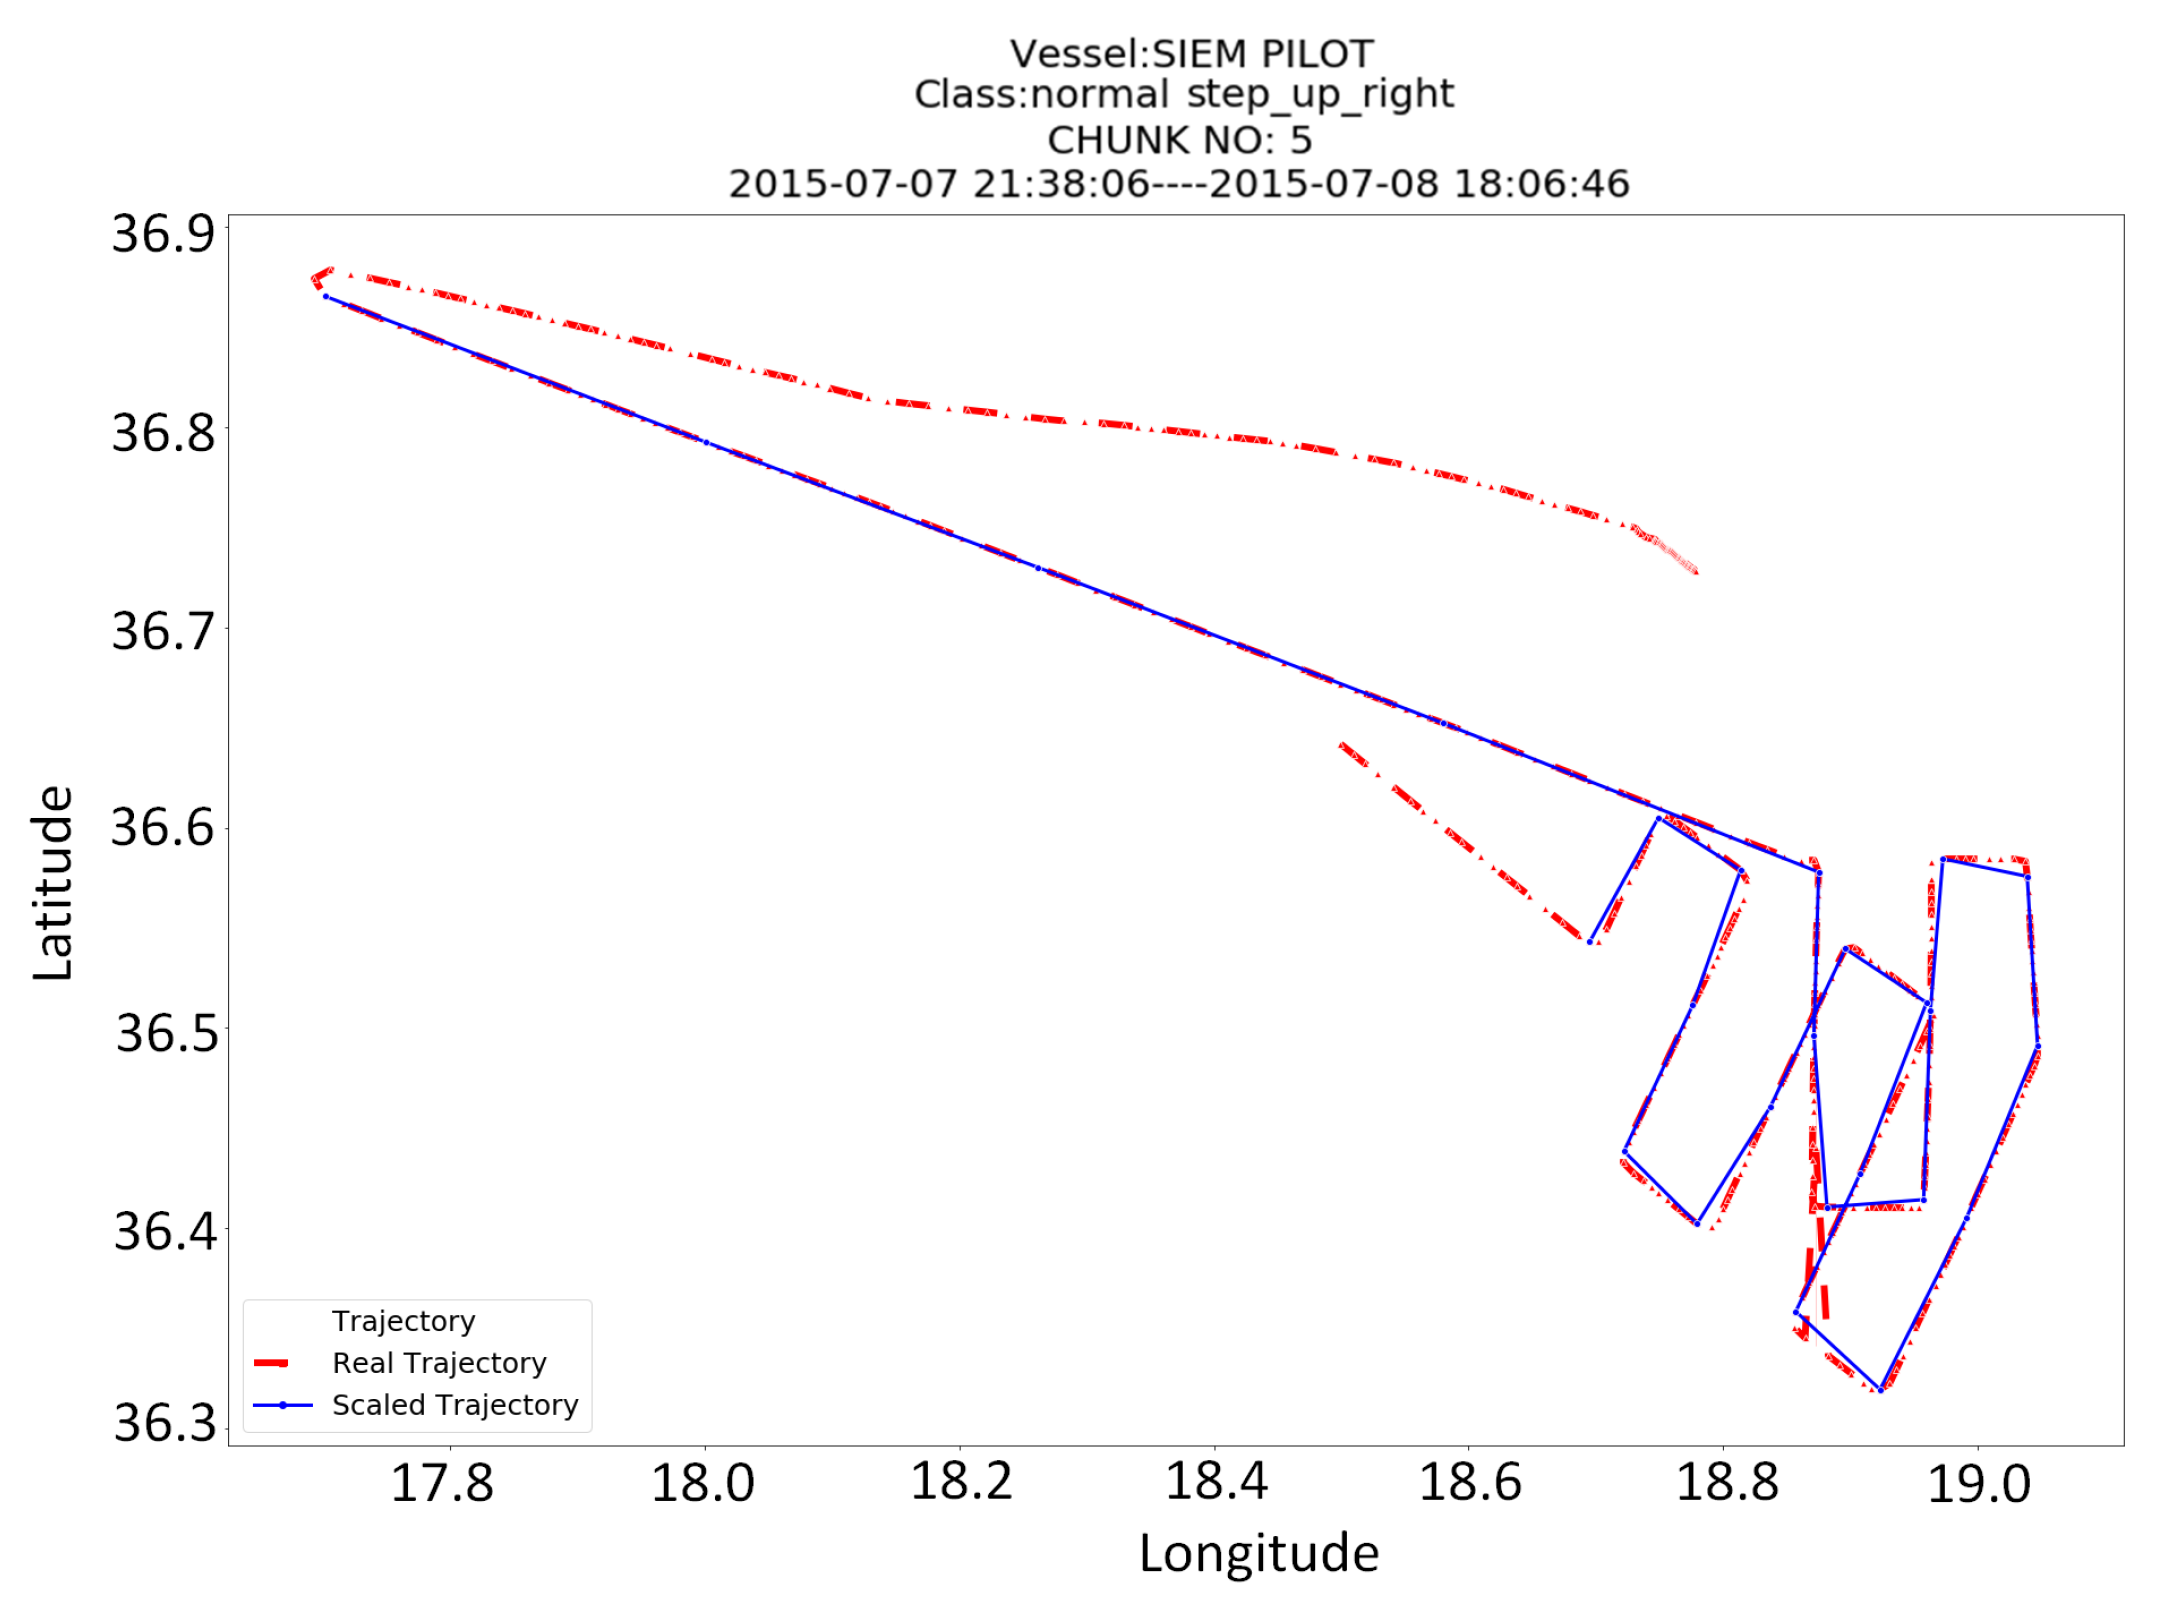
Finally, it is interesting to show some patterns that have been detected by our classifiers and comprise SAR maneuvers. The plots of
Figure 7 show chunks (of 500 points length) of the vessels’ trajectories and in some cases, they zoom on the area, where the patterns have been detected. Among the most characteristic patterns that have been detected are the creeping line of the vessel SIEM PILOT, which is displayed in
Figure 7a and the double sector pattern of the vessel VOS HESTIA, which is displayed in
Figure 7b.
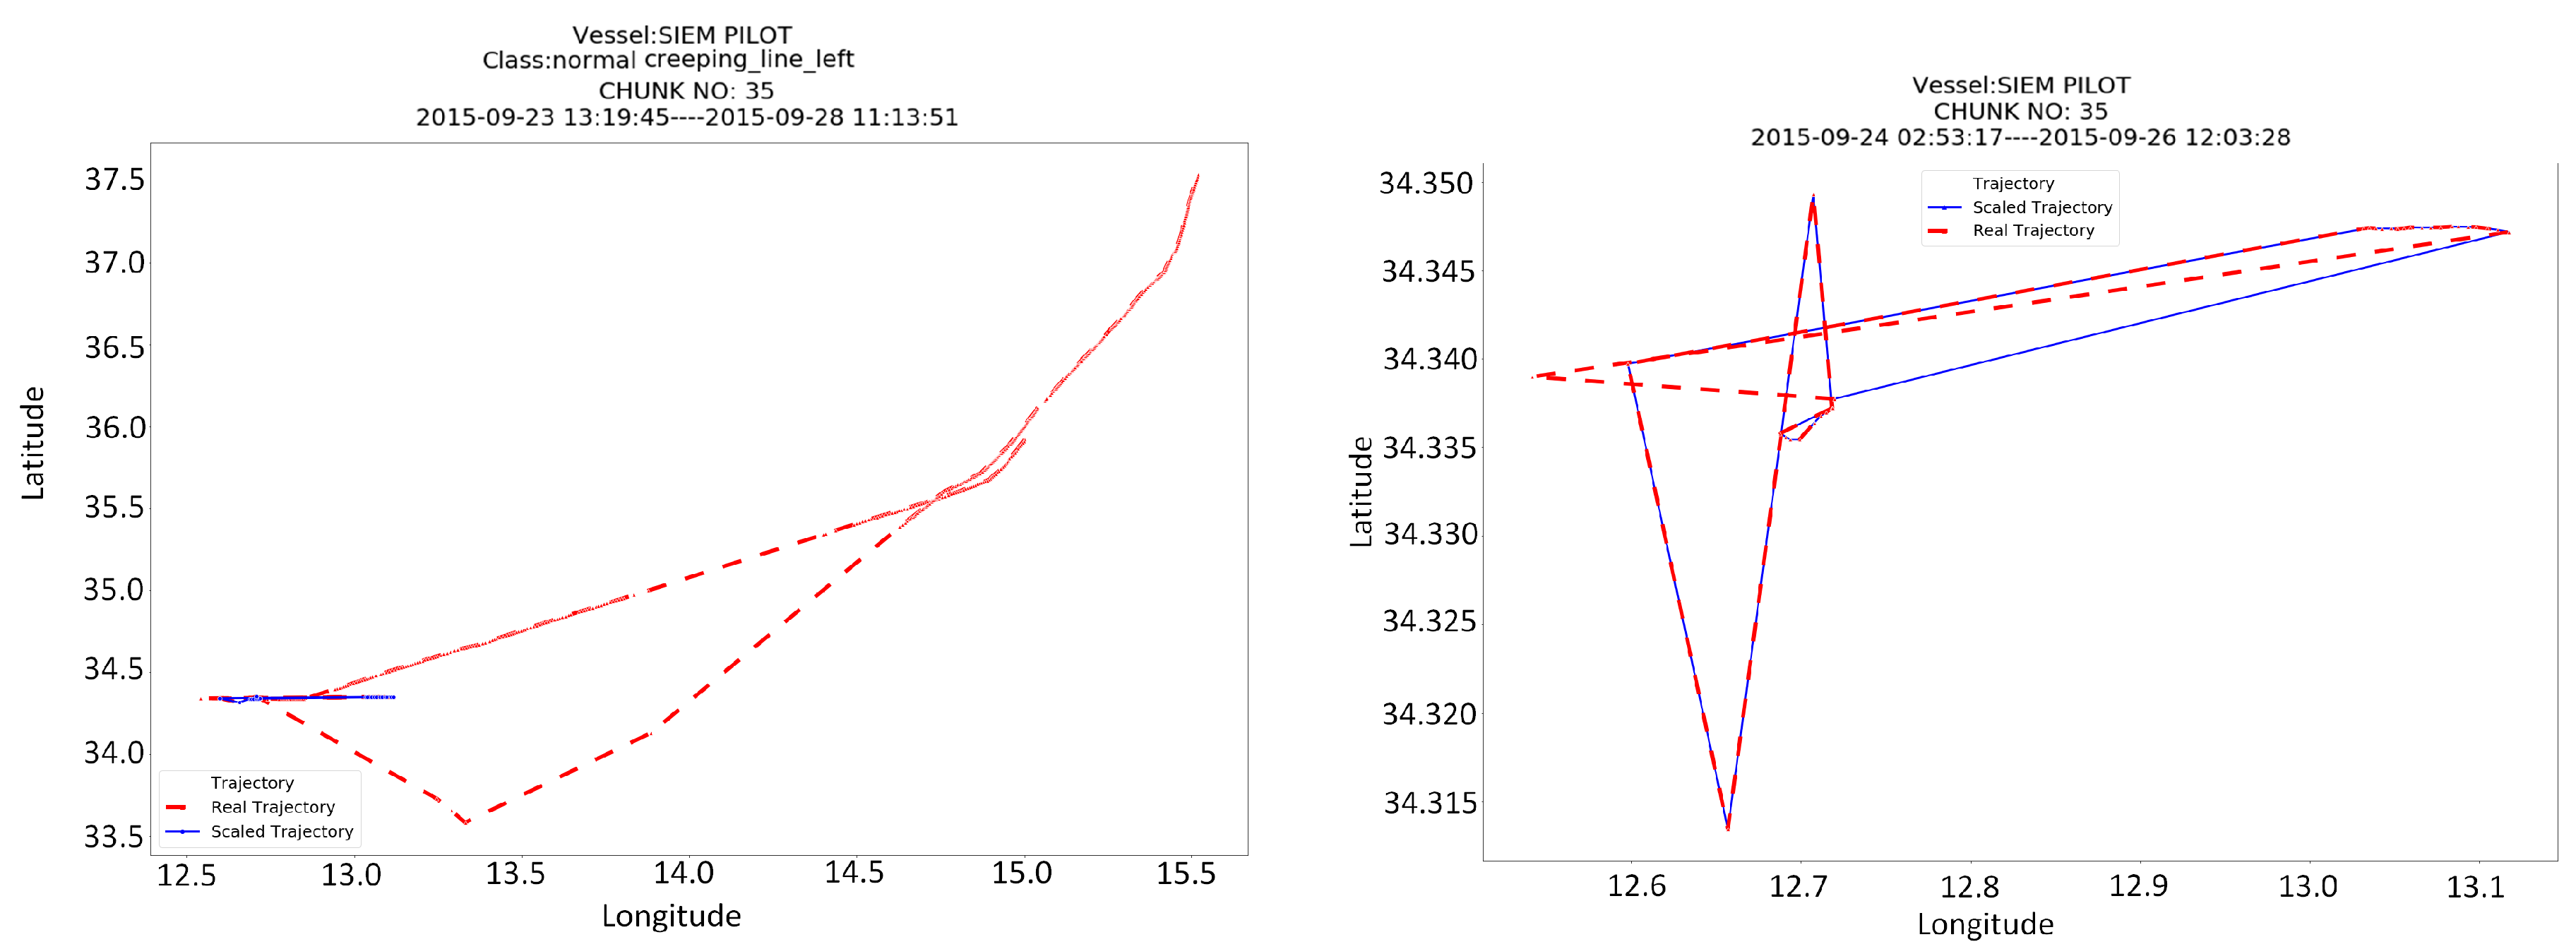
Two more interesting plots that demonstrate the ability of the scale down algorithm to compress the trajectory without loosing information and to capture the part of the trajectory that contains the actual pattern are depicted in
Figure 8. The left plot shows a chunk from the trajectory of SIEM PILOT that has been classified as creeping line. The zoom on the right plot, actually reveal that at the detect trajectory segment the vessel was actually performing some SAR maneuvers. Although there is enough distortion, probably because of the weather and the sea currents in the area, the creeping line pattern is still visible.
Figure 7 and
Figure 8 demonstrate some correct predictions of the proposed technique. However, the evaluation also returned a few false positives. The examination of these false positives will allow us to understand the reasons that evoked classifiers errors and we are currently in the process of examining more features that can be added to the model to increase its accuracy in real data. A typical mis-classification error that has been found in this process is depicted in
Figure 9 where the creeping line pattern of SIEM PILOT has falsely detected as Steps with a higher probability. A reason behind this error, and in general behind the confusion of the Steps pattern with all other patterns, is probably hidden in the shapelet transformation step. In that step, the time-series is converted to a vector in the shapelets’ space using the distance of the time-series from each shapelet. This transformation ignores the number or frequency of occurrence of simple shapelets (e.g., step) in the time-series and keeps only the minimum distance (i.e., from the part of the time-series that mostly resembles to the shapelet). If GENDIS fails to extract more complex shapelets (e.g., consecutive steps, or U-turns) then the transformation will fail. In order to avoid this, either more and longer training samples (time-series) must be used or the transformation method has to be redesigned and this is part of our future work.
5. Conclusions & Future Work
In this work, we presented a methodology for detecting specific SAR patterns in vessel trajectories, using shapelet transformation and classification and a trajectory generator for creating our training data. The methodology introduces several techniques that handle the segmentation and sampling of trajectories, that optimize the shapelet feature selection process in order to improve classification performance and take advantage of multiple trajectory features that change during a SAR maneuver in order to achieve better results. The results on synthetic data are excellent, and the application of the learned models on real data, is very promising since it reveals and correctly classifies SAR patterns in a real vessel trajectory dataset.
Since GENDIS is a genetic-based algorithm it does not guarantee to extracts the best shapelets, especially with few iterations. It is on our plans to compare it with shaplets extracted using the original shapelets algorithm or one of its optimizations as Fast Shapelets, that assure the correct result. Also, since the final result relies both on the quality of the extracted shapelets and the classifier performance, we will experiment with more classification algorithms. It is on our next steps to extract shapelets from more trajectory parameters and examine how they contribute to the predictive capabilities of the classification models. We also plan to evaluate the proposed approach in a multi-class classification task, using additional classifiers and classifier ensembles.
Another extension of this work is towards the direction of pattern extraction from real trajectory data. The application of a trajectory clustering algorithm on the sub-trajectories that contain maneuvers will allow to extract unknown or undocumented patterns that take place in the real world but are not necessarily described in a naval manual. This will allow the shapelet methodology to be extended to more trajectory classification and trajectory annotation problems.


