Joint Optimization of Pico-Base-Station Density and Transmit Power for an Energy-Efficient Heterogeneous Cellular Network

Abstract
1. Introduction
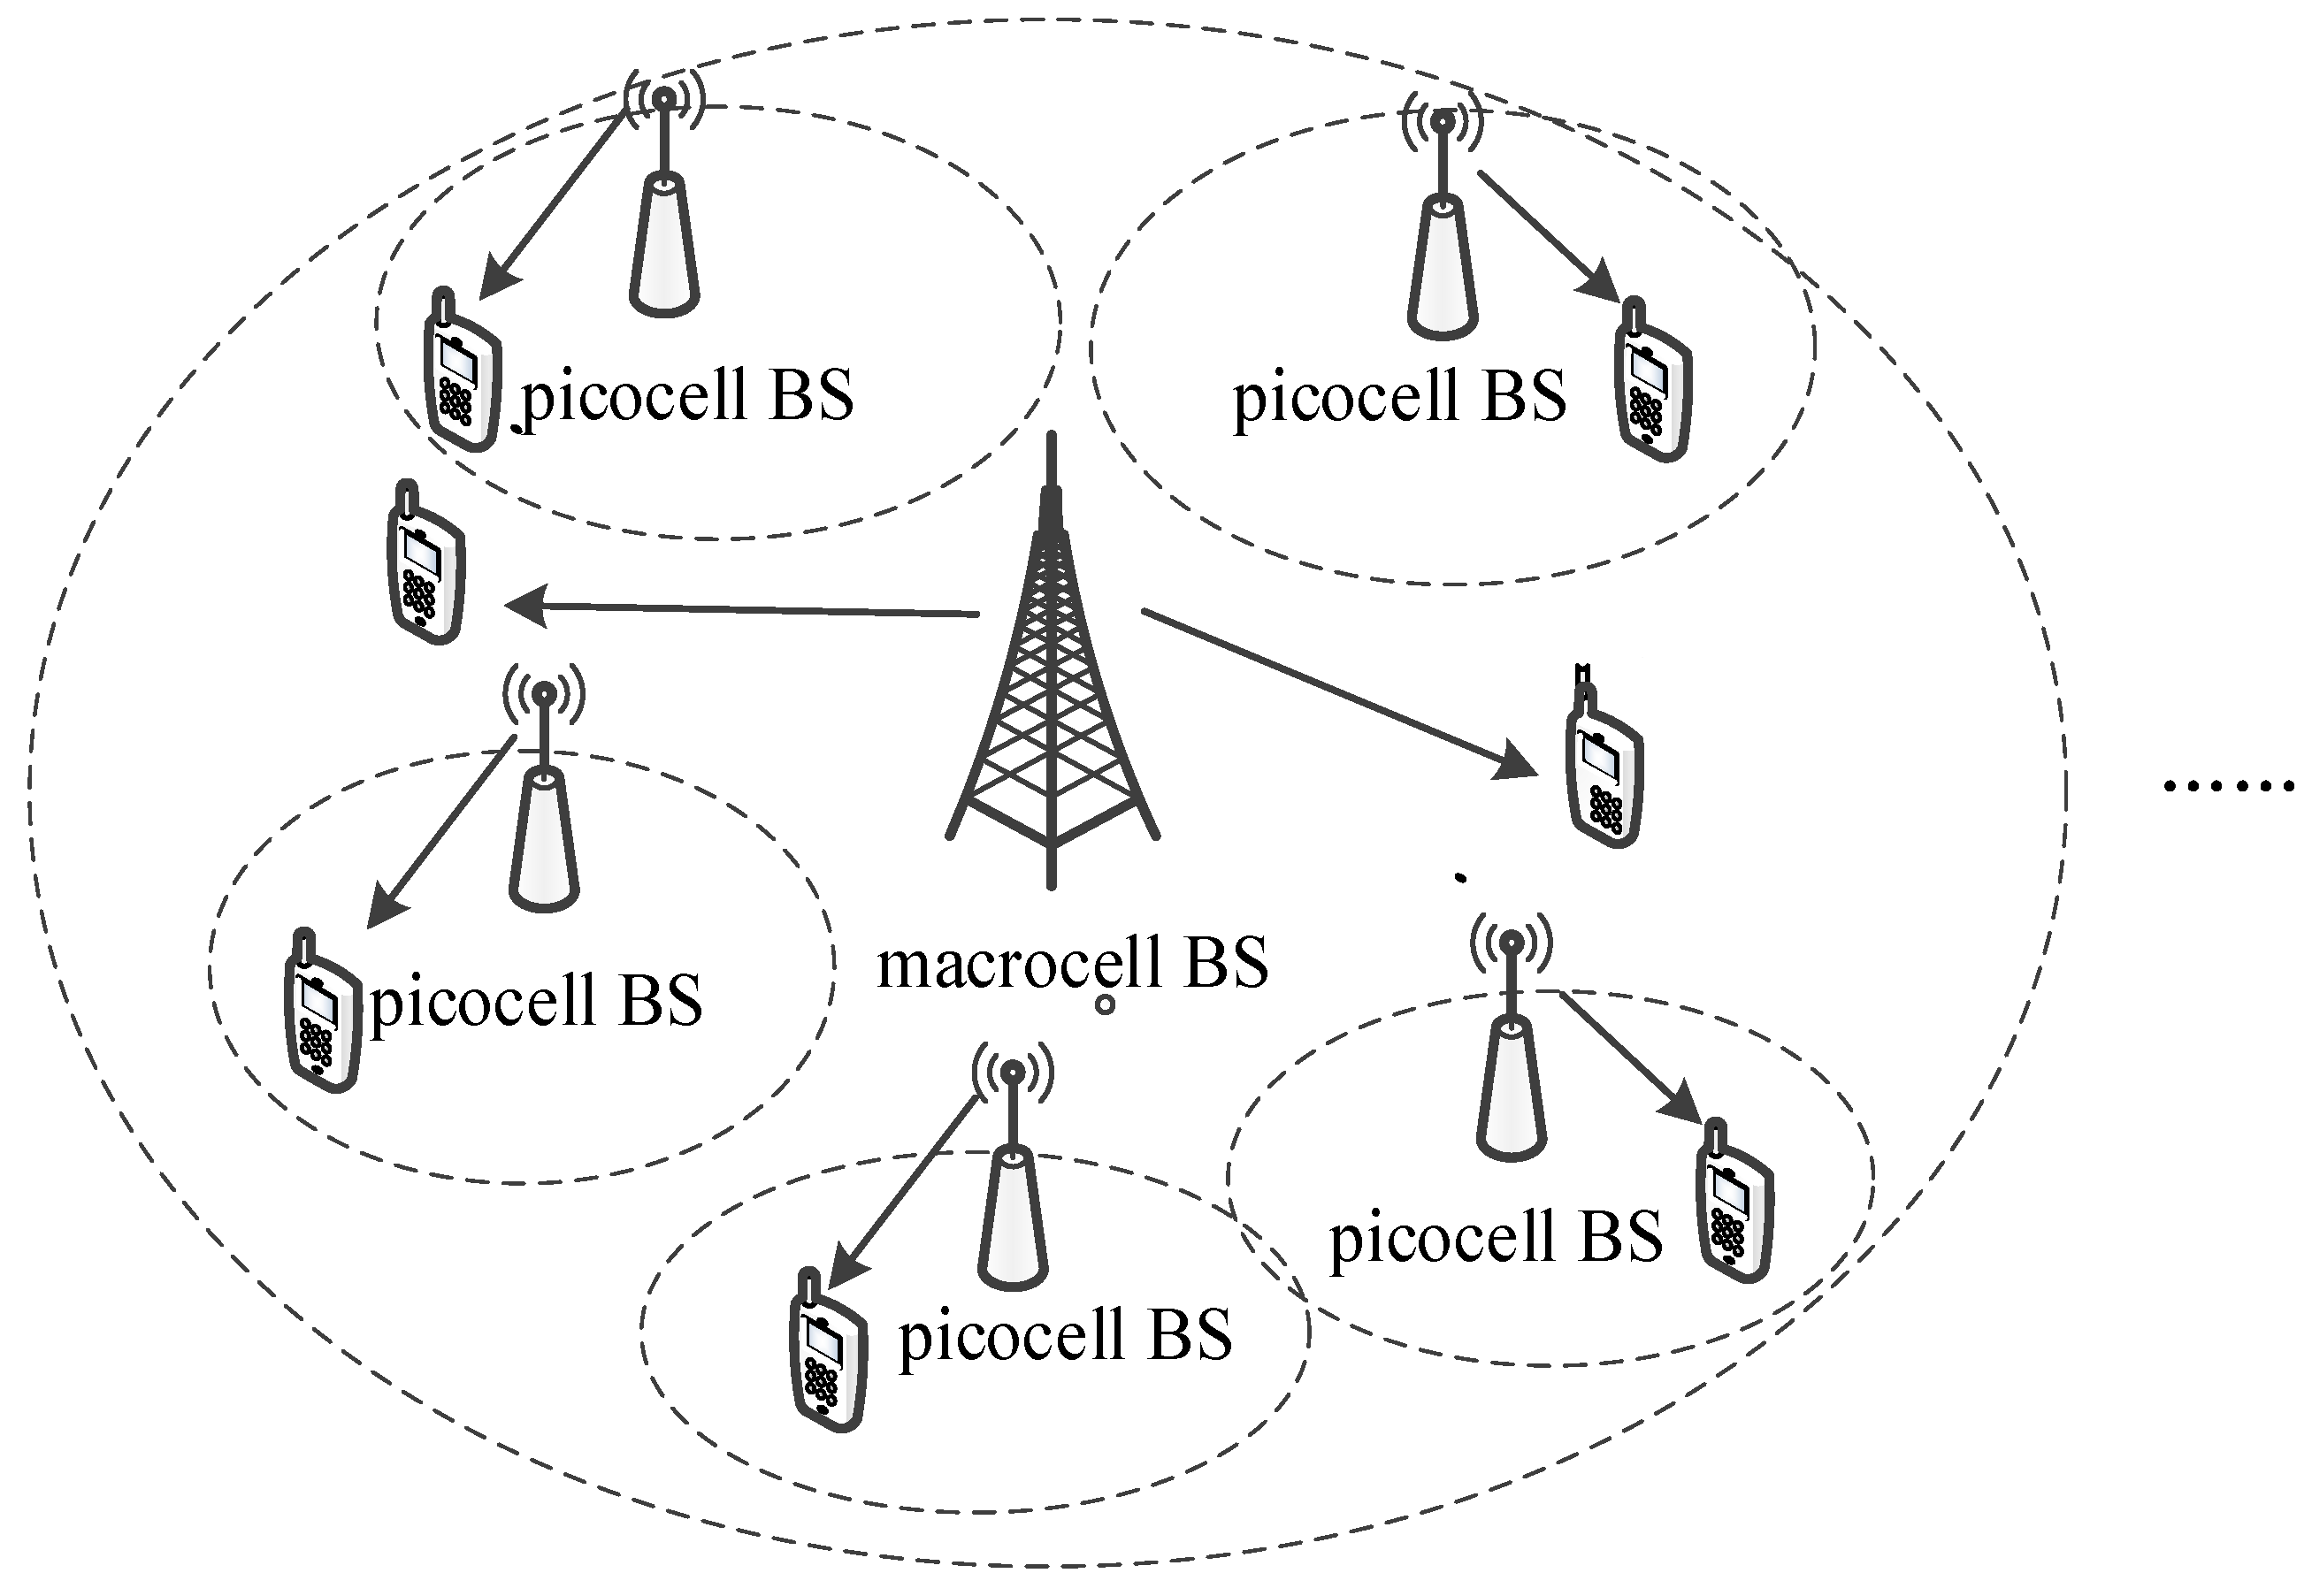
2. System Model
3. Energy Efficiency Analysis
3.1. The Average Achievable Transmission Rate of A Two-Tier HCN
3.2. Total Power Consumption of Two-Tier HCN
3.3. Energy Efficiency of Two-Tier HCN
4. Energy Efficiency Optimization
4.1. Density Optimization Given the Transmit Power of Picocell BSs
4.2. Transmit Power Optimization Given the Density of Picocell BSs
4.3. Joint Optimization of Density and Transmit Power
| Algorithm 1. Alternating Optimization of Density and Transmit Power |
|
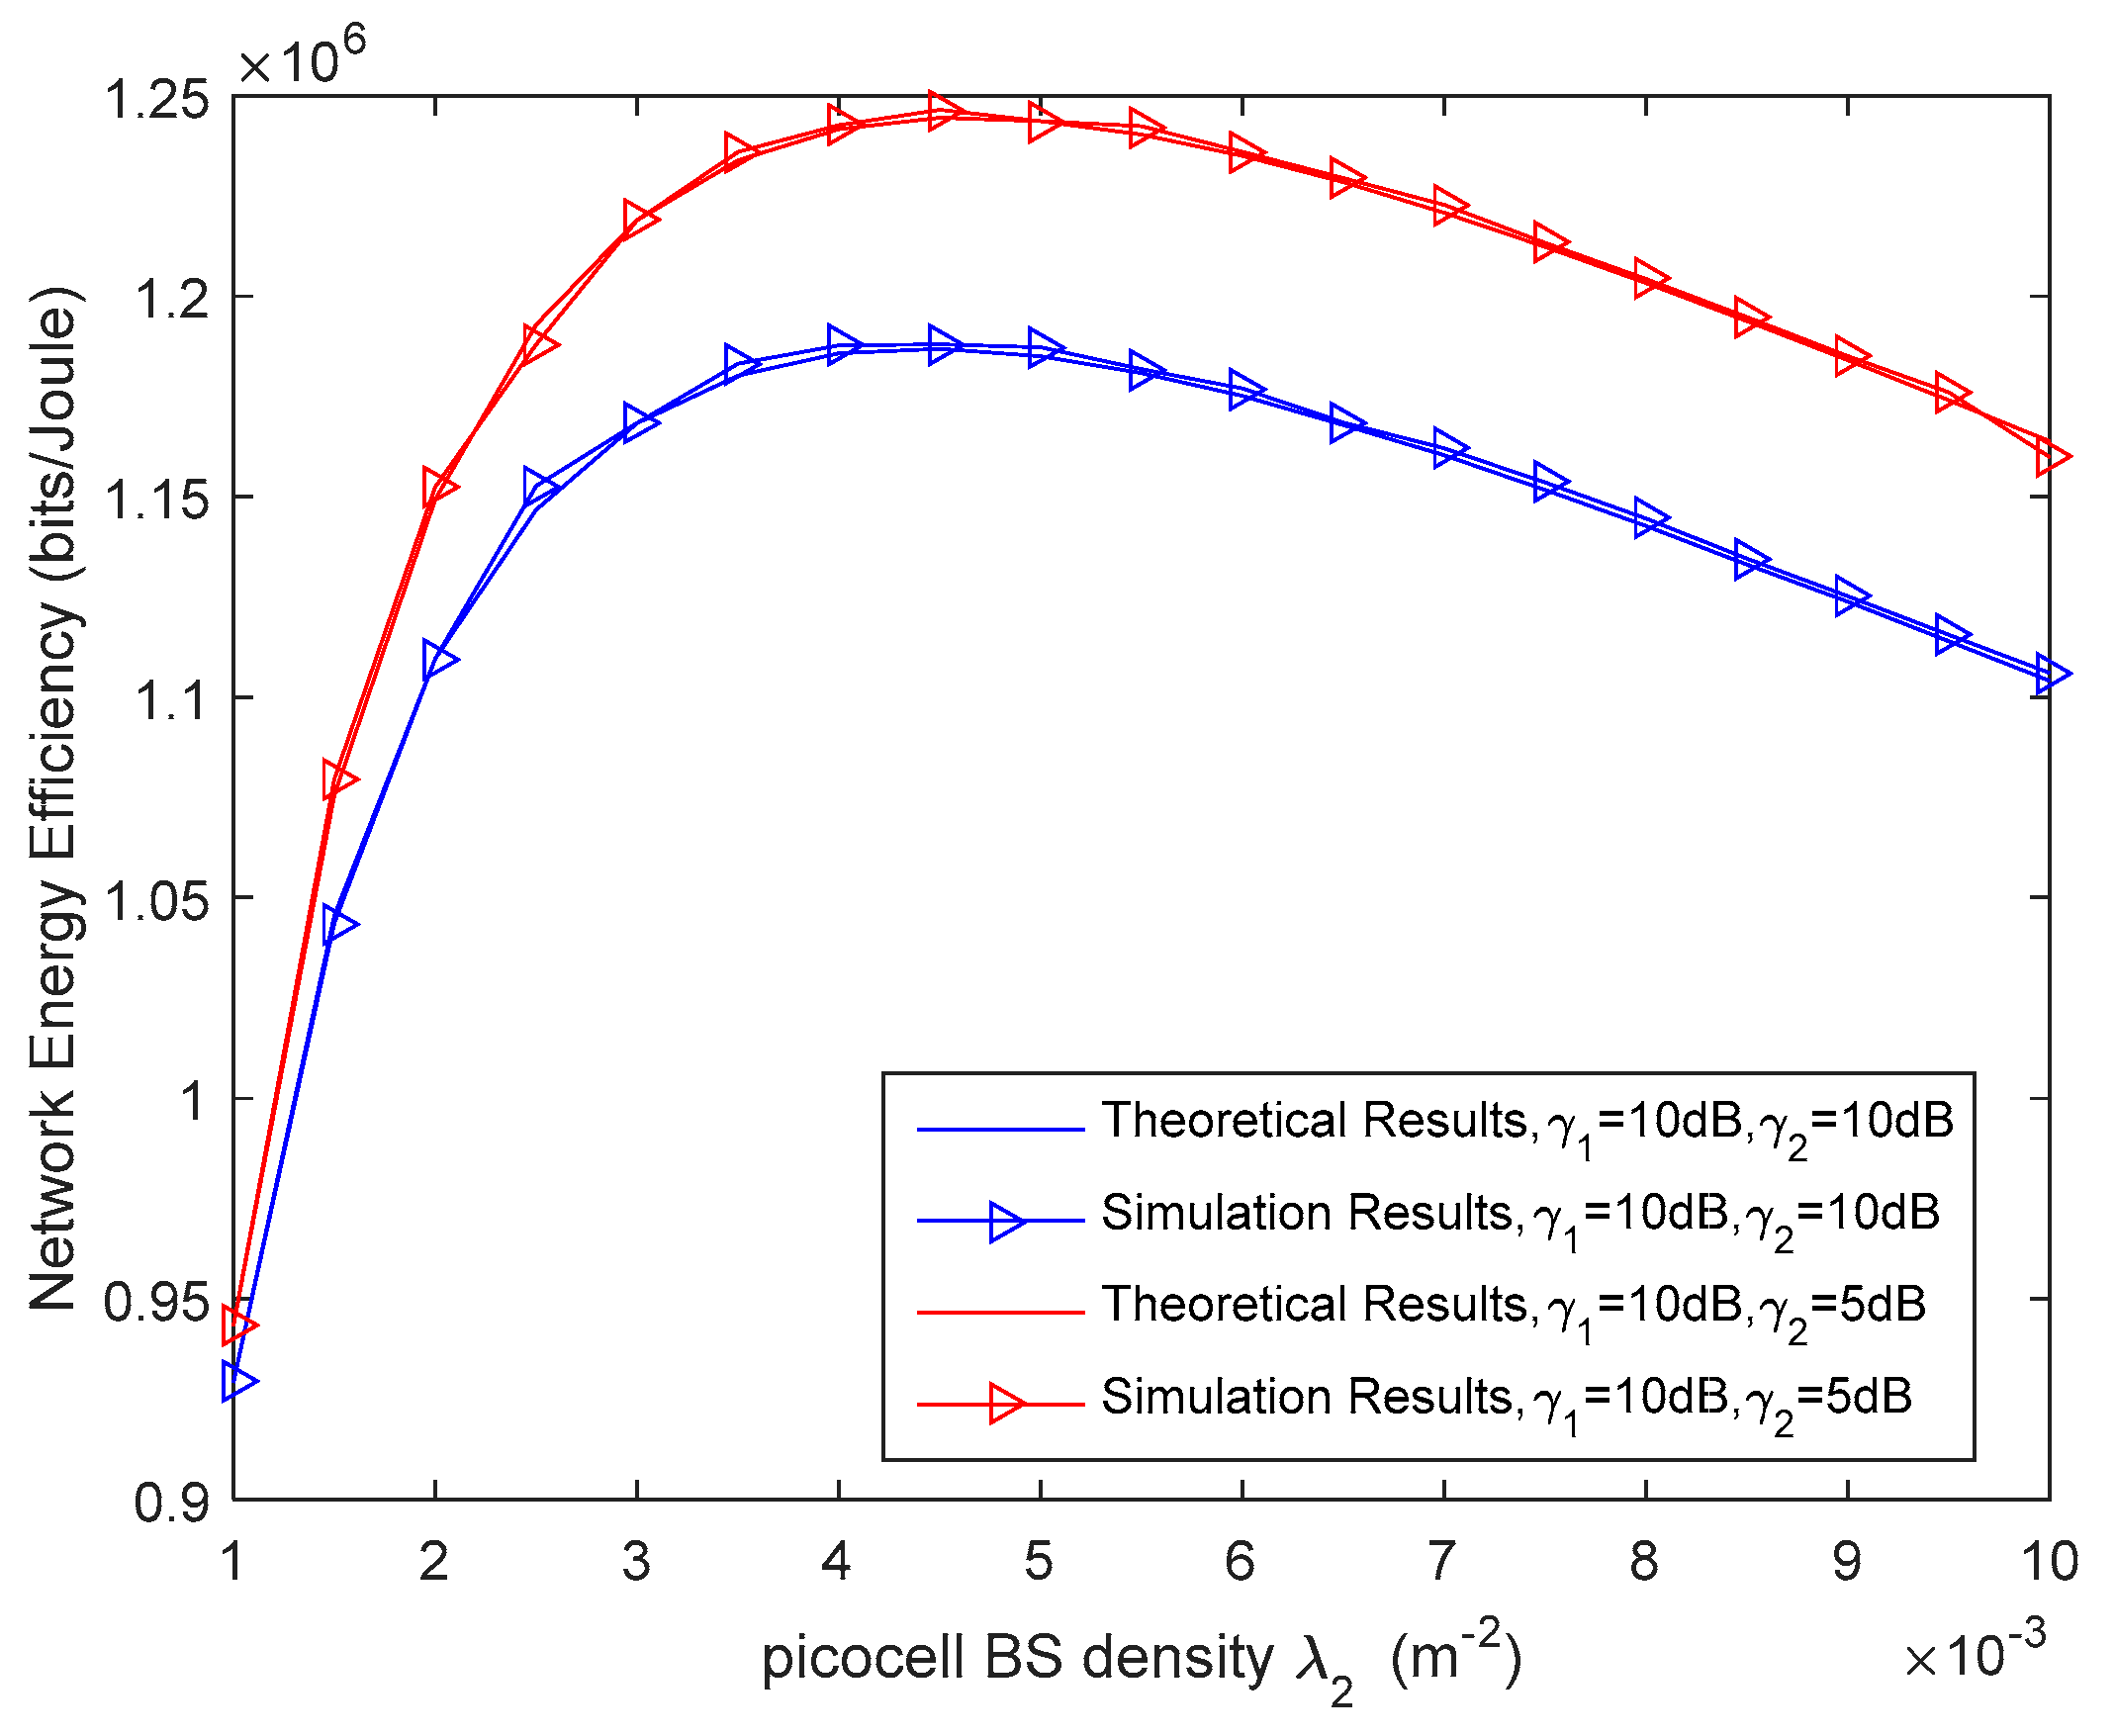
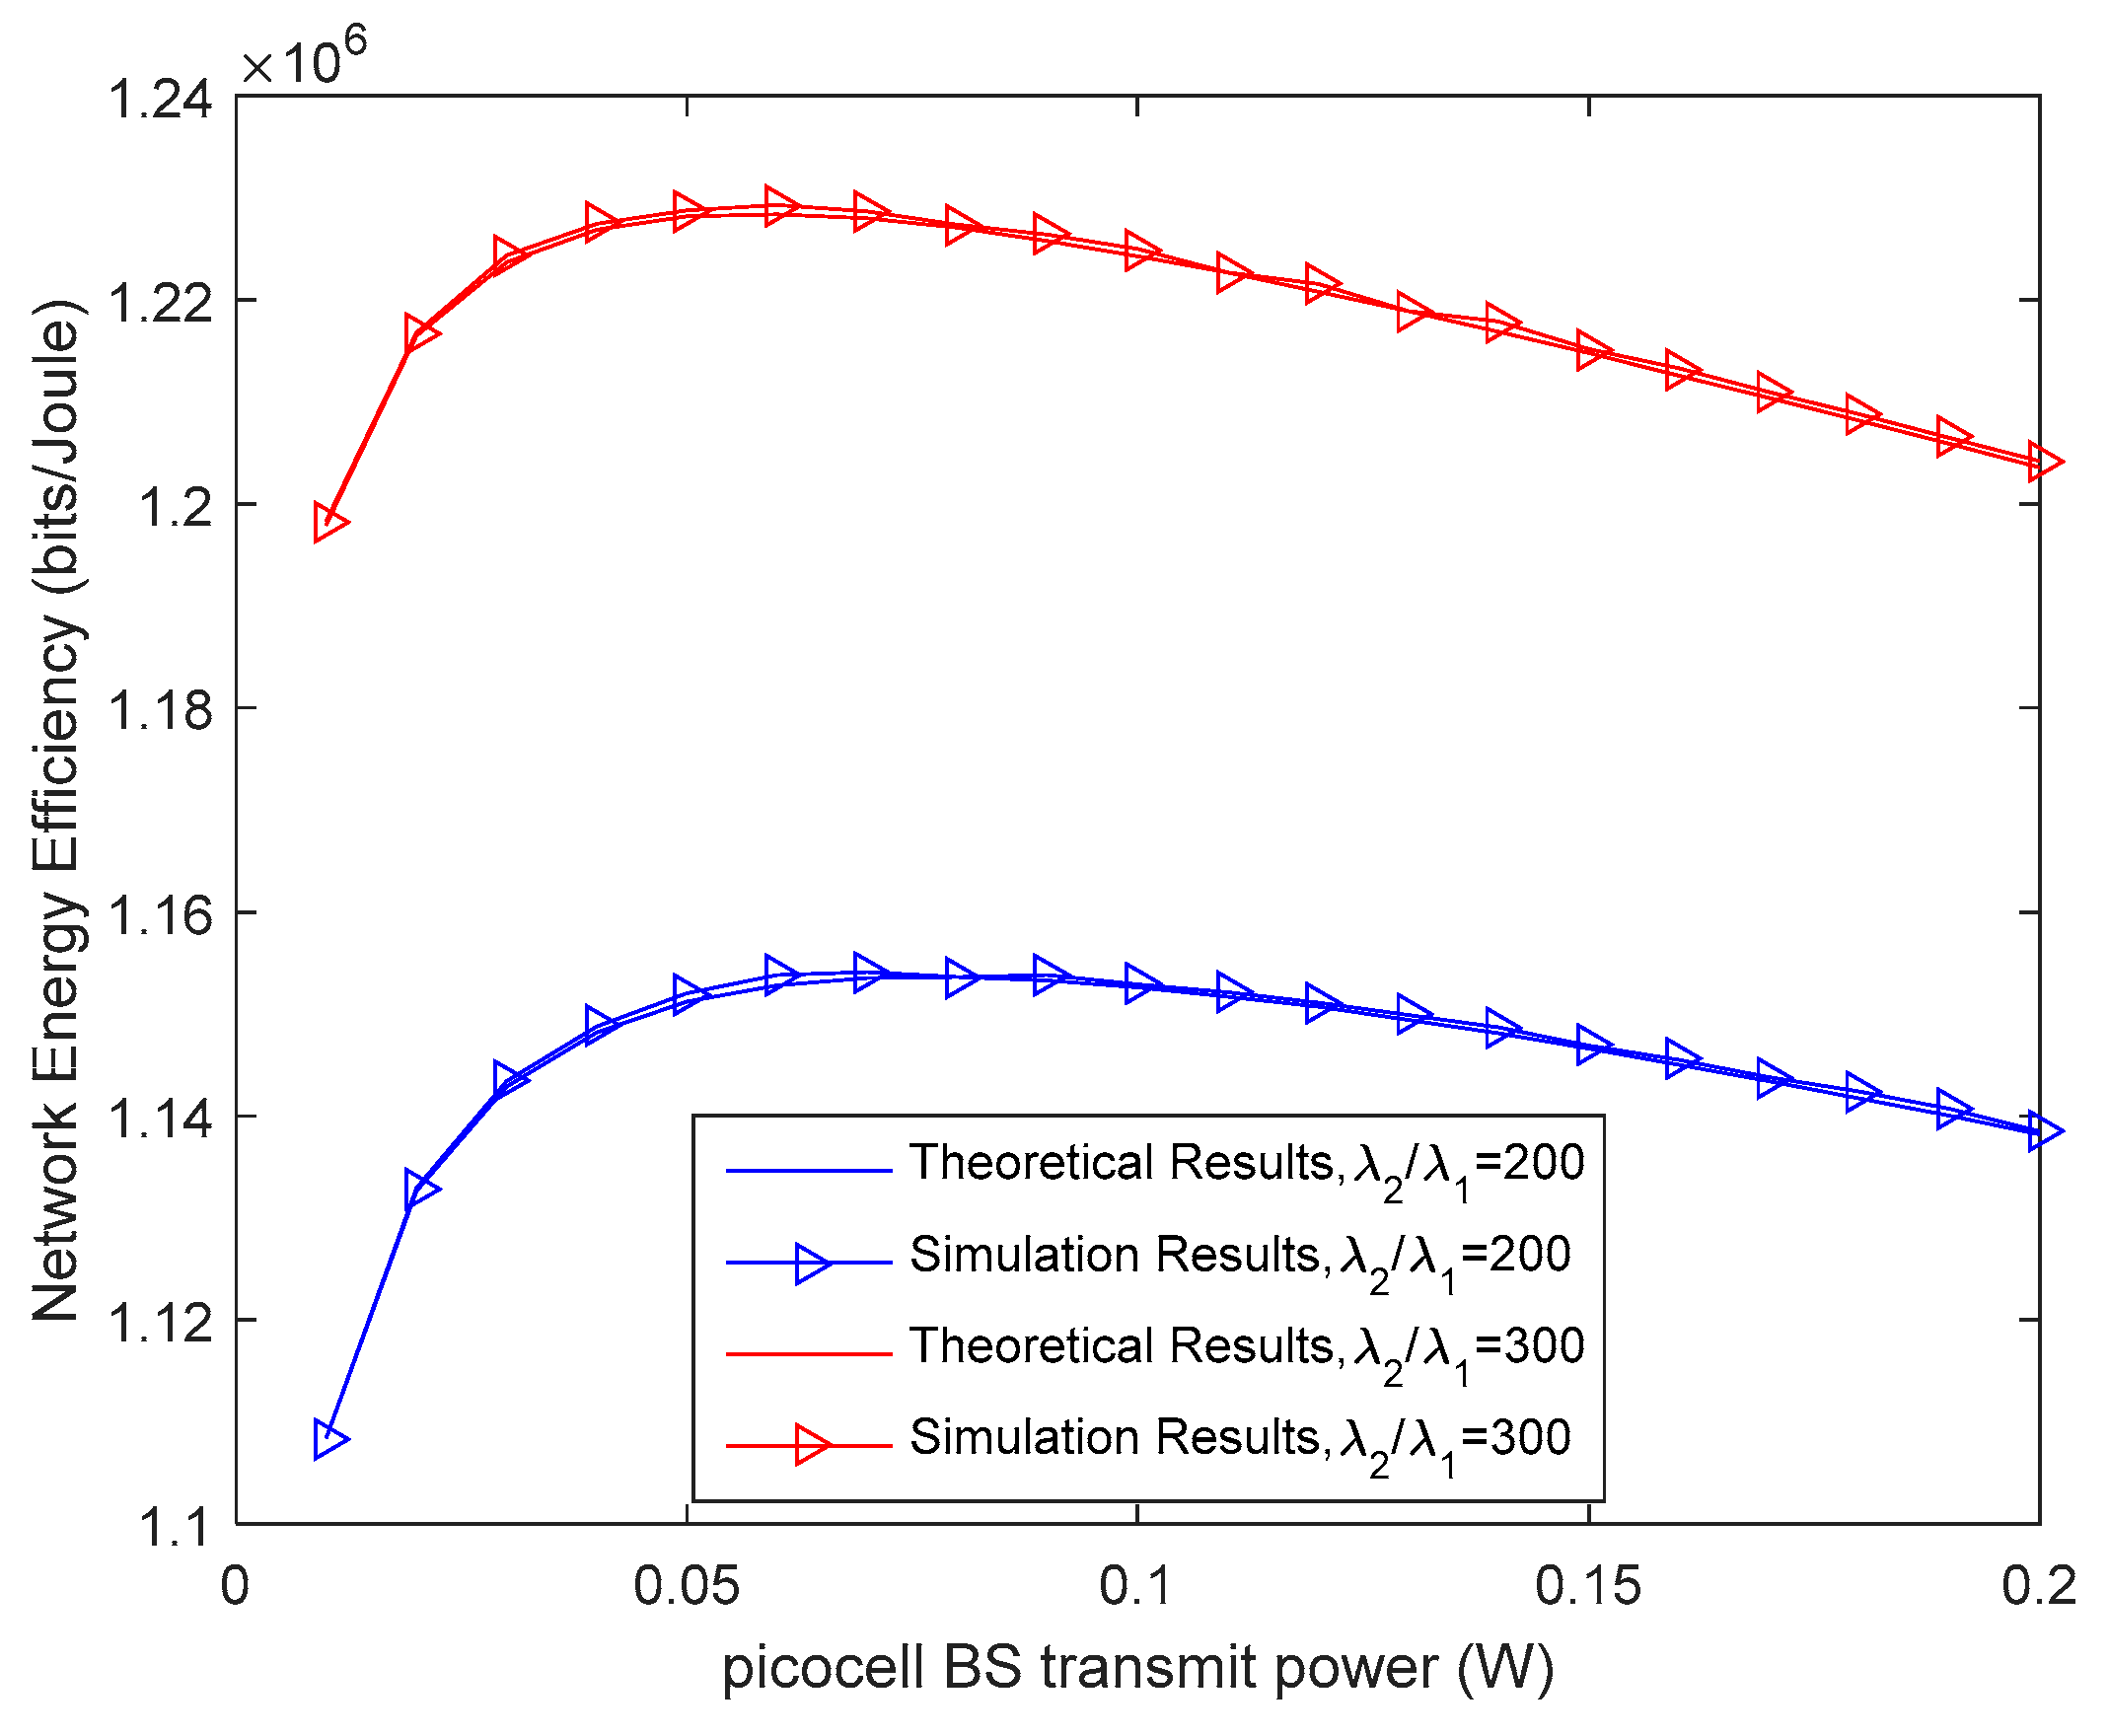
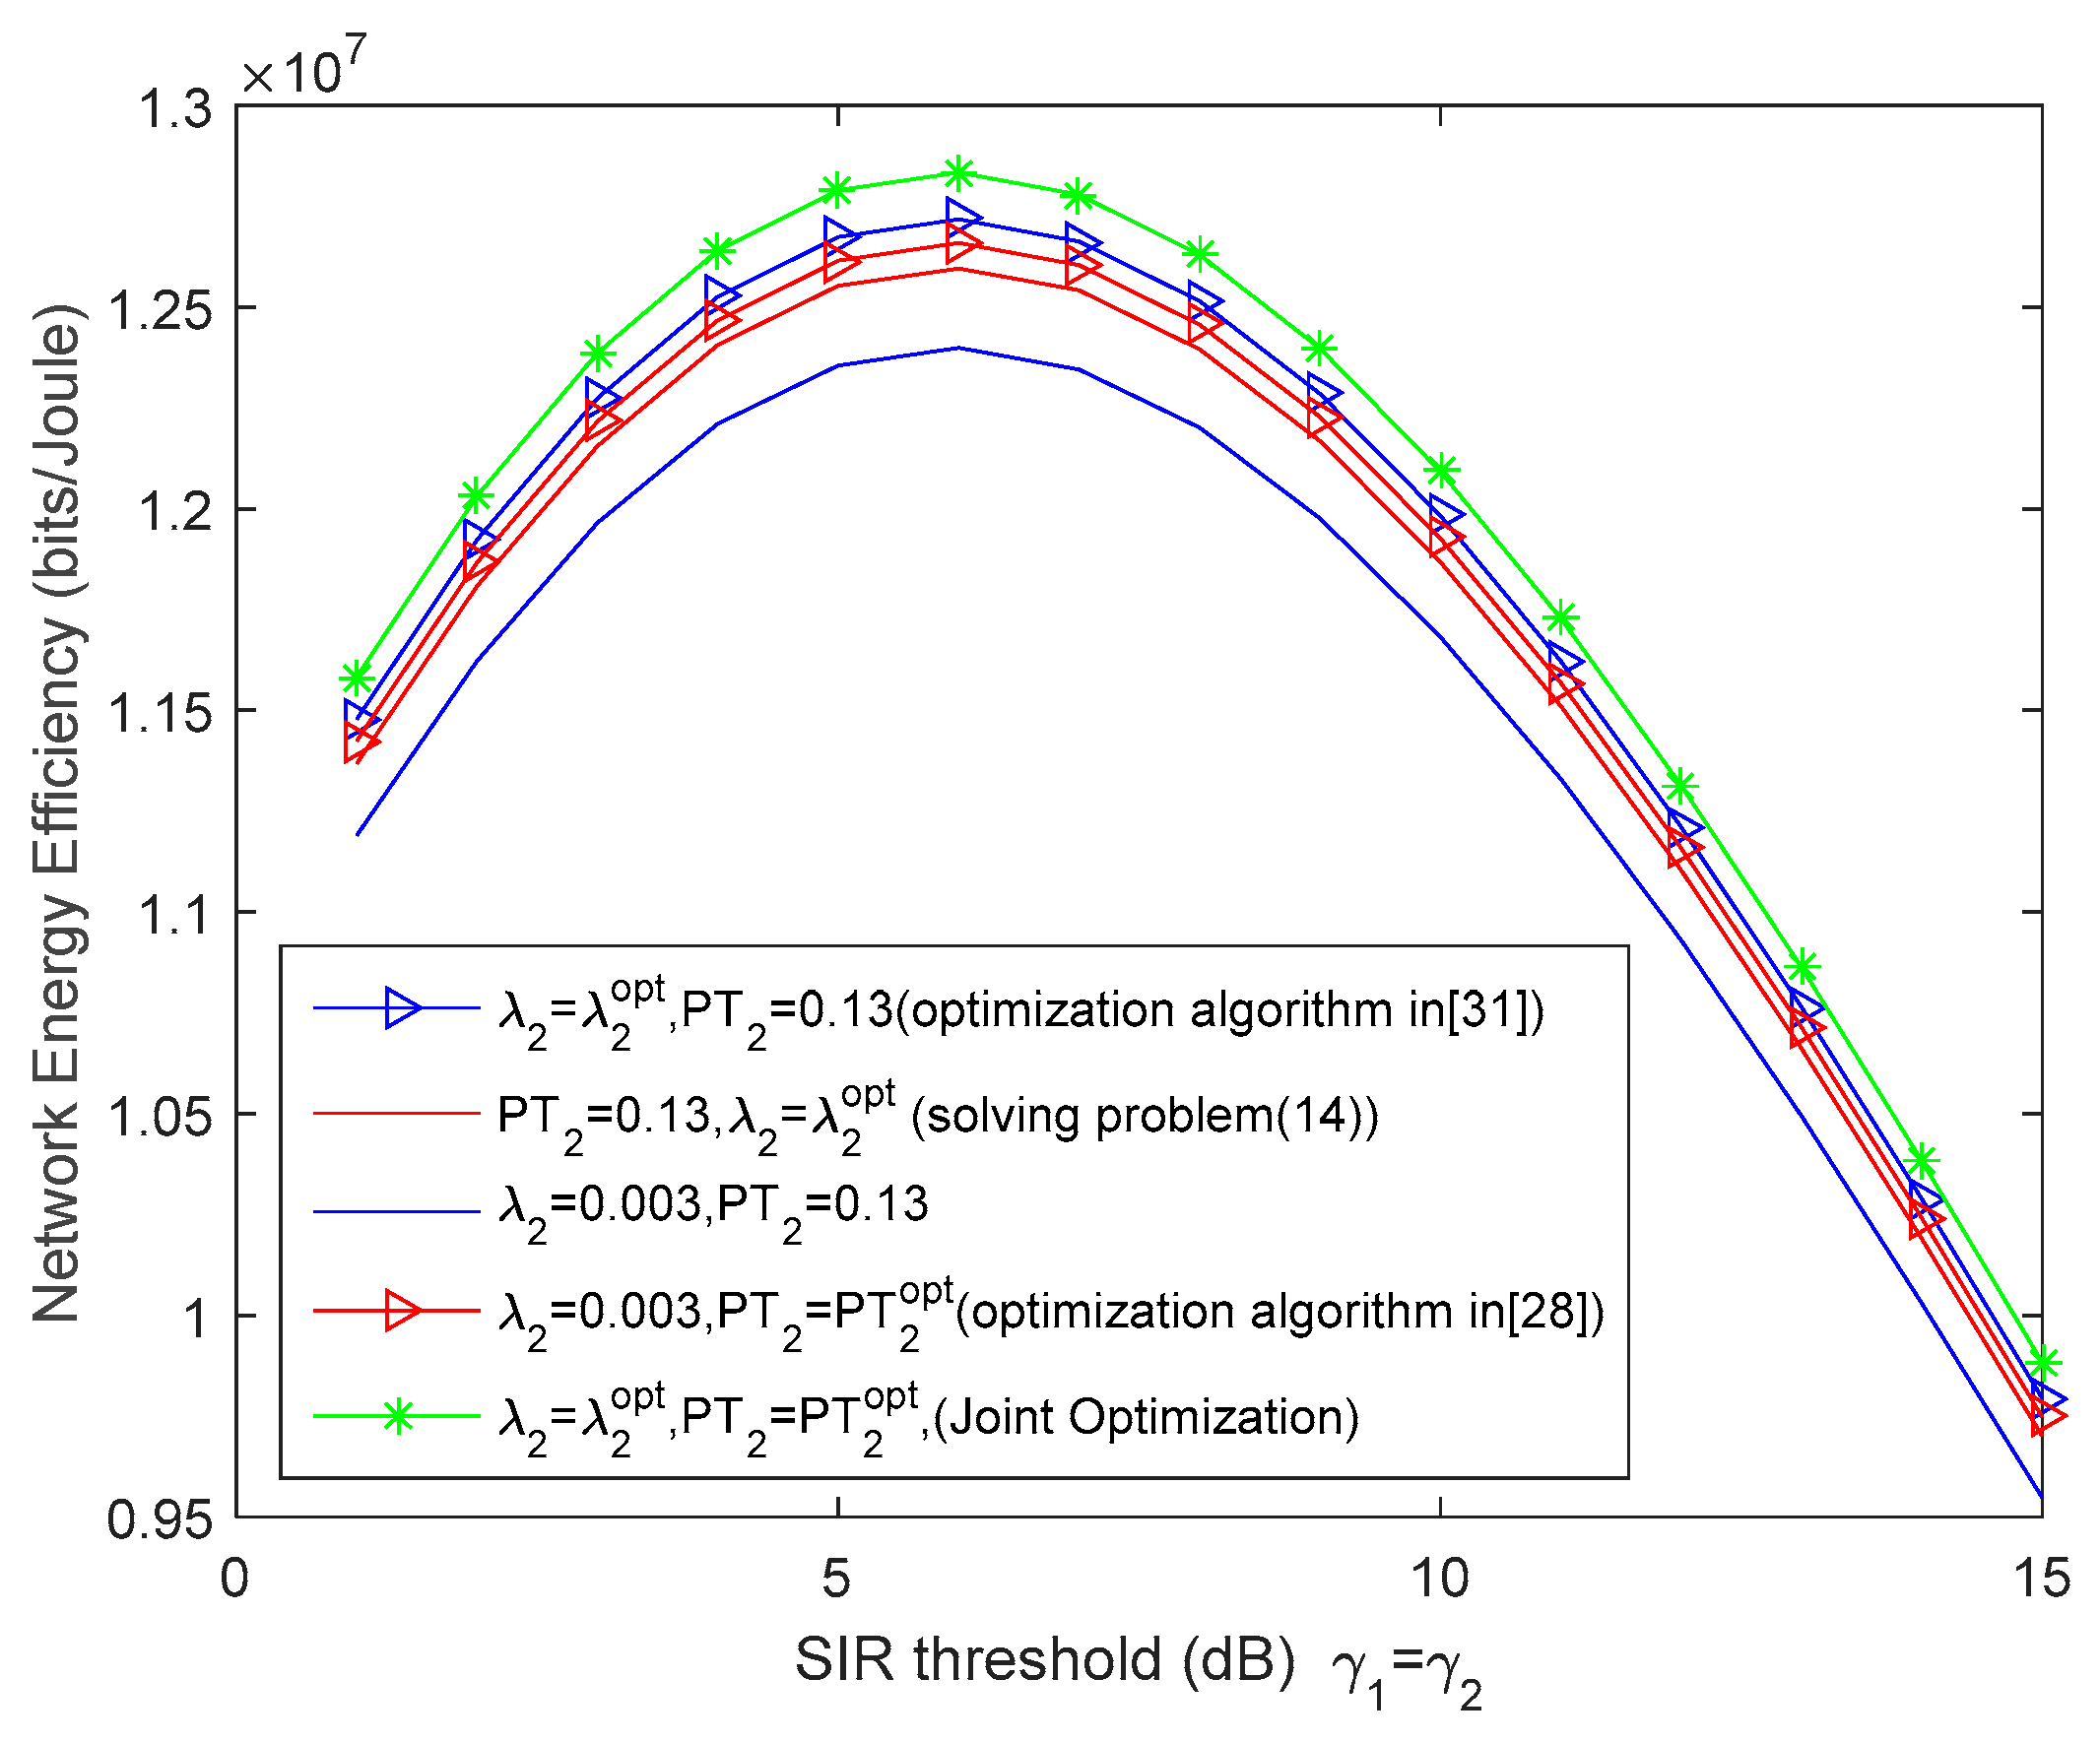
5. Simulation Results
6. Conclusions
Author Contributions
Funding
Conflicts of Interest
References
- Andrews, J.G.; Buzzi, S.; Wan, C.; Hanly, S.V.; Lozano, A.; Soong, A.C.K.; Zhang, J.C. What Will 5G Be. IEEE J. Sel. Areas Commun. 2014, 32, 1065–1082. [Google Scholar] [CrossRef]
- Kamel, M.; Hamouda, W.; Youssef, A. Ultra-Dense Networks: A Survey. IEEE Commun. Surv. Tutor. 2016, 18, 2522–2545. [Google Scholar] [CrossRef]
- Yunas, S.F.; Valkama, M.; Niemelä, J. Spectral and energy efficiency of ultra-dense networks under different deployment strategies. IEEE Commun. Mag. 2015, 53, 90–100. [Google Scholar] [CrossRef]
- Wang, H.; Leung, S.; Song, R. Uplink Area Spectral Efficiency Analysis for Multichannel Heterogeneous Cellular Networks with Interference Coordination. IEEE Access 2018, 6, 14485–14497. [Google Scholar] [CrossRef]
- Saha, C.; Afshang, M.; Dhillon, H.S. Enriched K-Tier HCN Model to Enable the Analysis of User-Centric Small Cell Deployments. IEEE Trans. Wirel. Commun. 2016, 16, 2835–2849. [Google Scholar]
- Mirahsan, M.; Schoenen, R.; Yanikomeroglu, H. HetHCNs: Heterogeneous Traffic Distribution in Heterogeneous Wireless Cellular Networks. IEEE J. Sel. Areas Commun. 2015, 33, 2252–2265. [Google Scholar] [CrossRef]
- Elsawy, H.; Sultan-Salem, A.; Alouini, M.S.; Win, M.Z. Modeling and Analysis of Cellular Networks Using Stochastic Geometry: A Tutorial. IEEE Commun. Surv. Tutor. 2017, 19, 167–203. [Google Scholar] [CrossRef]
- She, C.; Yang, C. Energy Efficiency and Delay in Wireless Systems: Is Their Relation Always a Tradeoff. IEEE Trans. Wirel. Commun. 2016, 15, 7215–7228. [Google Scholar] [CrossRef]
- Chen, Z.; Qiu, L.; Liang, X. Area Spectral Efficiency Analysis and Energy Consumption Minimization in Multiantenna Poisson Distributed Networks. IEEE Trans. Wirel. Commun. 2016, 15, 4862–4874. [Google Scholar]
- Logambigai, R.; Kannan, A. Energy conservation routing algorithm for wireless sensor networks using hybrid optimisation approach. Int. J. Commun. Netw. Distrib. Syst. 2018, 20, 352–371. [Google Scholar] [CrossRef]
- Saravanan, R. Energy efficient QoS routing for mobile ad hoc networks. Int. J. Commun. Netw. Distrib. Syst. 2018, 20, 372–388. [Google Scholar] [CrossRef]
- Su, L.; Yang, C.; Chih-Lin, I. Energy and Spectral Efficient FreqMUncy Reuse of Ultra Dense Networks. IEEE Trans. Wirel. Commun. 2016, 15, 5384–5398. [Google Scholar]
- Thompson, J.; Ge, X.; Wu, H.C.; Lrmer, R.; Jiang, H.; Fettweis, G.; Alamouti, S. 5G Wireless Communication Systems: Prospects and Challenges Part 2. IEEE Commun. Mag. 2014, 52, 24–26. [Google Scholar] [CrossRef]
- Dhillon, H.S.; Ganti, R.K.; Baccelli, F.; Andrews, J.G. Modeling and Analysis of K-Tier Downlink Heterogeneous Cellular Networks. IEEE J. Sel. Areas Commun. 2012, 30, 550–560. [Google Scholar] [CrossRef]
- Jo, H.S.; Sang, Y.J.; Xia, P.; Andrews, J.G. Heterogeneous Cellular Networks with Flexible Cell Association: A Comprehensive Downlink SINR Analysis. IEEE Trans. Wirel. Commun. 2011, 11, 3484–3495. [Google Scholar] [CrossRef]
- Renzo, M.D.; Guidotti, A.; Corazza, G.E. Average Rate of Downlink Heterogeneous Cellular Networks over Generalized Fading Channels: A Stochastic Geometry Approach. IEEE Trans. Commun. 2013, 61, 3050–3071. [Google Scholar] [CrossRef]
- Subhankar, C.; Susmit, D. Poisson point process-based network modelling and performance analysis of multi-hop D2D chain relay formation in heterogeneous wireless network. Int. J. Commun. Netw. Distrib. Syst. 2019, 22, 98–122. [Google Scholar]
- Xiang, L.; Ge, X.; Wang, C.X.; Li, F.Y.; Reichert, F. Energy Efficiency Evaluation of Cellular Networks Based on Spatial Distributions of Traffic Load and Power Consumption. IEEE Trans. Wirel. Commun. 2013, 12, 961–973. [Google Scholar] [CrossRef]
- Cao, D.; Zhou, S.; Niu, Z. Optimal Combination of Base Station Densities for Energy-Efficient Two-Tier Heterogeneous Cellular Networks. IEEE Trans. Wirel. Commun. 2013, 12, 4350–4362. [Google Scholar] [CrossRef]
- Peng, J.; Hong, P.; Xue, K. Energy-Aware Cellular Deployment Strategy under Coverage Performance Constraints. IEEE Trans. Wirel. Commun. 2015, 14, 69–80. [Google Scholar] [CrossRef]
- Mugume, E.; So, D.K.C.; Alsusa, E. Energy Efficient Deployment of Dense Heterogeneous Cellular Networks. In Proceedings of the IEEE Global Communications Conference (GLOBECOM), San Diego, CA, USA, 6–10 December 2015; pp. 1–6. [Google Scholar]
- Yu, N.; Miao, Y.; Mu, L.; Du, H.; Huang, H.; Jia, X. Minimizing Energy Cost by Dynamic Switching ON/OFF Base Stations in Cellular Networks. IEEE Trans. Wirel. Commun. 2016, 15, 7457–7469. [Google Scholar] [CrossRef]
- Luo, J.; Chen, Q.; Tang, L. Reducing Power Consumption by Joint Sleeping Strategy and Power Control in Delay-Aware C-RAN. IEEE Access 2018, 6, 14655–14667. [Google Scholar] [CrossRef]
- Zhang, T.; Zhao, J.; An, L.; Liu, D. Energy Efficiency of Base Station Deployment in Ultra Dense HCNs: A Stochastic Geometry Analysis. IEEE Wirel. Commun. Lett. 2016, 5, 184–187. [Google Scholar] [CrossRef]
- Coskun, C.C.; Ayanoglu, E. Energy- and Spectral-Efficient Resource Allocation Algorithm for Heterogeneous Networks. IEEE Trans. Veh. Technol. 2018, 67, 590–603. [Google Scholar] [CrossRef]
- Aydin, O.; Jorswieck, E.A.; Aziz, D.; Zappone, A. Energy-Spectral Efficiency Trade-Offs in 5G Multi-Operator Networks with Heterogeneous Constraints. IEEE Trans. Wirel. Commun. 2017, 16, 5869–5881. [Google Scholar] [CrossRef]
- Zhao, G.; Chen, S.; Zhao, L.; Hanzo, L. Energy-Spectral-Efficiency Analysis and Optimization of Heterogeneous Cellular Networks: A Large-Scale User-Behavior Perspective. IEEE Trans. Veh. Technol. 2018, 67, 4098–4112. [Google Scholar] [CrossRef]
- Jie, Y.; Zhenjian, T.; Han, H.; Yonghong, C. Energy-efficient picocell base station power control in heterogeneous cellular network. In Proceedings of the IEEE 17th International Conference on Communication Technology (ICCT), Chengdu, China, 27–30 October 2017; pp. 553–557. [Google Scholar]
- Di Renzo, M.; Zappone, A.; Lam, T.T.; Debbah, M. System-Level Modeling and Optimization of the Energy Efficiency in Cellular Networks—A Stochastic Geometry Framework. IEEE Trans. Wirel. Commun. 2018, 17, 2539–2556. [Google Scholar] [CrossRef]
- Lorincz, J.; Matijevic, T. Energy-efficiency analyses of heterogeneous macro and micro base station sites. Comput. Electr. Eng. 2014, 40, 330–349. [Google Scholar] [CrossRef]
- Li, L.; Peng, M.; Yang, C.; Wu, Y. Optimization of Base-Station Density for High Energy-Efficient Cellular Networks with Sleeping Strategies. IEEE Trans. Veh. Technol. 2015, 65, 7501–7514. [Google Scholar] [CrossRef]
- Zhao, G.; Chen, S.; Qi, L.; Zhao, L.; Hanzo, L. Mobile-Traffic-Aware Offloading for Energy- and Spectral-Efficient Large-Scale D2D-Enabled Cellular Networks. IEEE Trans. Wirel. Commun. 2019, 18, 3251–3264. [Google Scholar] [CrossRef]
- Luo, Y.; Shi, Z.; Bu, F.; Xiong, J. Joint Optimization of Area Spectral Efficiency and Energy Efficiency for Two-Tier Heterogeneous Ultra-Dense Networks. IEEE Access 2019, 7, 12073–12086. [Google Scholar] [CrossRef]
- Krauss, R.; Brante, G.; Rayel, O.K.; Souza, R.D.; Onireti, O.; Imran, M.A. Energy Efficiency of Multiple Antenna Cellular Networks Considering a Realistic Power Consumption Model. IEEE Trans. Green Commun. Netw. 2019, 3, 1–10. [Google Scholar] [CrossRef]
- Cai, Y.; Ni, Y.; Zhang, J.; Zhao, S.; Zhu, H. Energy efficiency and spectrum efficiency in underlay device-to-device communications enabled cellular networks. China Commun. 2019, 16, 16–34. [Google Scholar]
- Mollahasani, S.; Onur, E. Density-Aware, Energy- and Spectrum-Efficient Small Cell Scheduling. IEEE Access 2019, 7, 65852–65869. [Google Scholar] [CrossRef]
- Tang, J.; So, D.K.C.; Alsusa, E.; Hamdi, K.; Shojaeifard, A.; Wong, K. Energy Efficiency Optimization for Heterogeneous Cellular Networks. In Proceedings of the 2017 IEEE 85th Vehicular Technology Conference (VTC Spring), Sydney, Australia, 4–7 June 2017; pp. 1–6. [Google Scholar]
- Sui, X.; Zhao, Z.; Li, R.; Zhang, H. Energy Efficiency Analysis of Heterogeneous Cellular Networks with Downlink and Uplink Decoupling. In Proceedings of the 2015 IEEE Global Communications Conference (GLOBECOM), San Diego, CA, USA, 6–10 December 2015; pp. 1–7. [Google Scholar]
- Singh, S.; Dhillon, H.S.; Andrews, J.G. Offloading in Heterogeneous Networks: Modeling, Analysis, and Design Insights. IEEE Trans. Wirel. Commun. 2013, 12, 2484–2497. [Google Scholar] [CrossRef]
- Lorincz, J.; Matijevic, T.; Petrovic, G. On interdependence among transmit and consumed power of macro base station technologies. Comput. Commun. 2014, 50, 10–28. [Google Scholar] [CrossRef]
- Auer, G.; Giannini, V.; Desset, C.; Gódor, L.; Skillermark, P.; Olsson, M.; Imran, M.A.; Sabella, D.; Gonzalez, M.J.; Blume, O.; et al. How much energy is needed to run a wireless network? IEEE Wirel. Commun. 2011, 18, 40–49. [Google Scholar] [CrossRef]


| Parameters Name | Values |
|---|---|
| Bandwidth | 107 Hz |
| HetNet area | 10 × 10 km2 |
| Density of MUEs, λu | 0.025 m−2 |
| Density of macrocell BS, λ1 | 10−5 m−2 |
| Path-loss exponent, α | α = 4 |
| Circuit power consumption of MBS, PC1 | 130 W |
| Transmit power of MBS, PT1 | 20 W |
| Number of transceivers of MBS, NTR1 | 6 |
| Slope of MBS power consumption, θ1 | 4.7 |
| Circuit power consumption of PBS, PC2 | 6.8 W |
| Transmit power of PBS, PT2 | 0.13 W |
| Number of transceivers of PBS, NTR2 | 2 |
| Slope of PBS power consumption, θ2 | 4.0 |
© 2019 by the authors. Licensee MDPI, Basel, Switzerland. This article is an open access article distributed under the terms and conditions of the Creative Commons Attribution (CC BY) license (http://creativecommons.org/licenses/by/4.0/).
Share and Cite
Yang, J.; Pan, Z.; Xu, H.; Hu, H. Joint Optimization of Pico-Base-Station Density and Transmit Power for an Energy-Efficient Heterogeneous Cellular Network. Future Internet 2019, 11, 208. https://doi.org/10.3390/fi11100208
Yang J, Pan Z, Xu H, Hu H. Joint Optimization of Pico-Base-Station Density and Transmit Power for an Energy-Efficient Heterogeneous Cellular Network. Future Internet. 2019; 11(10):208. https://doi.org/10.3390/fi11100208
Chicago/Turabian StyleYang, Jie, Ziyu Pan, Hengfei Xu, and Han Hu. 2019. "Joint Optimization of Pico-Base-Station Density and Transmit Power for an Energy-Efficient Heterogeneous Cellular Network" Future Internet 11, no. 10: 208. https://doi.org/10.3390/fi11100208
APA StyleYang, J., Pan, Z., Xu, H., & Hu, H. (2019). Joint Optimization of Pico-Base-Station Density and Transmit Power for an Energy-Efficient Heterogeneous Cellular Network. Future Internet, 11(10), 208. https://doi.org/10.3390/fi11100208