1. Introduction
Chemometric methods such as design of experiments (DoE) and multivariate analysis (MA) are suitable methodological approaches for the purpose of optimization and standardization of pharmaceutical unit operations [
1,
2,
3,
4]. Moreover, DoE is a powerful technique applied to making experiments more efficient [
5]. Several factors are varied simultaneously in a systematic way using the concept of e.g., factorial designs [
5]. This approach of experimentation is based on mathematical models, which make it possible to investigate several factors together and still draw safe conclusions about individual effects [
5]. In order to improve drug development in the pharmaceutical industry, the FDA (US Food and Drug Administration) is promoting the use of Quality by Design (QbD) and Process Analytical Technologies (PAT), for which DoE and MA are building blocks [
6]. The ICH (The International Conference on Harmonization of Technical Requirements for Registration of Pharmaceuticals for Human Use) also outlined the concept of design space in its Q8 (R2) - guideline (“Pharmaceutical Development”) in 2009. This study explores how DoE and MA can be utilized to address a specific problem related to the quality of the final product, in this case, particle size reduction with a minimal impact on the solid state of the drug. Ultimately, the optimized formulation was tested with regard to its dissolution behavior as the decisive criterion for the drug performance.
Milling is a common diminution technique in the pharmaceutical industry to improve the performance of drugs, including their dissolution rates [
7,
8]. However, the major drawback of this process is the possible mechanical activation of the milled drug and subsequent introduction of process induced disorder [
7]. Process induced disorder in this context is defined as a pre-amorphous solid state, which does not exhibit a glass transition, as opposed to the amorphous state, which is defined by the presence of a glass transition upon thermal treatment [
9]. Drugs with different molecular arrangements may exhibit different properties such as solubility and dissolution rate (and hence, possibly bioavailability), necessitating the need to monitor process induced solid state modifications [
10,
11].
Specifically, this study explores the potential of an optimization design, namely a central composite face centered design, applied to a dry ball milling process. The investigated milling factors were milling frequency, milling time and ball quantity at a set drug load. The impact of these factors on the responses particle size and process induced disorder was explored in the full factorial design as part of the optimization design. Particle size was the main response and process induced disorder the second, adverse, response investigated. Response surface modeling was undertaken and subsequent overlay of response surfaces in the form of optimal area plots determined optimal milling parameters in order to gain the smallest possible particle size while limiting the introduction of process induced disorder. Subsequently, the optimal milling parameters were tested experimentally with regard to the responses particle size and process induced disorder as well as ultimately, the dissolution rate.
3. Results and Discussion
The central composite face centered design including the respective response values is shown in
Table 1. PLS models for the Raman spectroscopic data as well as for the XRPD data were utilized in order to acquire the values for process induced disorder. The models were explained in detail previously [
9].
Table 1.
Central composite face centered design showing all particular milling settings as well as the respective response values. Experiments No. 15 to 17 are the center point experiments.
Table 1.
Central composite face centered design showing all particular milling settings as well as the respective response values. Experiments No. 15 to 17 are the center point experiments.
| No. | Time Minutes | Frequency Hertz | No. of balls 4 mm | Primary particle size D 100 μm | % Process induced disorder Raman | % Process induced disorder XRPD |
|---|
| 1 | 5 | 5 | 3 | 11.8 | 0.4 | 0.5 |
| 2 | 60 | 5 | 3 | 12.8 | 0.4 | 0.2 |
| 3 | 5 | 25 | 3 | 11.9 | 2.2 | -2.4 |
| 4 | 60 | 25 | 3 | 1.1 | 7.5 | 10.7 |
| 5 | 5 | 5 | 60 | 12.8 | -0.4 | 1.4 |
| 6 | 60 | 5 | 60 | 12.1 | 0.2 | 0.7 |
| 7 | 5 | 25 | 60 | 3.3 | 3.7 | 8 |
| 8 | 60 | 25 | 60 | 0.3 | 15.5 | 18.3 |
| 9 | 5 | 15 | 31 | 12.8 | 1.4 | -1.1 |
| 10 | 60 | 15 | 31 | 4.5 | 3.2 | 2.1 |
| 11 | 32.5 | 5 | 31 | 9.3 | 0.2 | -0.6 |
| 12 | 32.5 | 25 | 31 | 1.1 | 7.3 | 7.9 |
| 13 | 32.5 | 15 | 3 | 12.1 | 0 | 0.5 |
| 14 | 32.5 | 15 | 60 | 2.2 | 1.9 | 2.2 |
| 15 | 32.5 | 15 | 31 | 11.3 | 1.7 | 0.7 |
| 16 | 32.5 | 15 | 31 | 5 | 1 | -3.8 |
| 17 | 32.5 | 15 | 31 | 12.8 | 1.7 | 1.7 |
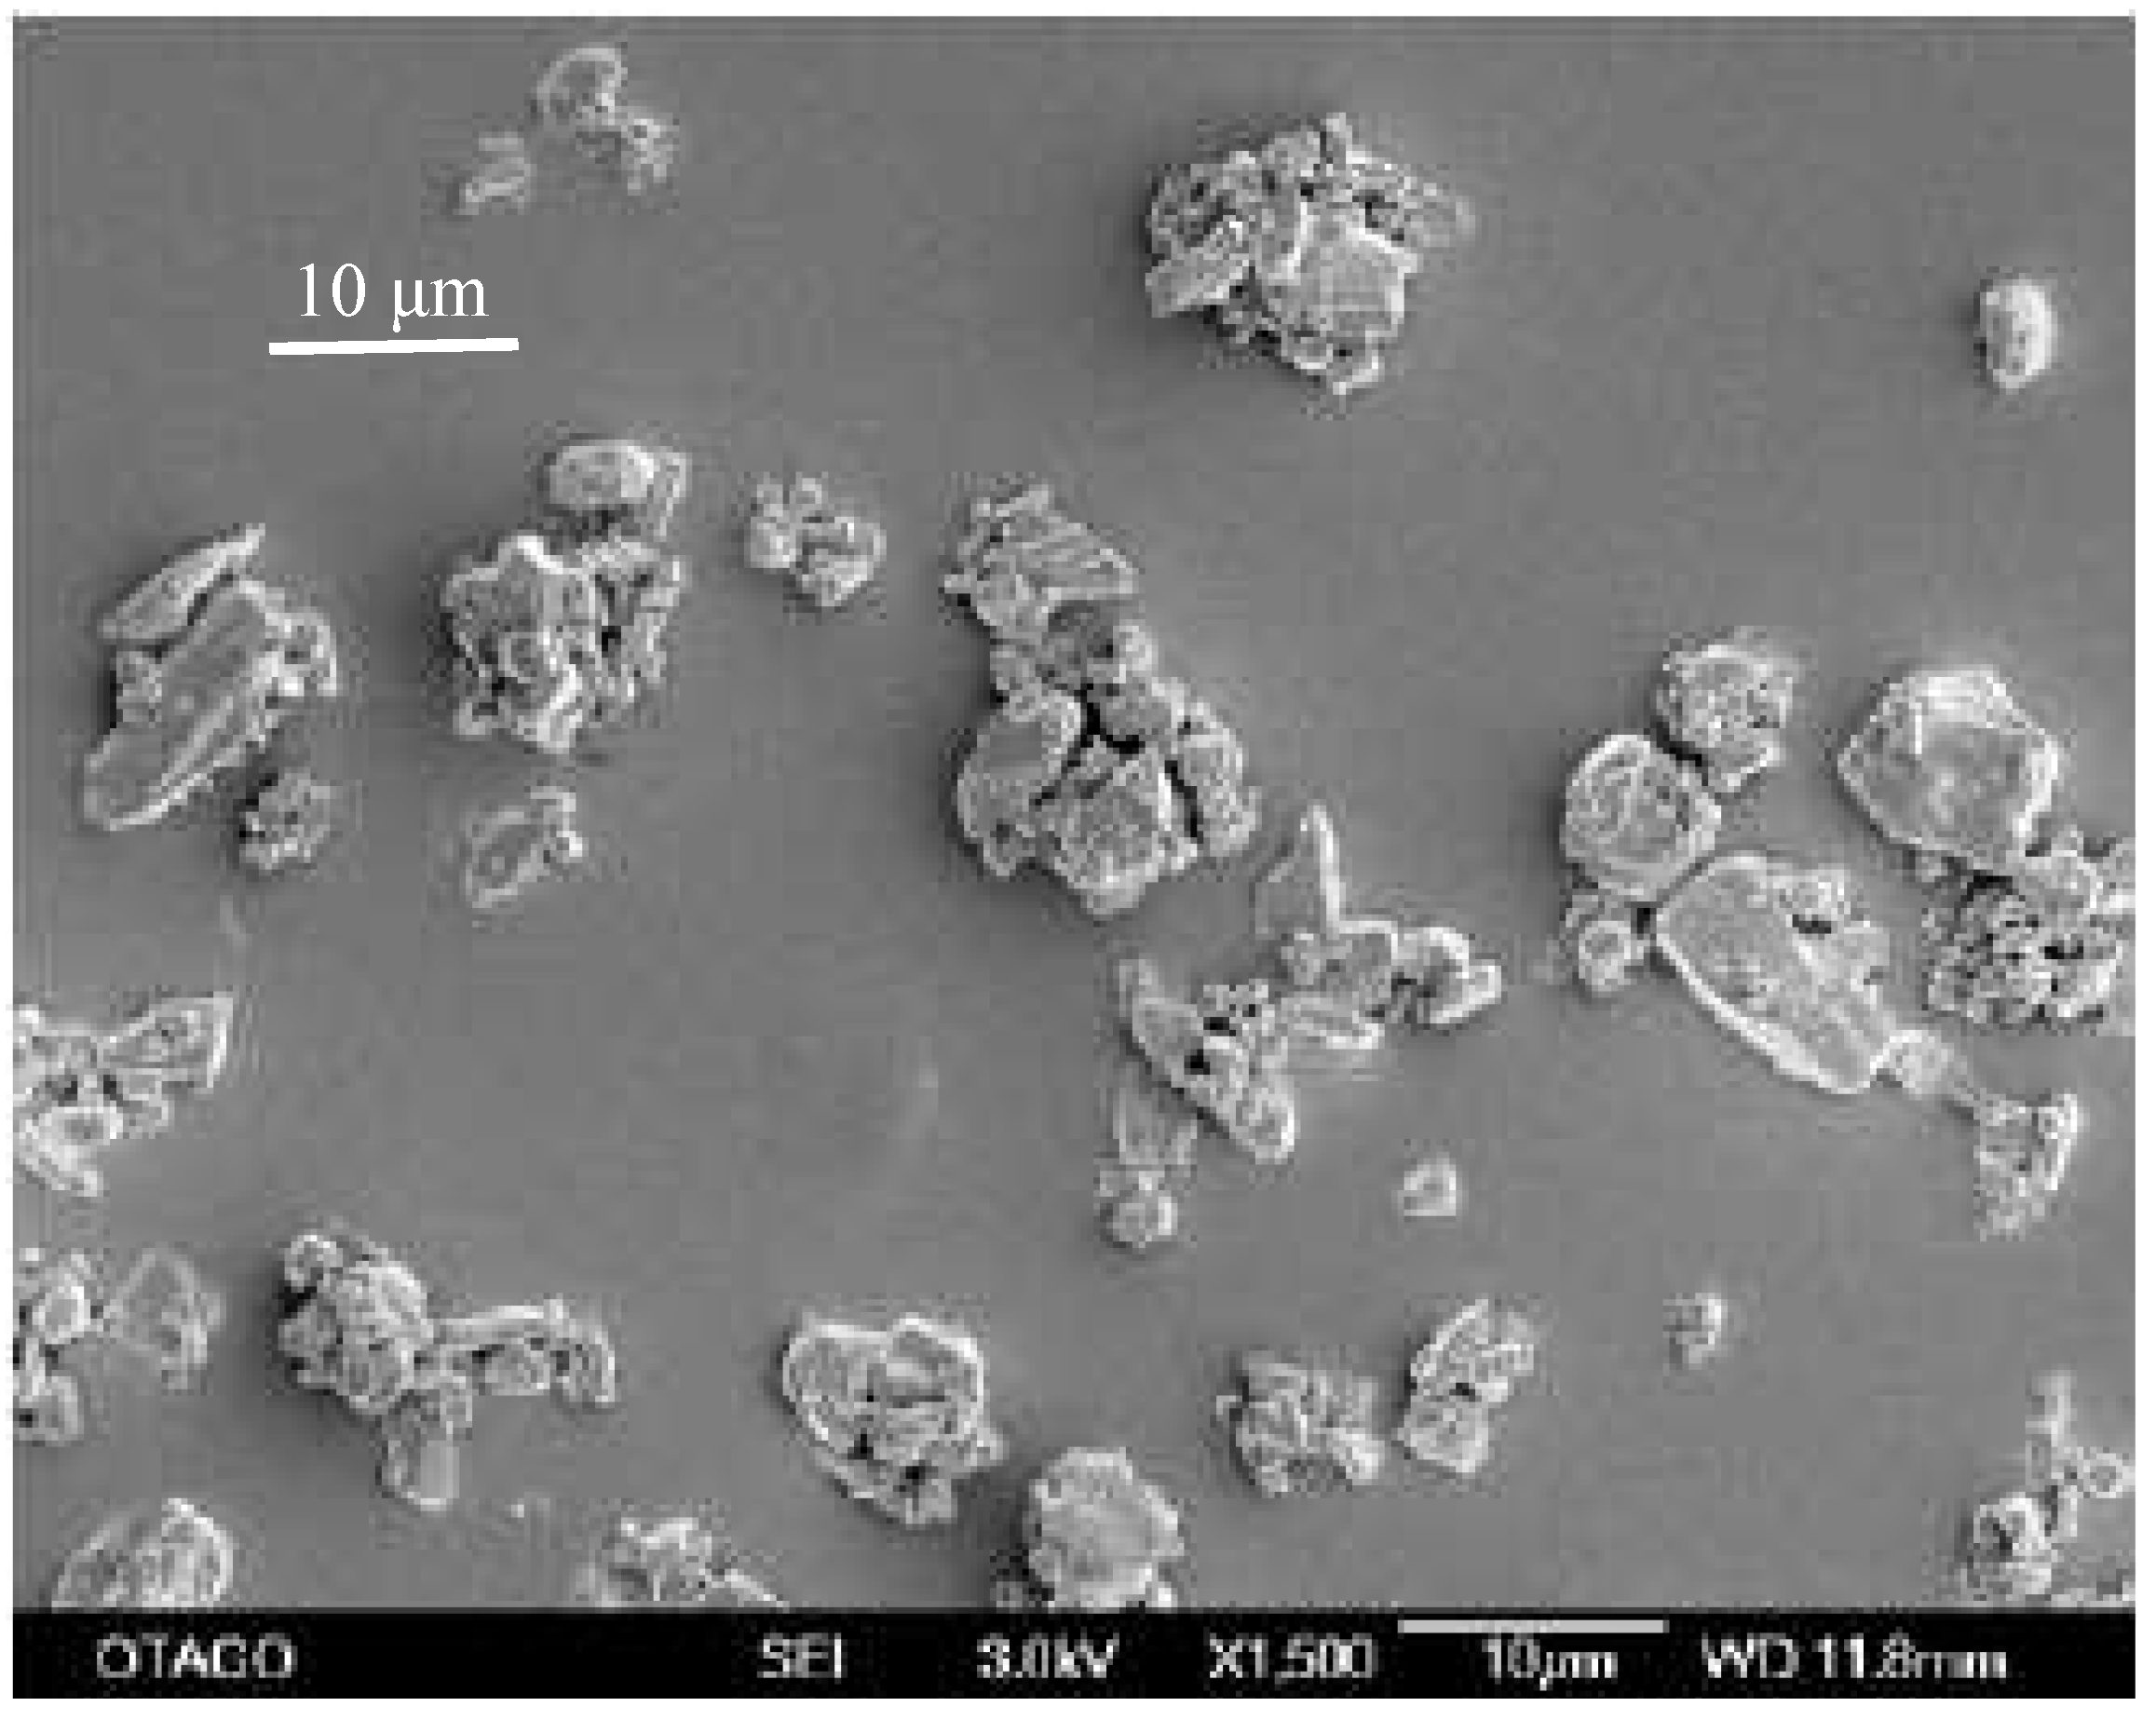
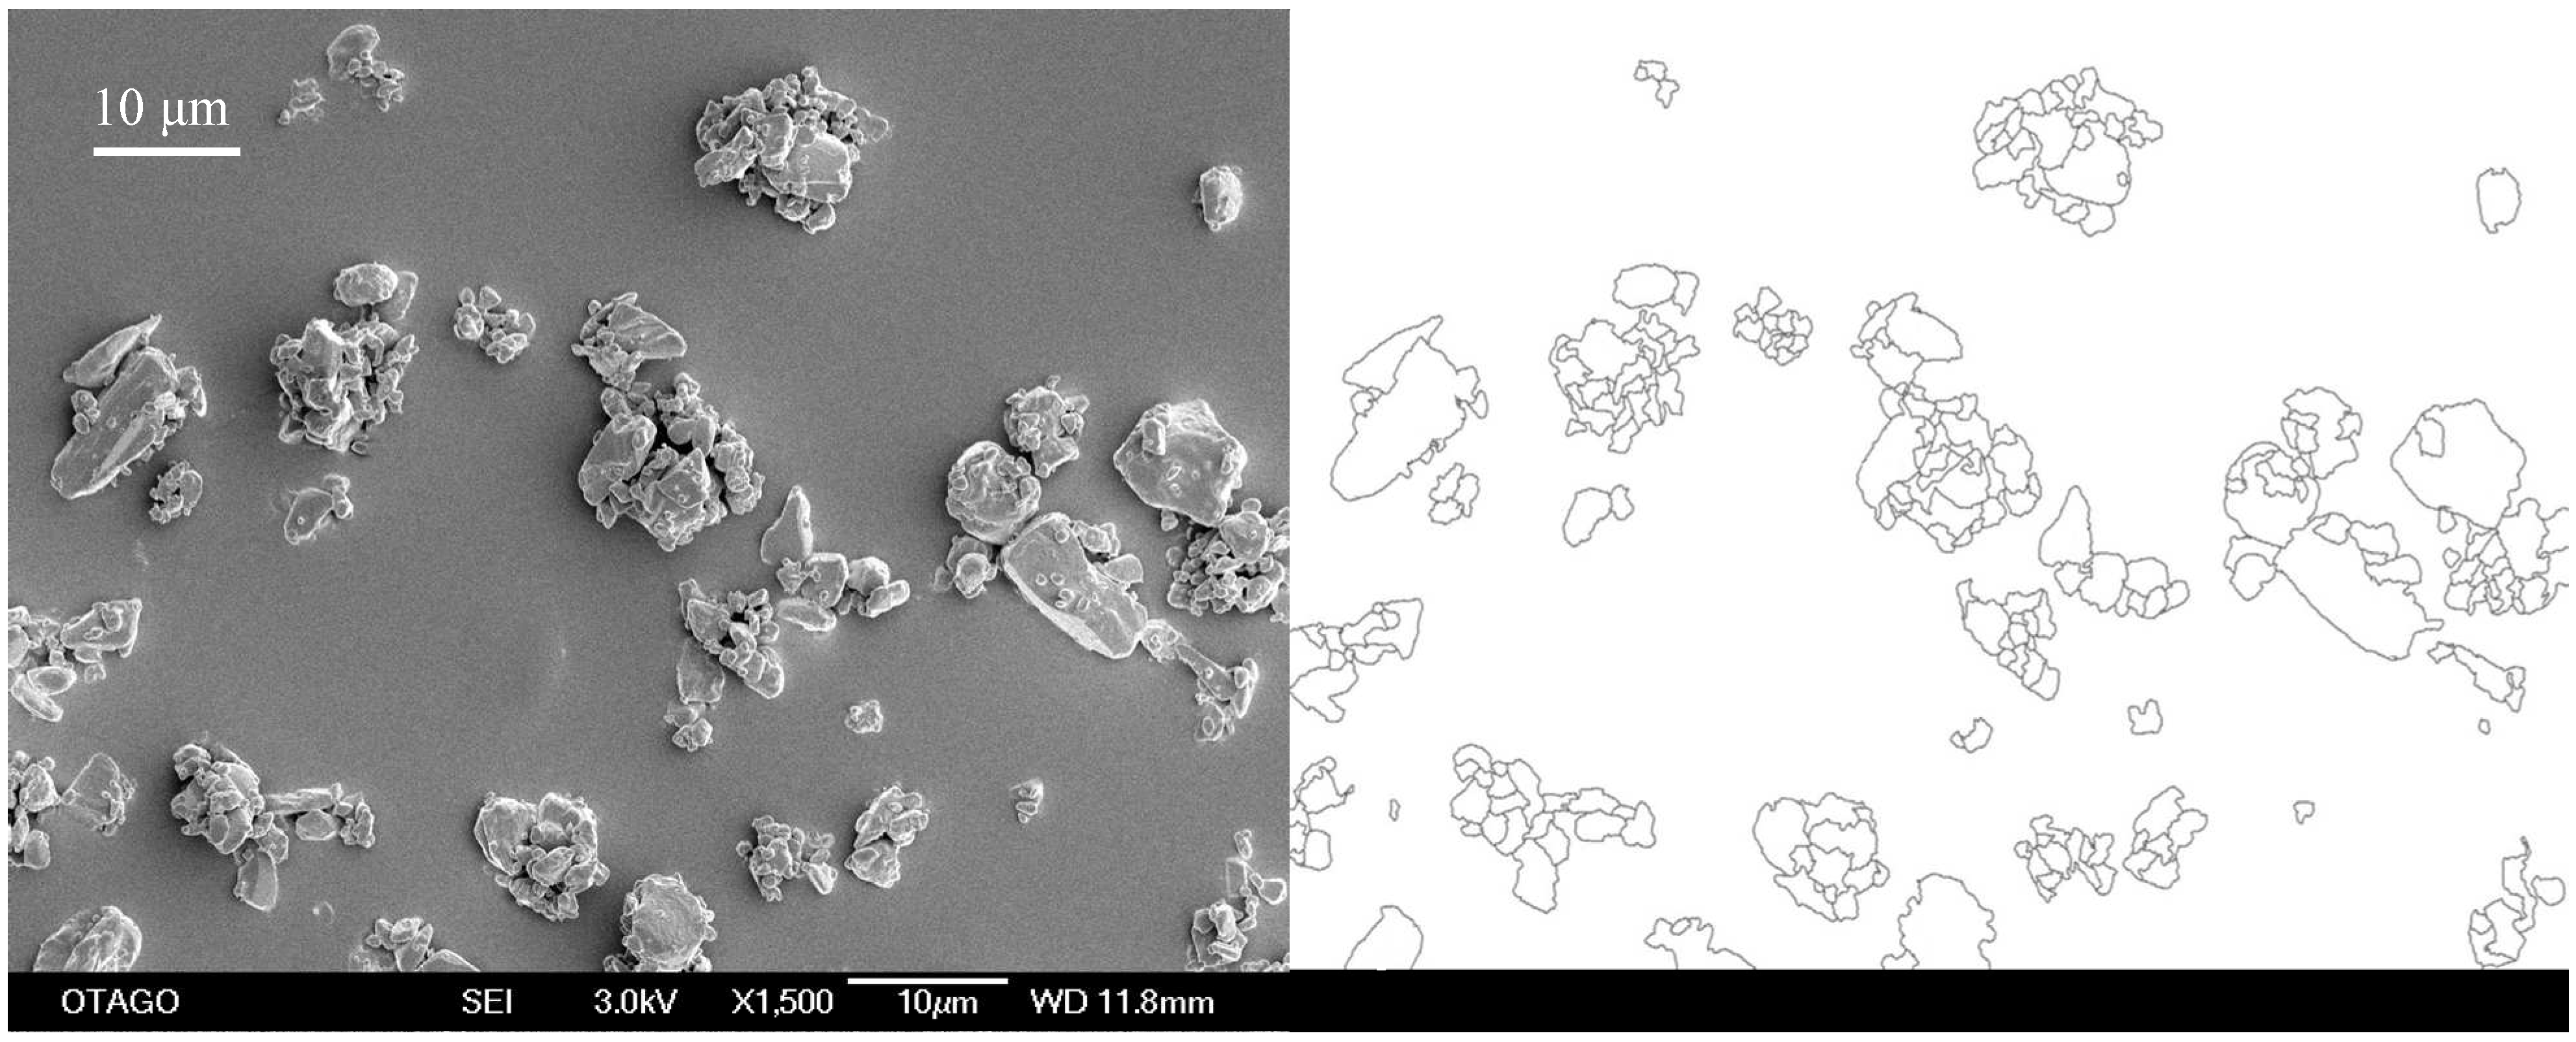
Scanning electron microscopy was chosen as the method to determine the particle size as the milling operation was undertaken under dry conditions with resulting agglomerated particles. The initial primary particle size of the unprocessed compound was determined to be 12.8 μm (
Figure 2).
Figure 2.
SEM-image of unprocessed simvastatin as received. The bar equals 10 μm.
Figure 2.
SEM-image of unprocessed simvastatin as received. The bar equals 10 μm.
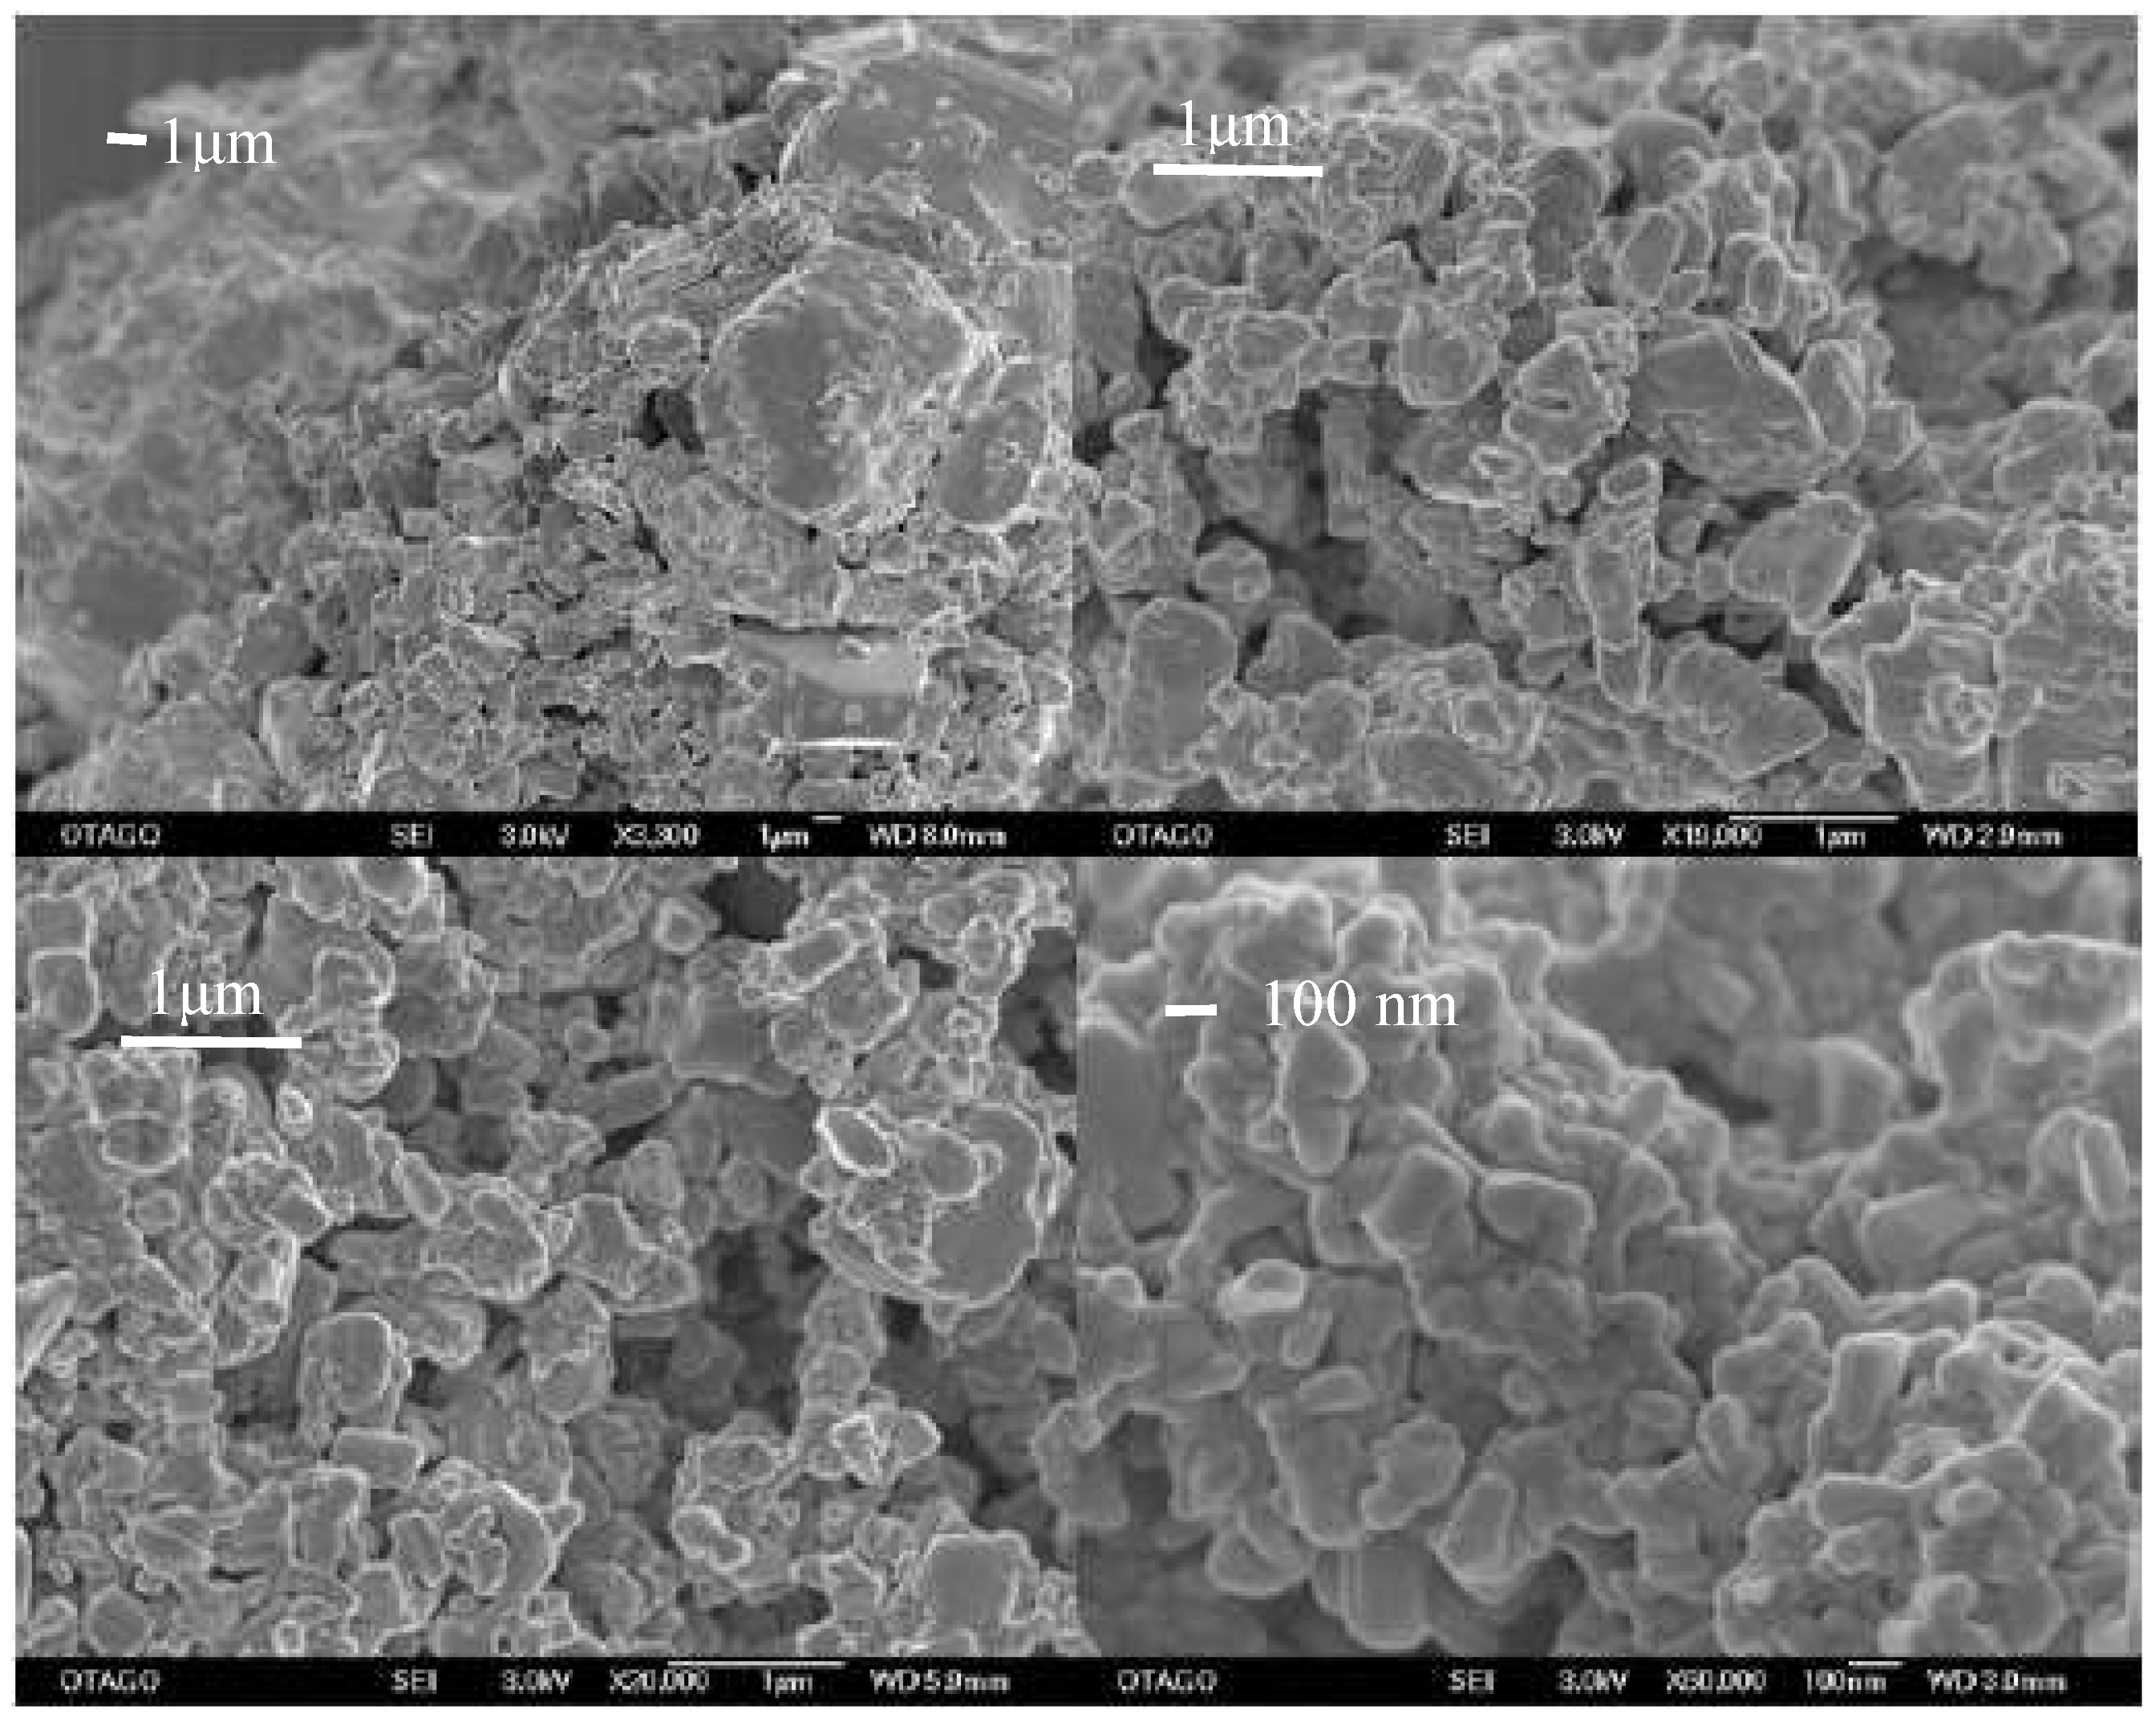
It could be shown that for all samples milled at the high milling frequency (25 Hz), a micro- and nano-particulate fraction were obtained (
Figure 3). However, only for the sample milled at the highest milling frequency (25 Hz) and longest milling time (60 min) with the maximum number of 60 milling balls, a completely nano-particulate sample was achieved (
Figure 3).
Figure 3.
Images of sample 3 (tope left), 4 (top right), sample 12 (bottom left) and 8 (bottom right). Sample 8 is the nano-crystalline sample. Bars equal 1 μm, except for the nano-crystalline sample, where the bar equals 100 nm.
Figure 3.
Images of sample 3 (tope left), 4 (top right), sample 12 (bottom left) and 8 (bottom right). Sample 8 is the nano-crystalline sample. Bars equal 1 μm, except for the nano-crystalline sample, where the bar equals 100 nm.
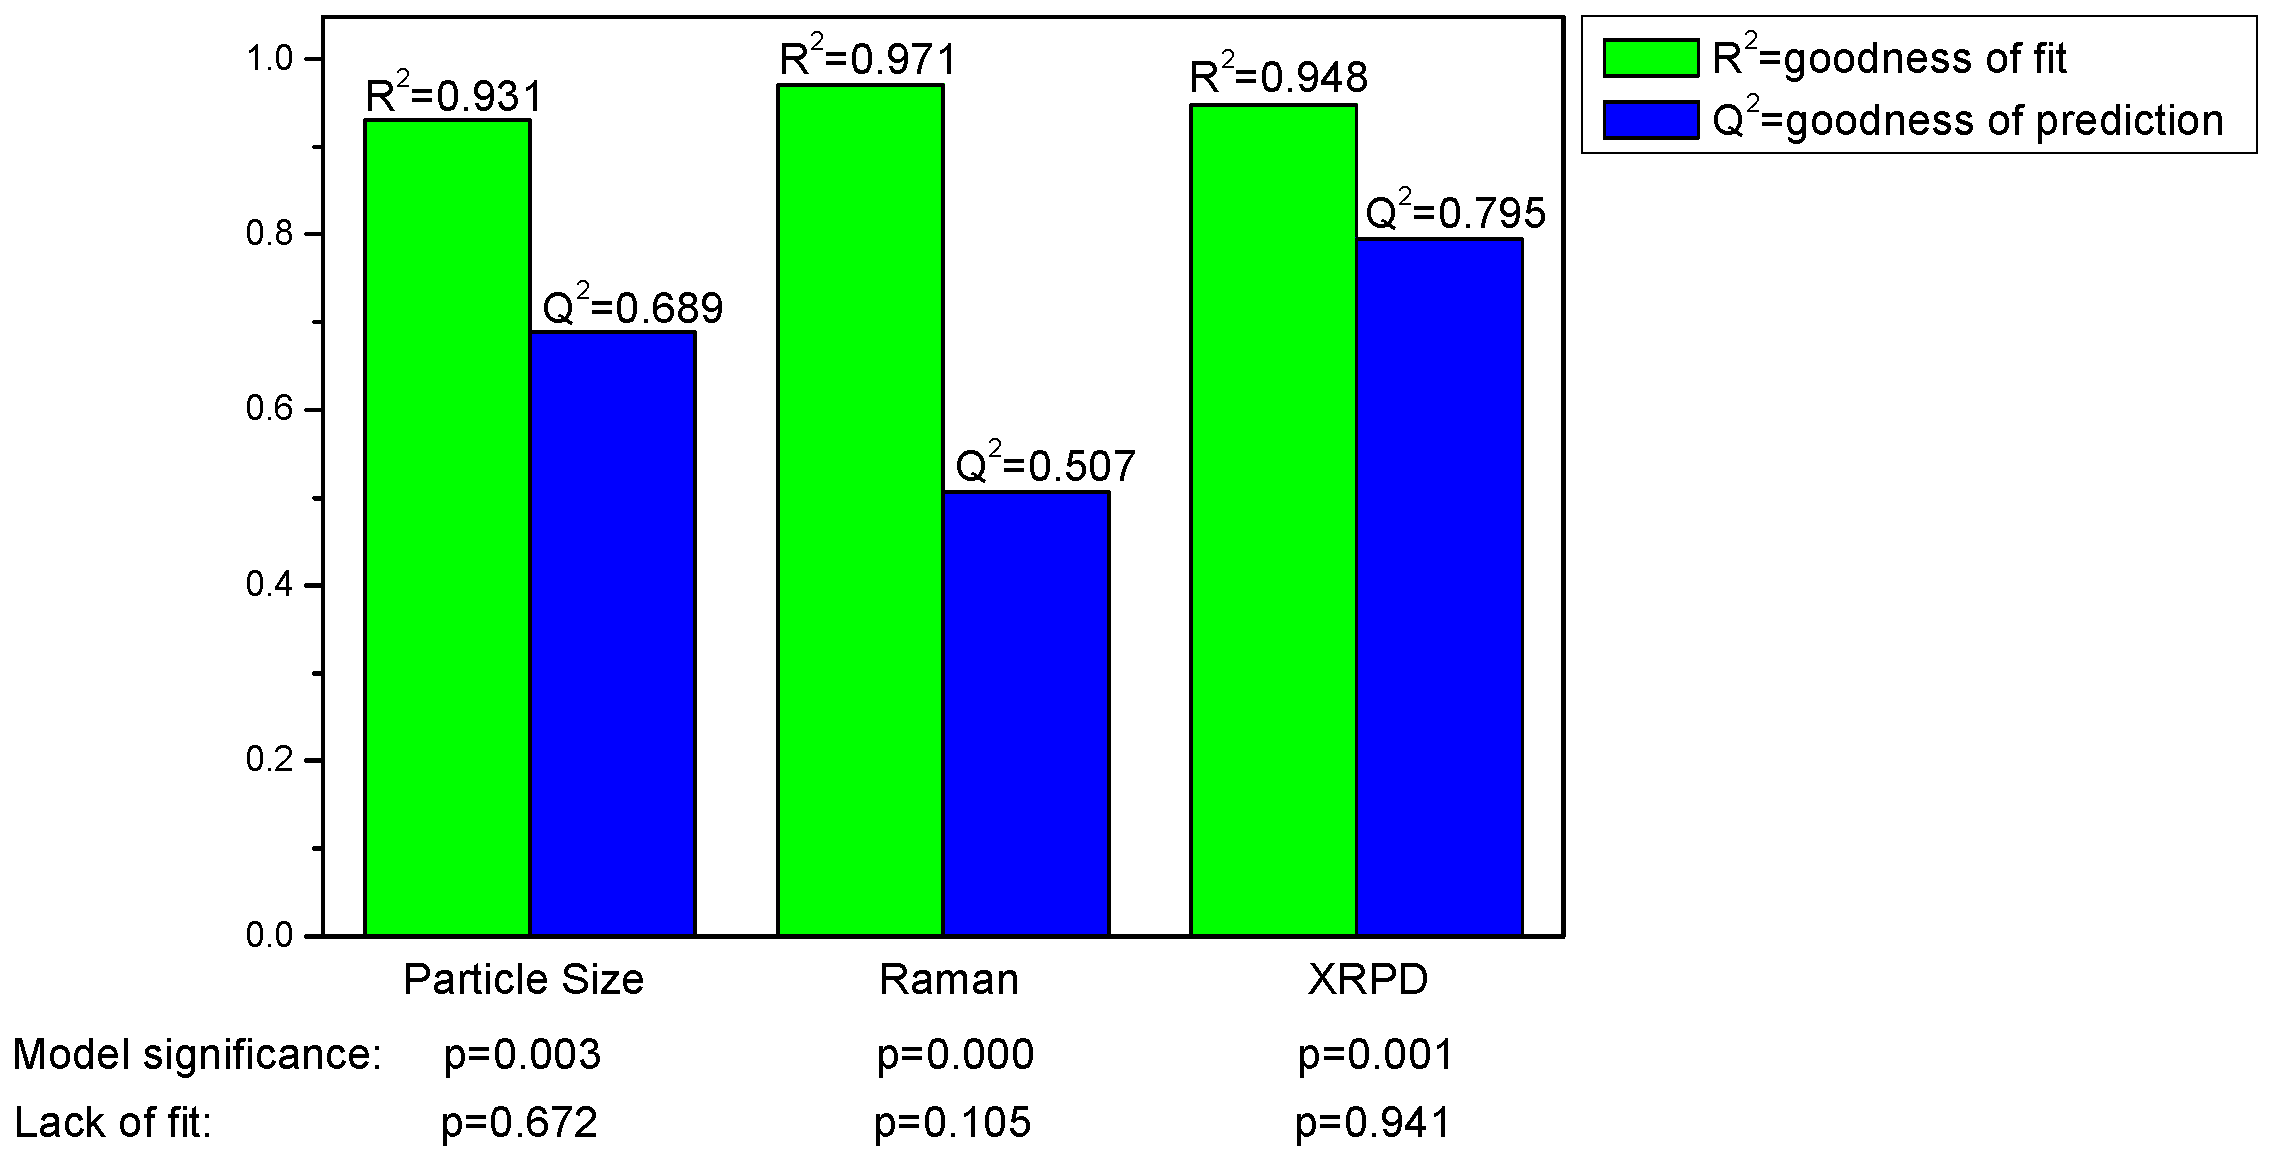
Valid and significant quadratic models were built. The model parameters R
2 (goodness of fit) and Q
2 (goodness of prediction) are shown in
Figure 4 and reveal that all models are valid. The models were significant according to ANOVA with no lack of fit and the respective p-values are also listed in
Figure 4.
Figure 4.
Model parameters for the responses particle size and process induced disorder, assessed by Raman spectroscopy and X-ray powder diffraction (XRPD), respectively.
Figure 4.
Model parameters for the responses particle size and process induced disorder, assessed by Raman spectroscopy and X-ray powder diffraction (XRPD), respectively.
For the models presented, the model parameters suggest a better prediction of process induced disorder for the model based on the XRPD data.
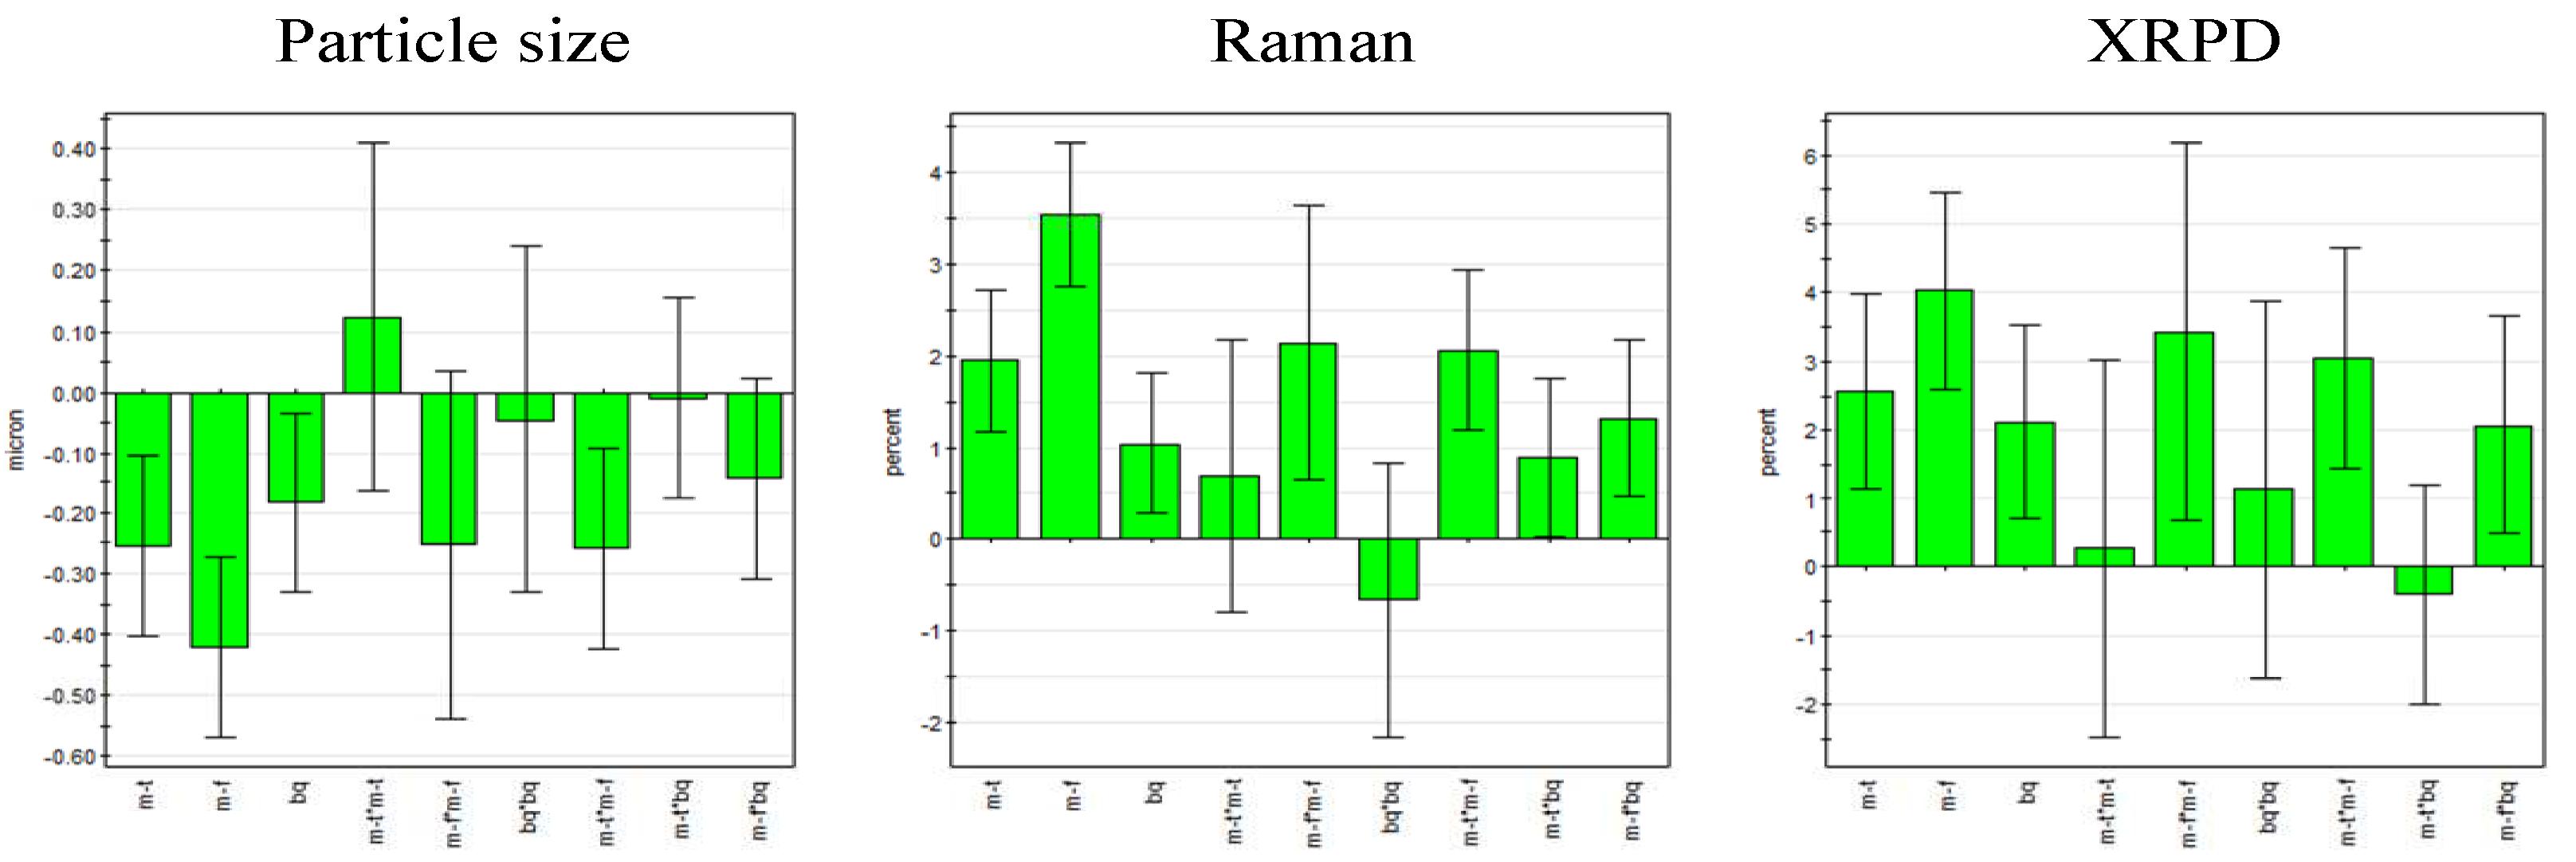
According to the regression coefficient plots, all three linear terms (milling frequency, milling time and ball quantity) were statistically significant and milling frequency was found to be the most important factor for all responses. Furthermore, it was found that milling frequency and milling time exhibited an interaction effect on the responses. Milling frequency was the only statistically significant square term (
Figure 5). No term was omitted as model improvement was negligible.
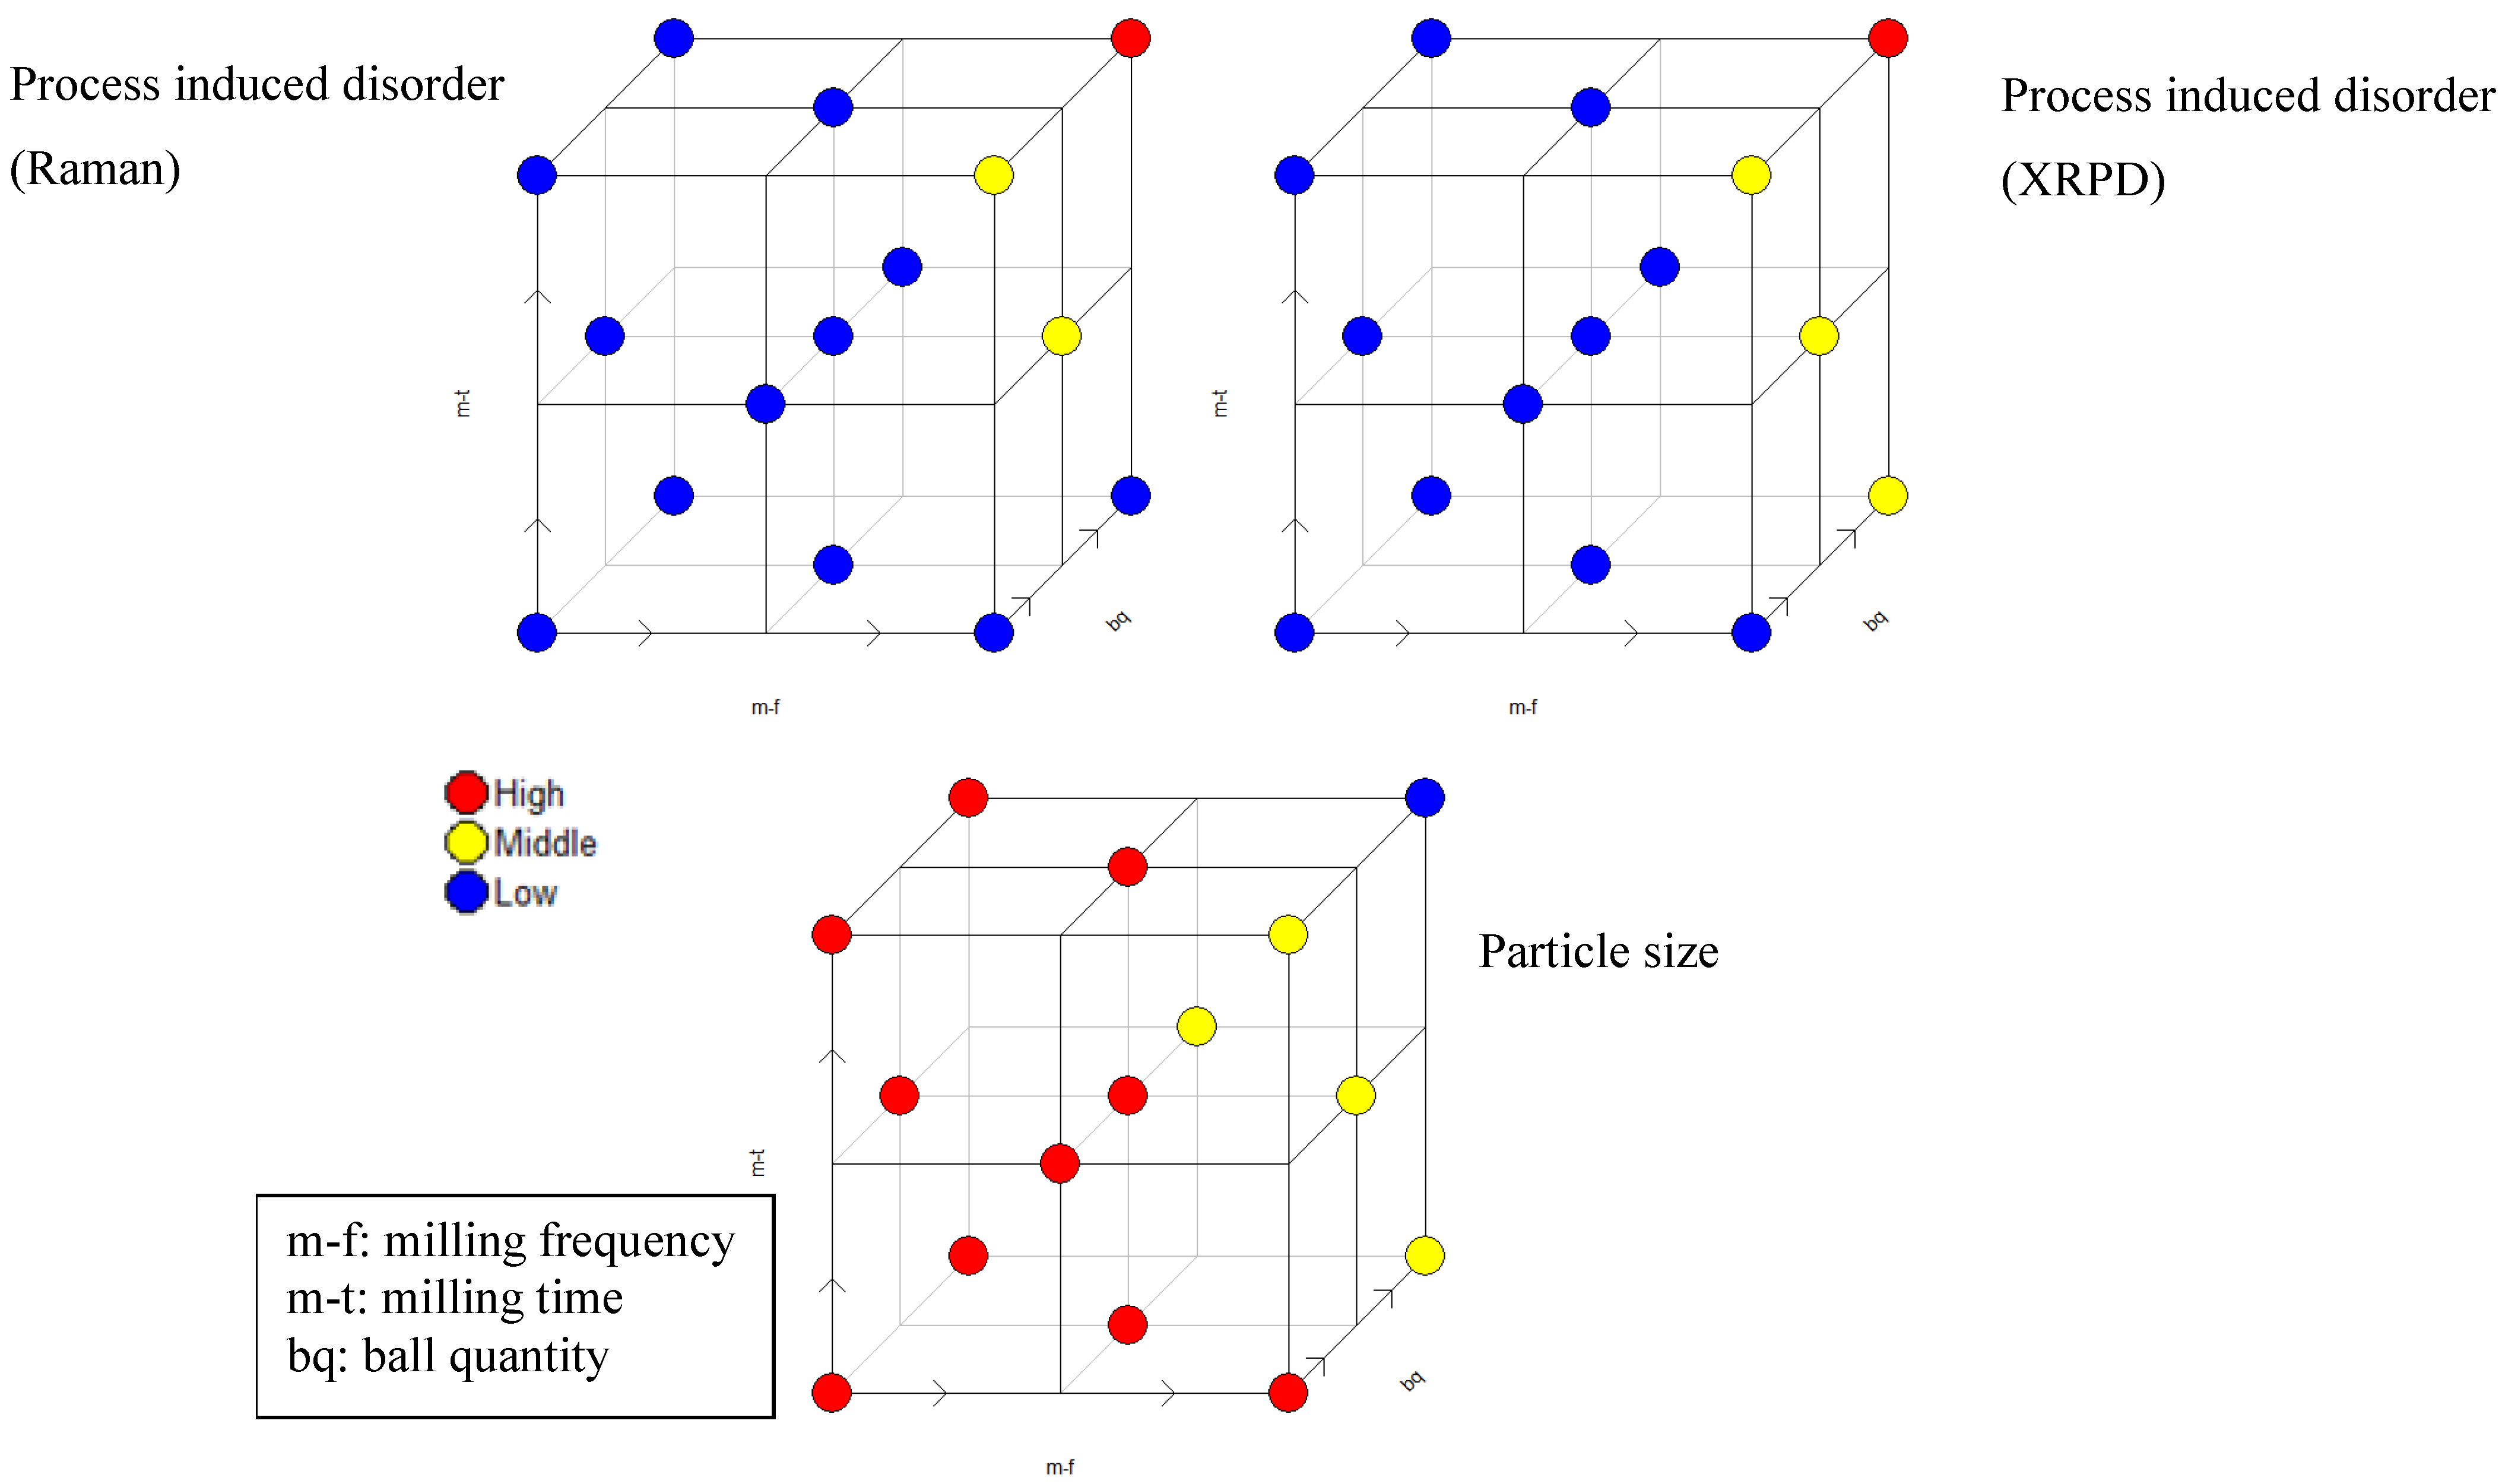
The full factorial design as a screening tool is part of the central composite design (optimization design), (
Figure 6). The colors symbolize the effect on the respective responses at the respective milling setting; each point symbolizes one particular experiment according to
Table 1.
Figure 5 and
Figure 6 visualize that particle size and process induced disorder are opposing responses with respect to variable effect.
Figure 5.
Regression coefficient plot of the scaled and centered coefficients for particle size (left) and process induced disorder determined by Raman spectroscopy (center) and XRPD (right) (error bars represent 95% confidence interval; m-f = milling frequency, m-t = milling time, bq = ball quantity).
Figure 6.
Central composite face centered design for simvastatin based on process induced disorder assessed by Raman spectroscopy (upper left) and XRPD (upper right) and particle size (bottom) as respective responses. “High” (red), “Middle” (yellow) and “Low” (blue) refer to the effect on the respective response.
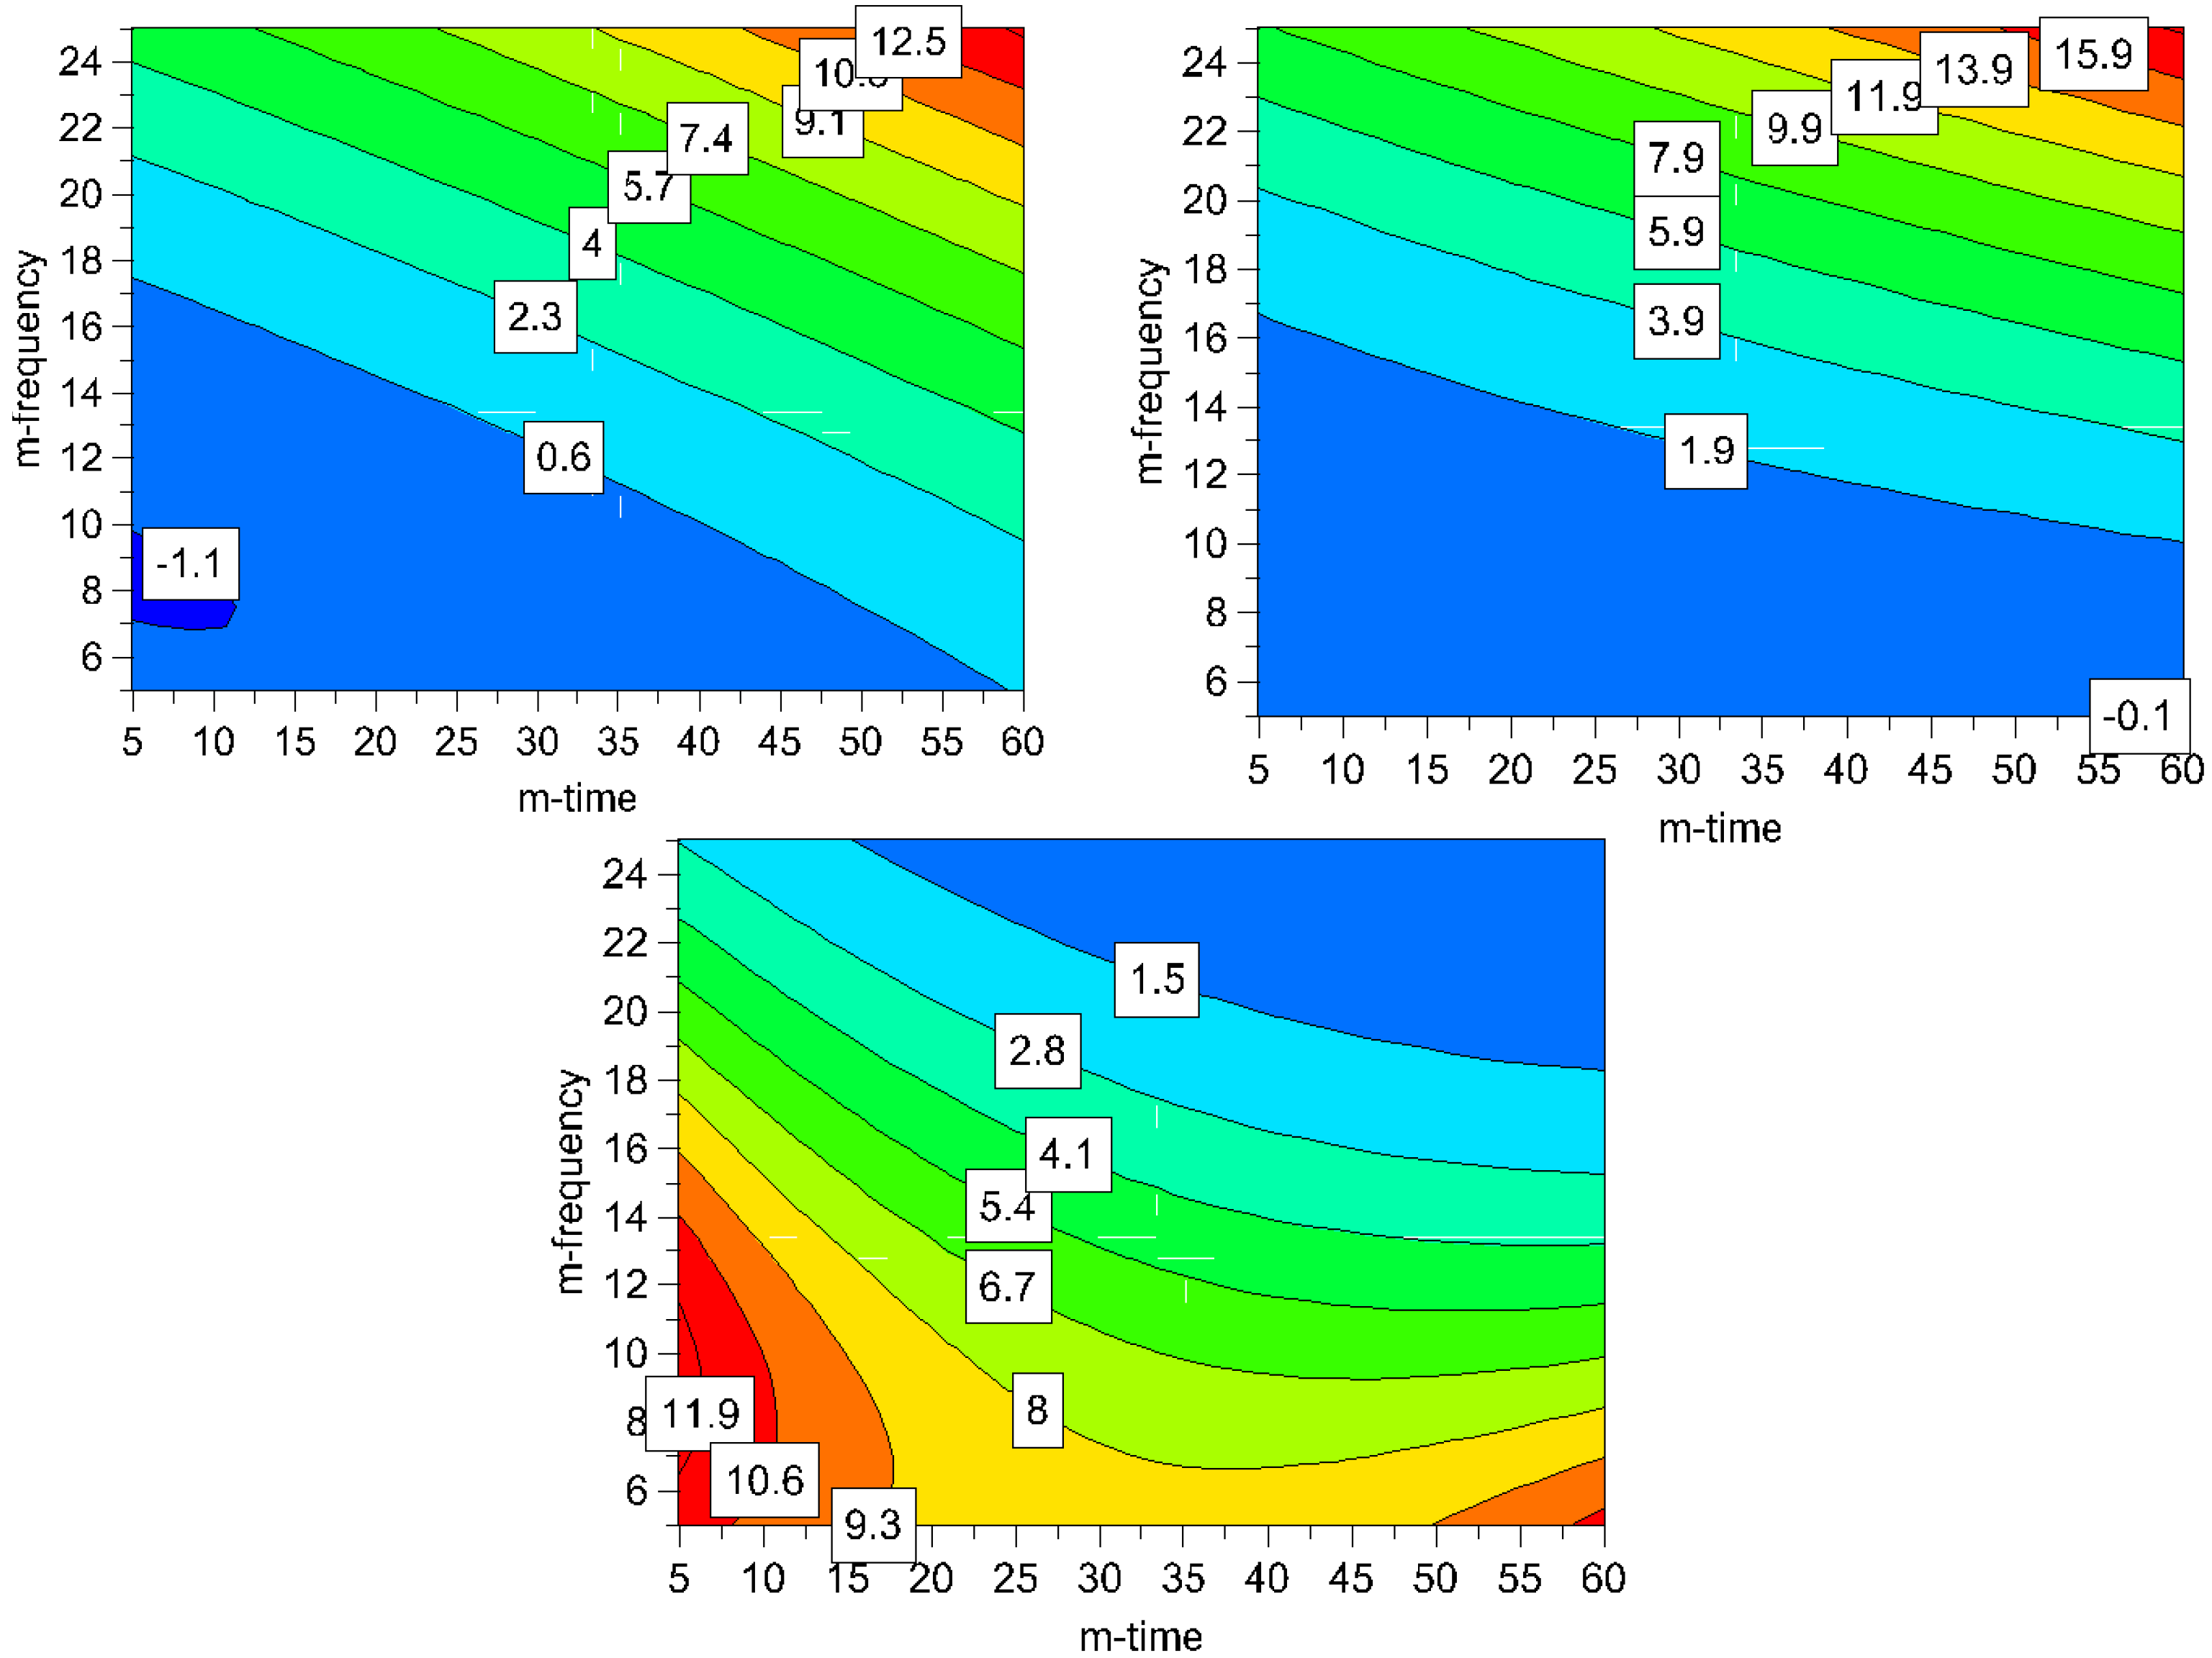
It can be seen in the contour plots for process induced disorder, that the lowest impact on process induced disorder can be achieved by applying low to middle milling frequencies (5-17 Hz) over the whole time frame (5-60 min), (
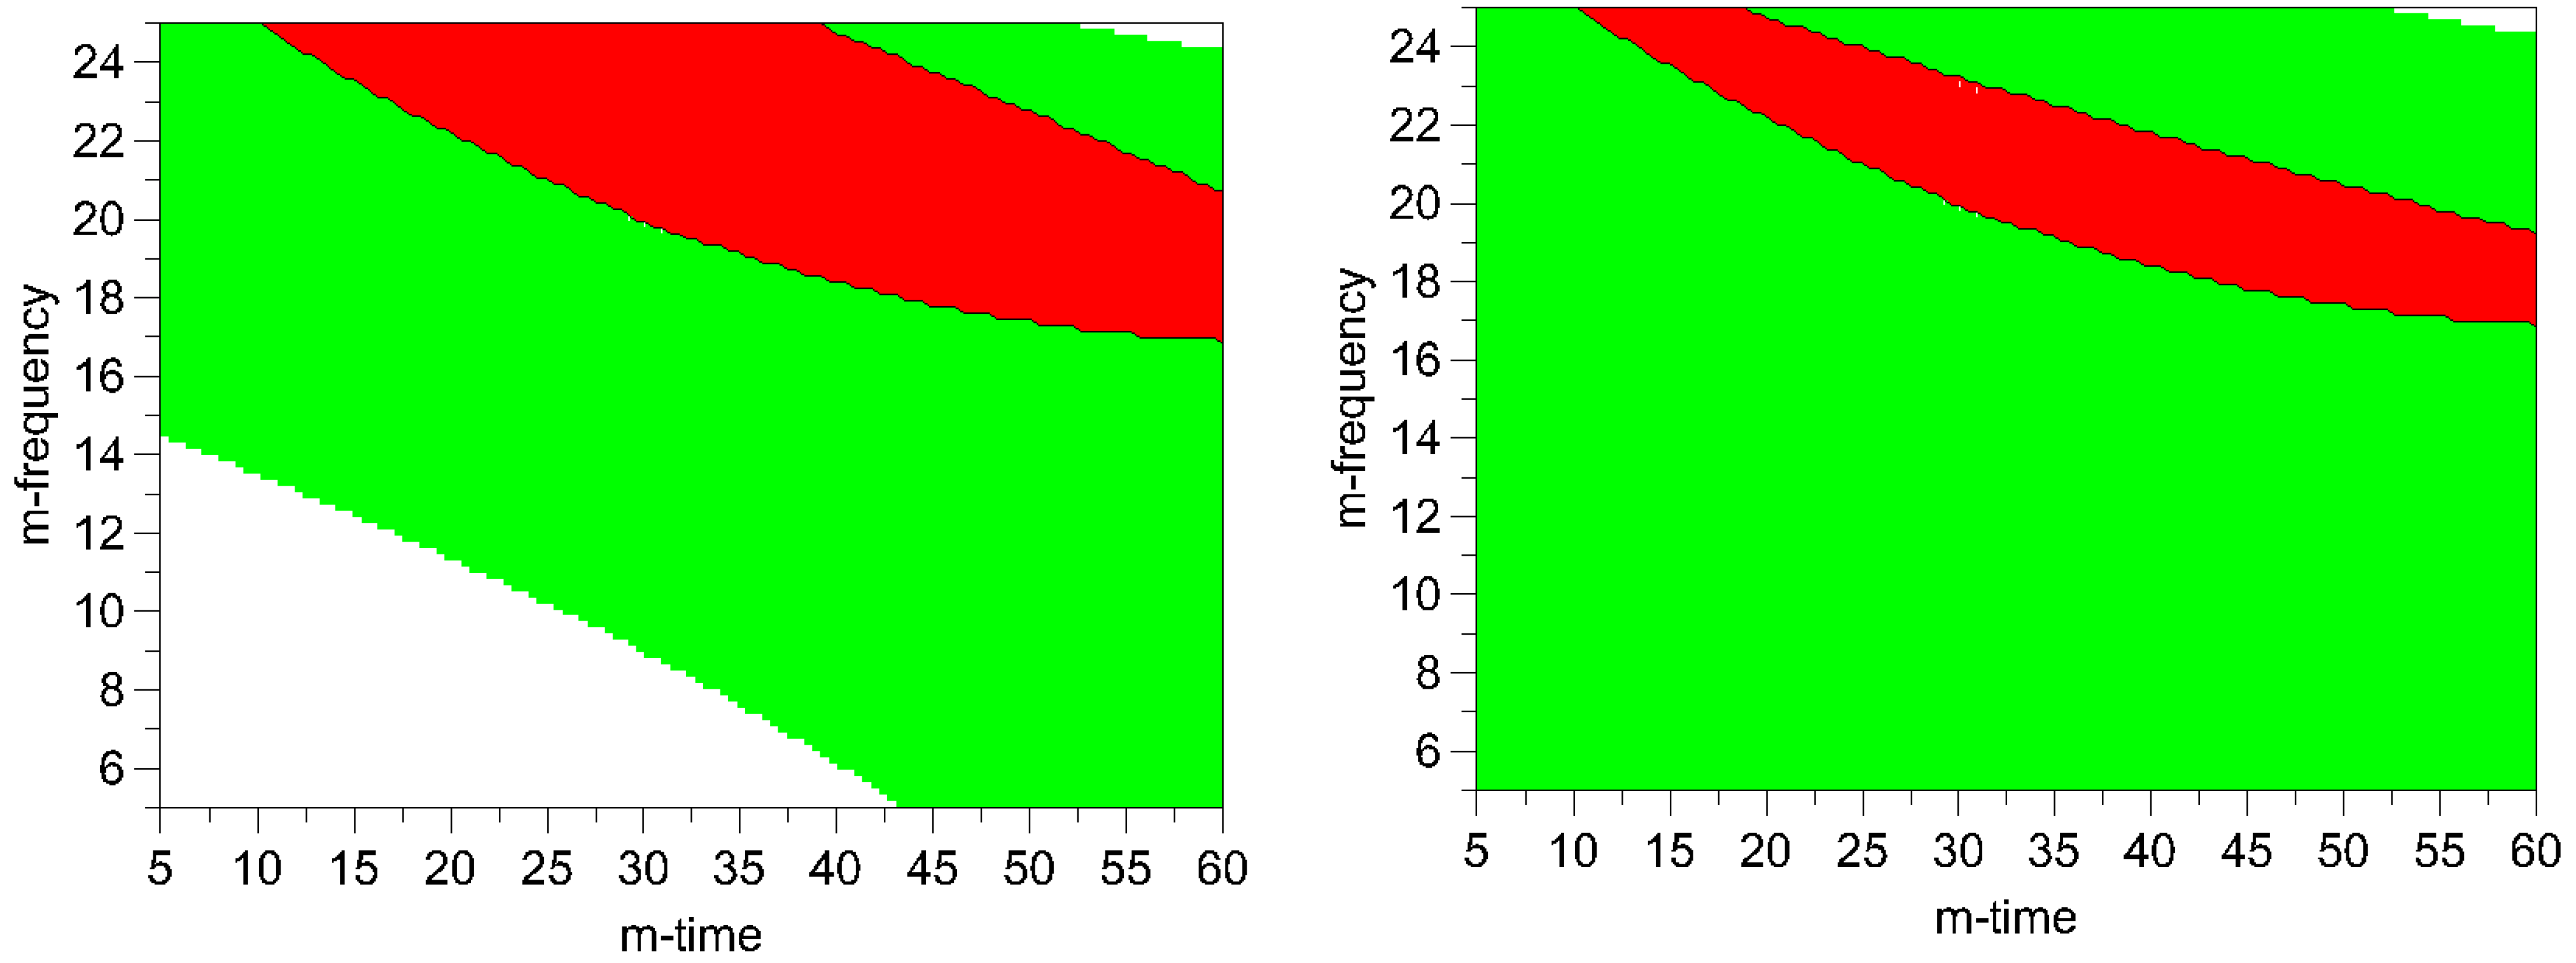
Figure 7). However, particle size in this operating space yields bigger particles (8-11.9 μm). Hence, the optimum was determined by overlaying the respective contour plots and, thus, creating the optimal area plots, and the results are shown in
Figure 8. The optimization limits were set at < 2 μm for particle size and < 10% for process induced disorder with a small particle size as the decisive criterion. A high ball quantity of 60 balls was chosen to ensure sufficient interaction of the milling media with the drug, as the main objective was to reduce the particle size. Optimal milling parameters for simvastatin were found to be at high and middle milling frequencies and middle milling times. In this experimental space, the local optimum according to the model could be found at a milling frequency of 21 Hz and 36 min milling time (ball quantity 60). These milling conditions resulted in a predicted primary particle size of 1.4 μm and a prediction of process induced disorder of 6.1% (when determined by Raman spectroscopy) and 8.4% (when determined by XRPD).
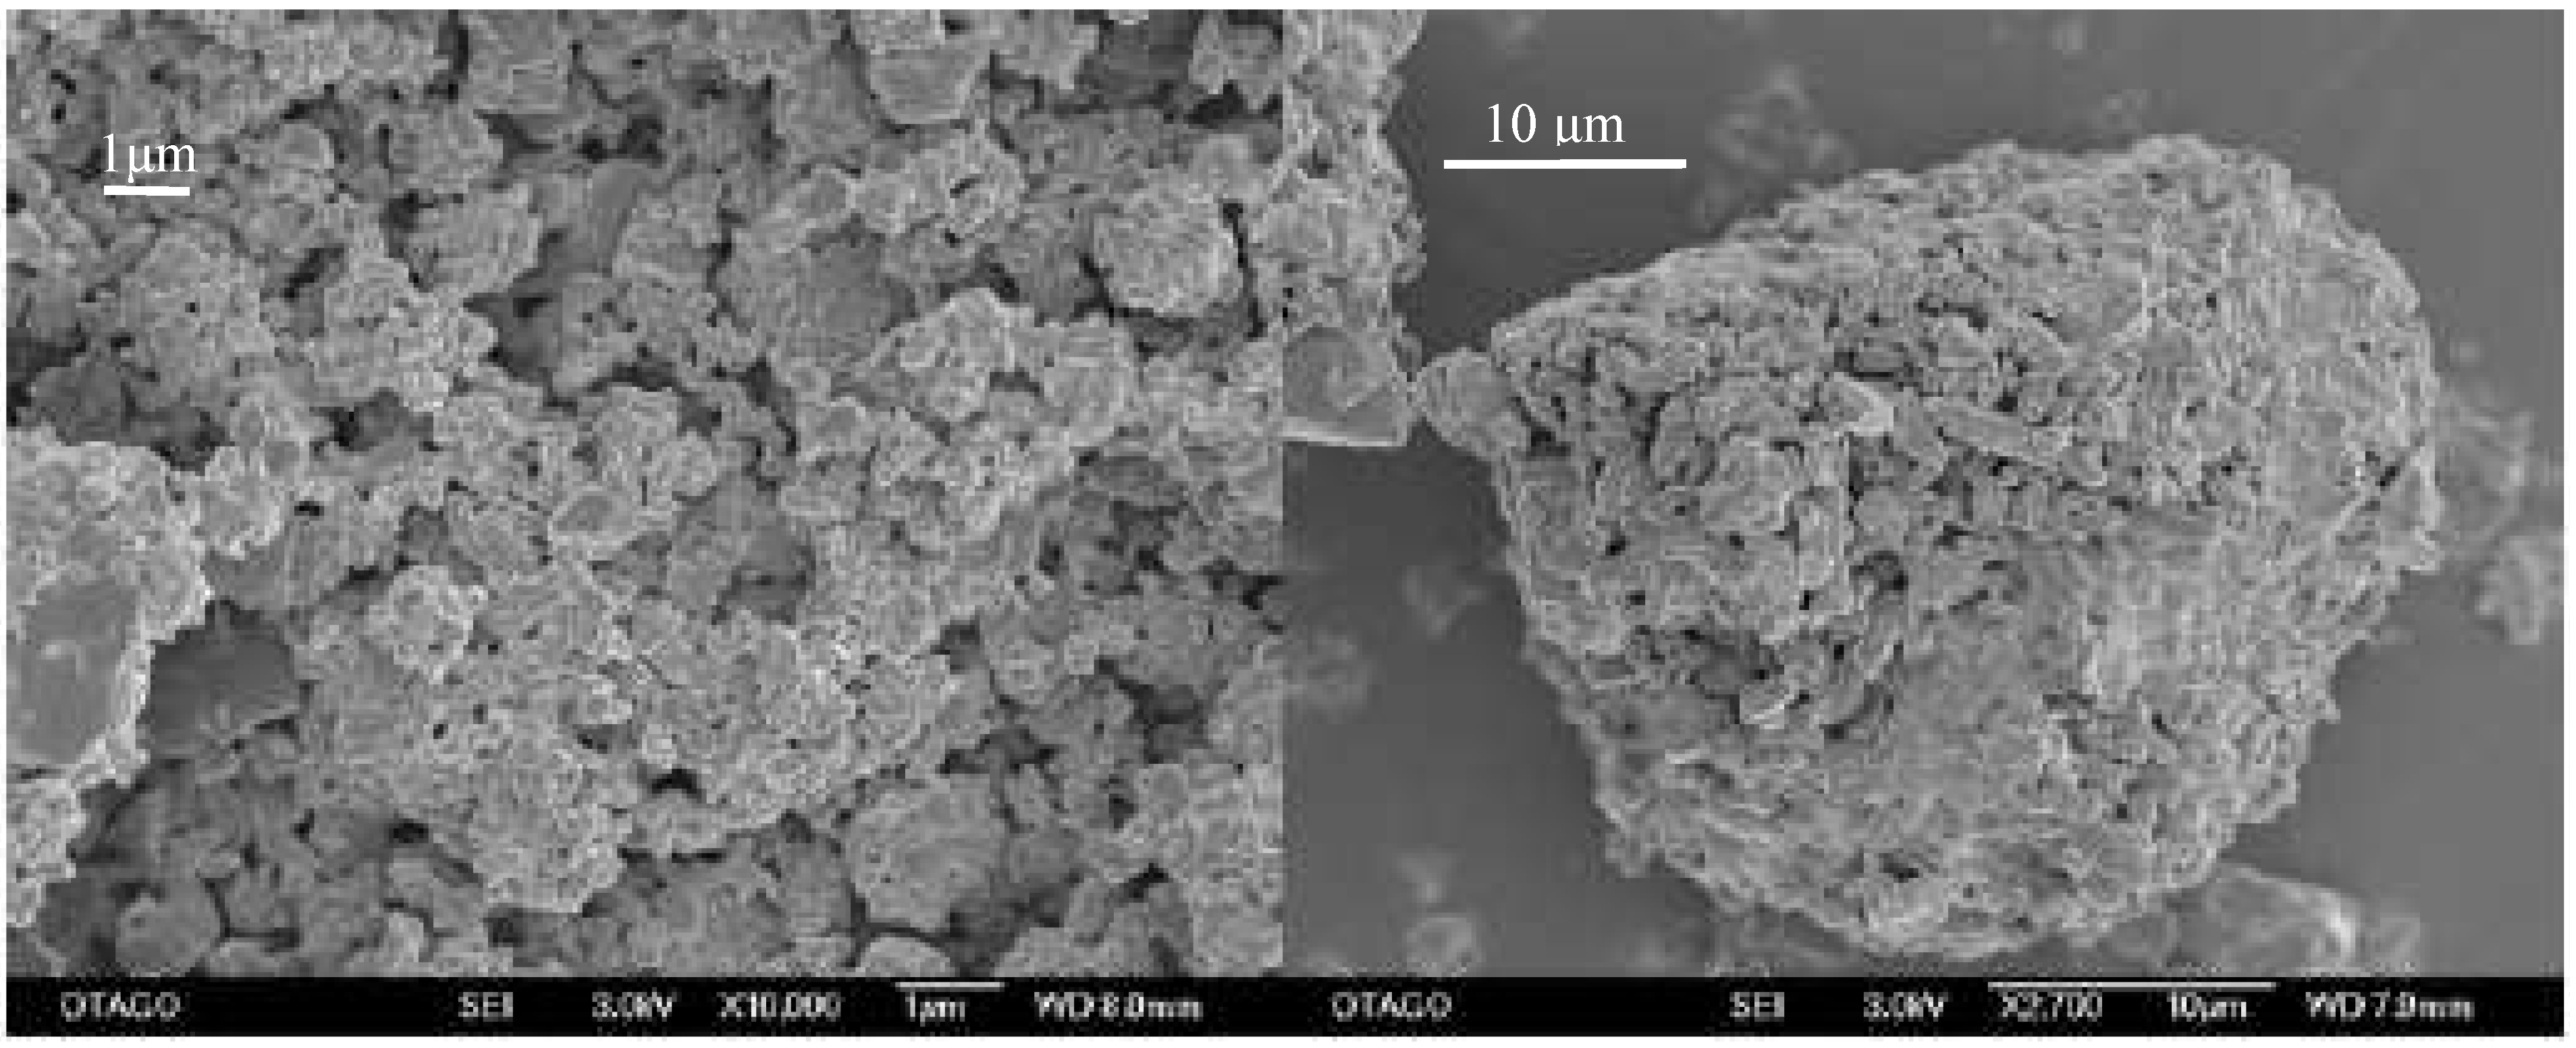
Subsequently, the predicted optimum was tested experimentally and a process induced disorder of 6.9% (± 2.2) was determined by Raman spectroscopy and 7.8% (± 2.3) was determined by XRPD, which complies with the prediction. No glass transition could be detected in any of the samples by DSC, thus amorphization of the drug was excluded. The predicted primary particle size of 1.4 μm could also be confirmed experimentally. However, the high surface energy of the small particles resulted in the formation of large agglomerated secondary particles, which proved to be of significance for the dissolution performance (
Figure 9).
Figure 7.
Contour plots for process induced disorder [%] assessed by Raman spectroscopy (top left) and XRPD (top right) and particle size [μm] (bottom); the ball quantity was set high (60 balls) for all plots to assure a high media-drug interaction leading to smaller particles (m-frequency = milling frequency; m-time = milling time).
Figure 8.
Optimal area plots for particle size and process induced disorder assessed by Raman spectroscopy (left) and XRPD (right). Optimization limits were set at < 2 μm for particle size and < 10% for process induced disorder at a high ball quantity of 60 balls. The optimal area is shown in red (m-frequency = milling- frequency; m- time = milling- time). Green areas indicate the experimental space where one of the limiting conditions is met. The white areas indicate where none of the limits are met.
Figure 9.
Primary (left) and secondary (right) particle size of the optimized milled sample. Bars equal 1 and 10 μm, respectively.
Figure 9.
Primary (left) and secondary (right) particle size of the optimized milled sample. Bars equal 1 and 10 μm, respectively.
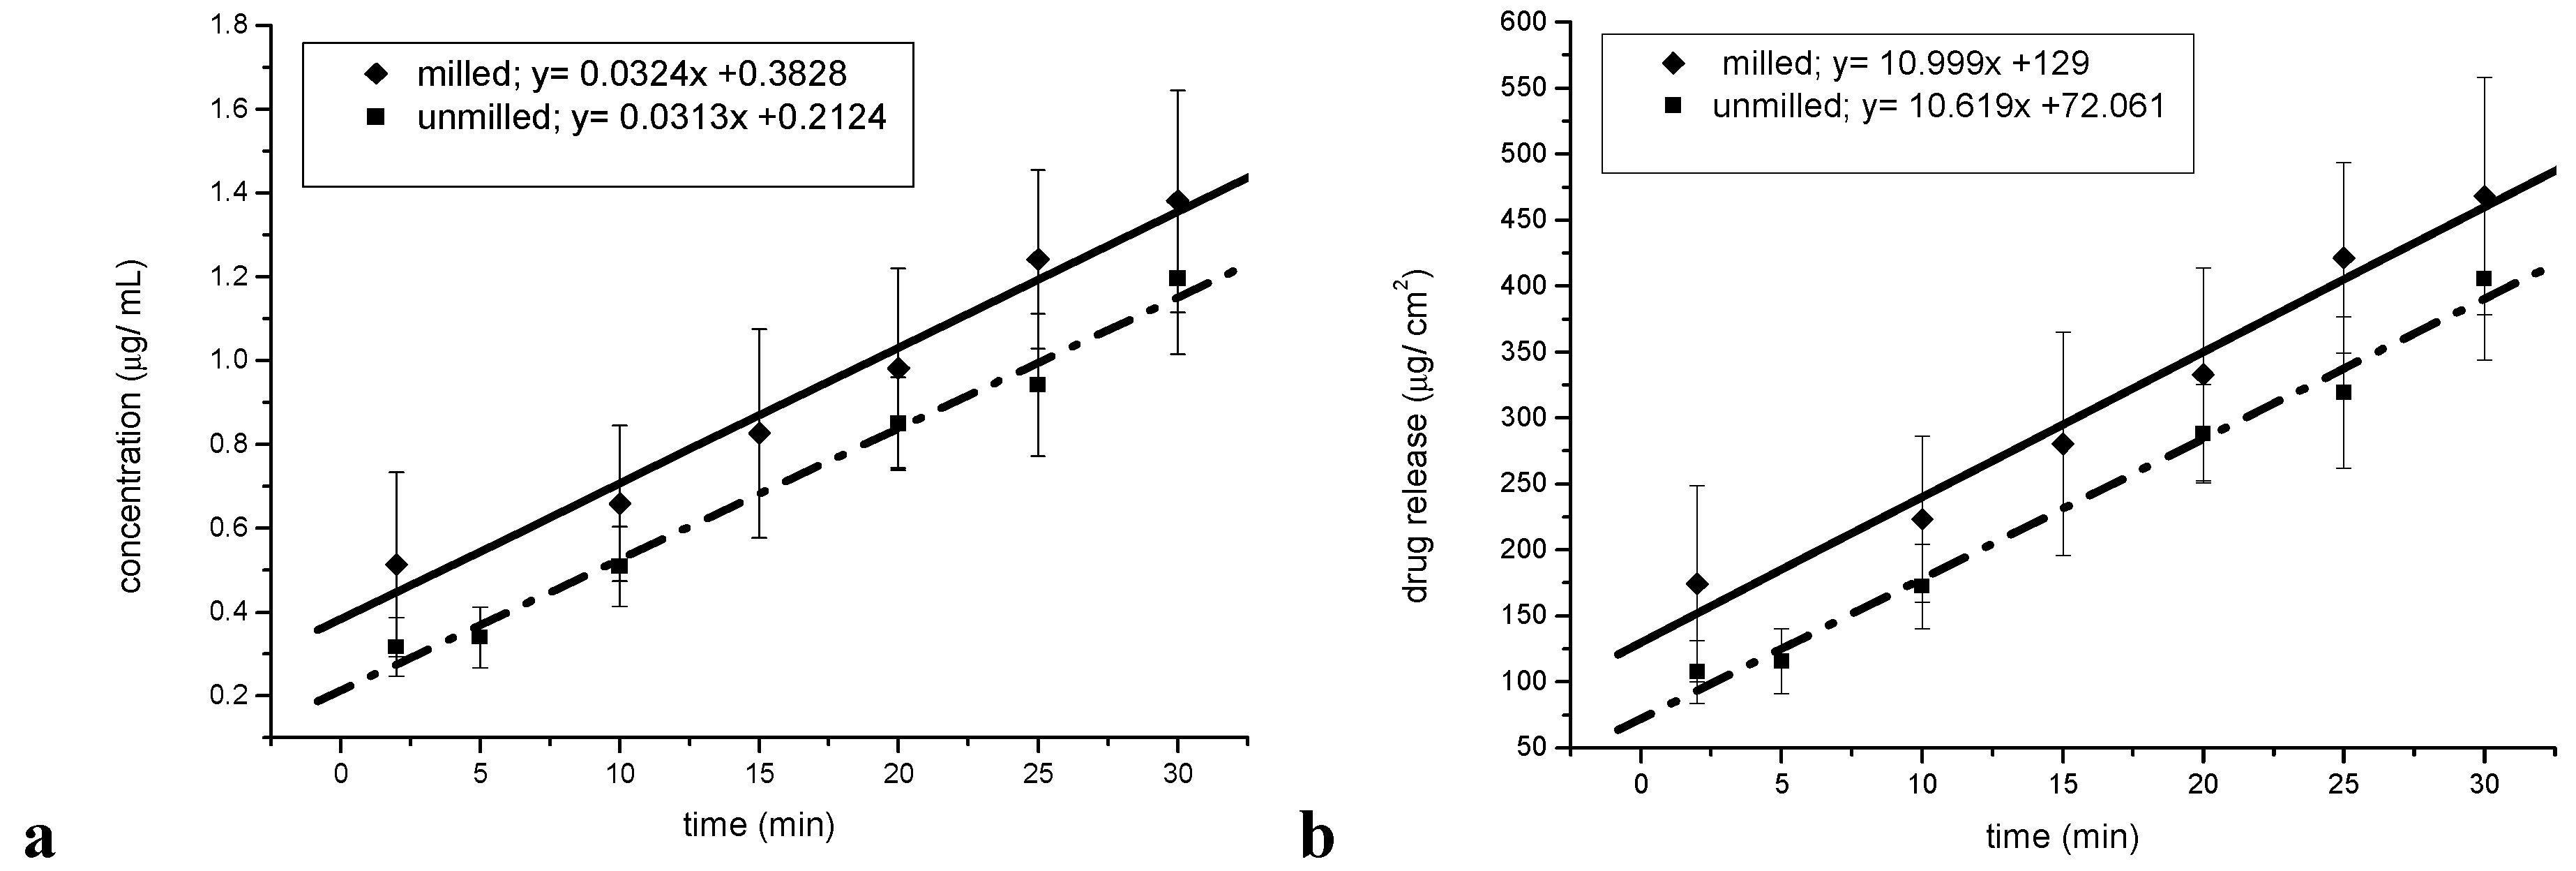
Intrinsic and powder dissolution tests were undertaken in order to test whether the reduced particle size in fact leads to a dissolution rate enhancement. The saturation solubility of unprocessed simvastatin in the dissolution medium was found to be 0.51 mg/ mL (± 0.030), which is in accordance with published values [
12]. The concentration-time profiles (mg/mL) and the release-time profiles (mg/cm
2) for the intrinsic dissolution of the milled and unmilled simvastatin are shown in
Figure 10a and 10b. The surface area of the pure sample tablets was 2.65 cm
2, and the intrinsic dissolution rates (IDRs) of the milled and unmilled simvastatin were 11.00 μg/cm
2 min and 10.62 μg/cm
2 min, respectively (
Figure 10b). The graphs of the IDR plots were parallel and the difference was not statistically significant (α = 0.05, P = 0.421; n = 3), indicating that the process induced disorder was negligible with regard to the dissolution rate.
Figure 10.
Intrinsic dissolution tests. (a) Concentration-time profile for the intrinsic dissolution of milled and unmilled simvastatin. (b) Release-time profile for the intrinsic dissolution of milled and unmilled simvastatin.
Figure 10.
Intrinsic dissolution tests. (a) Concentration-time profile for the intrinsic dissolution of milled and unmilled simvastatin. (b) Release-time profile for the intrinsic dissolution of milled and unmilled simvastatin.
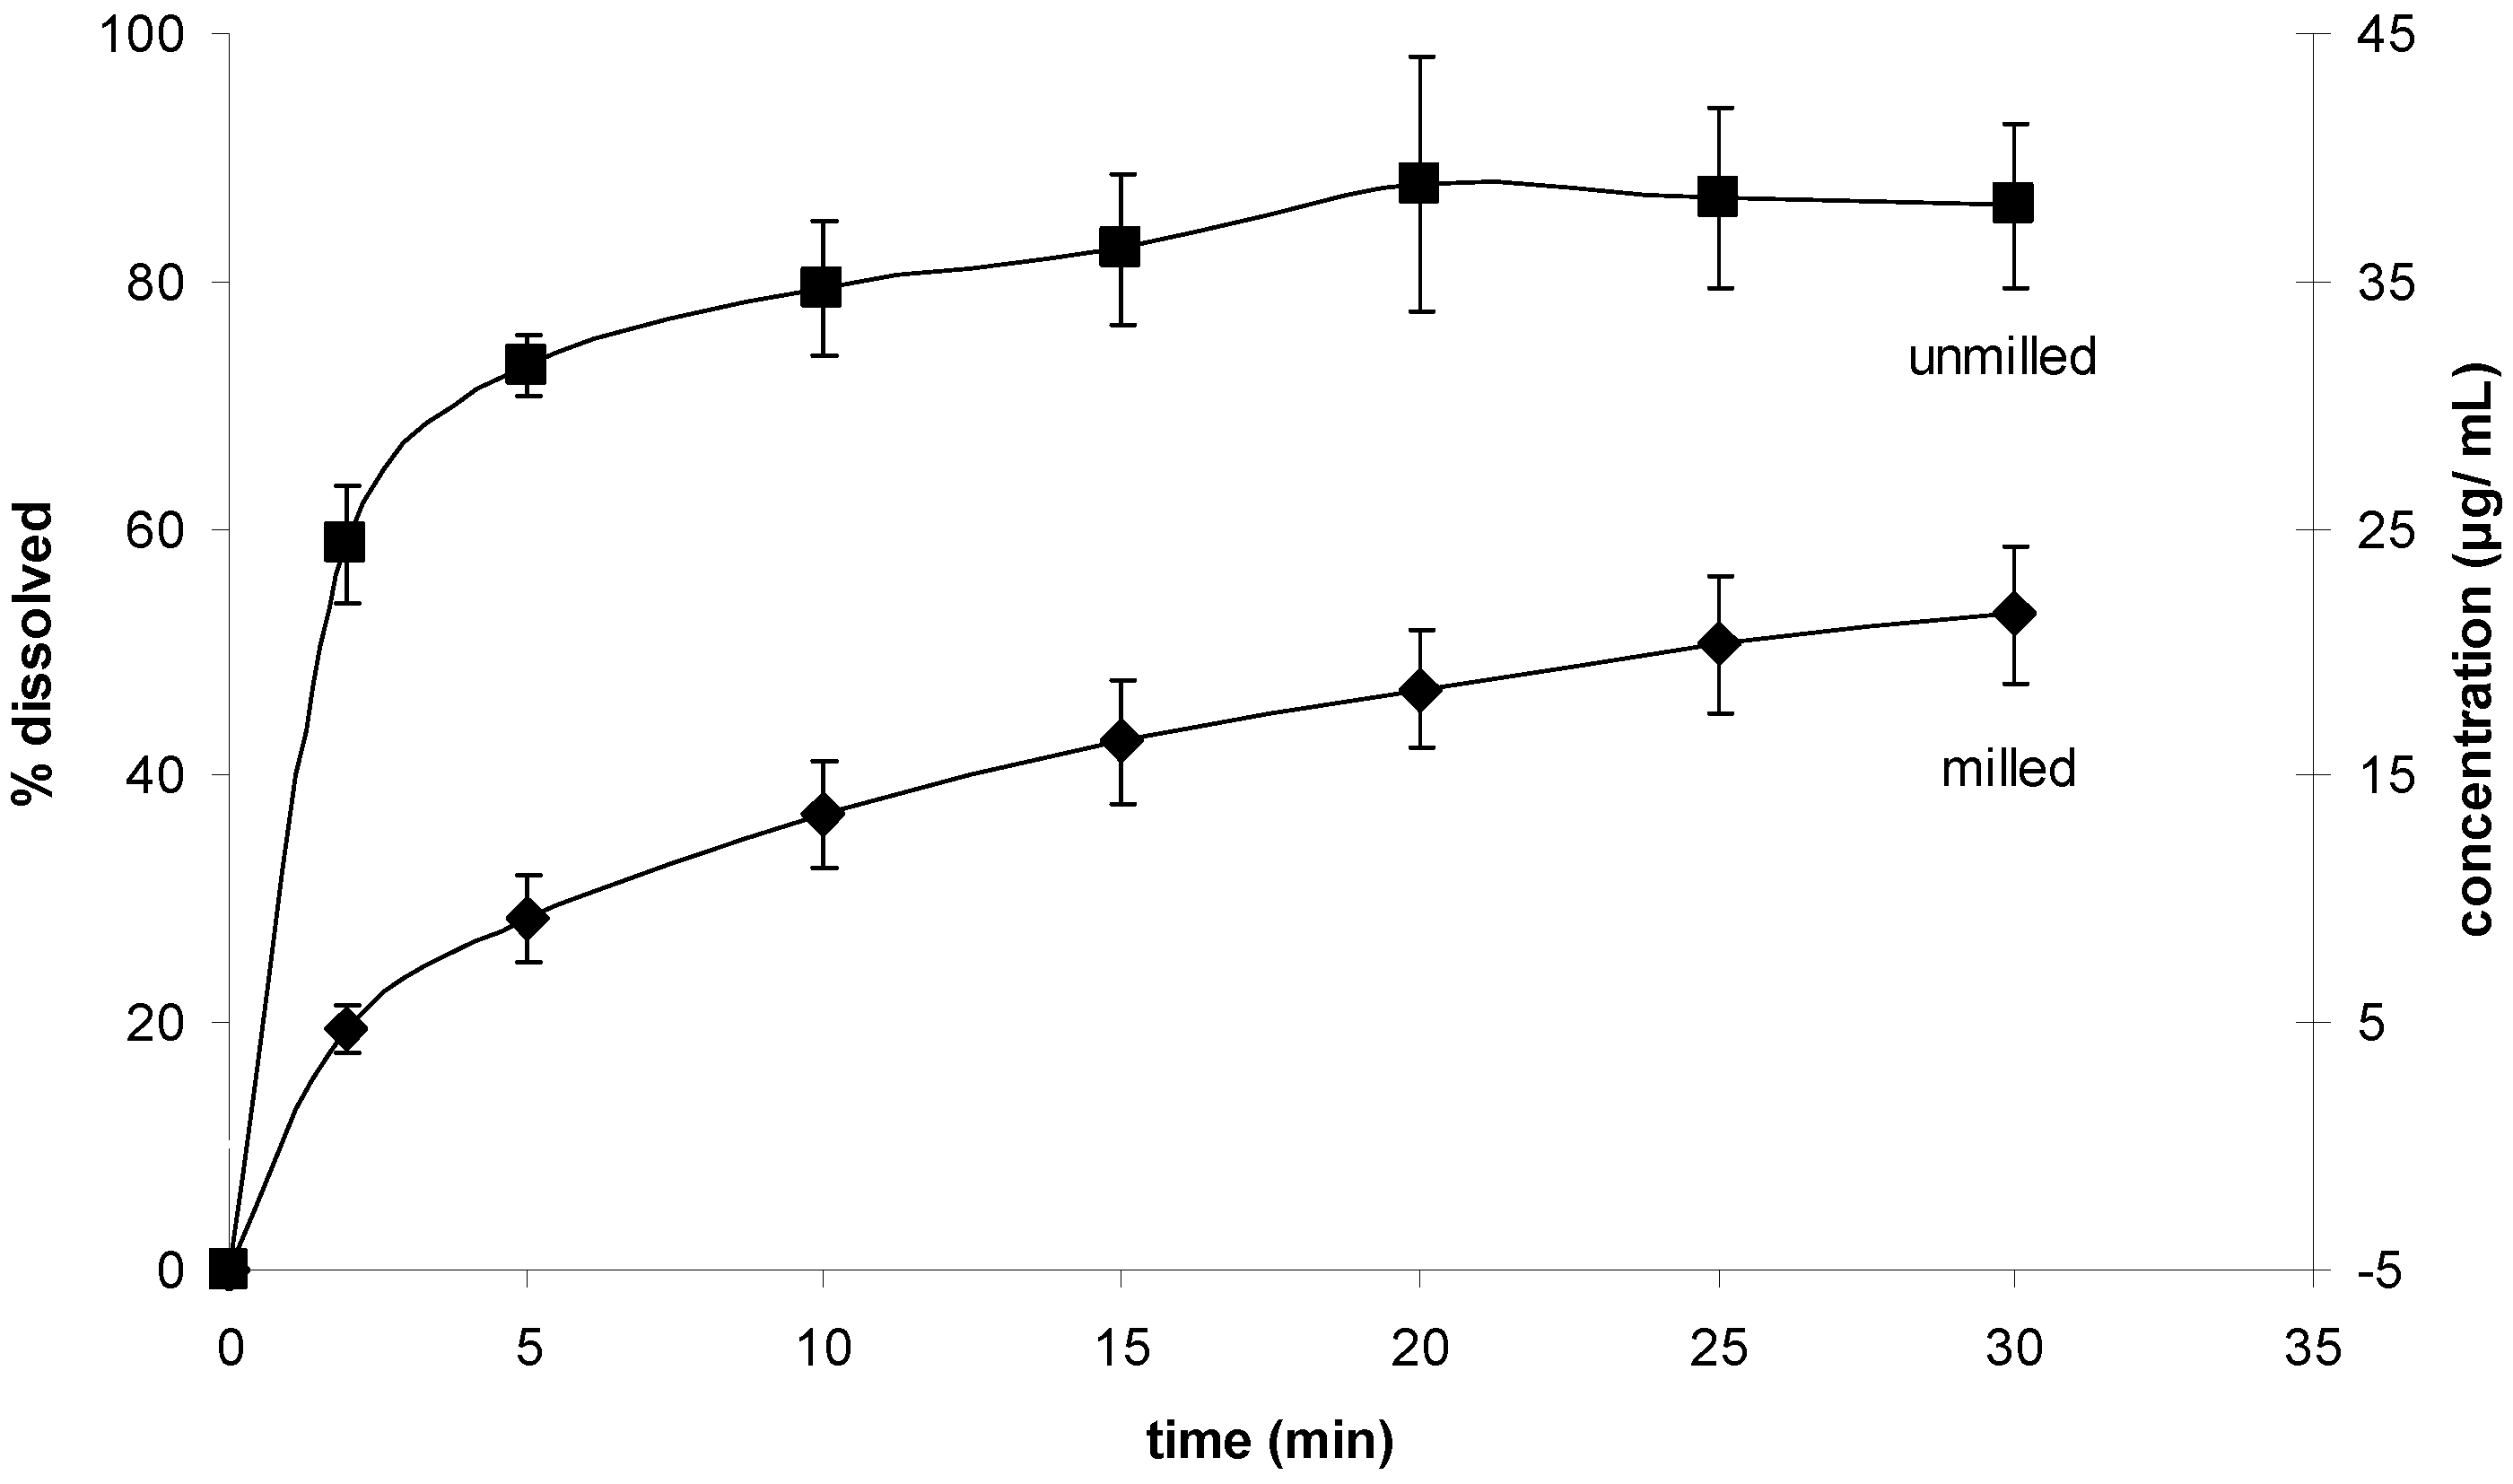
The results for the powder dissolution tests are shown in
Figure 11. Interestingly, the unprocessed sample showed the higher dissolution rate.
Figure 11.
Powder dissolution test. Dissolution rates of milled and unmilled simvastatin.
Figure 11.
Powder dissolution test. Dissolution rates of milled and unmilled simvastatin.
Since the investigated milling procedure was a dry milling process in the absence of stabilizing excipients, agglomeration is likely to be accountable for the poor dissolution performance of the processed drug compared to the unprocessed drug. Wet milling of the drug in a media mill may be a feasible alternative, as in this milling operation small particles are prevented from agglomeration through steric and/ or electrostatic stabilization [
15].

