Transcriptomic Profiling of the Immune Response in Orthotopic Pancreatic Tumours Exposed to Combined Boiling Histotripsy and Oncolytic Reovirus Treatment
Abstract
1. Introduction
2. Materials and Methods
3. Results
3.1. BH Treatment Monitoring and Acoustic Cavitation Monitoring
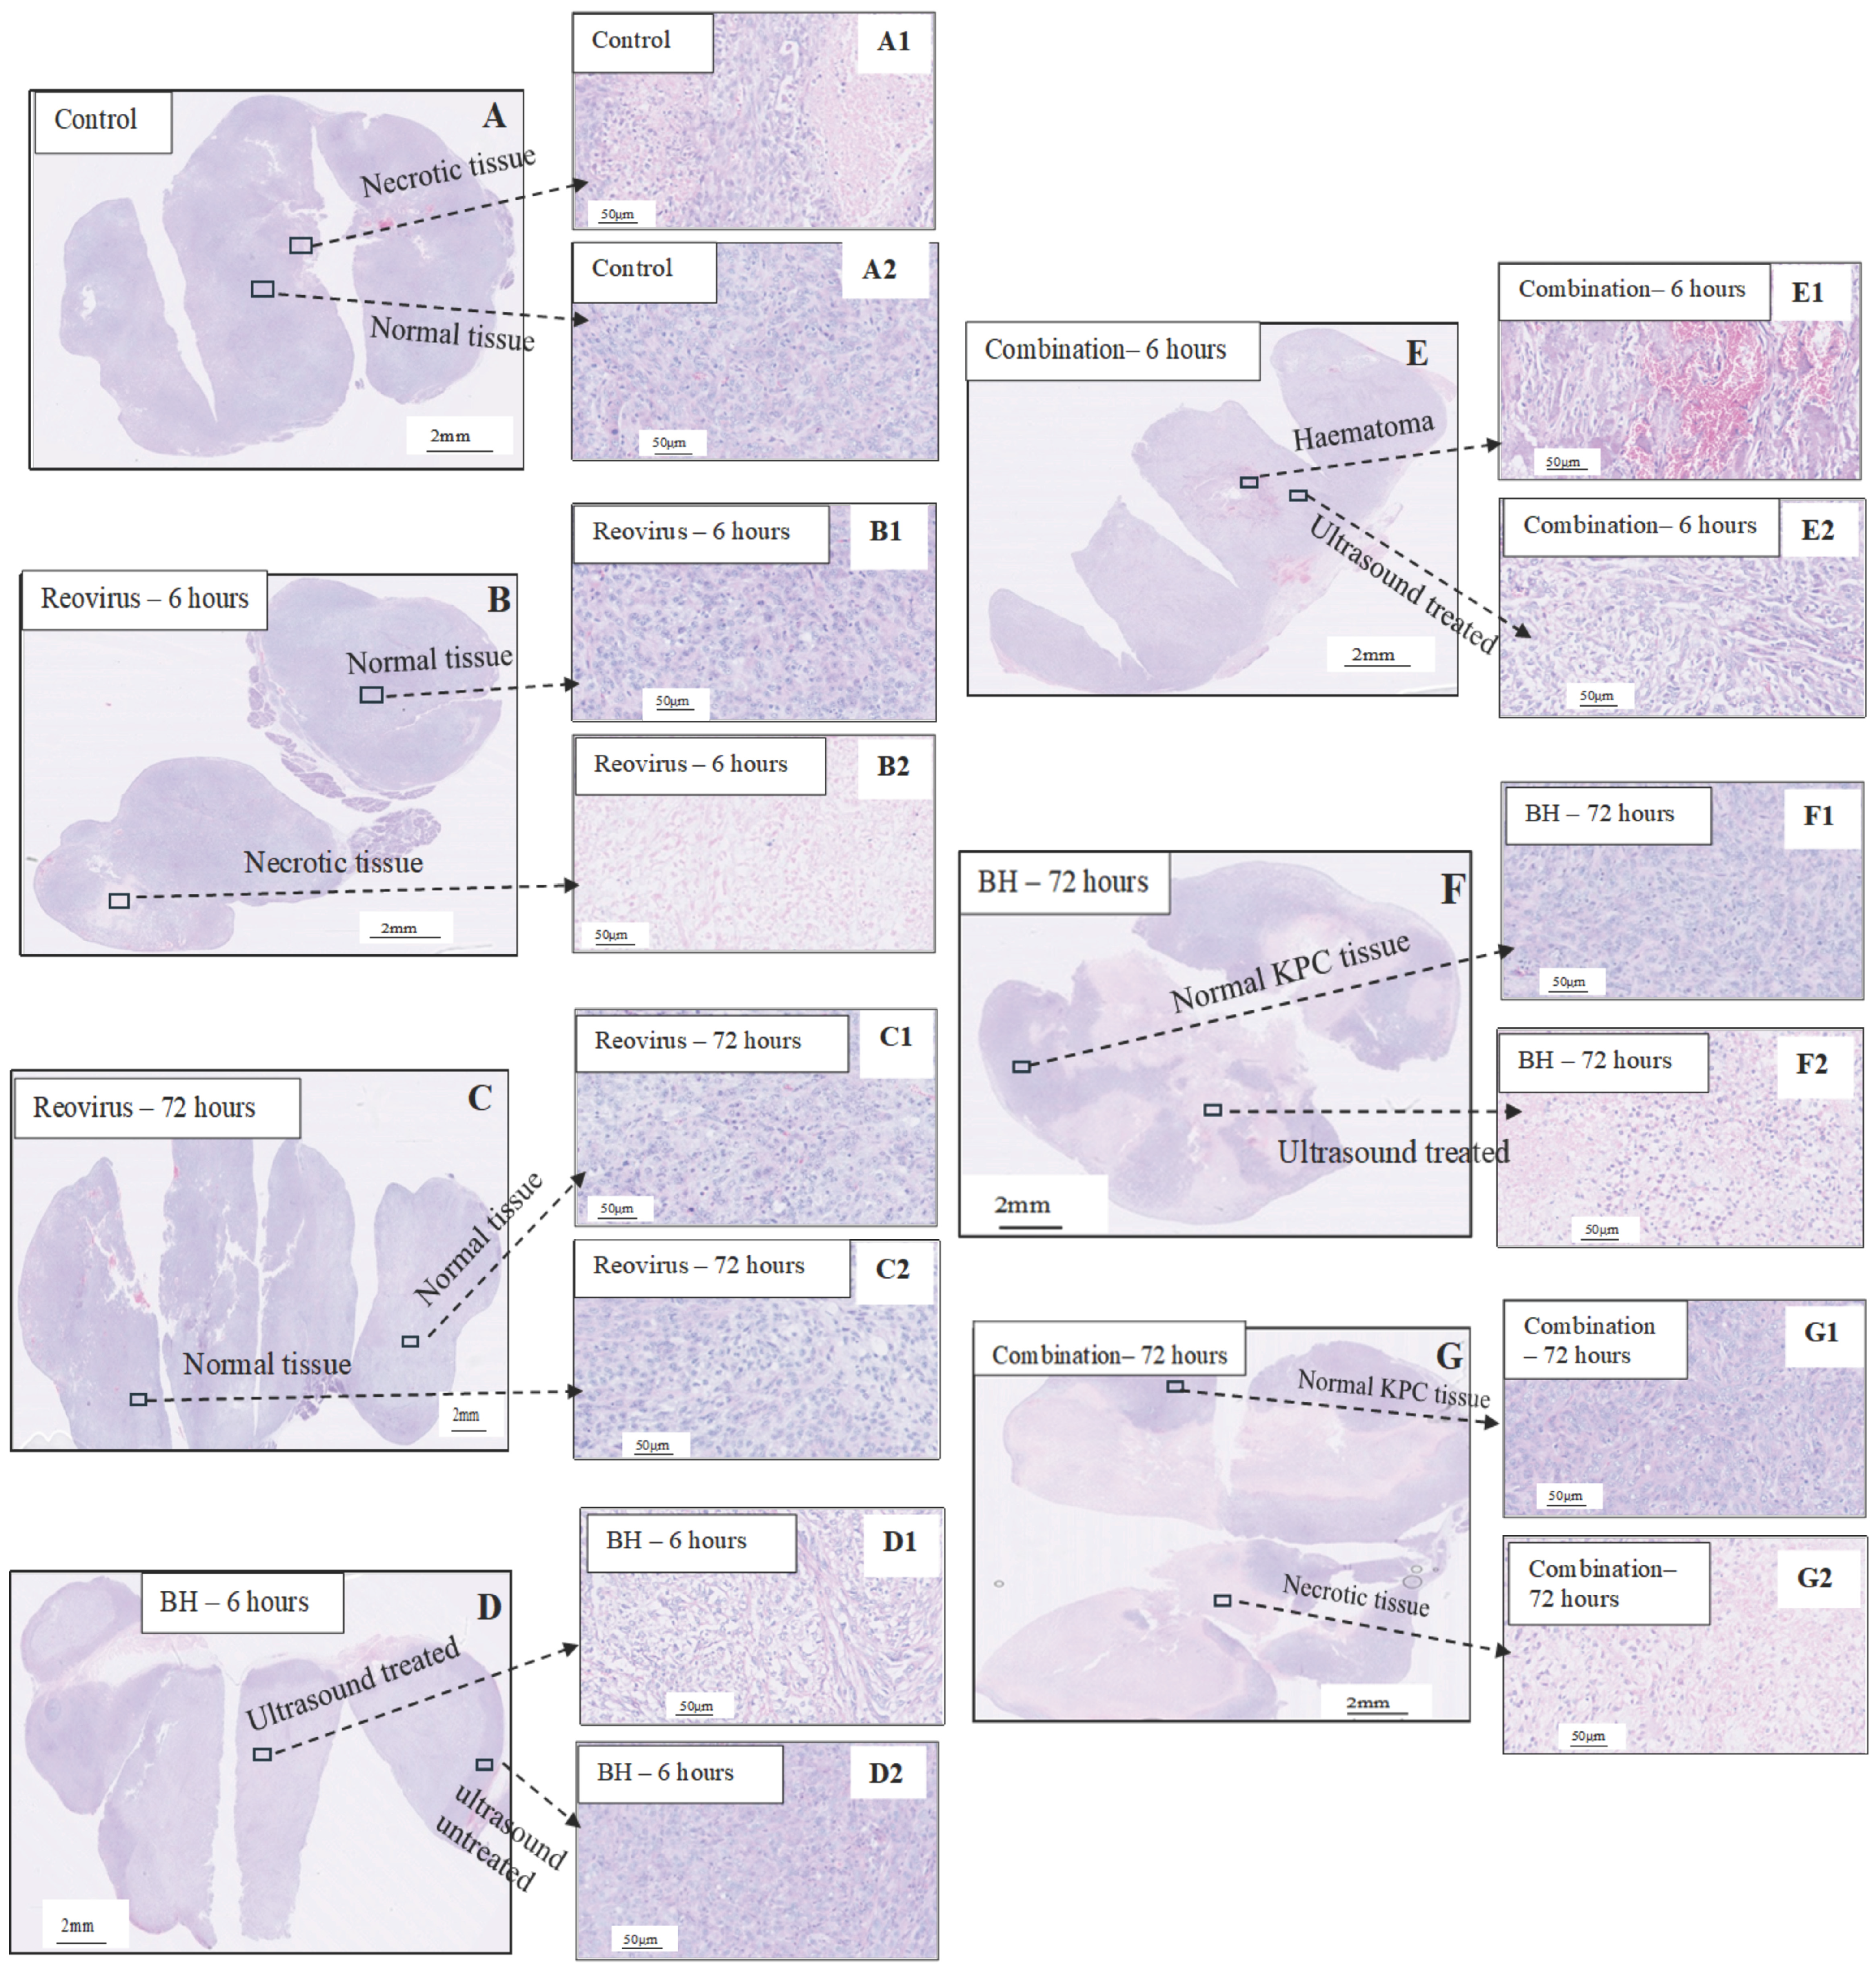
3.2. Histological Analysis Following Treatments
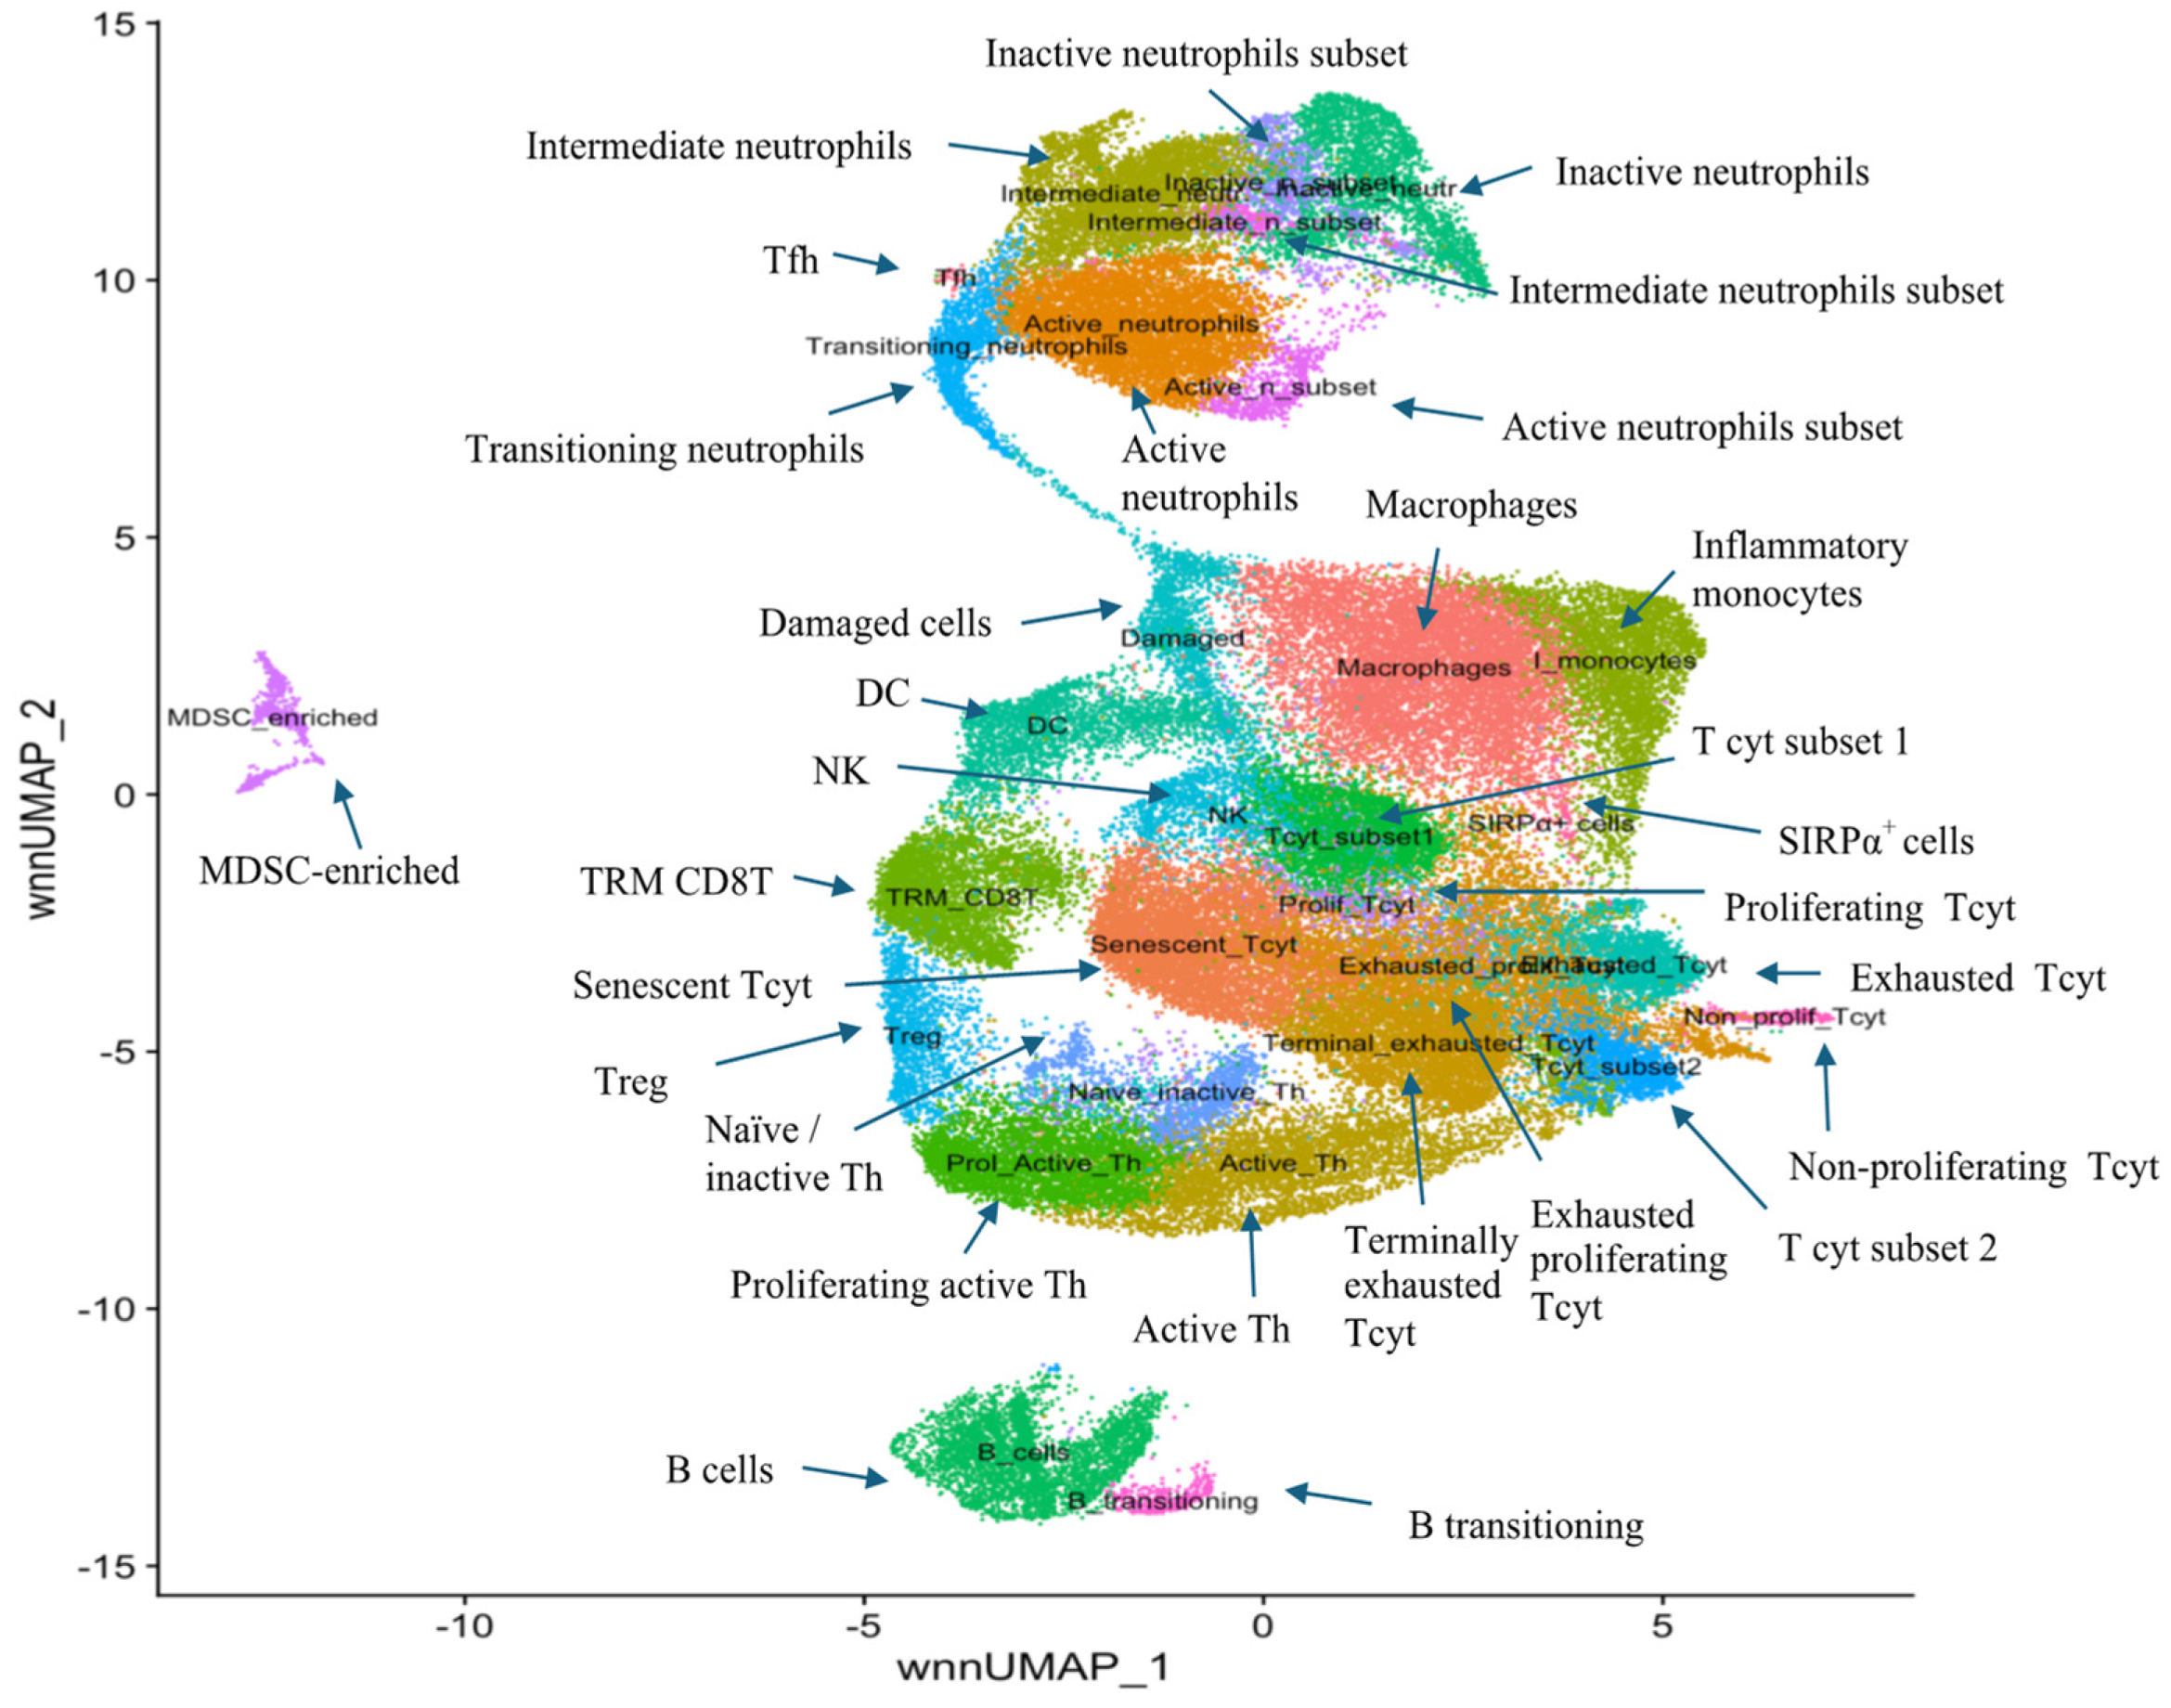
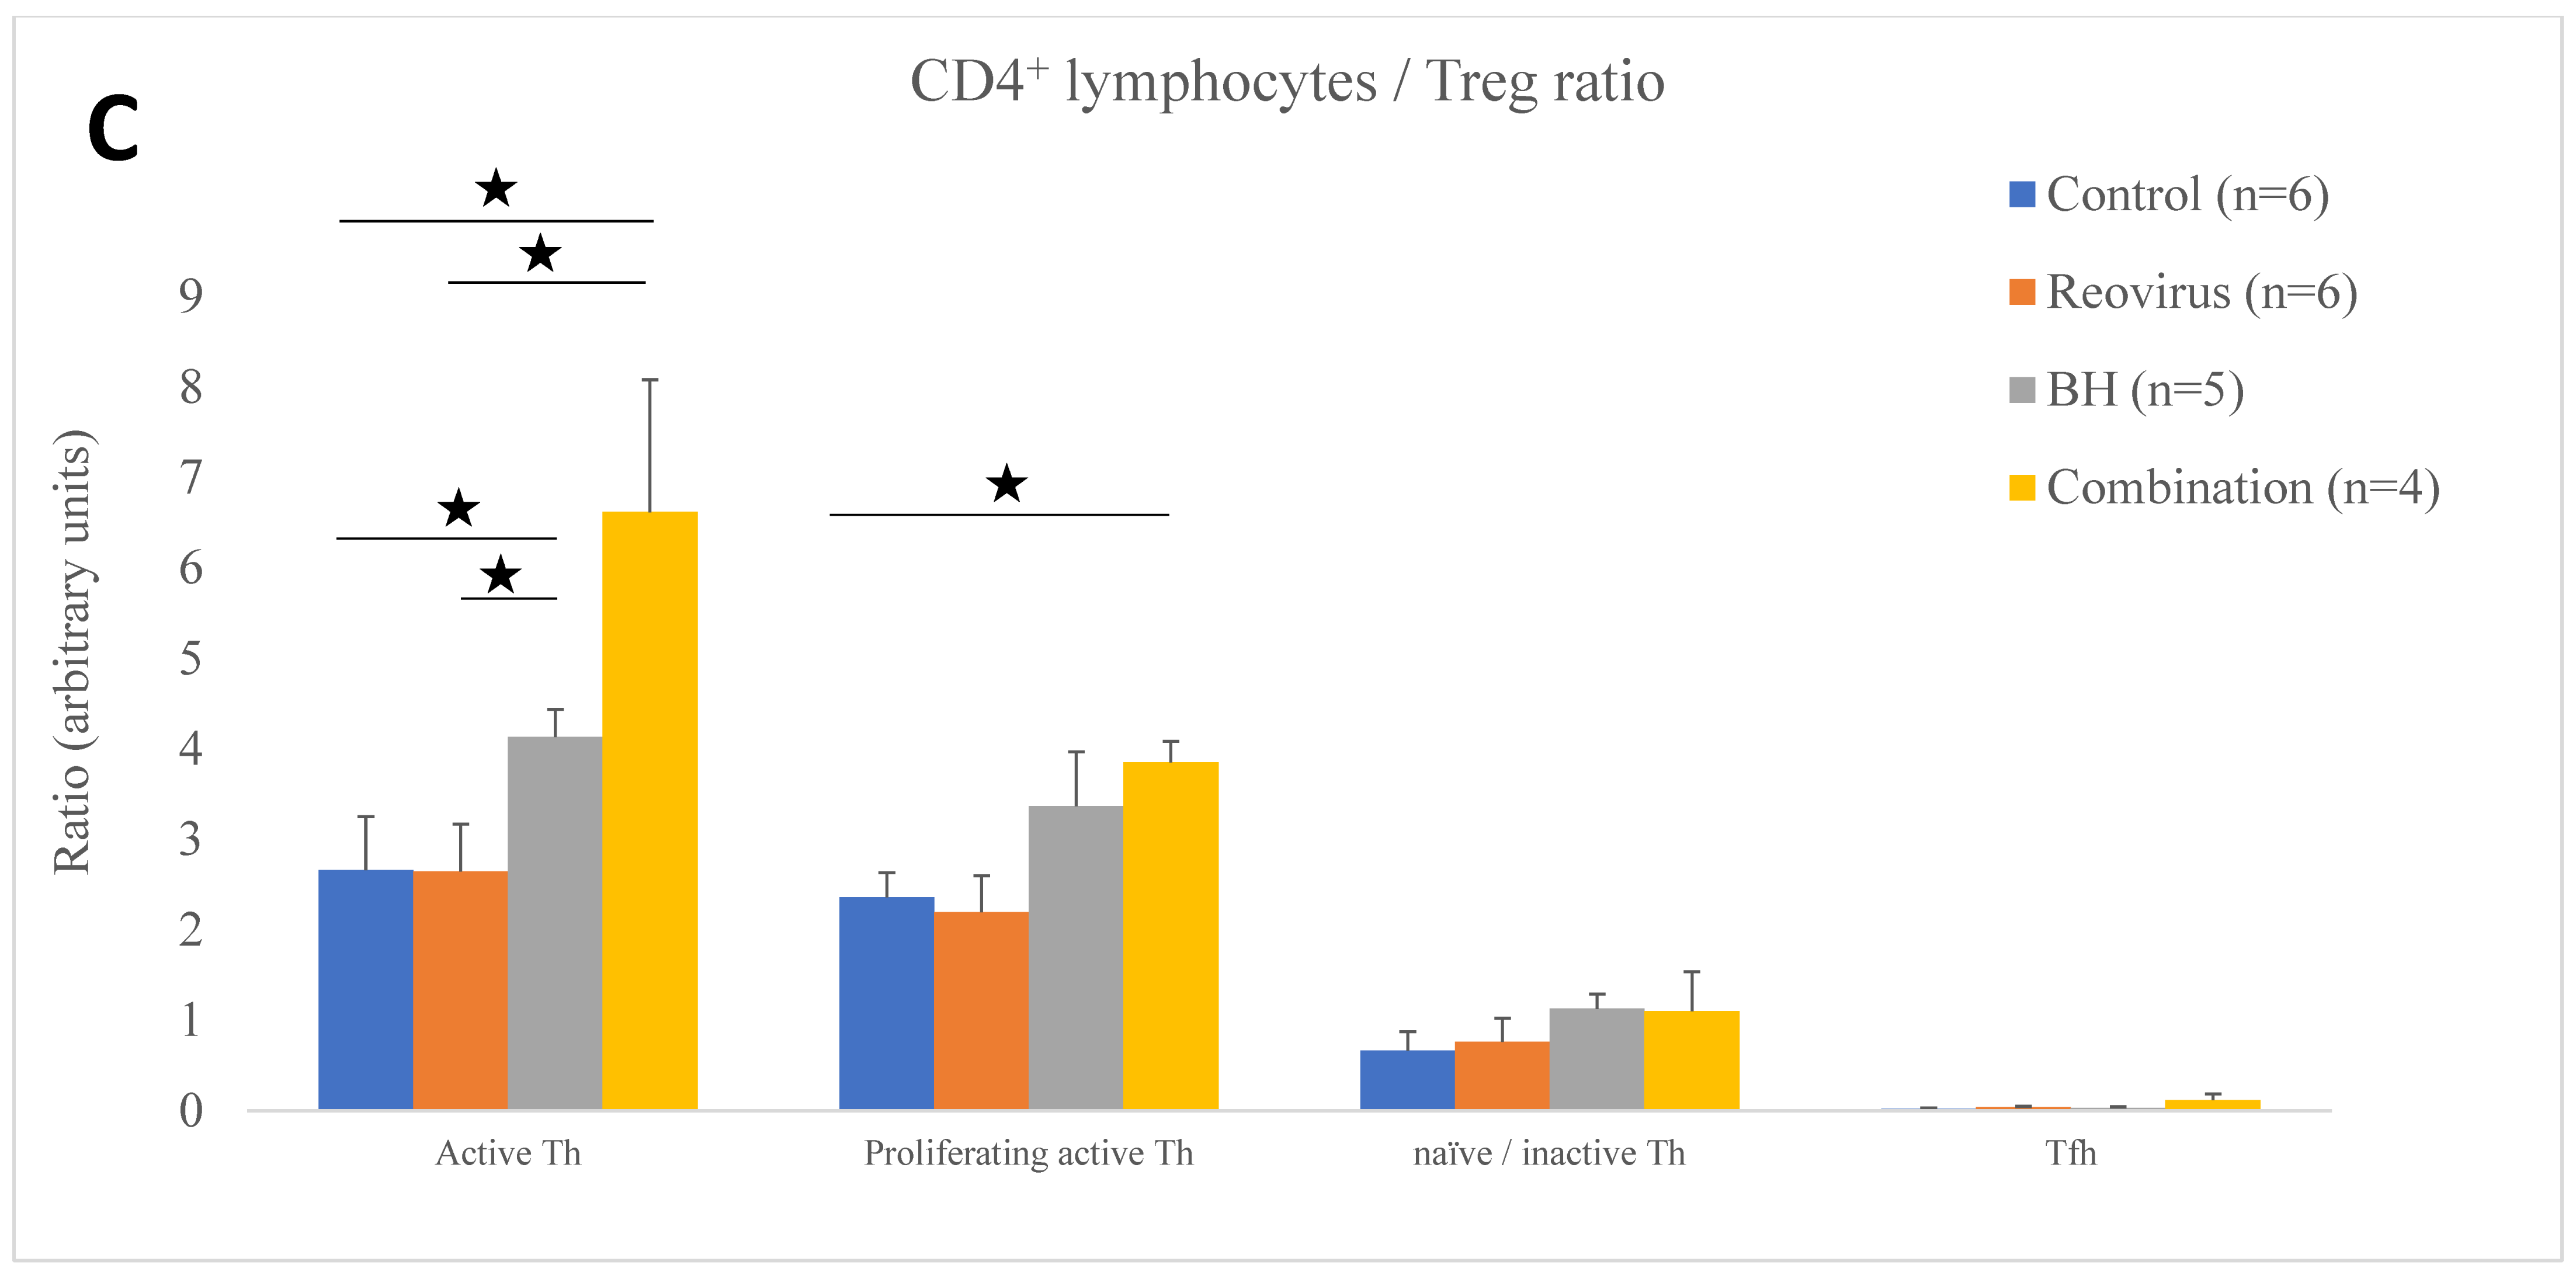
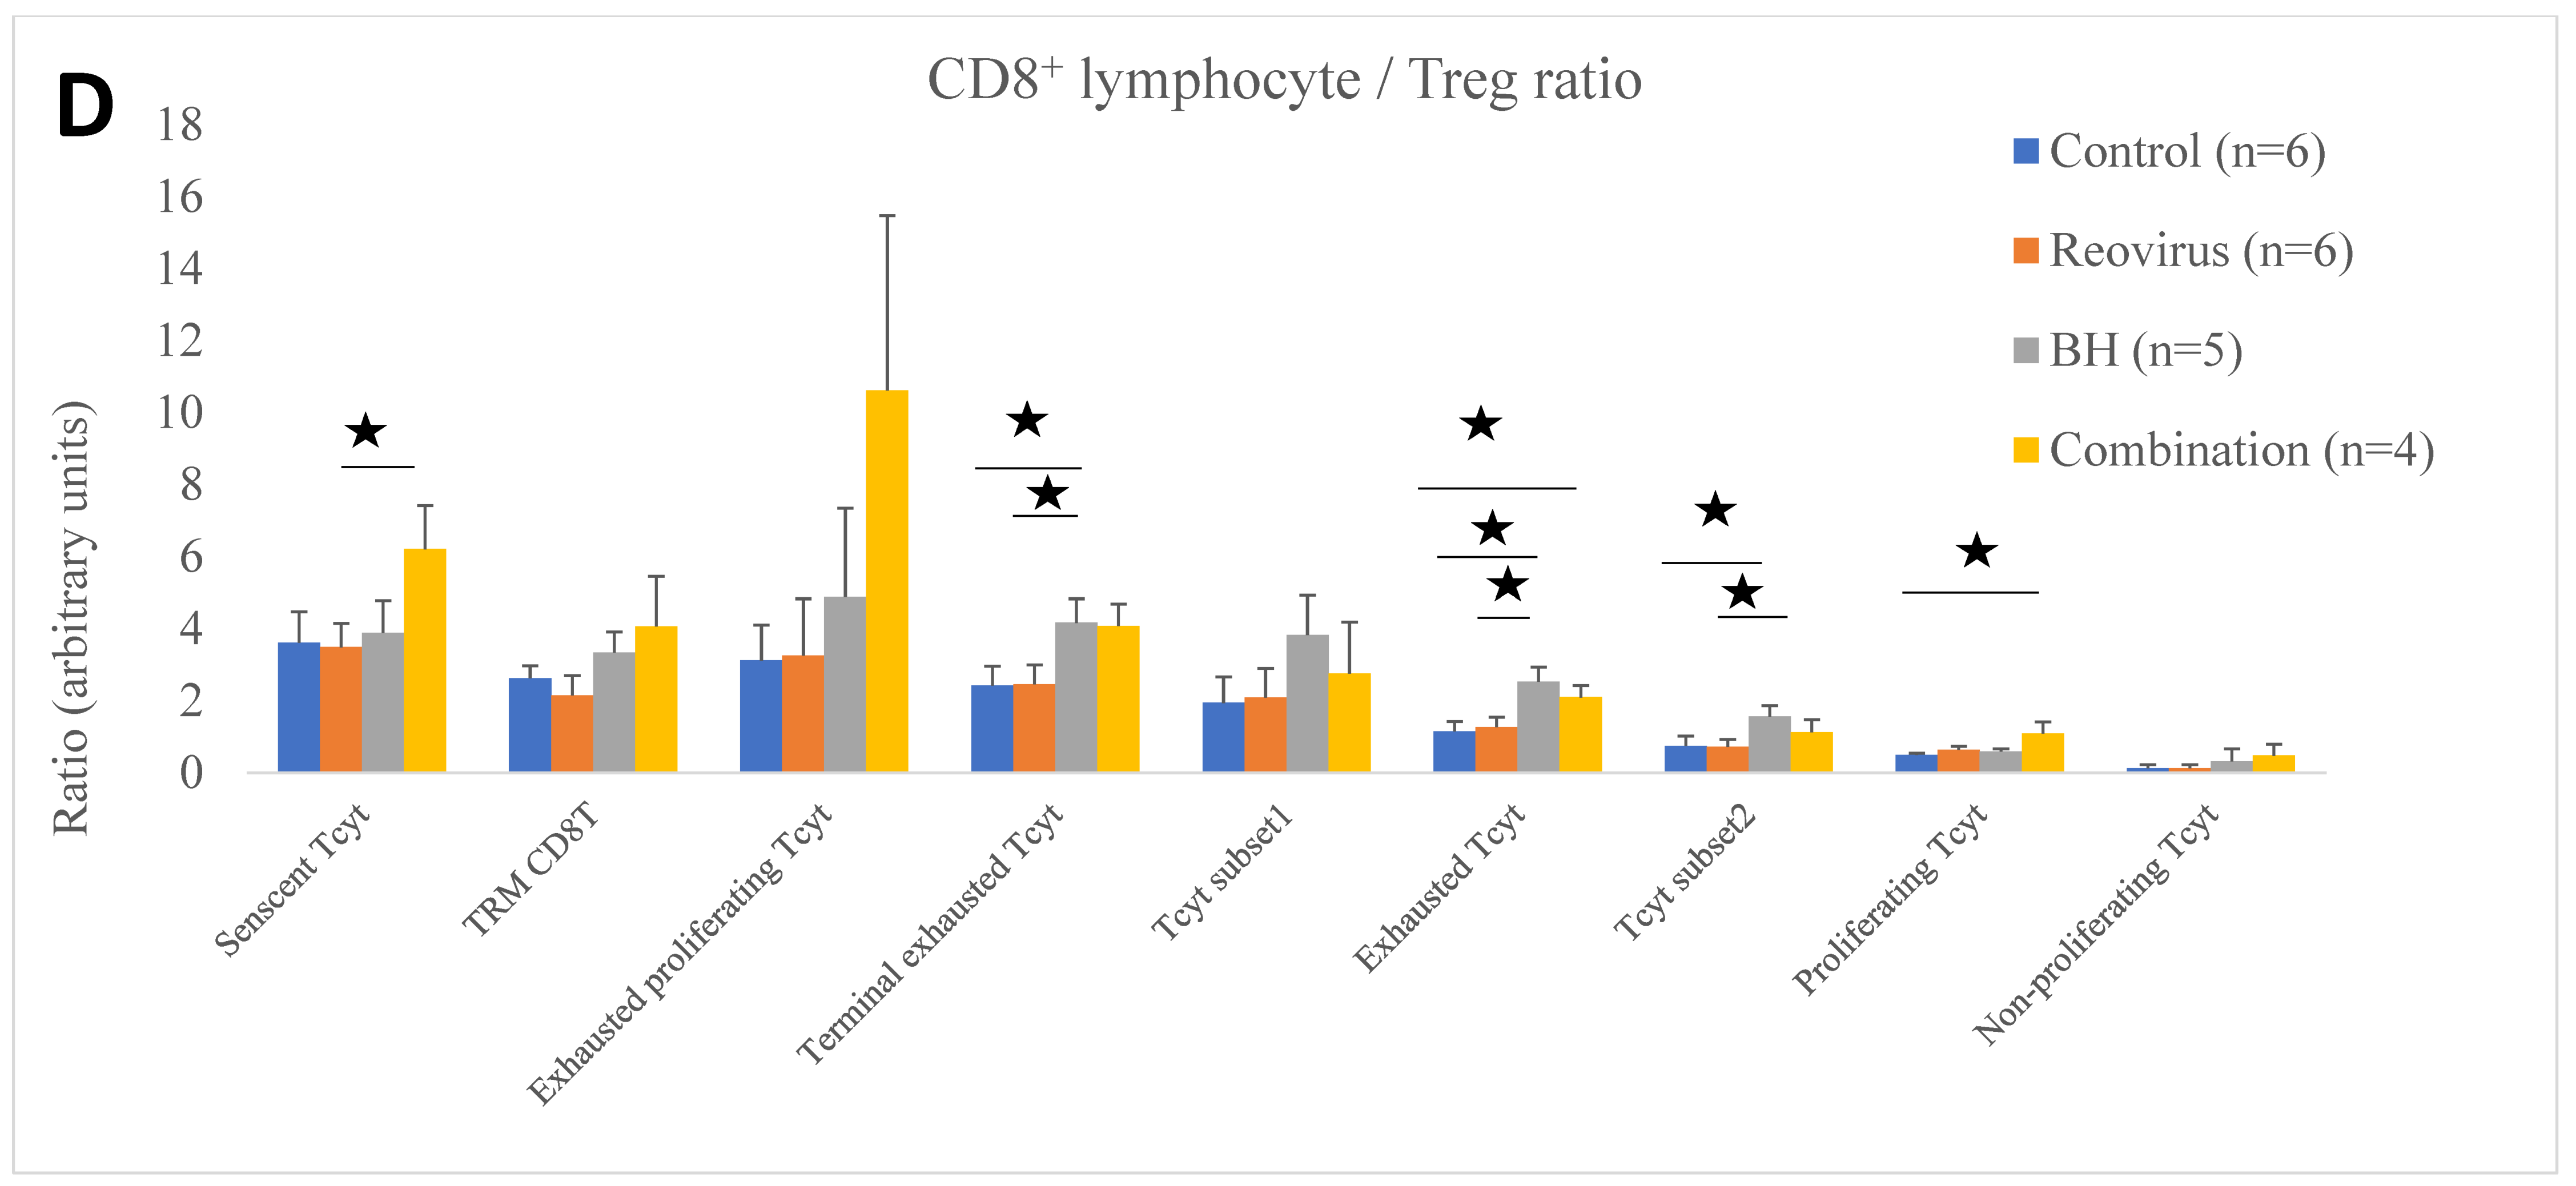
3.3. Characterisation of Immune Subset Populations
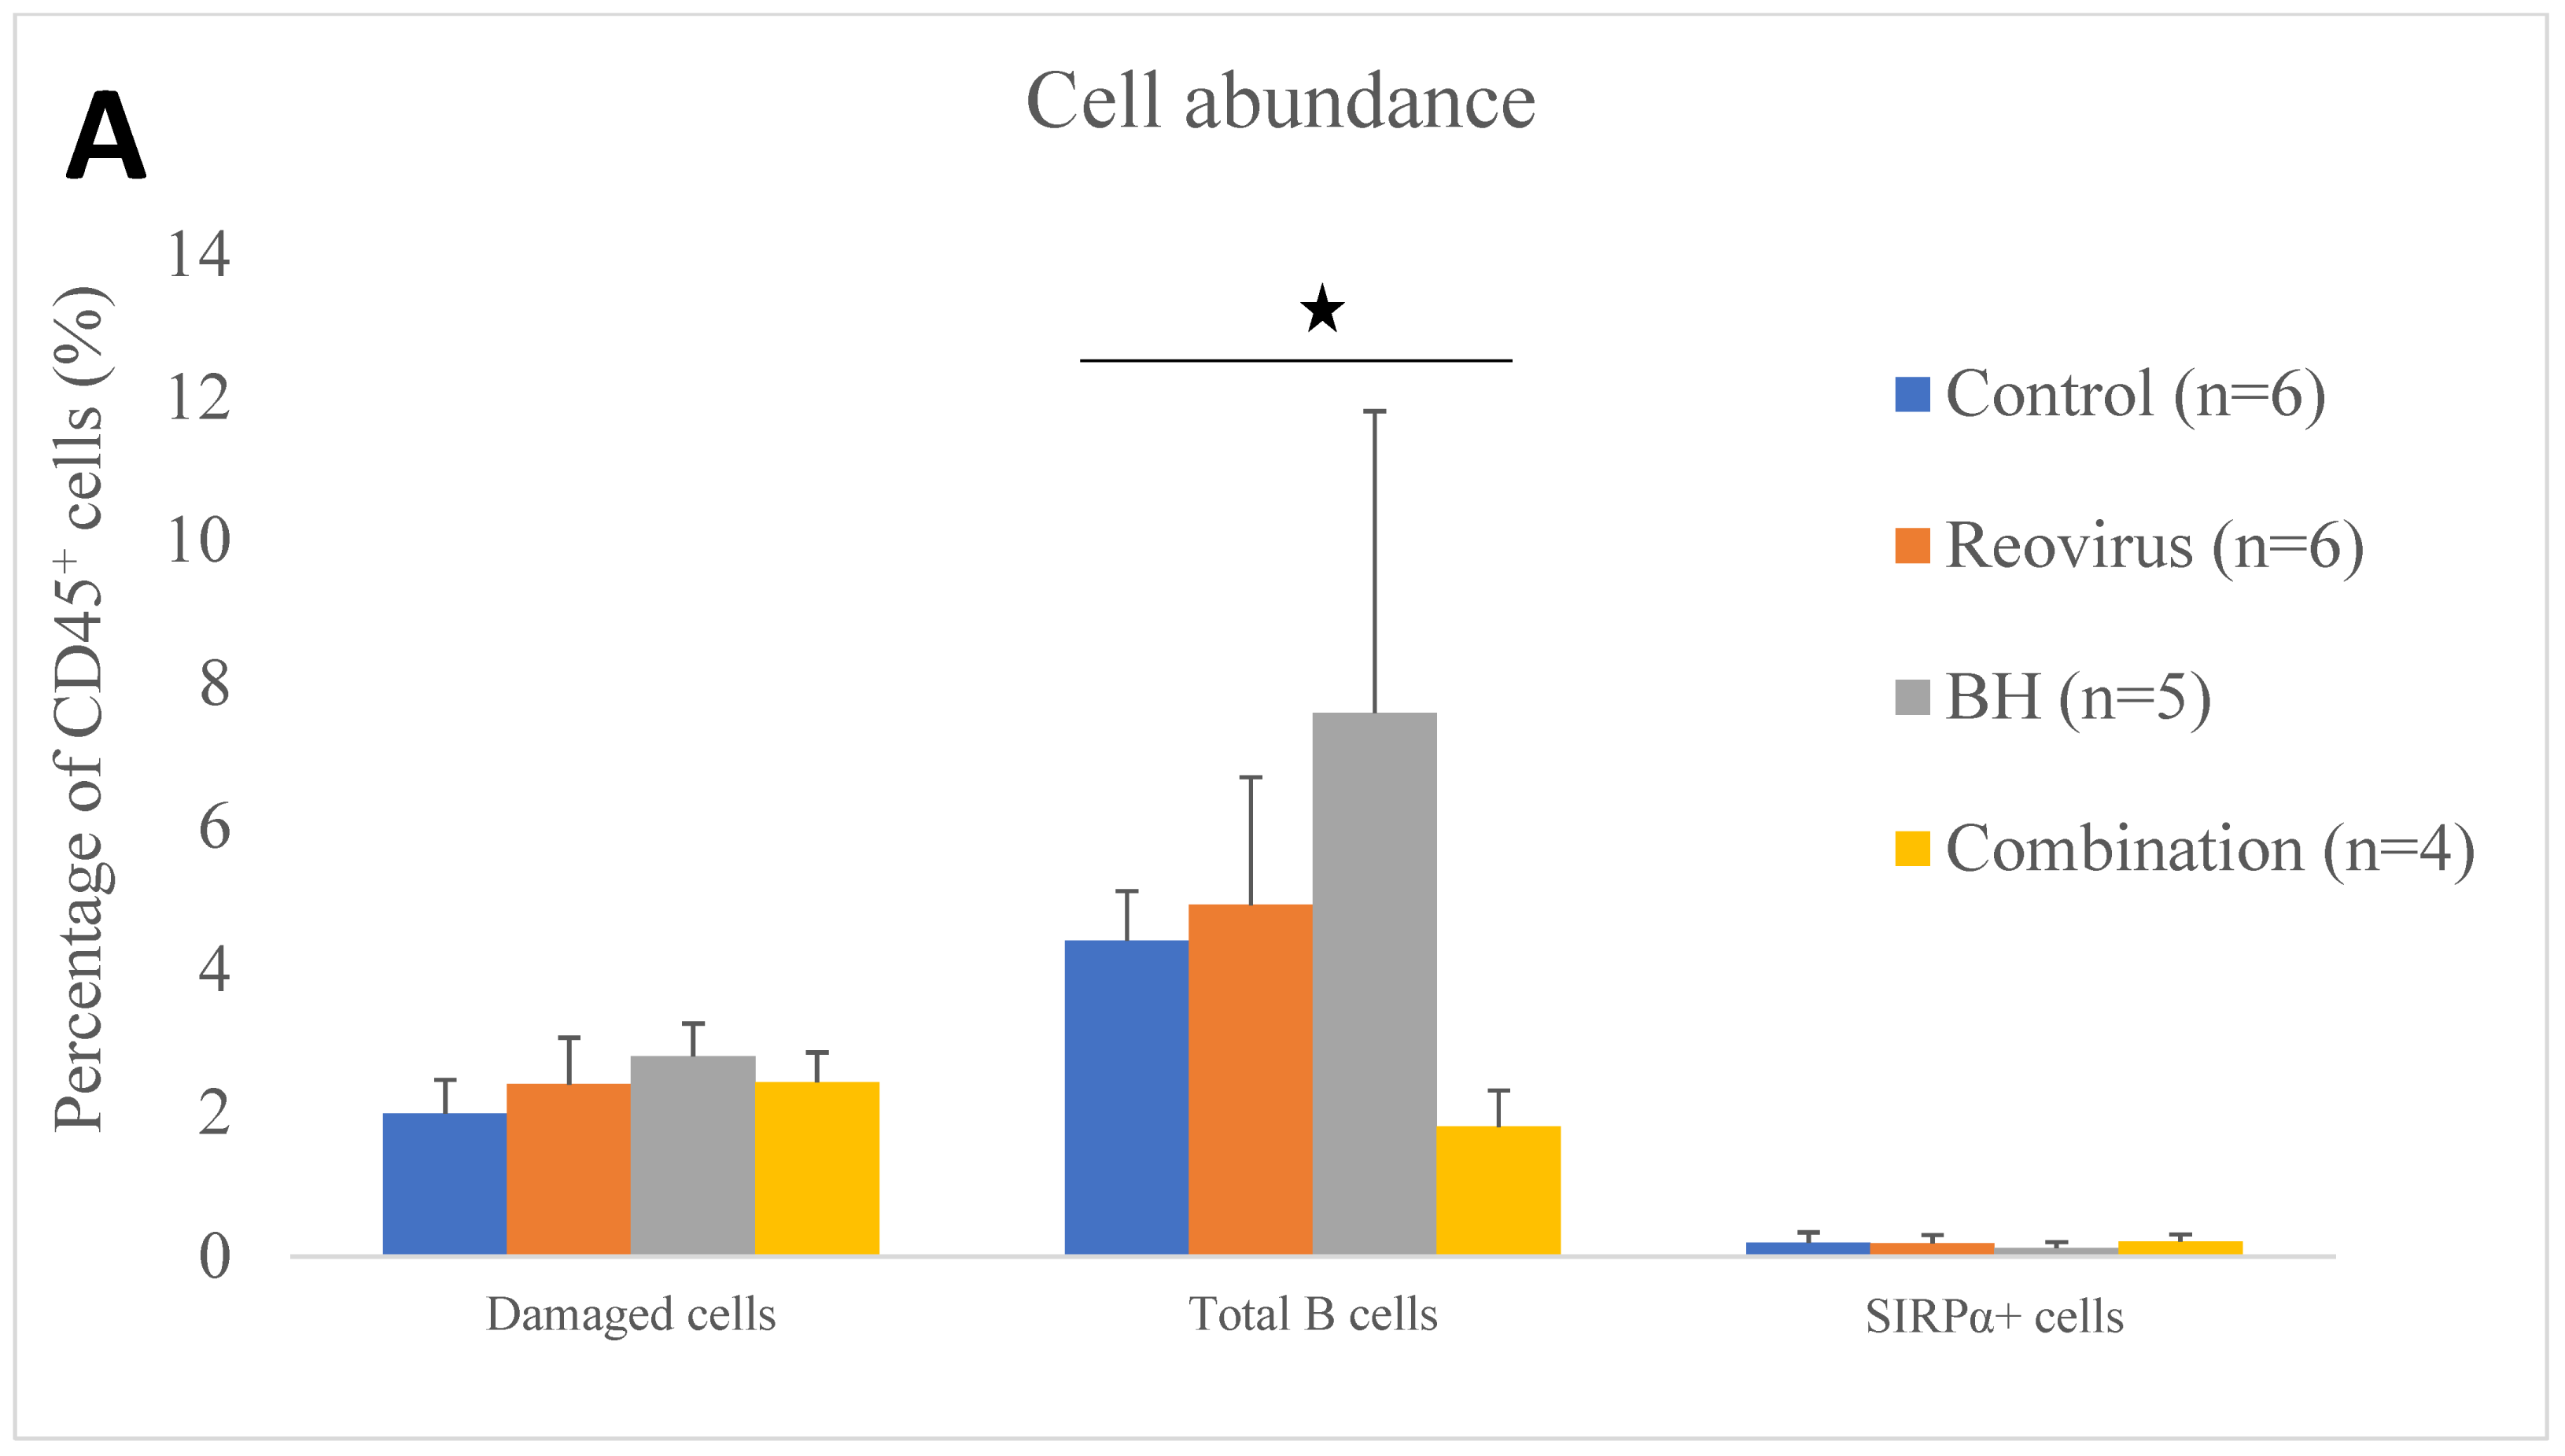
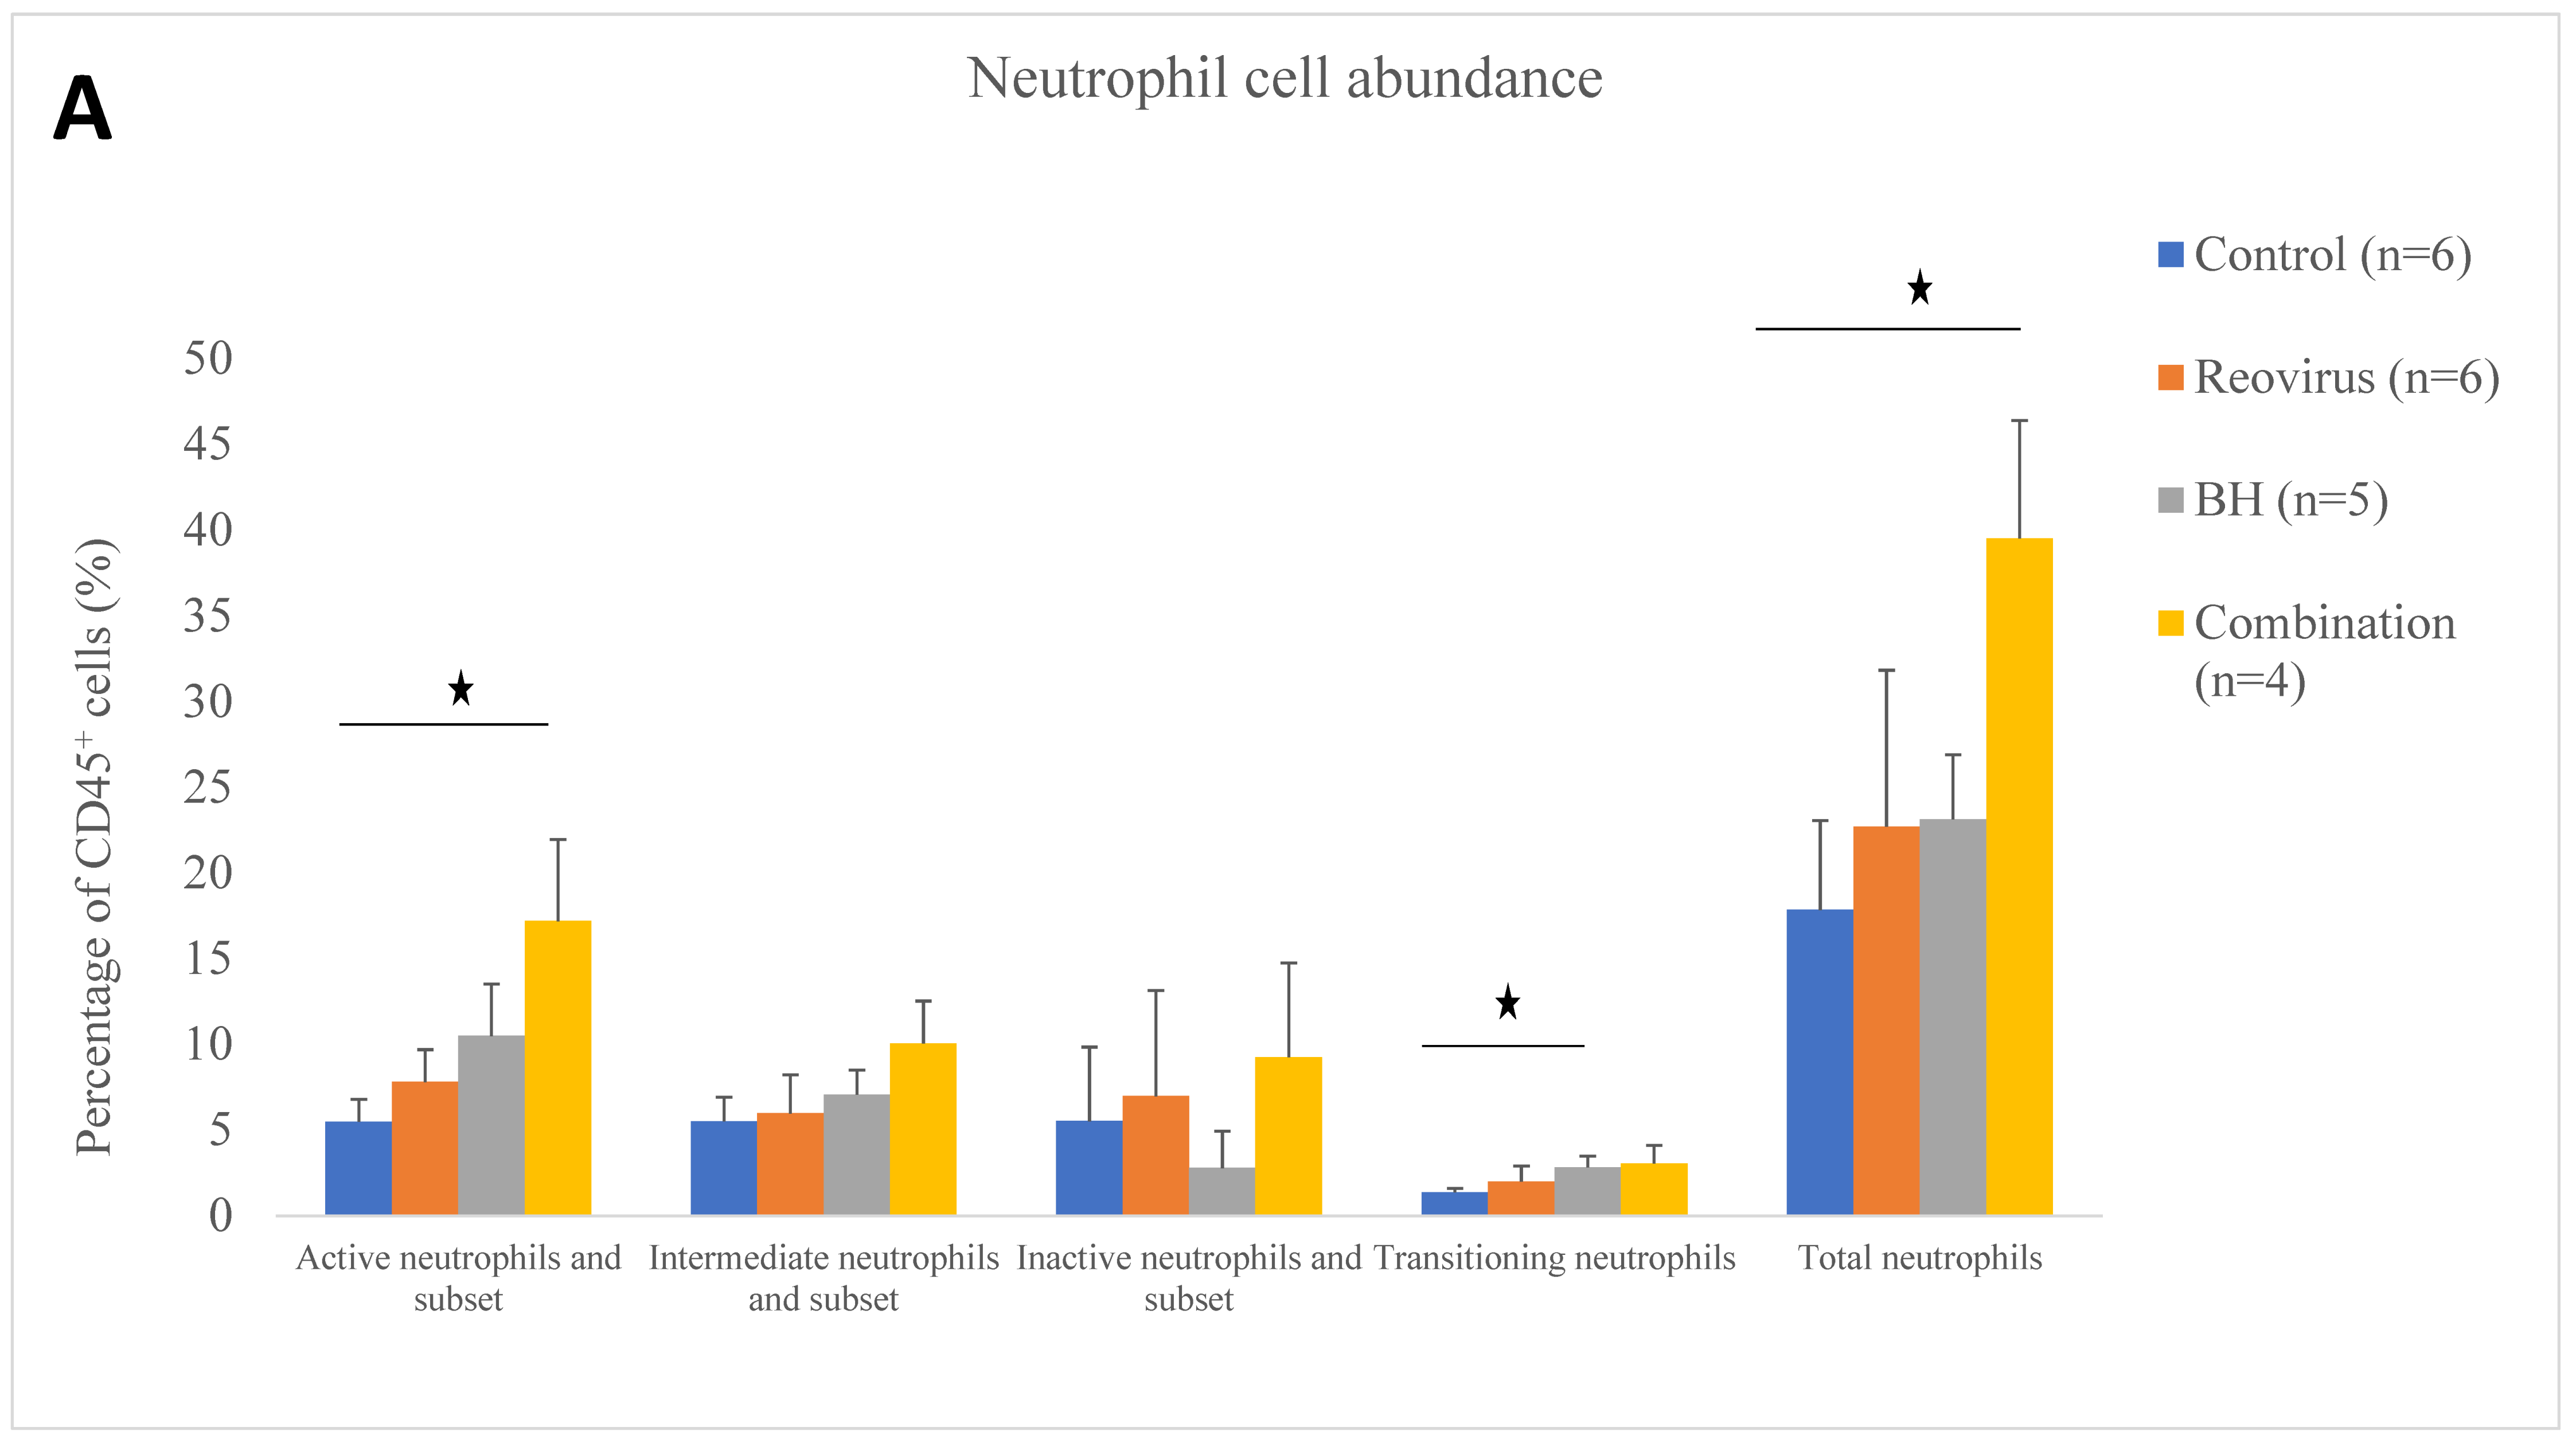
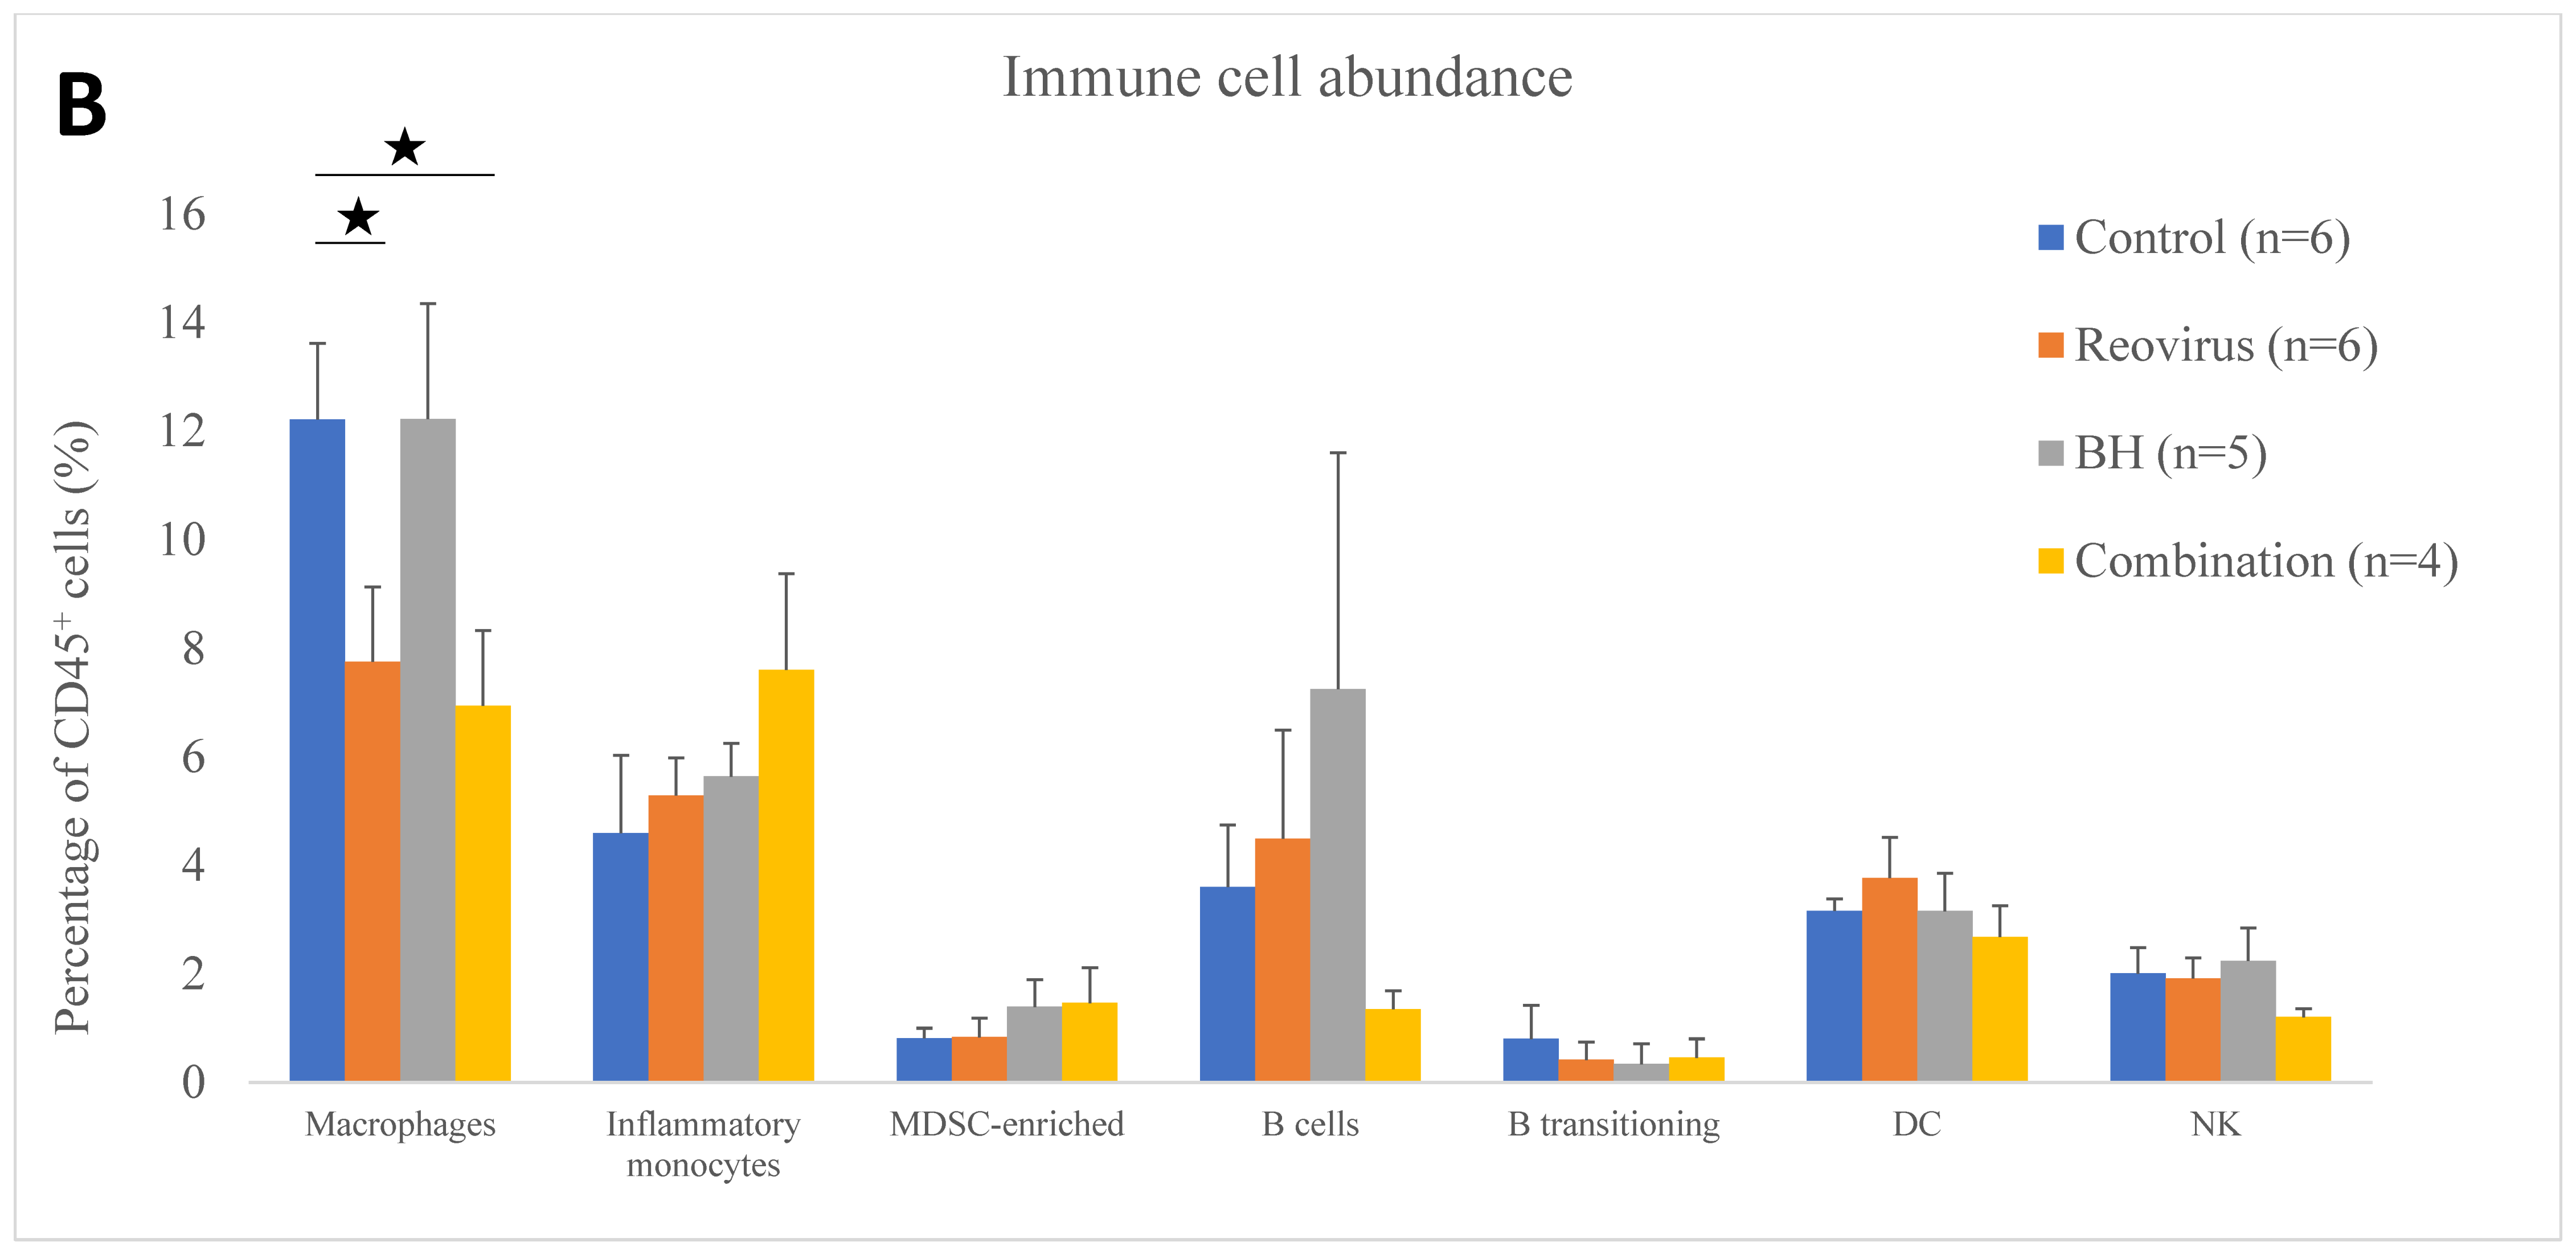
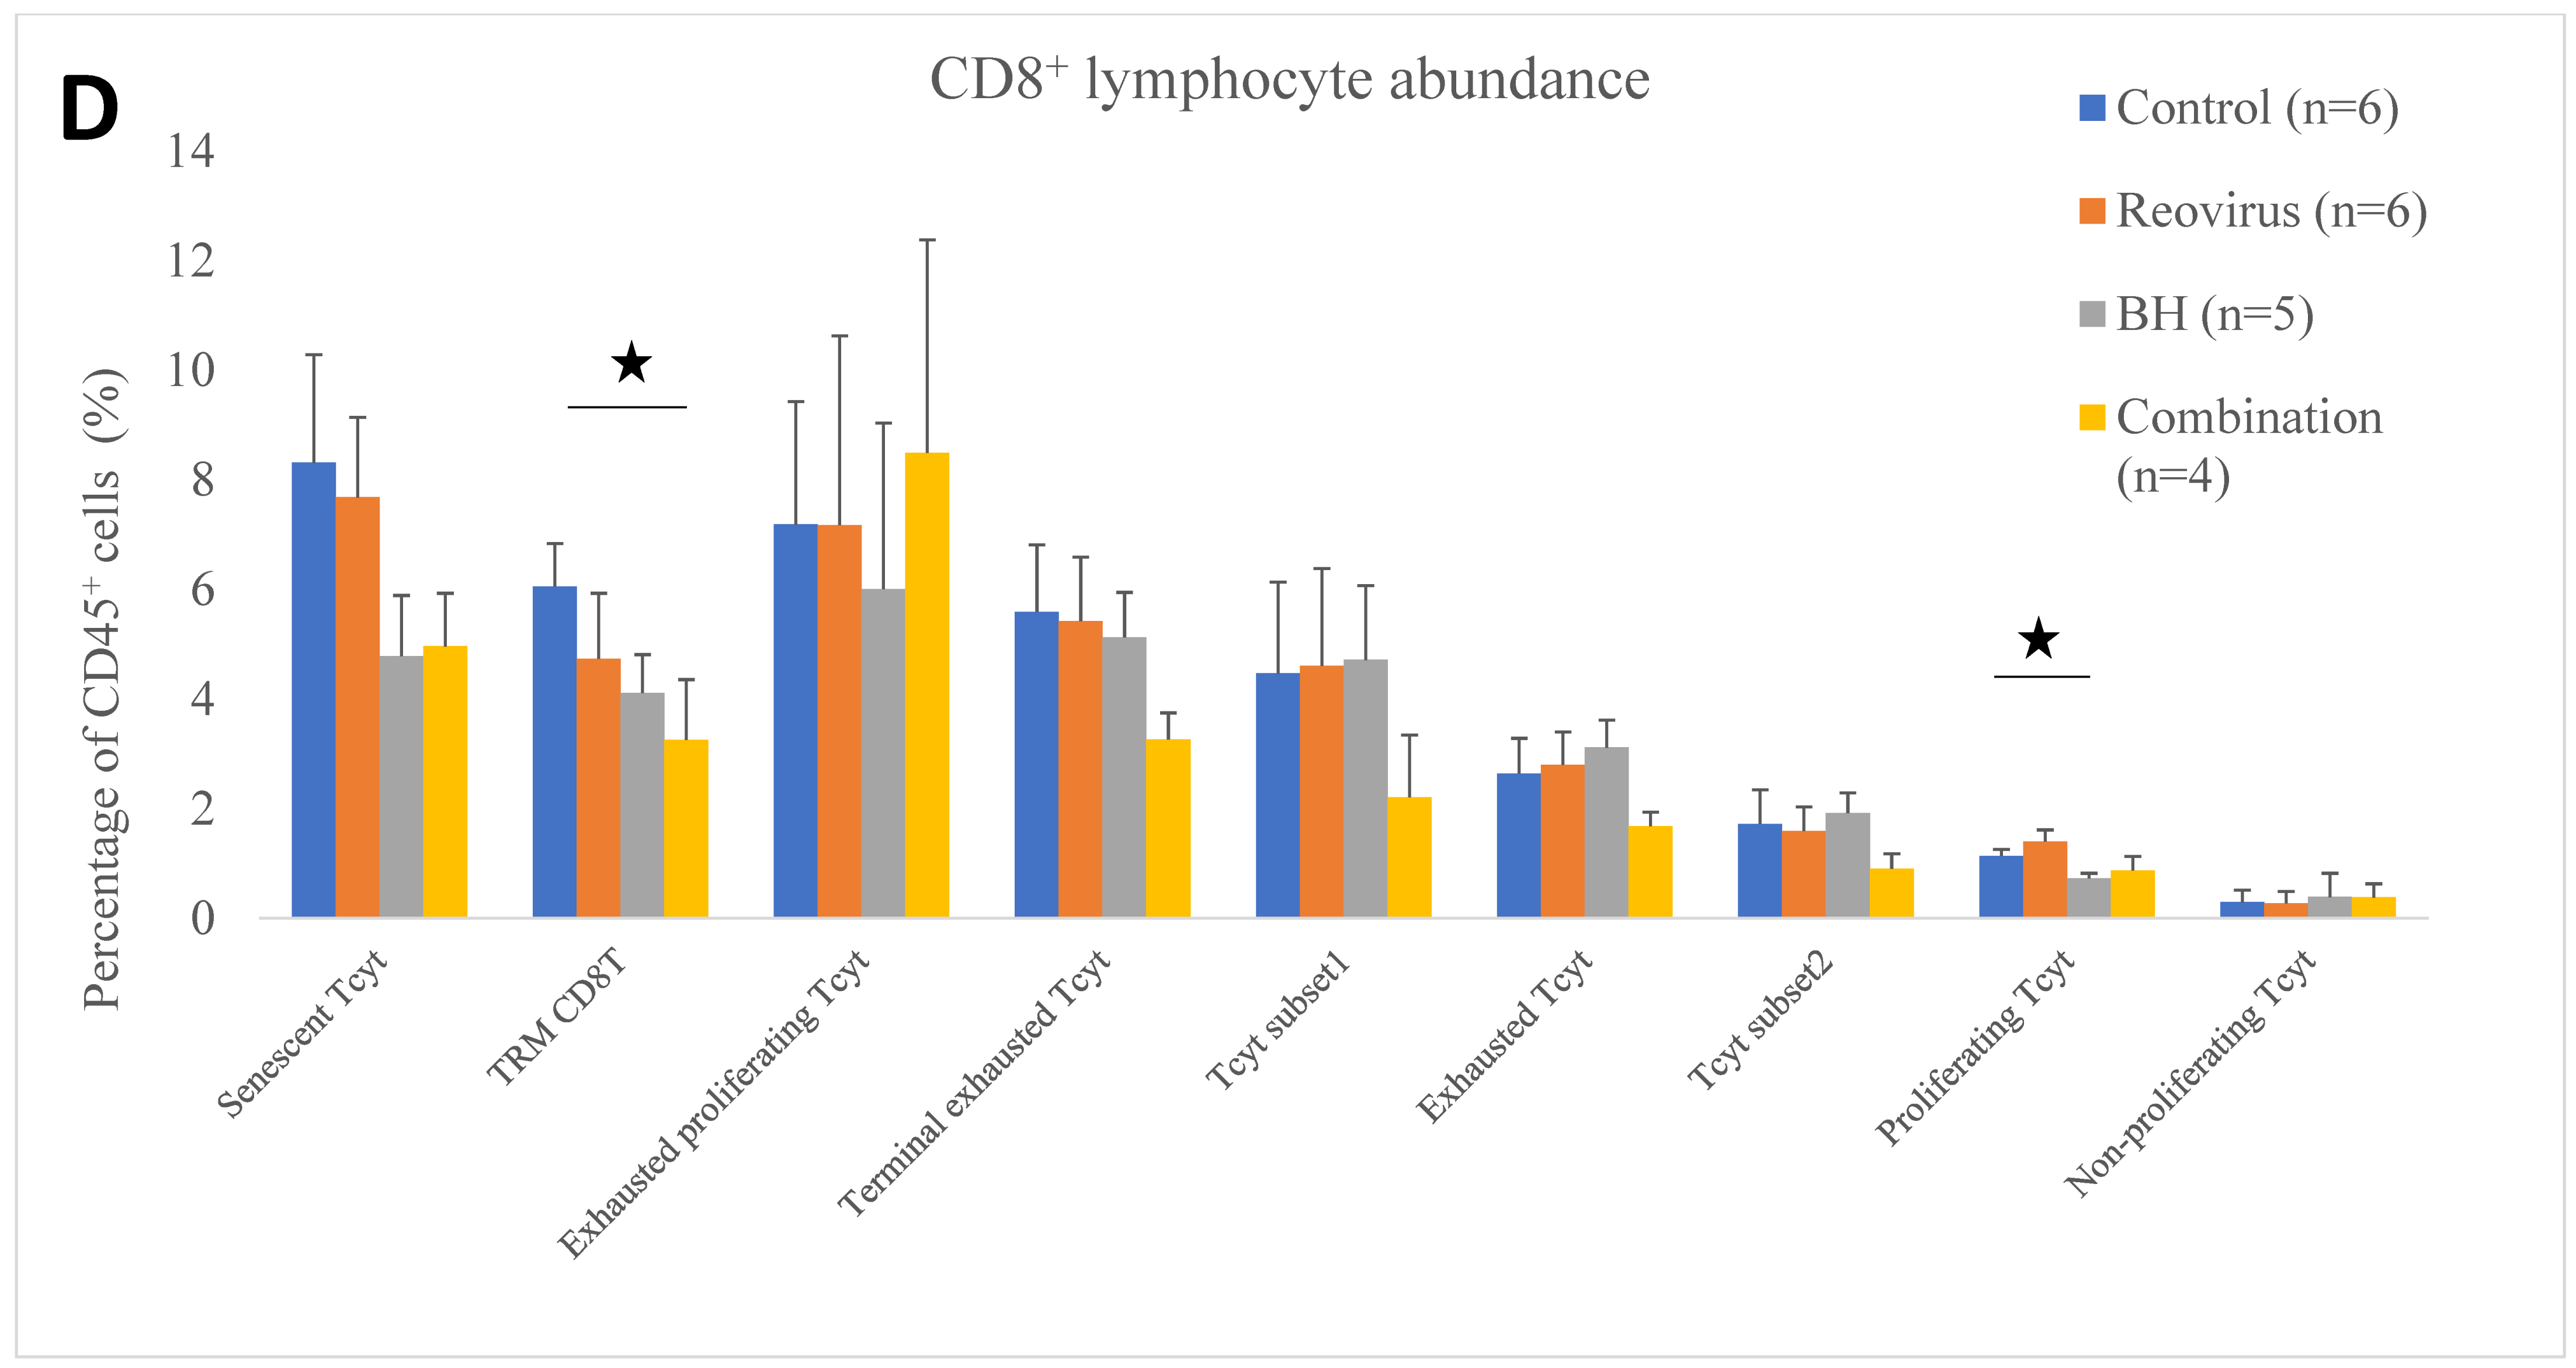
3.4. Relative Immune Cell Abundance Following Treatment
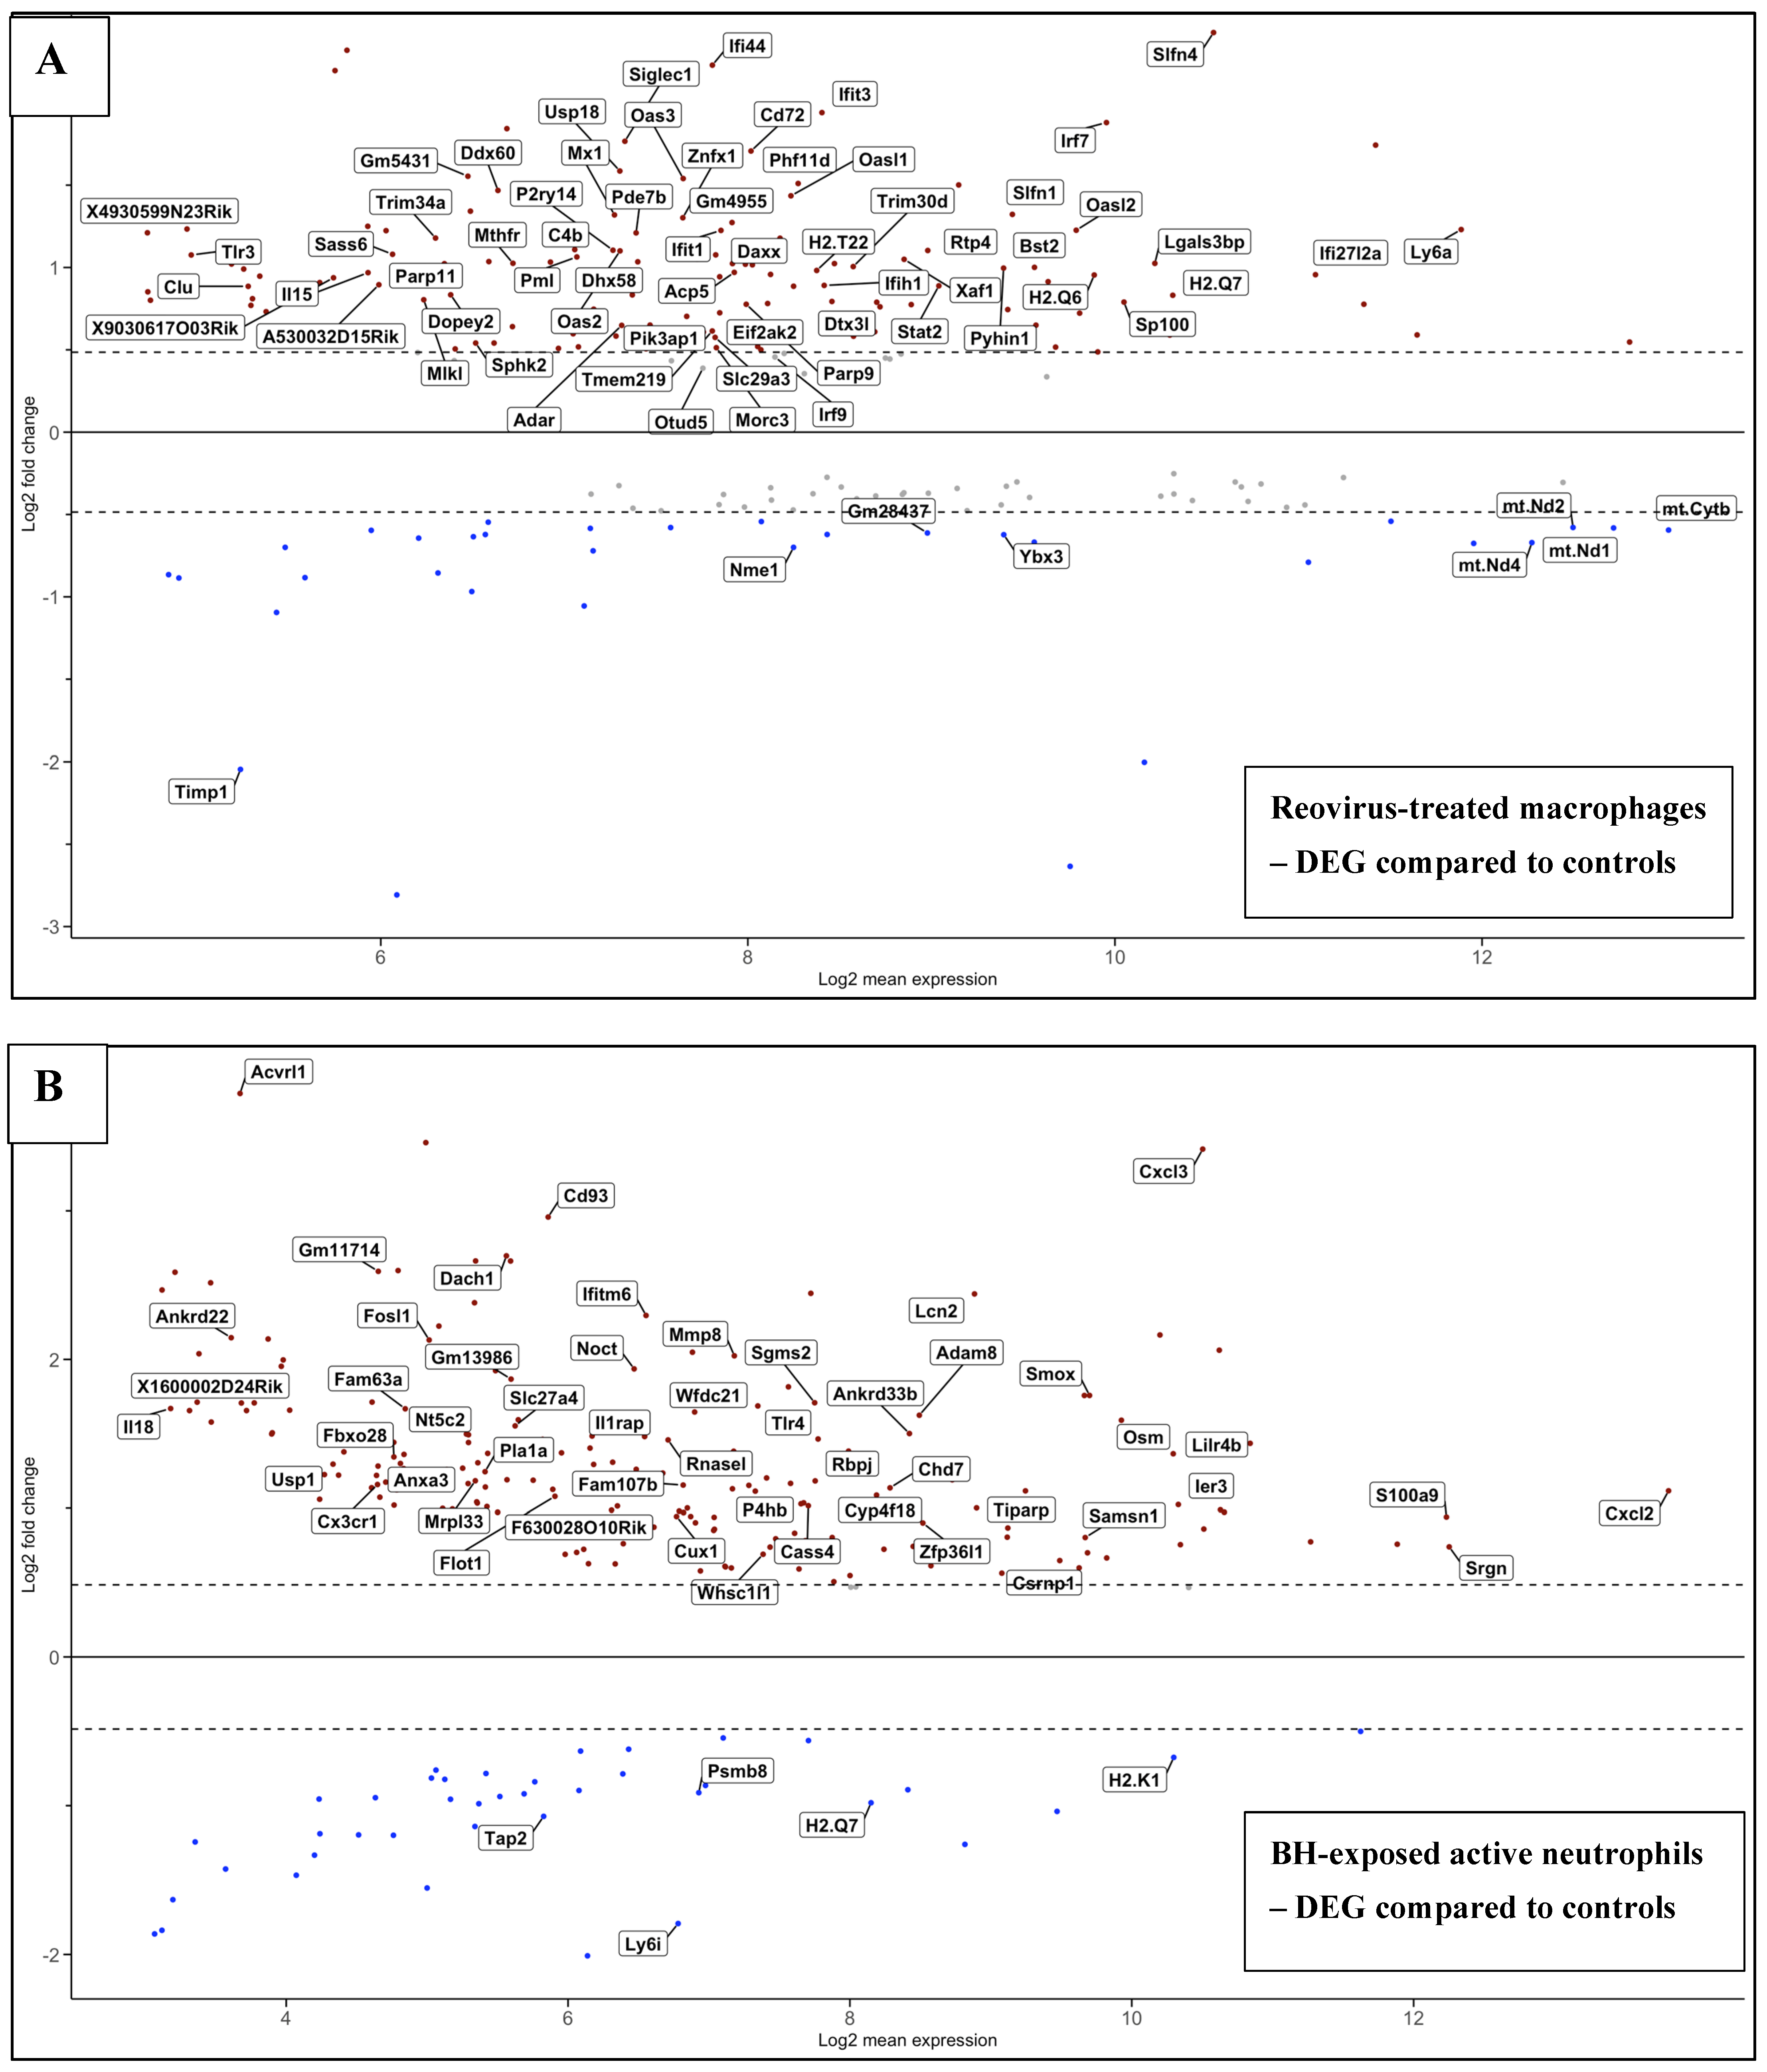
3.5. Effects of Treatments on Differential Gene Expression in All Immune Cell Clusters
3.6. Functional Enrichment Analysis in KPC Tumours
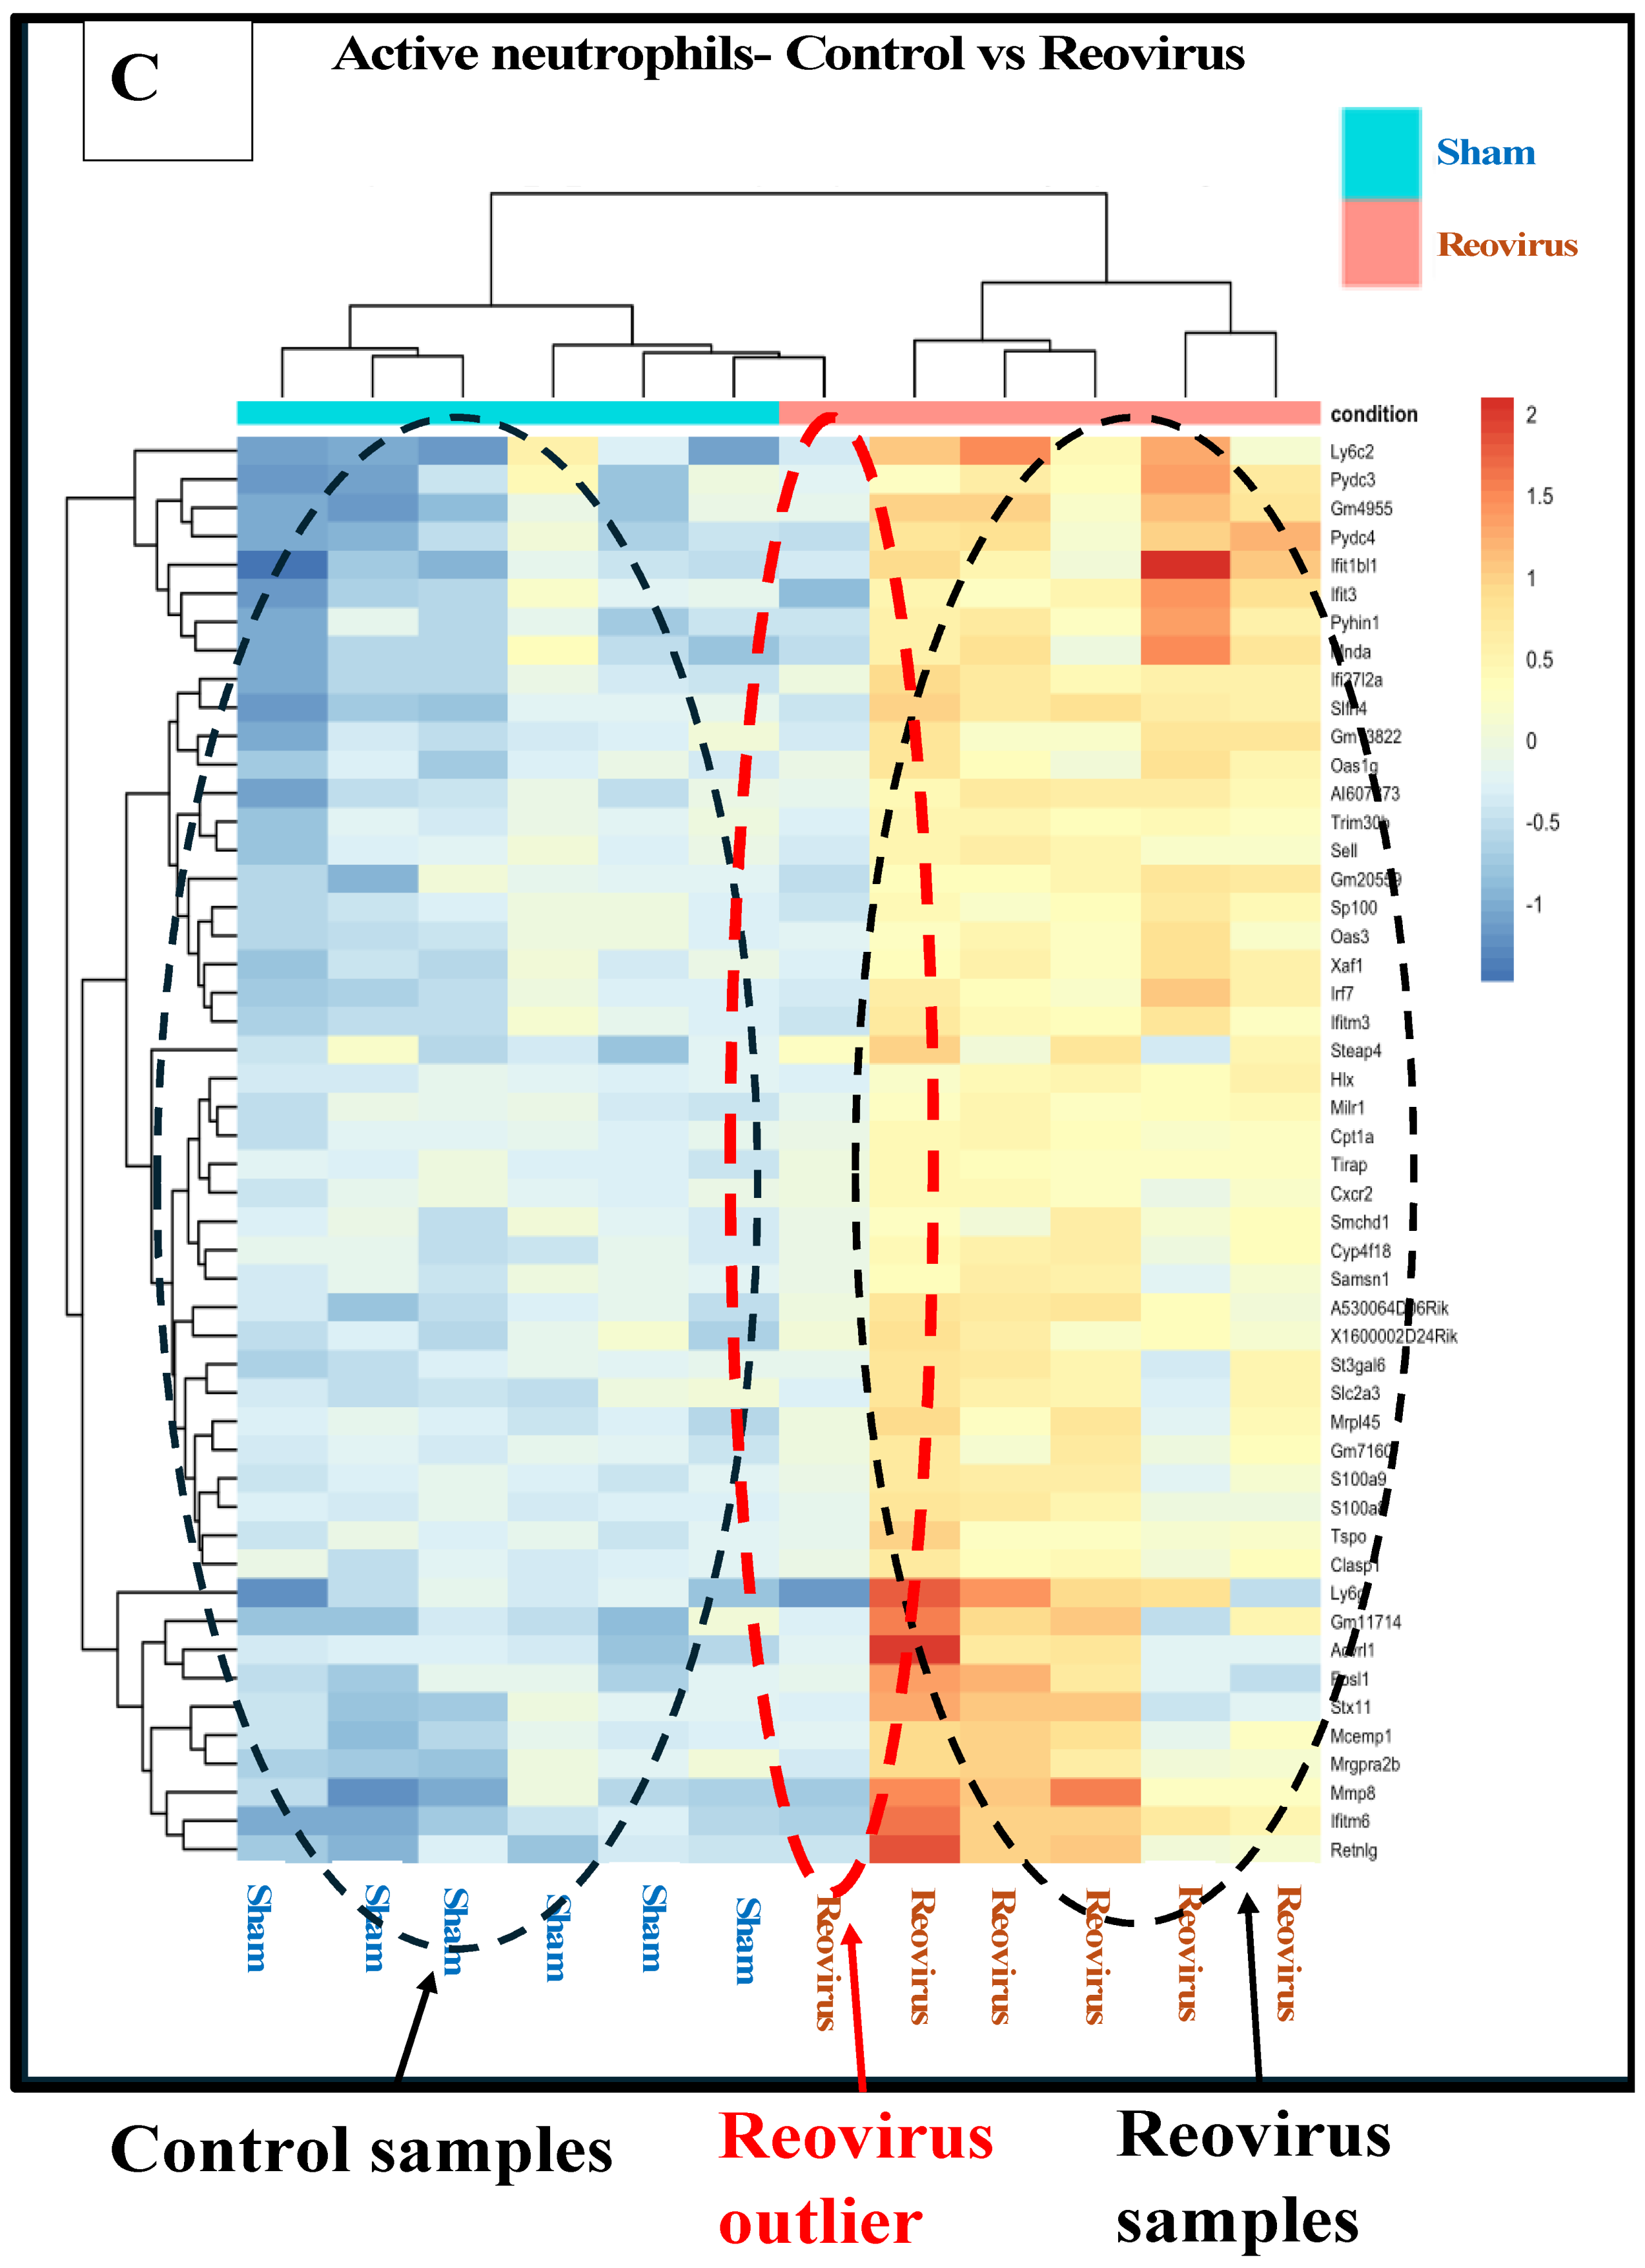
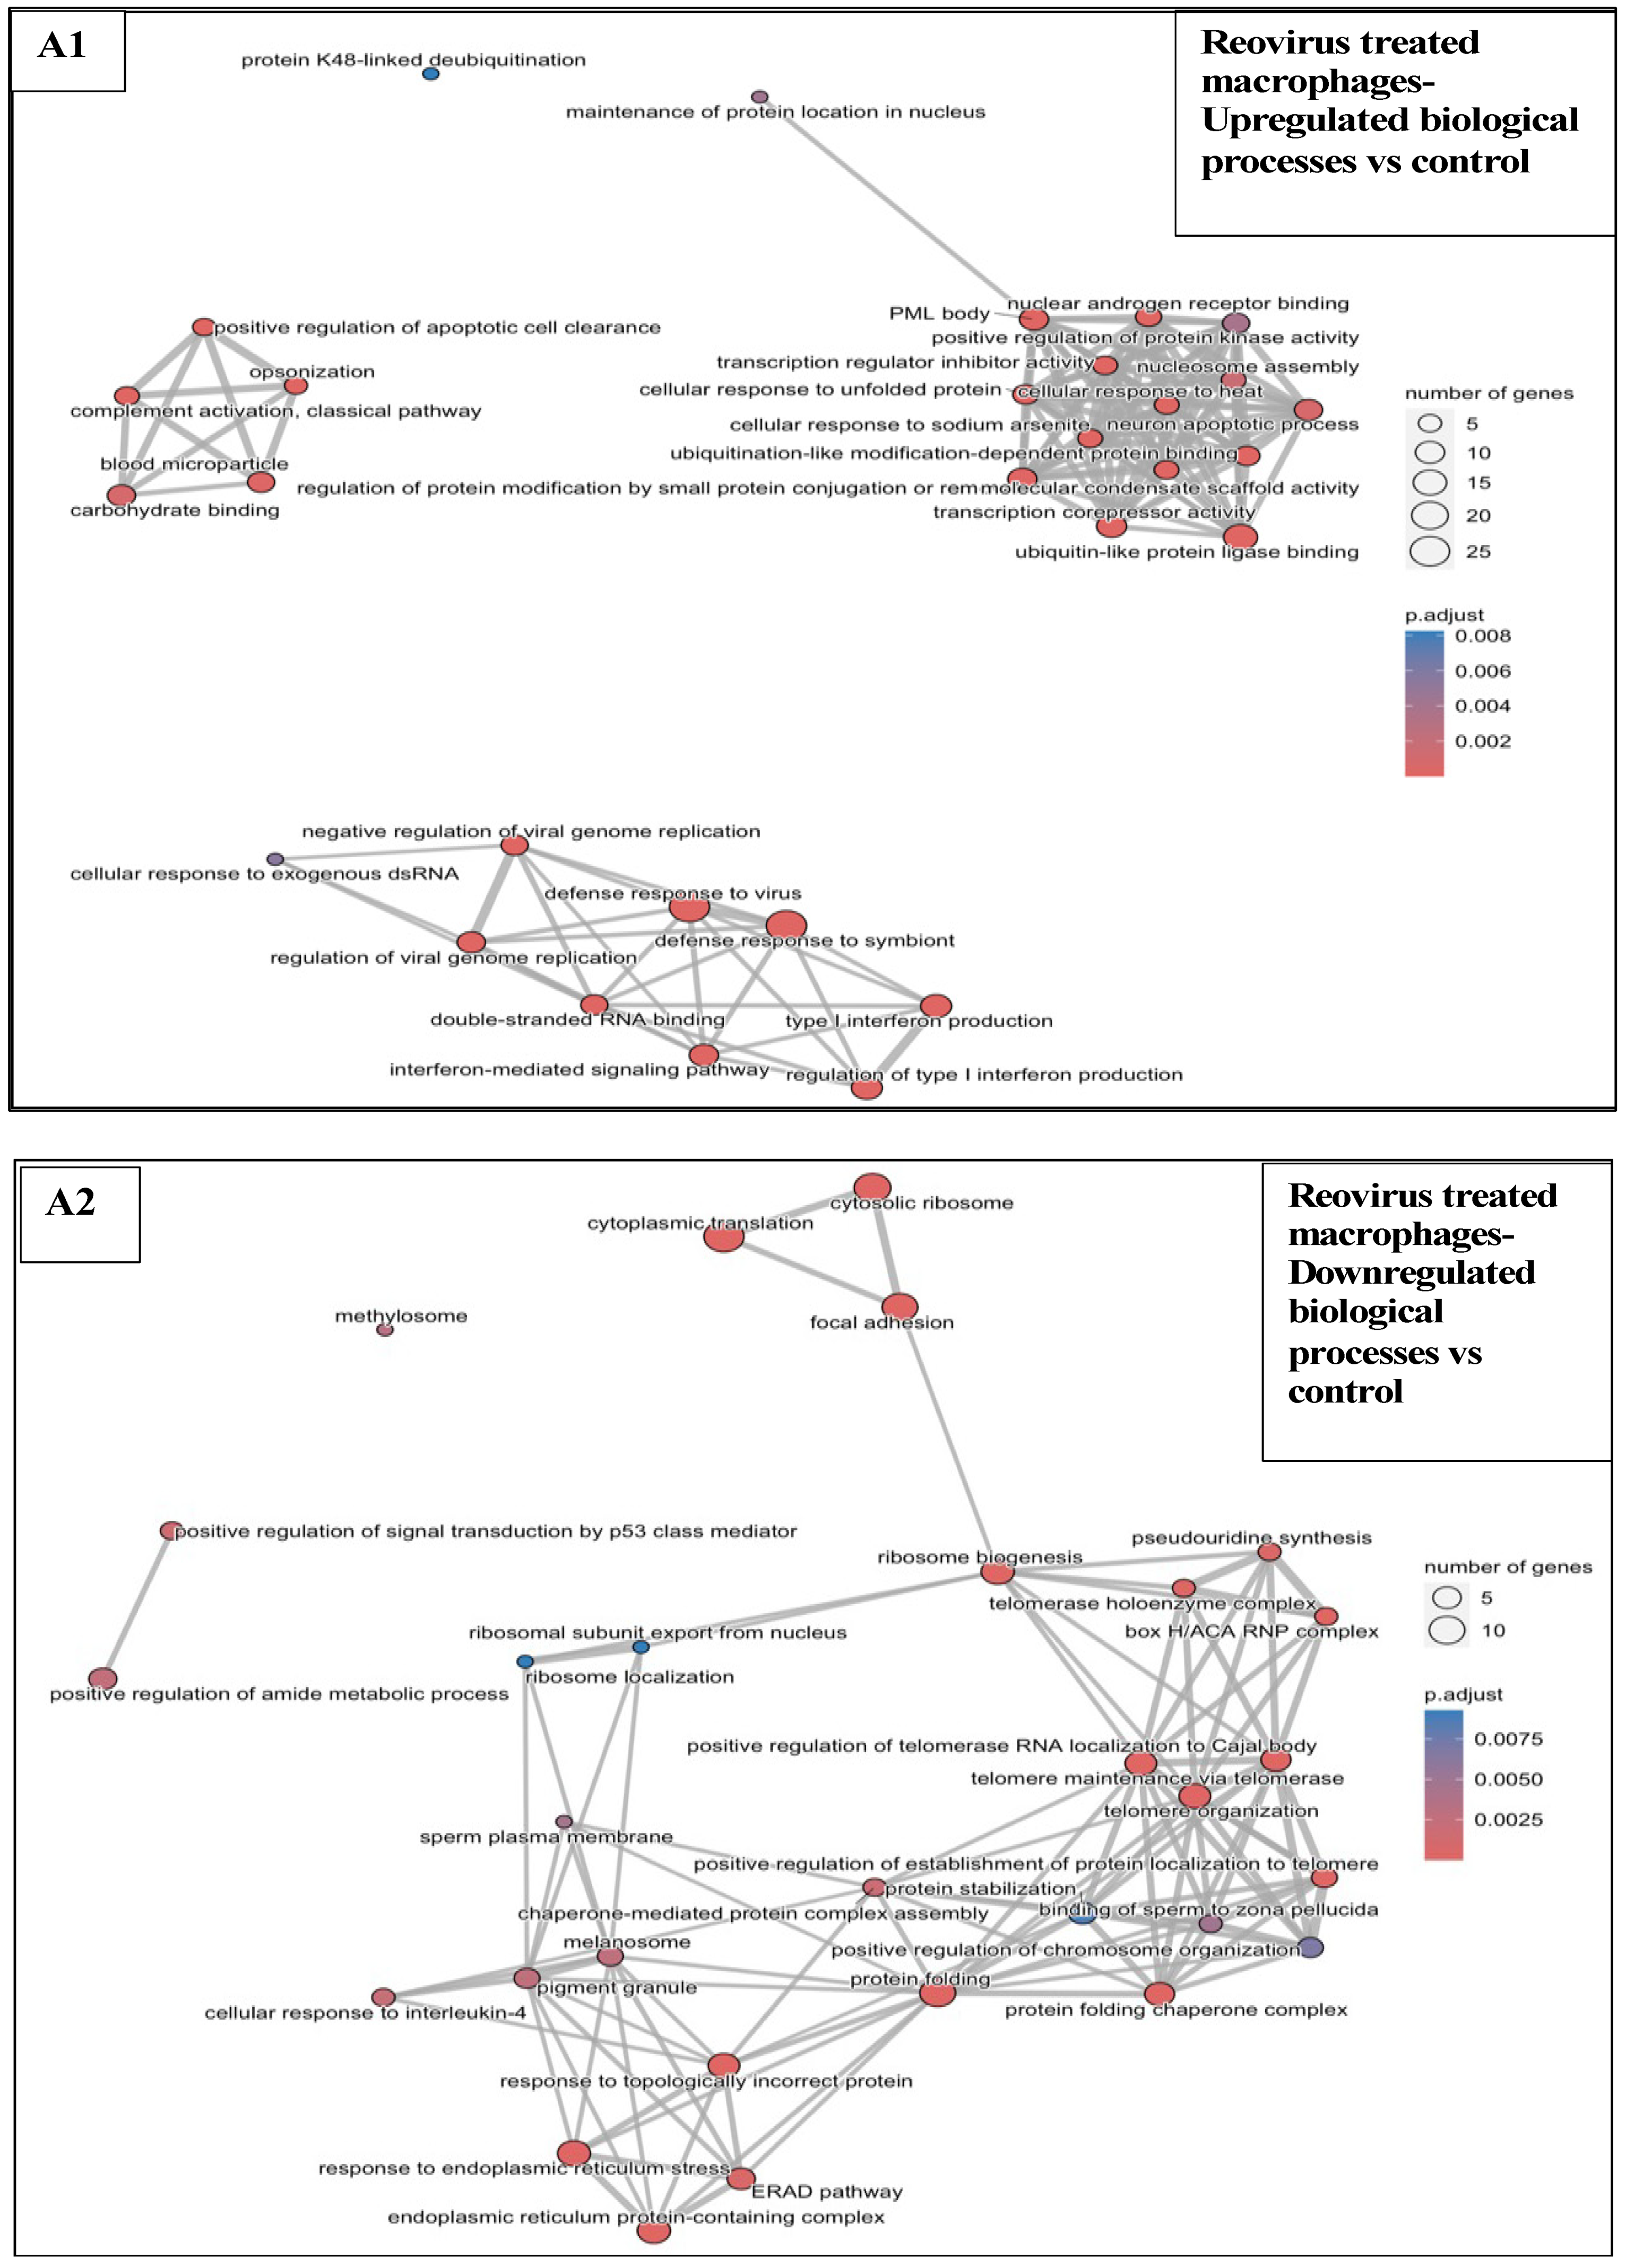
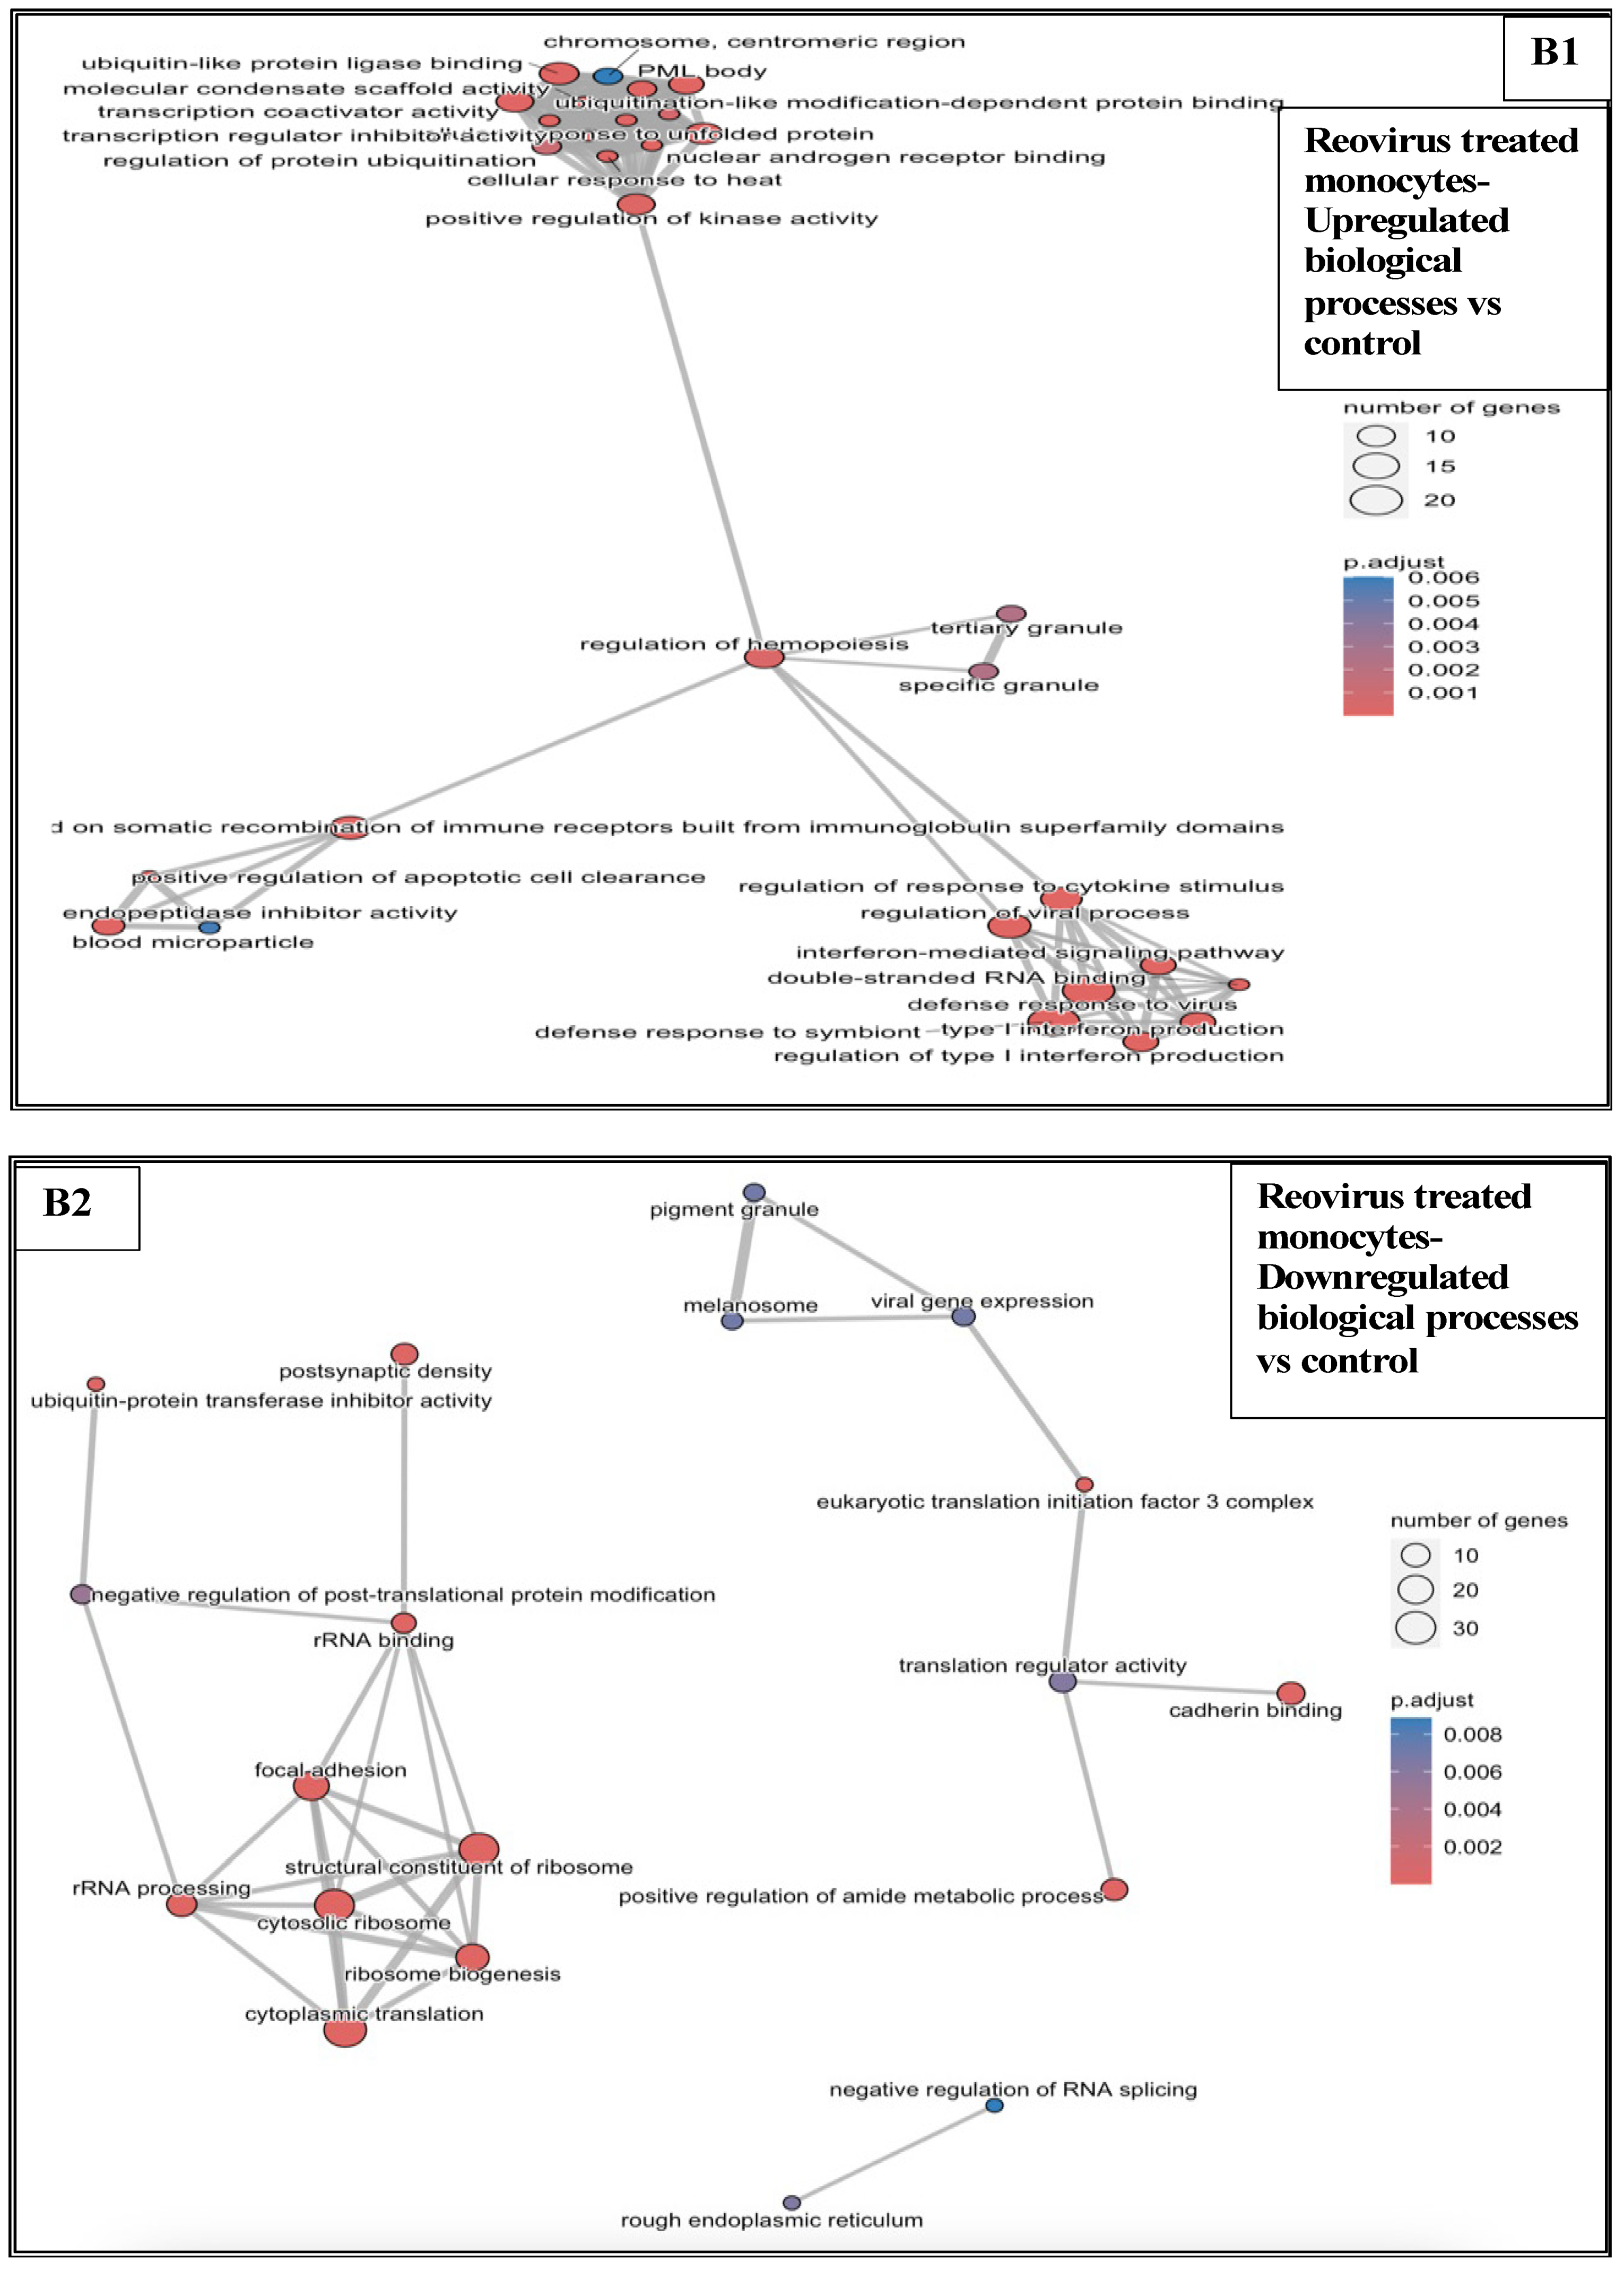
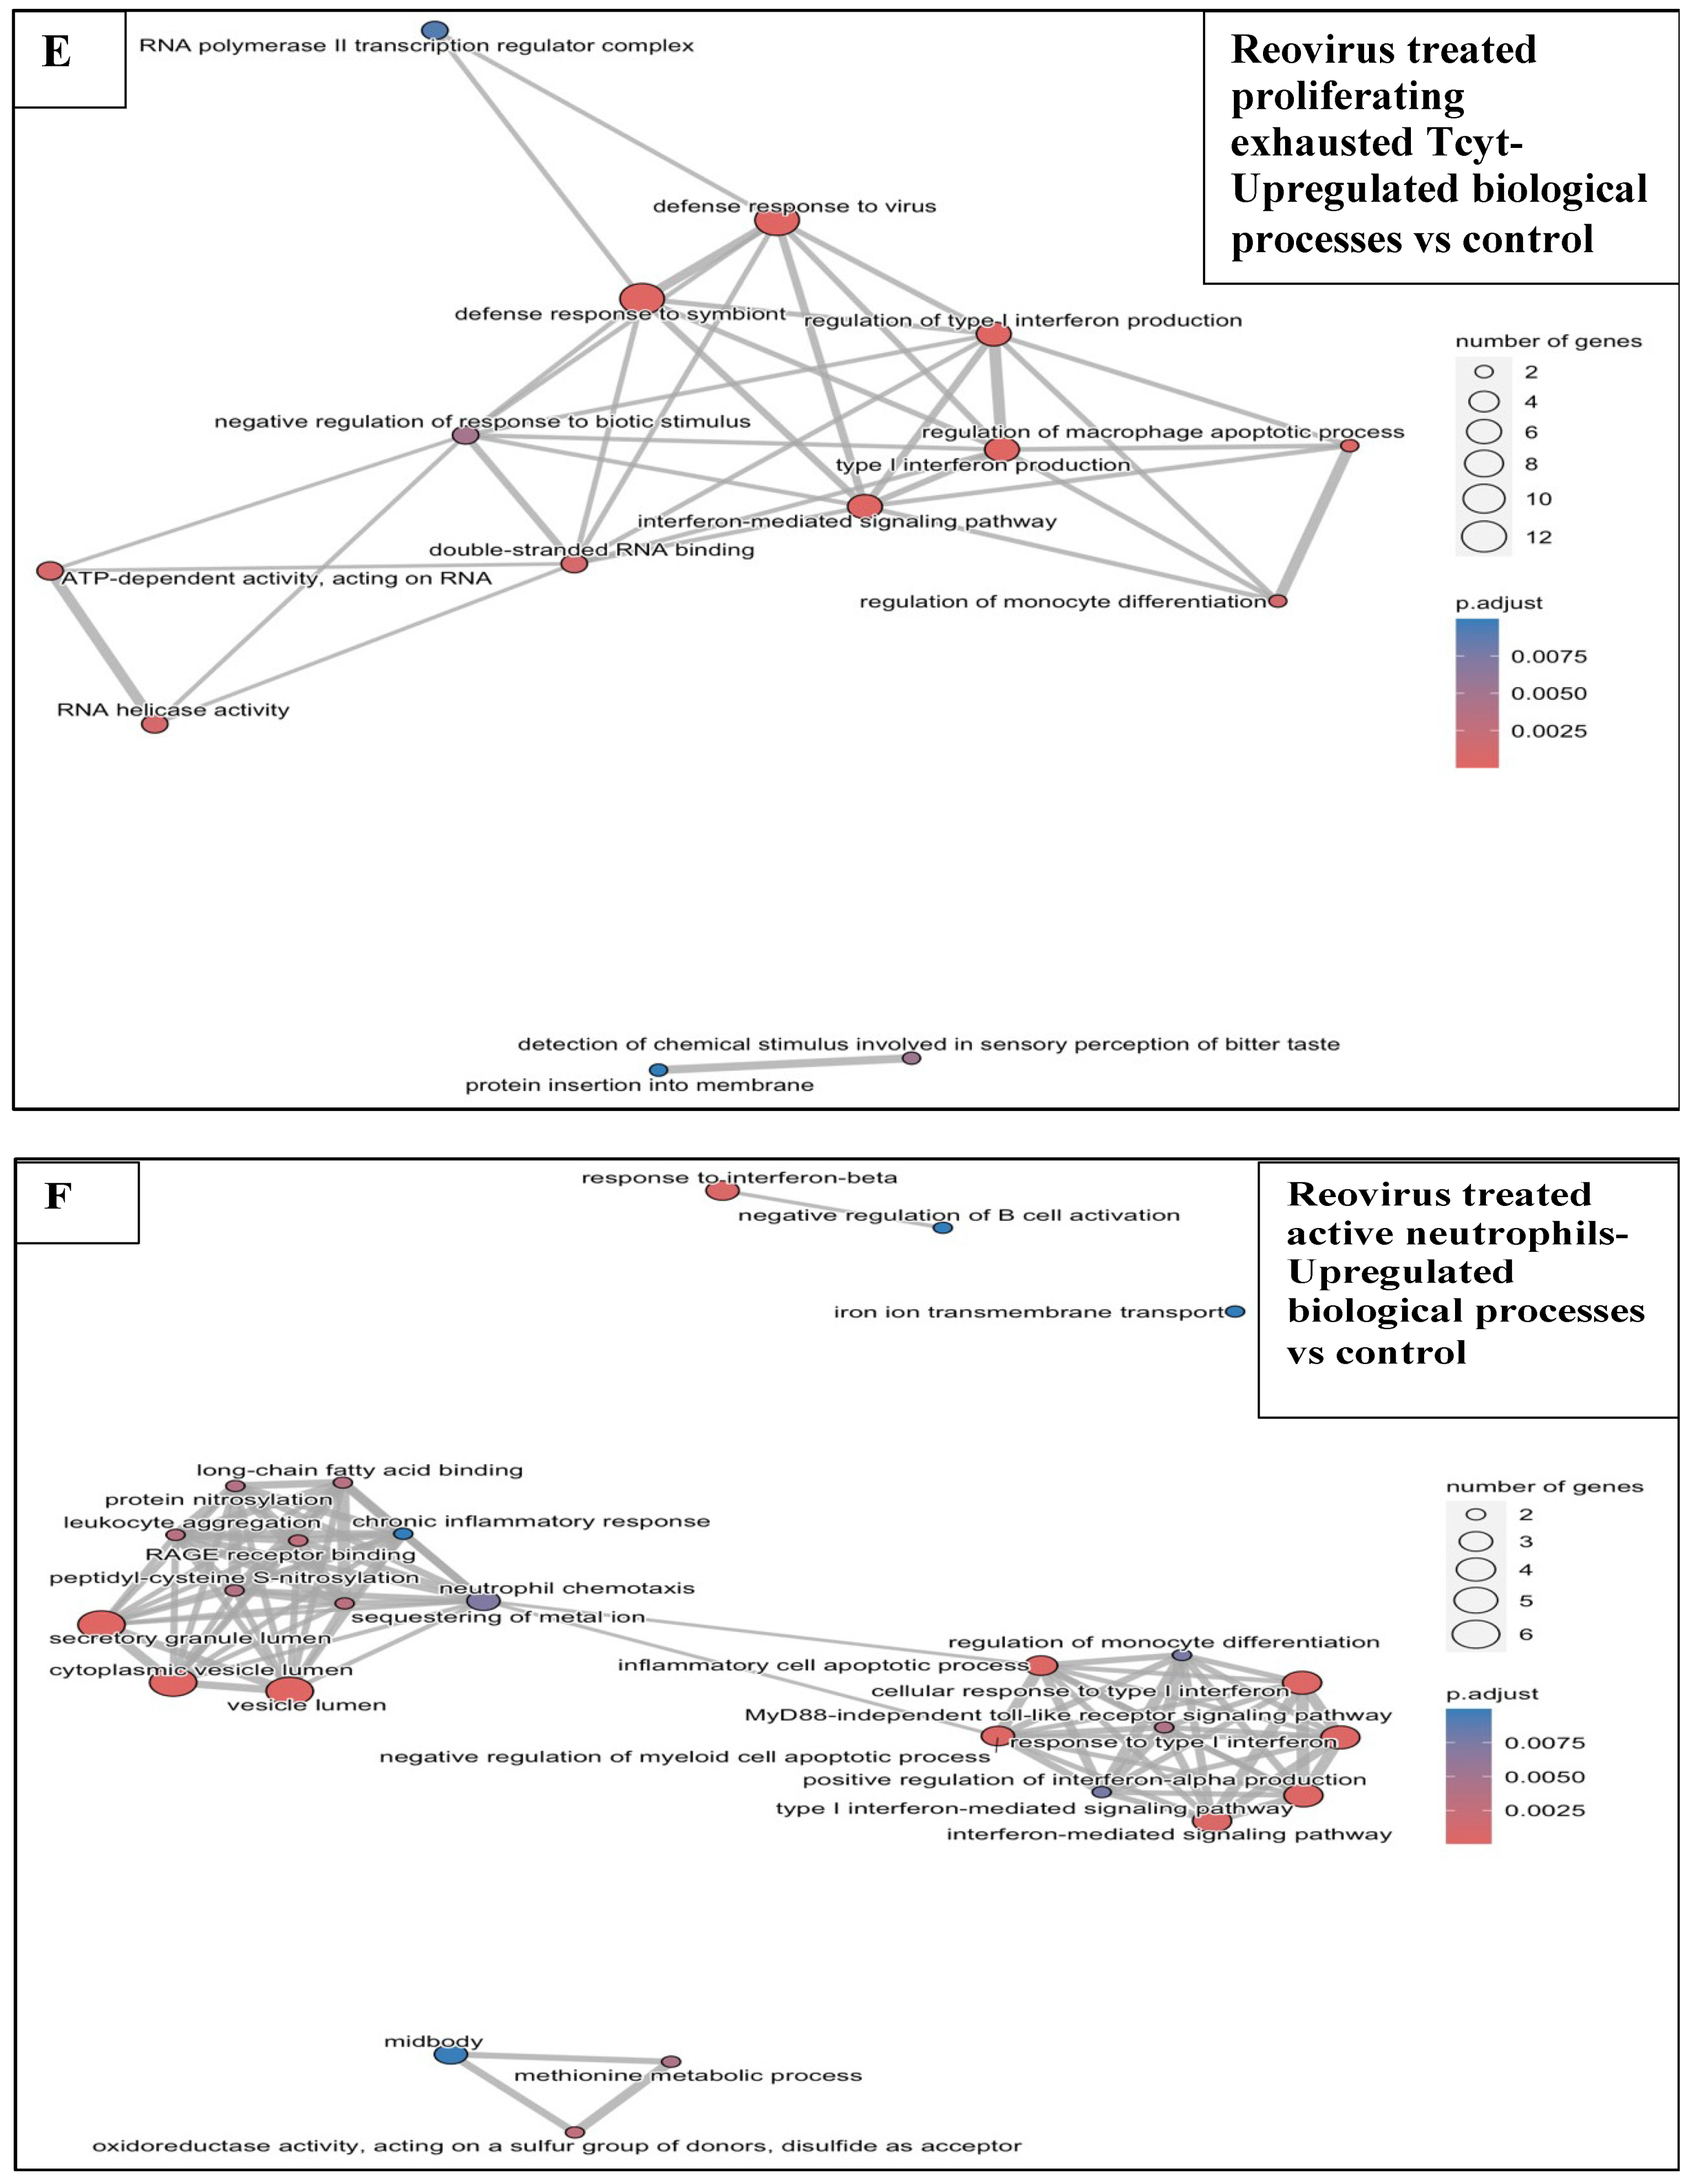
3.6.1. Reovirus Treatments vs. Sham-Exposed Controls
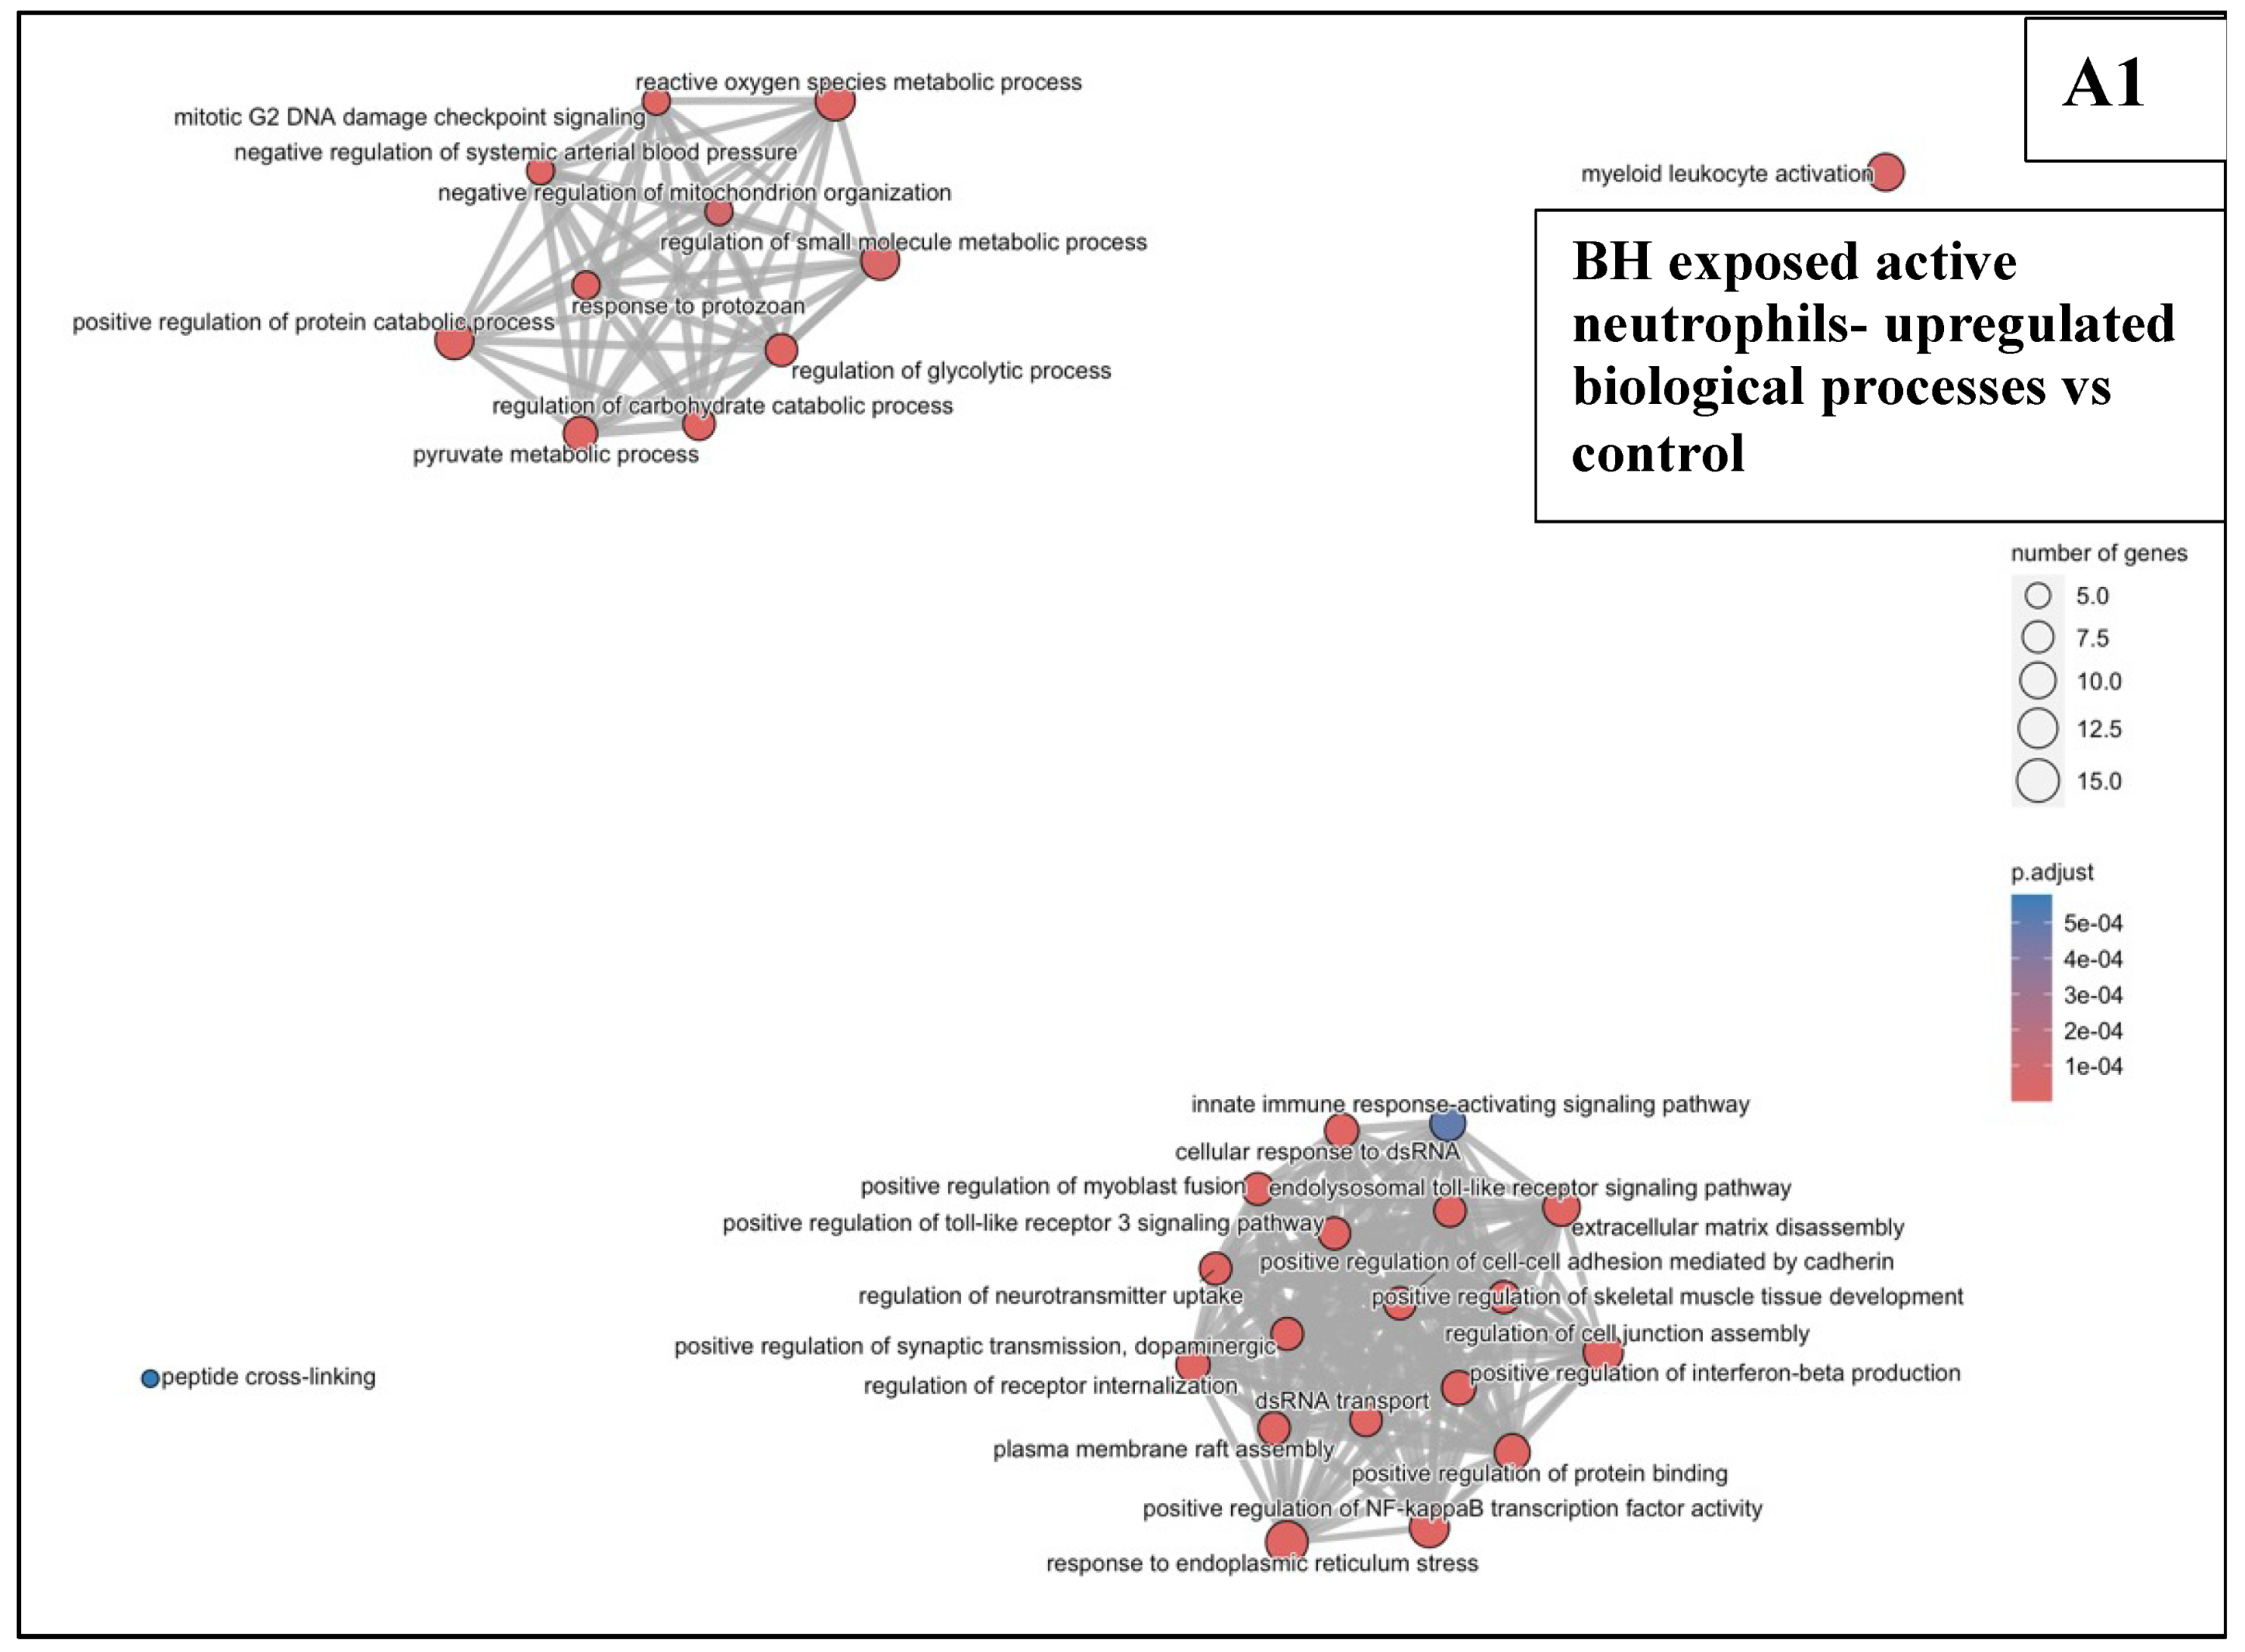
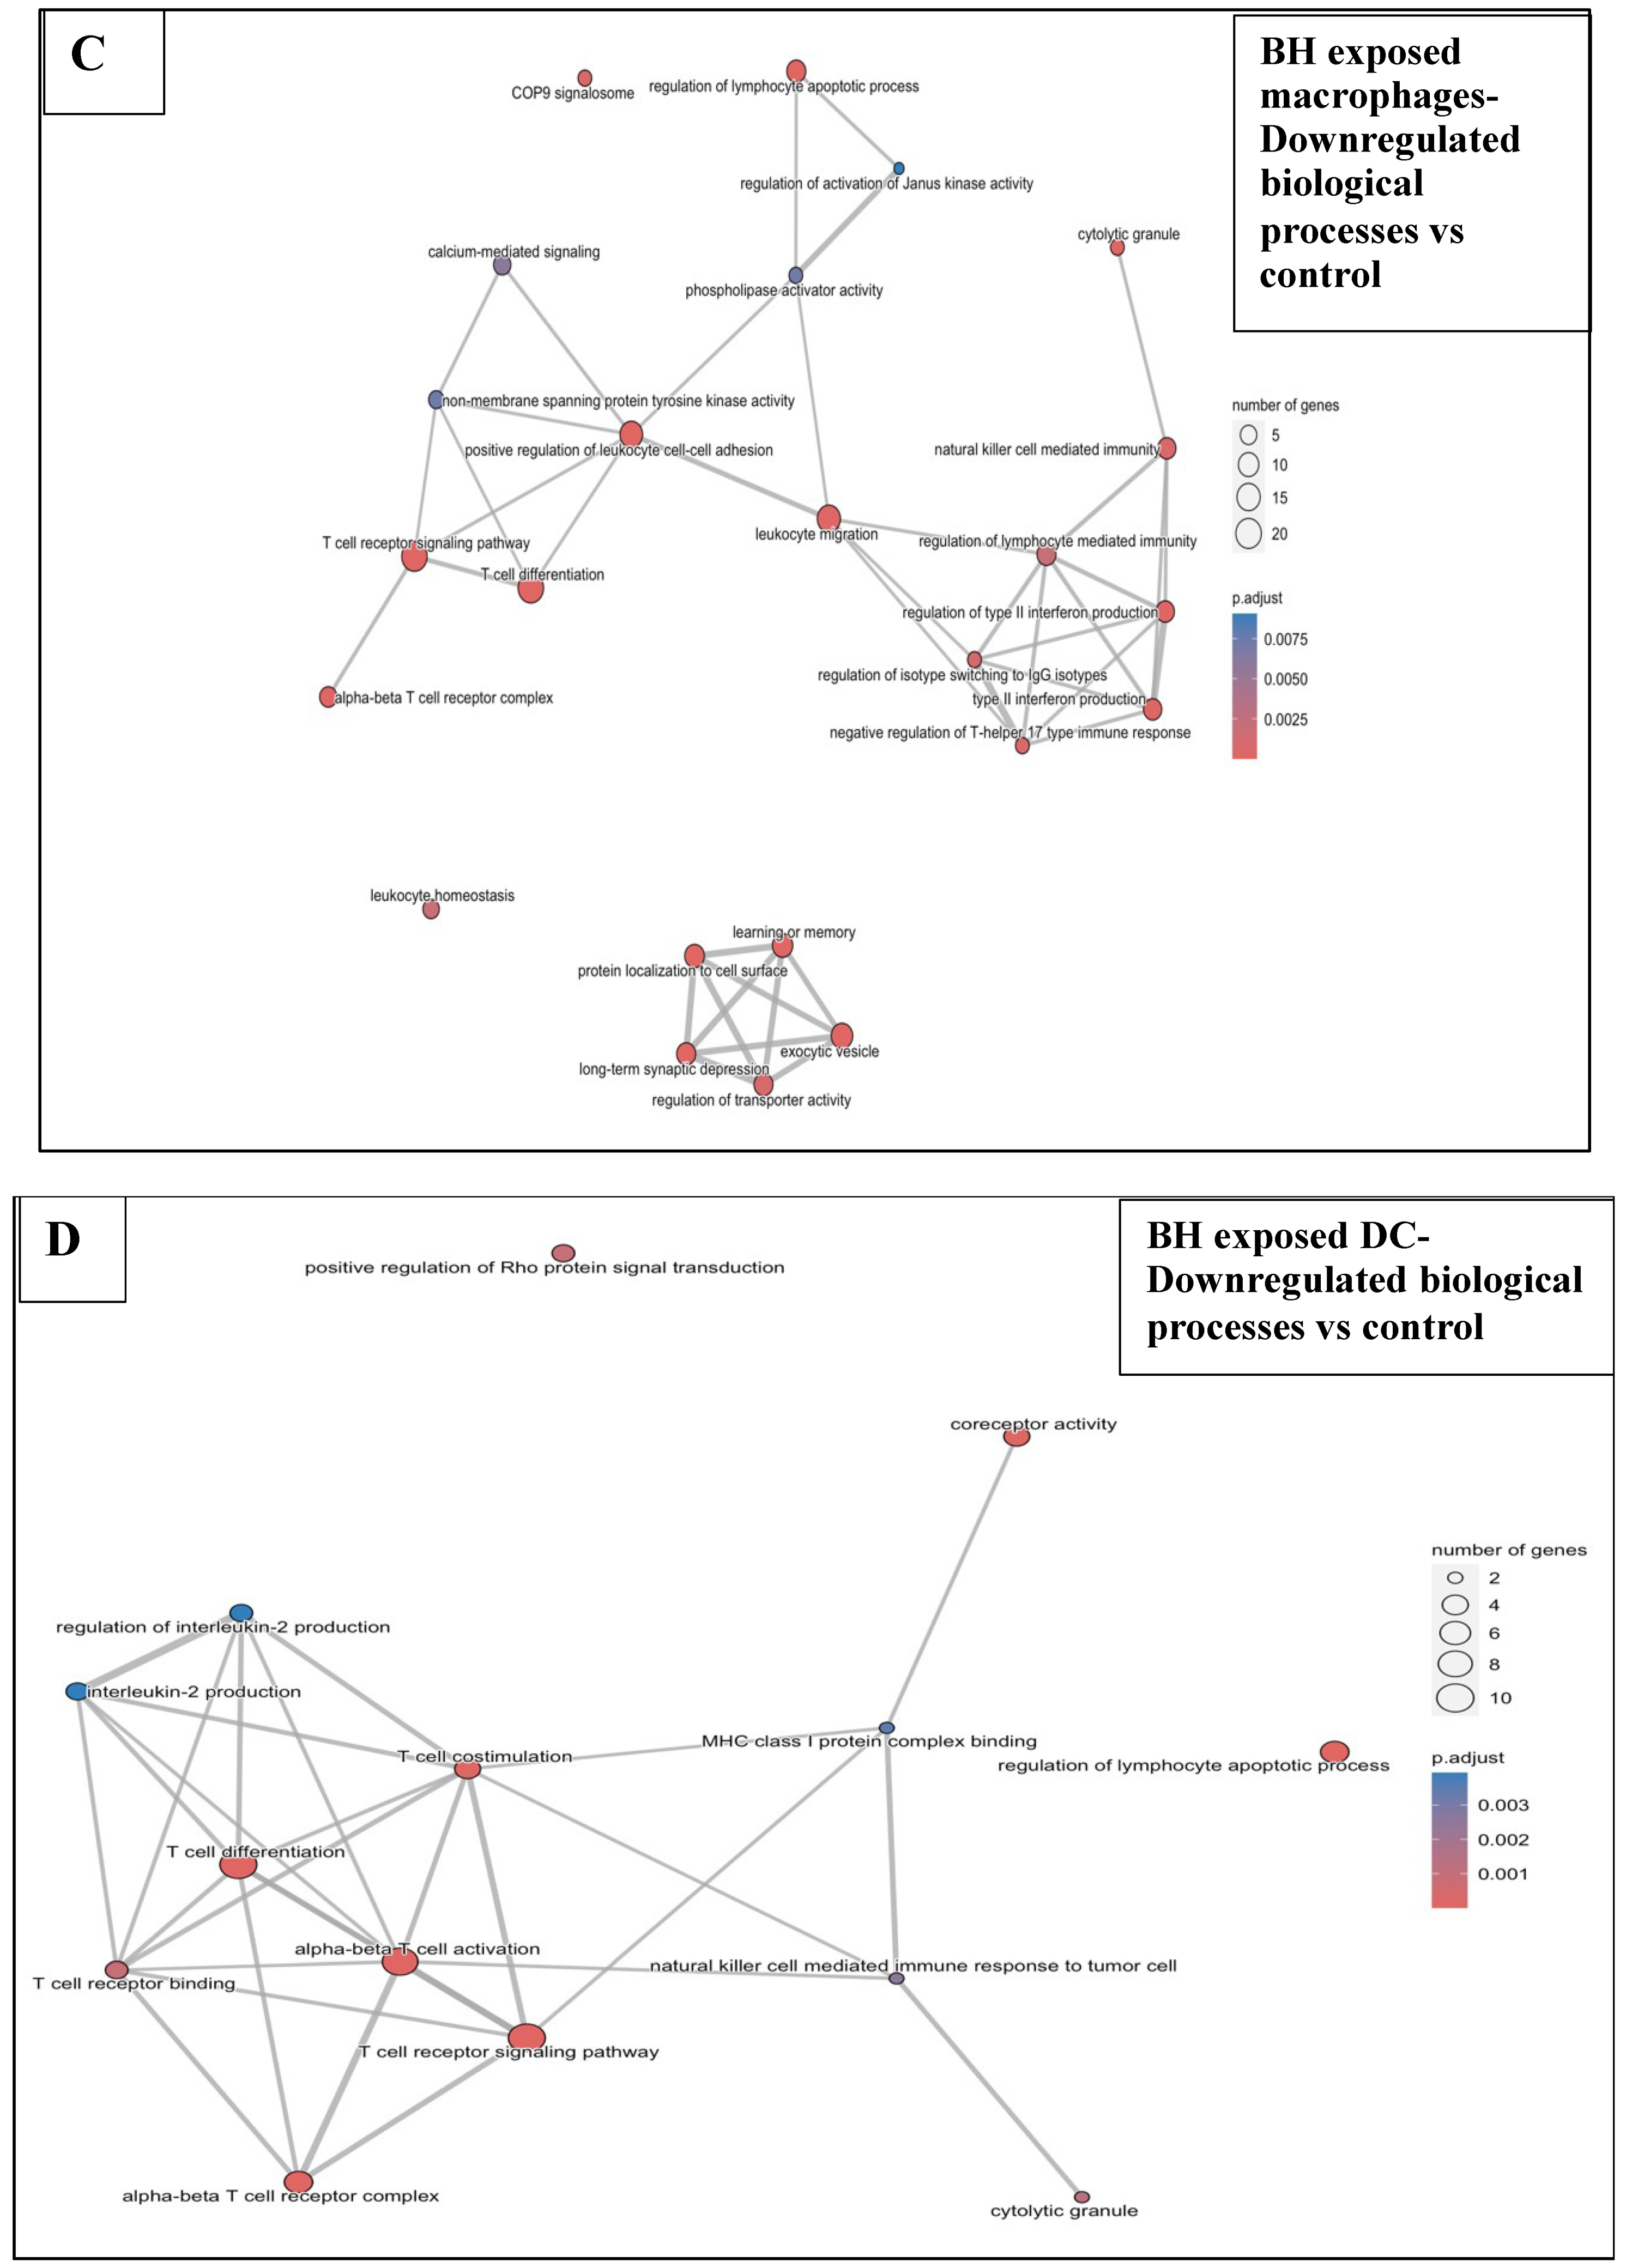
3.6.2. BH Exposures vs. Sham-Exposed Controls
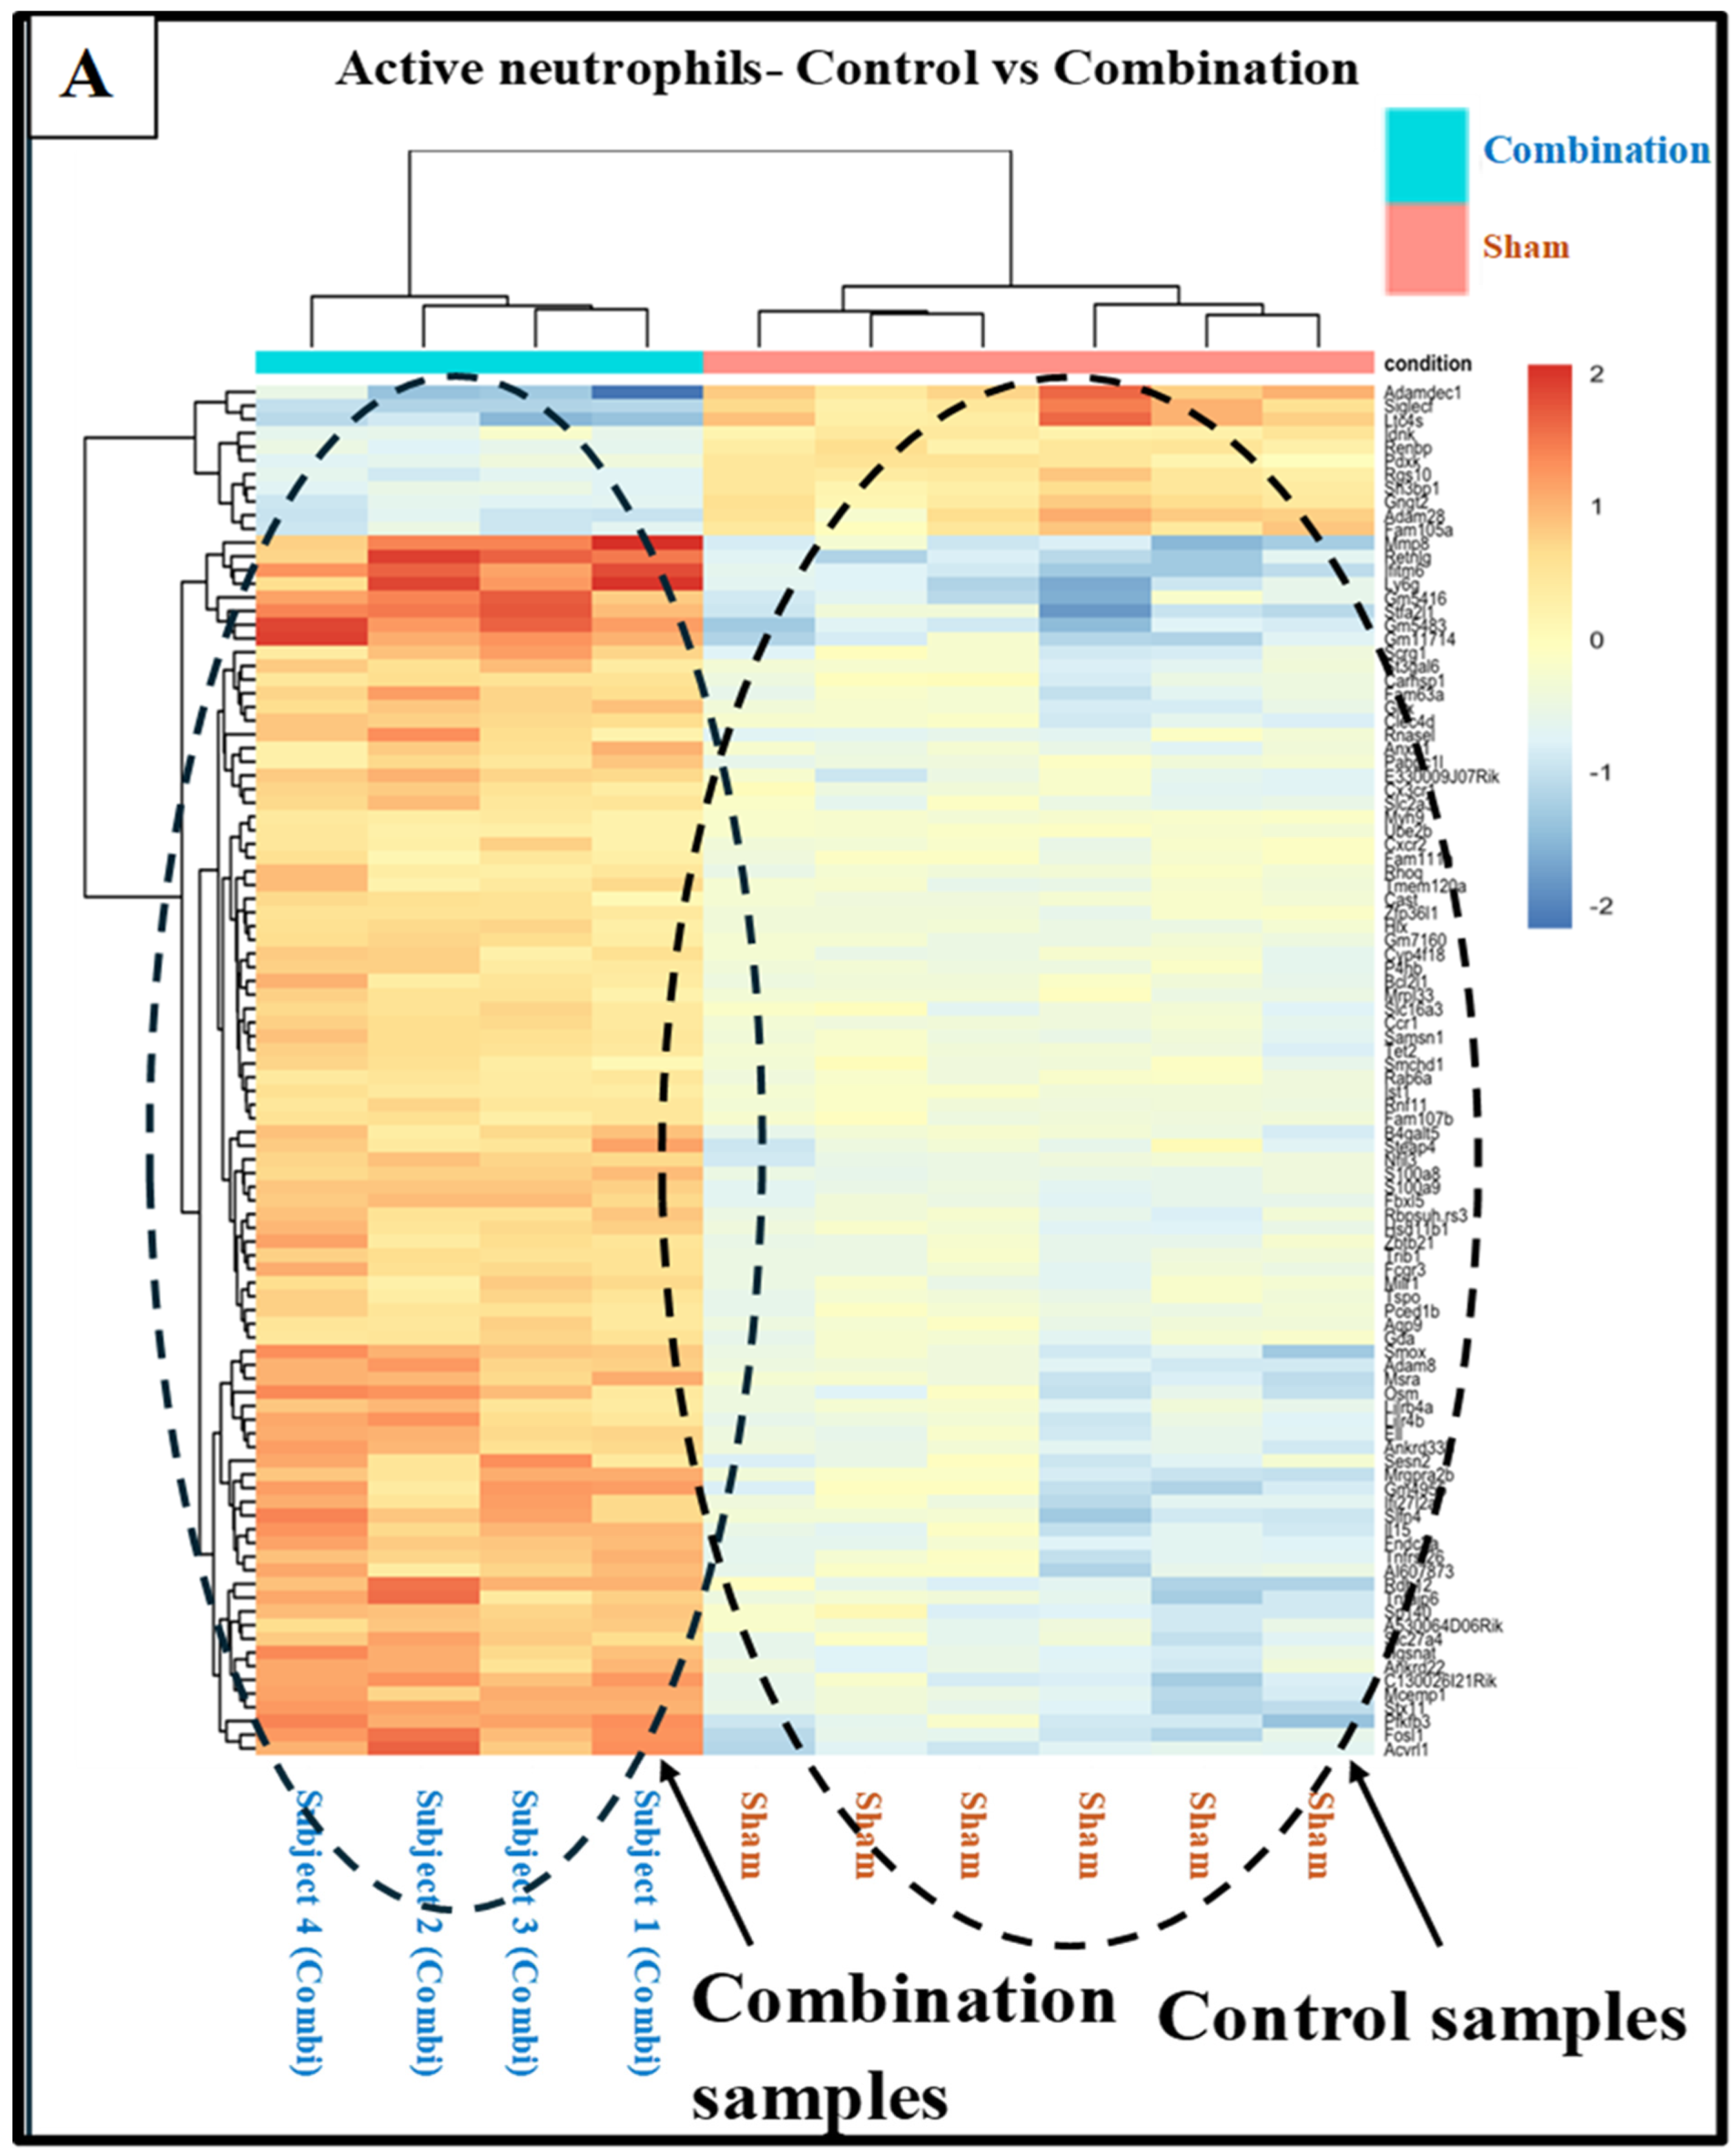
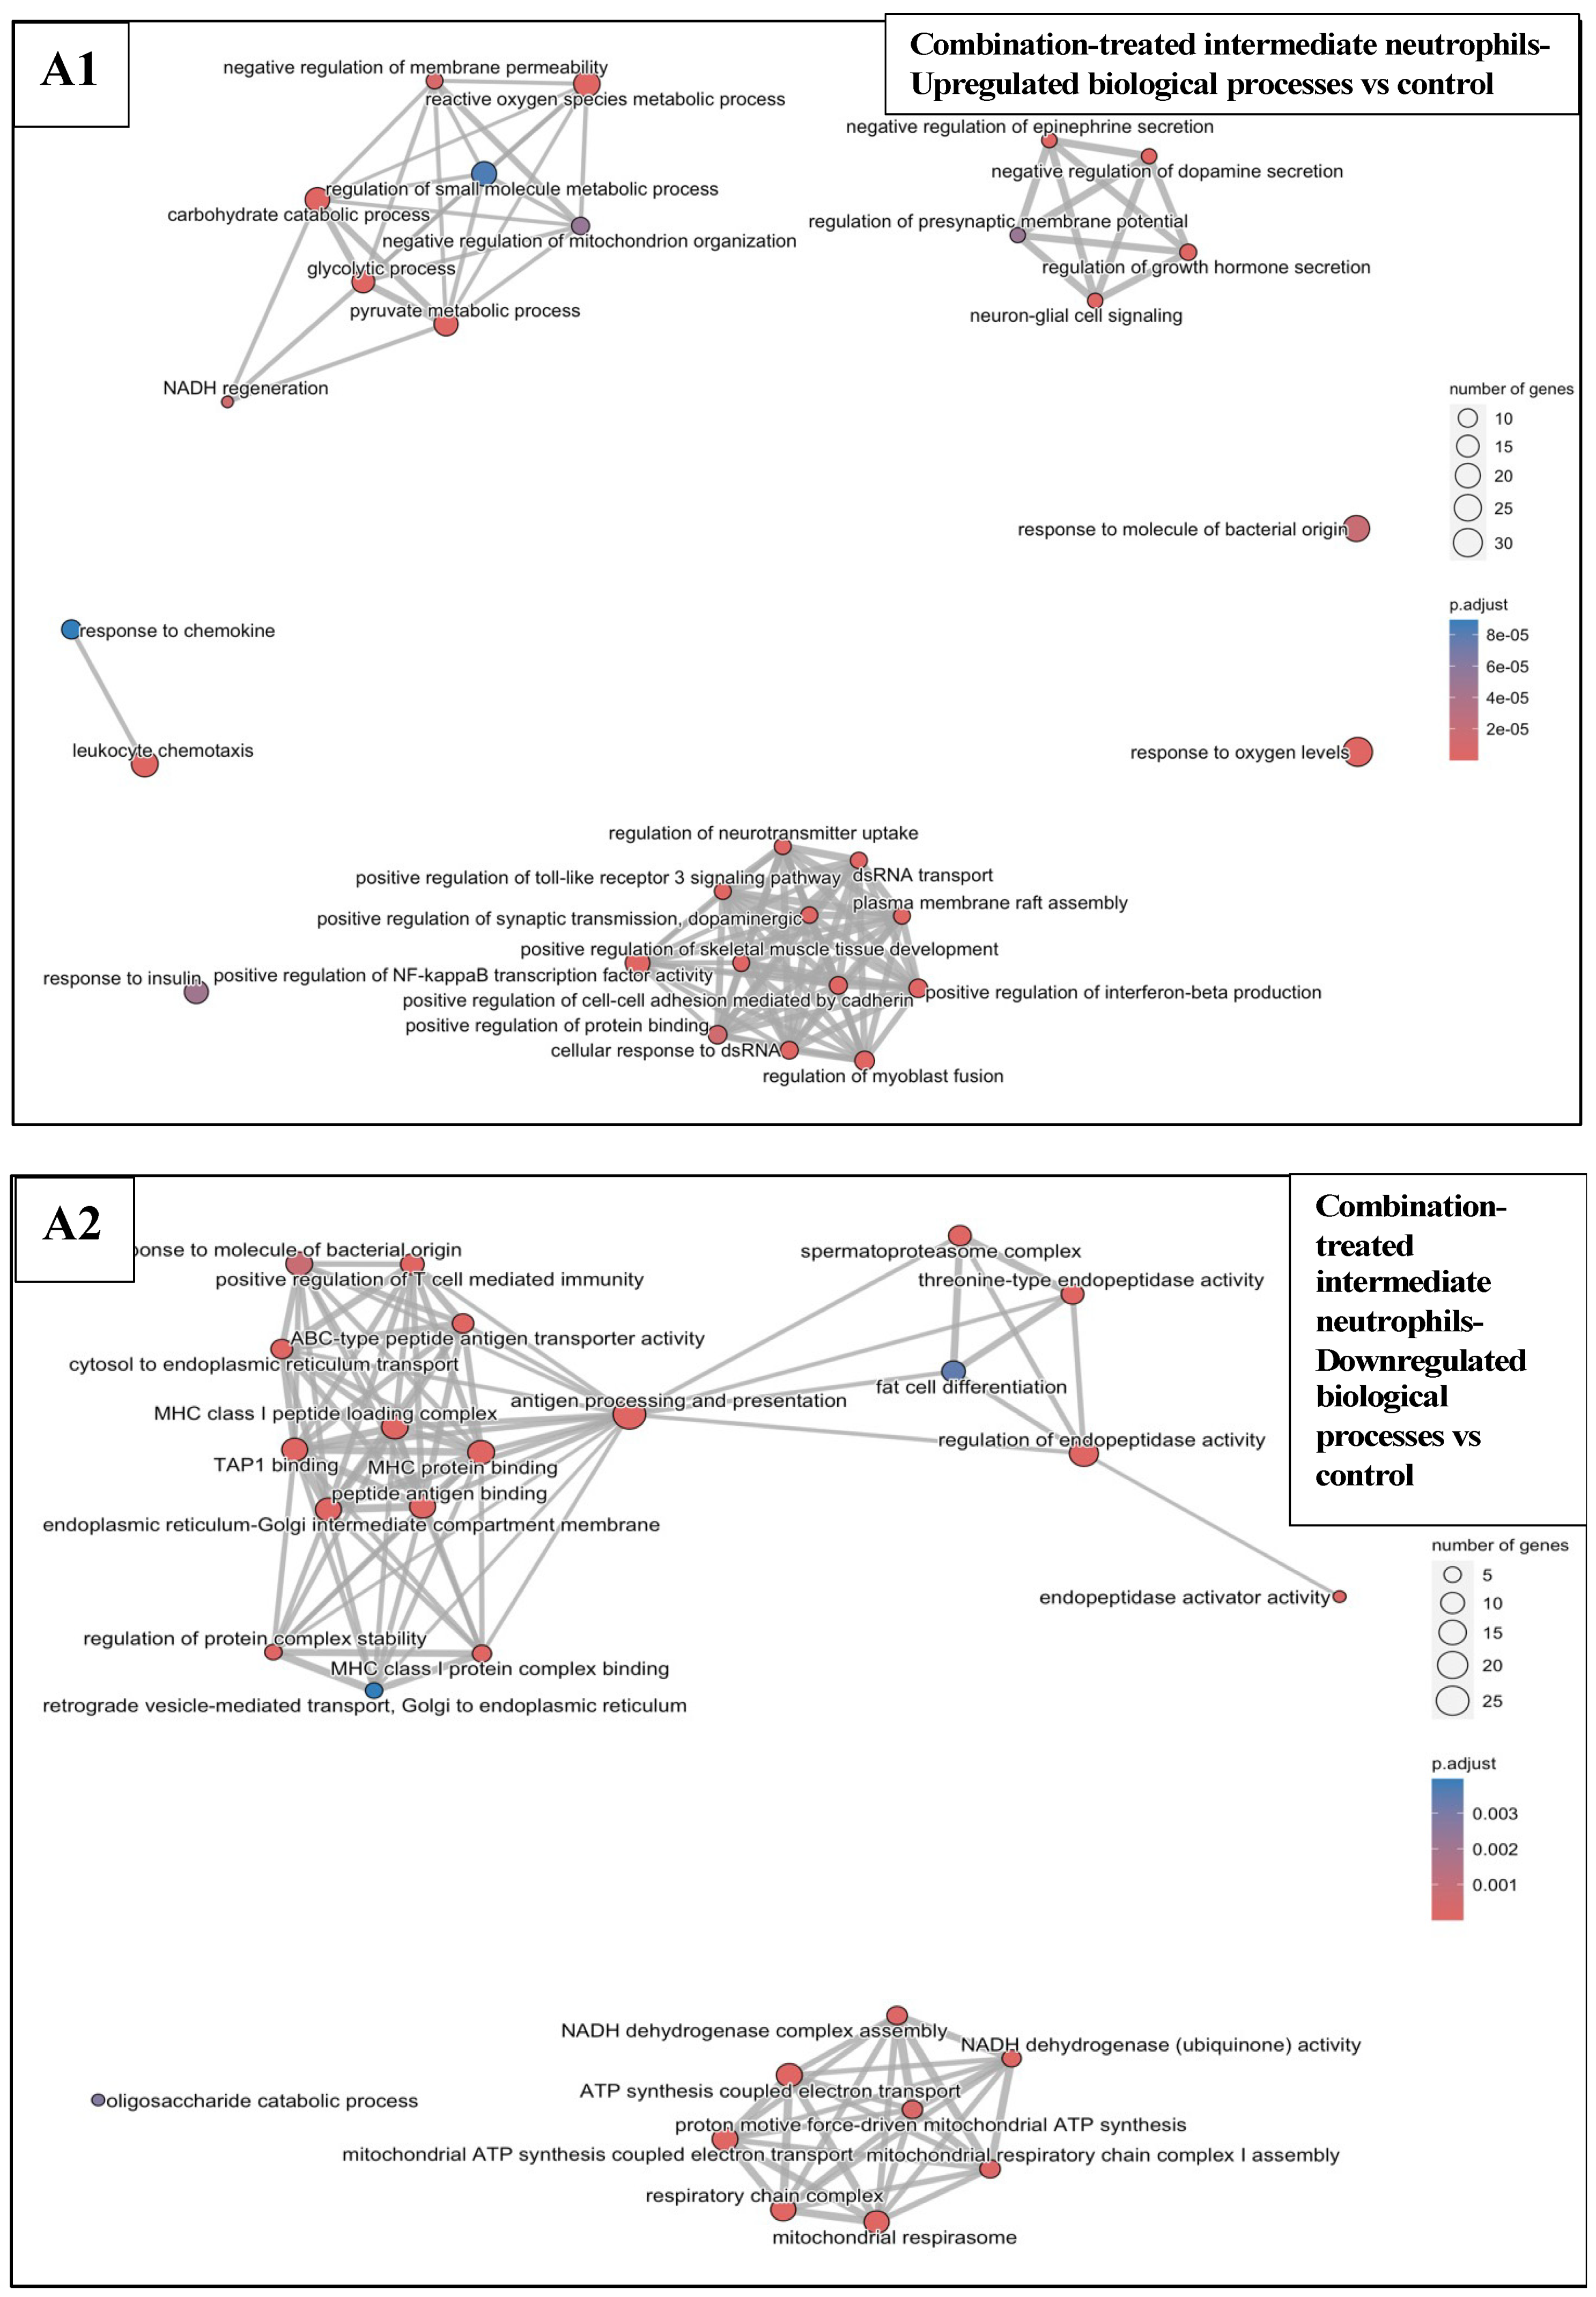
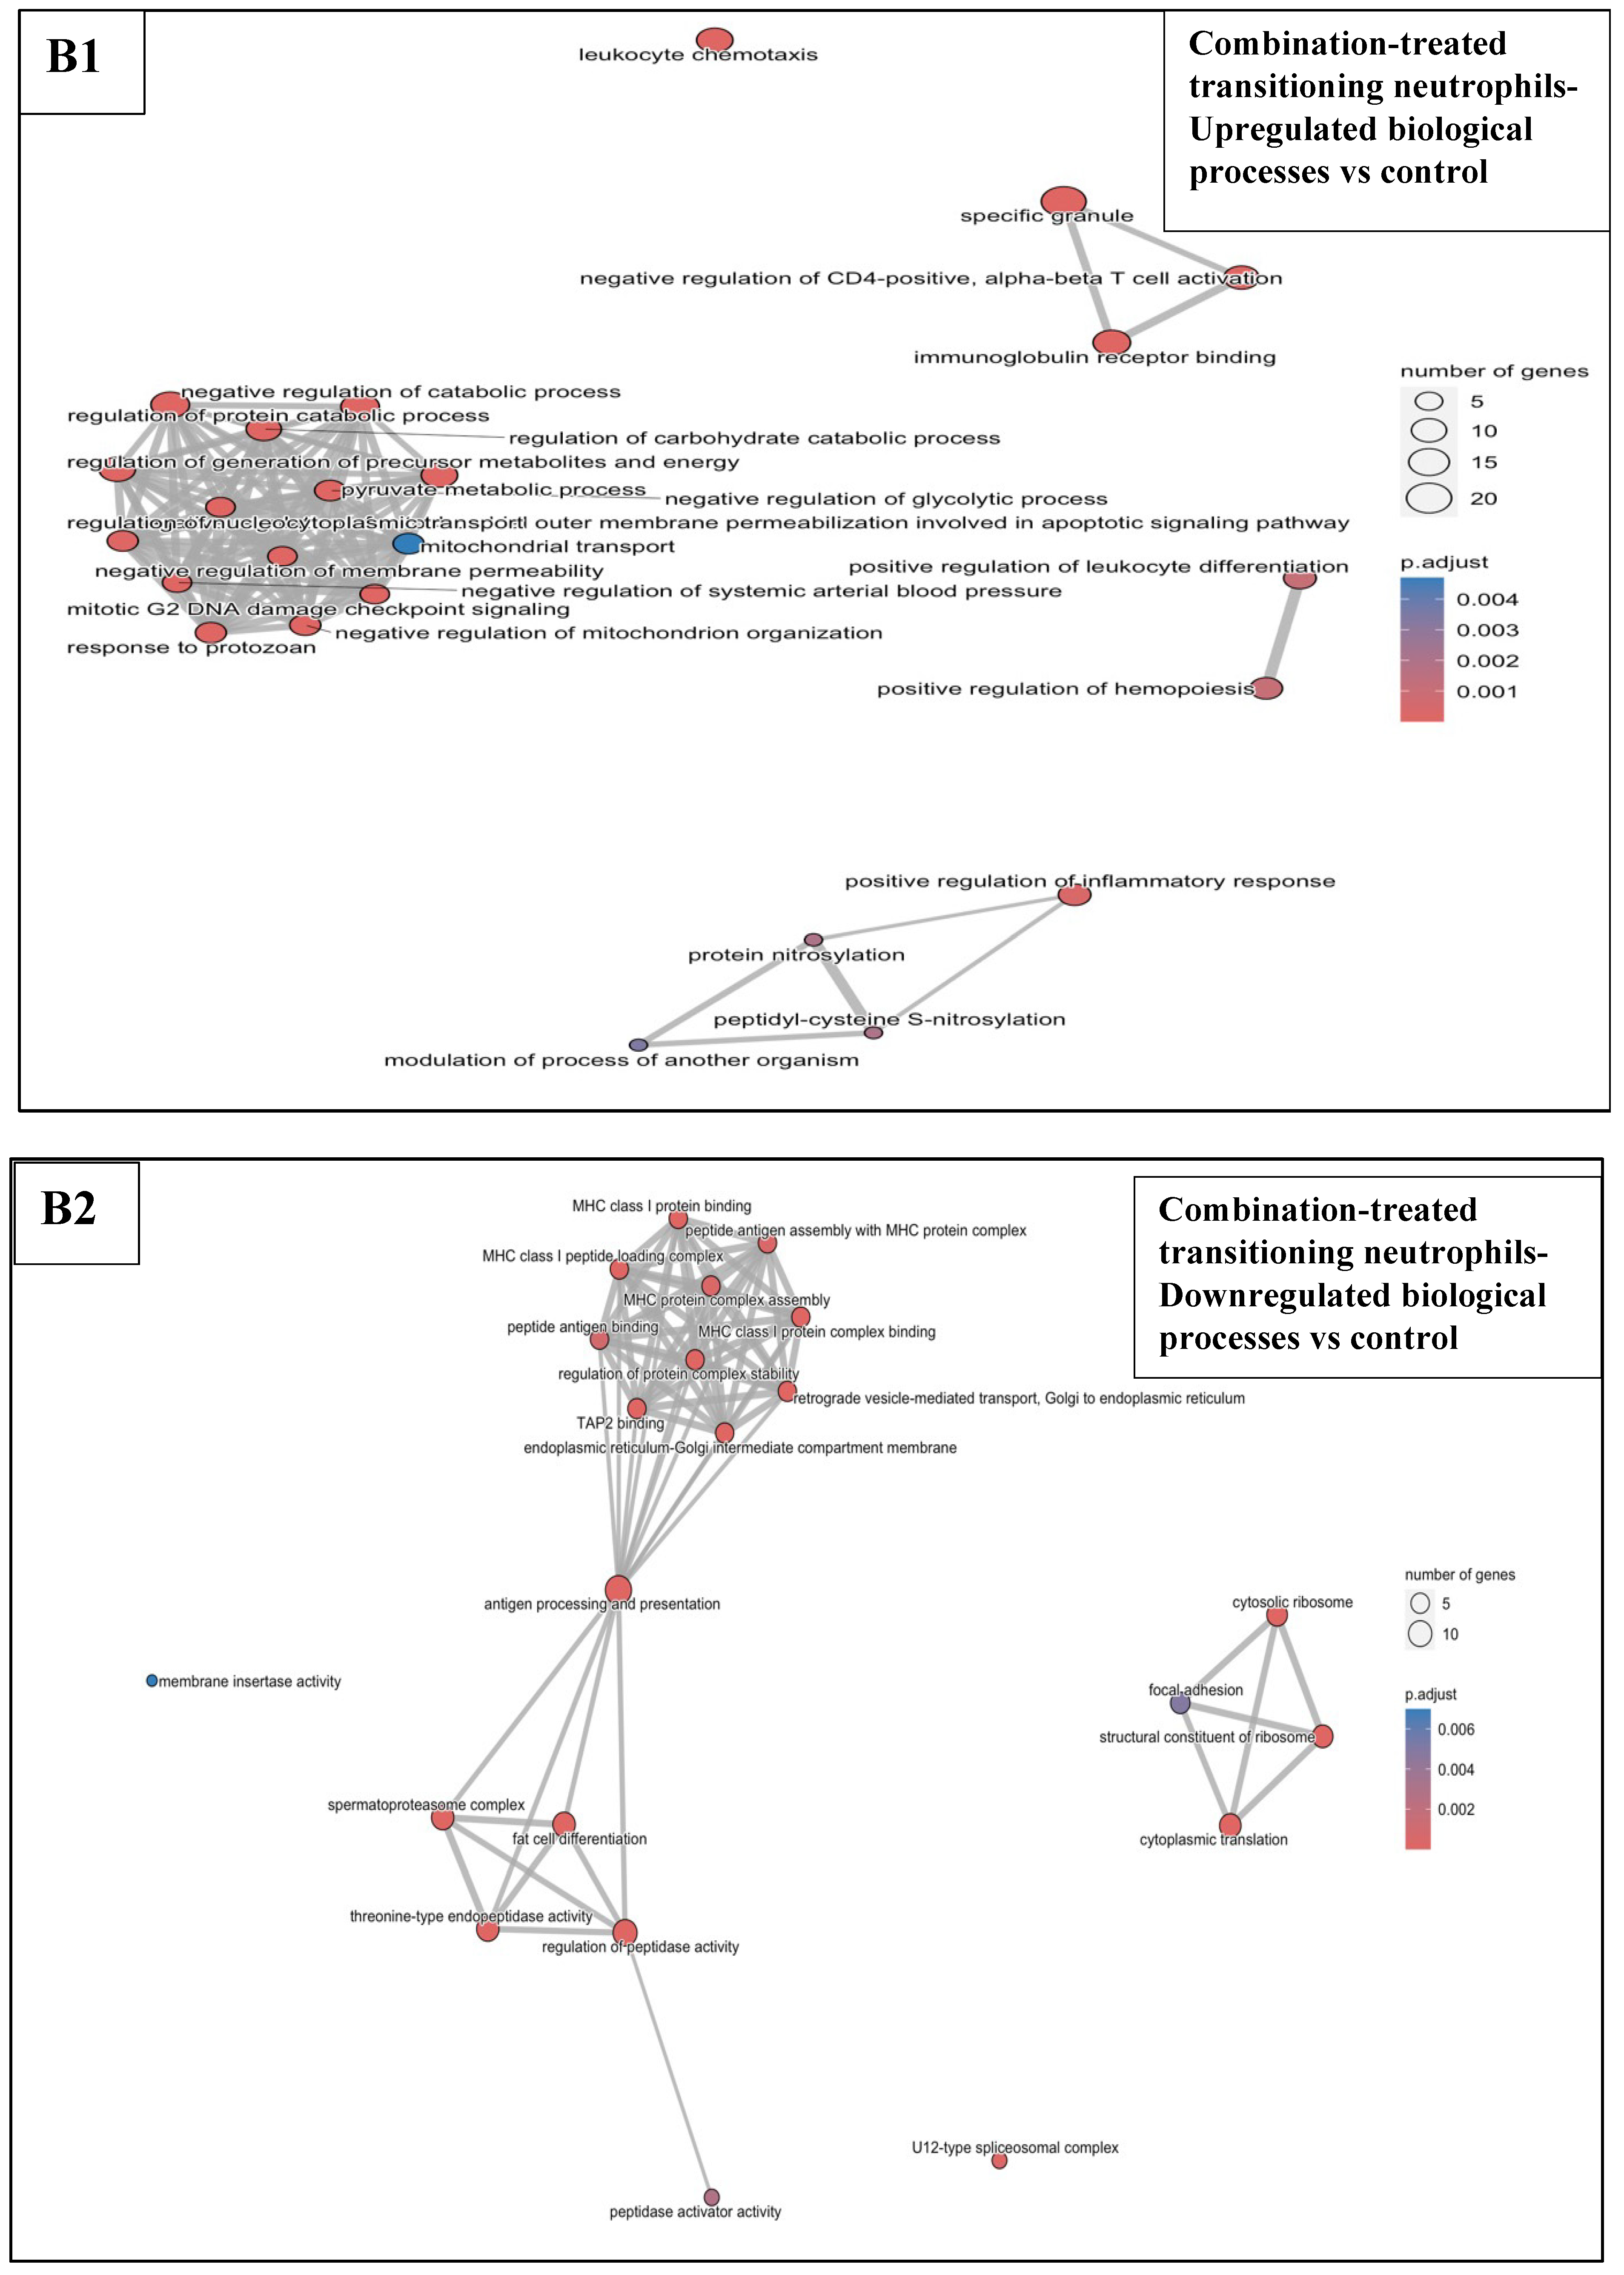
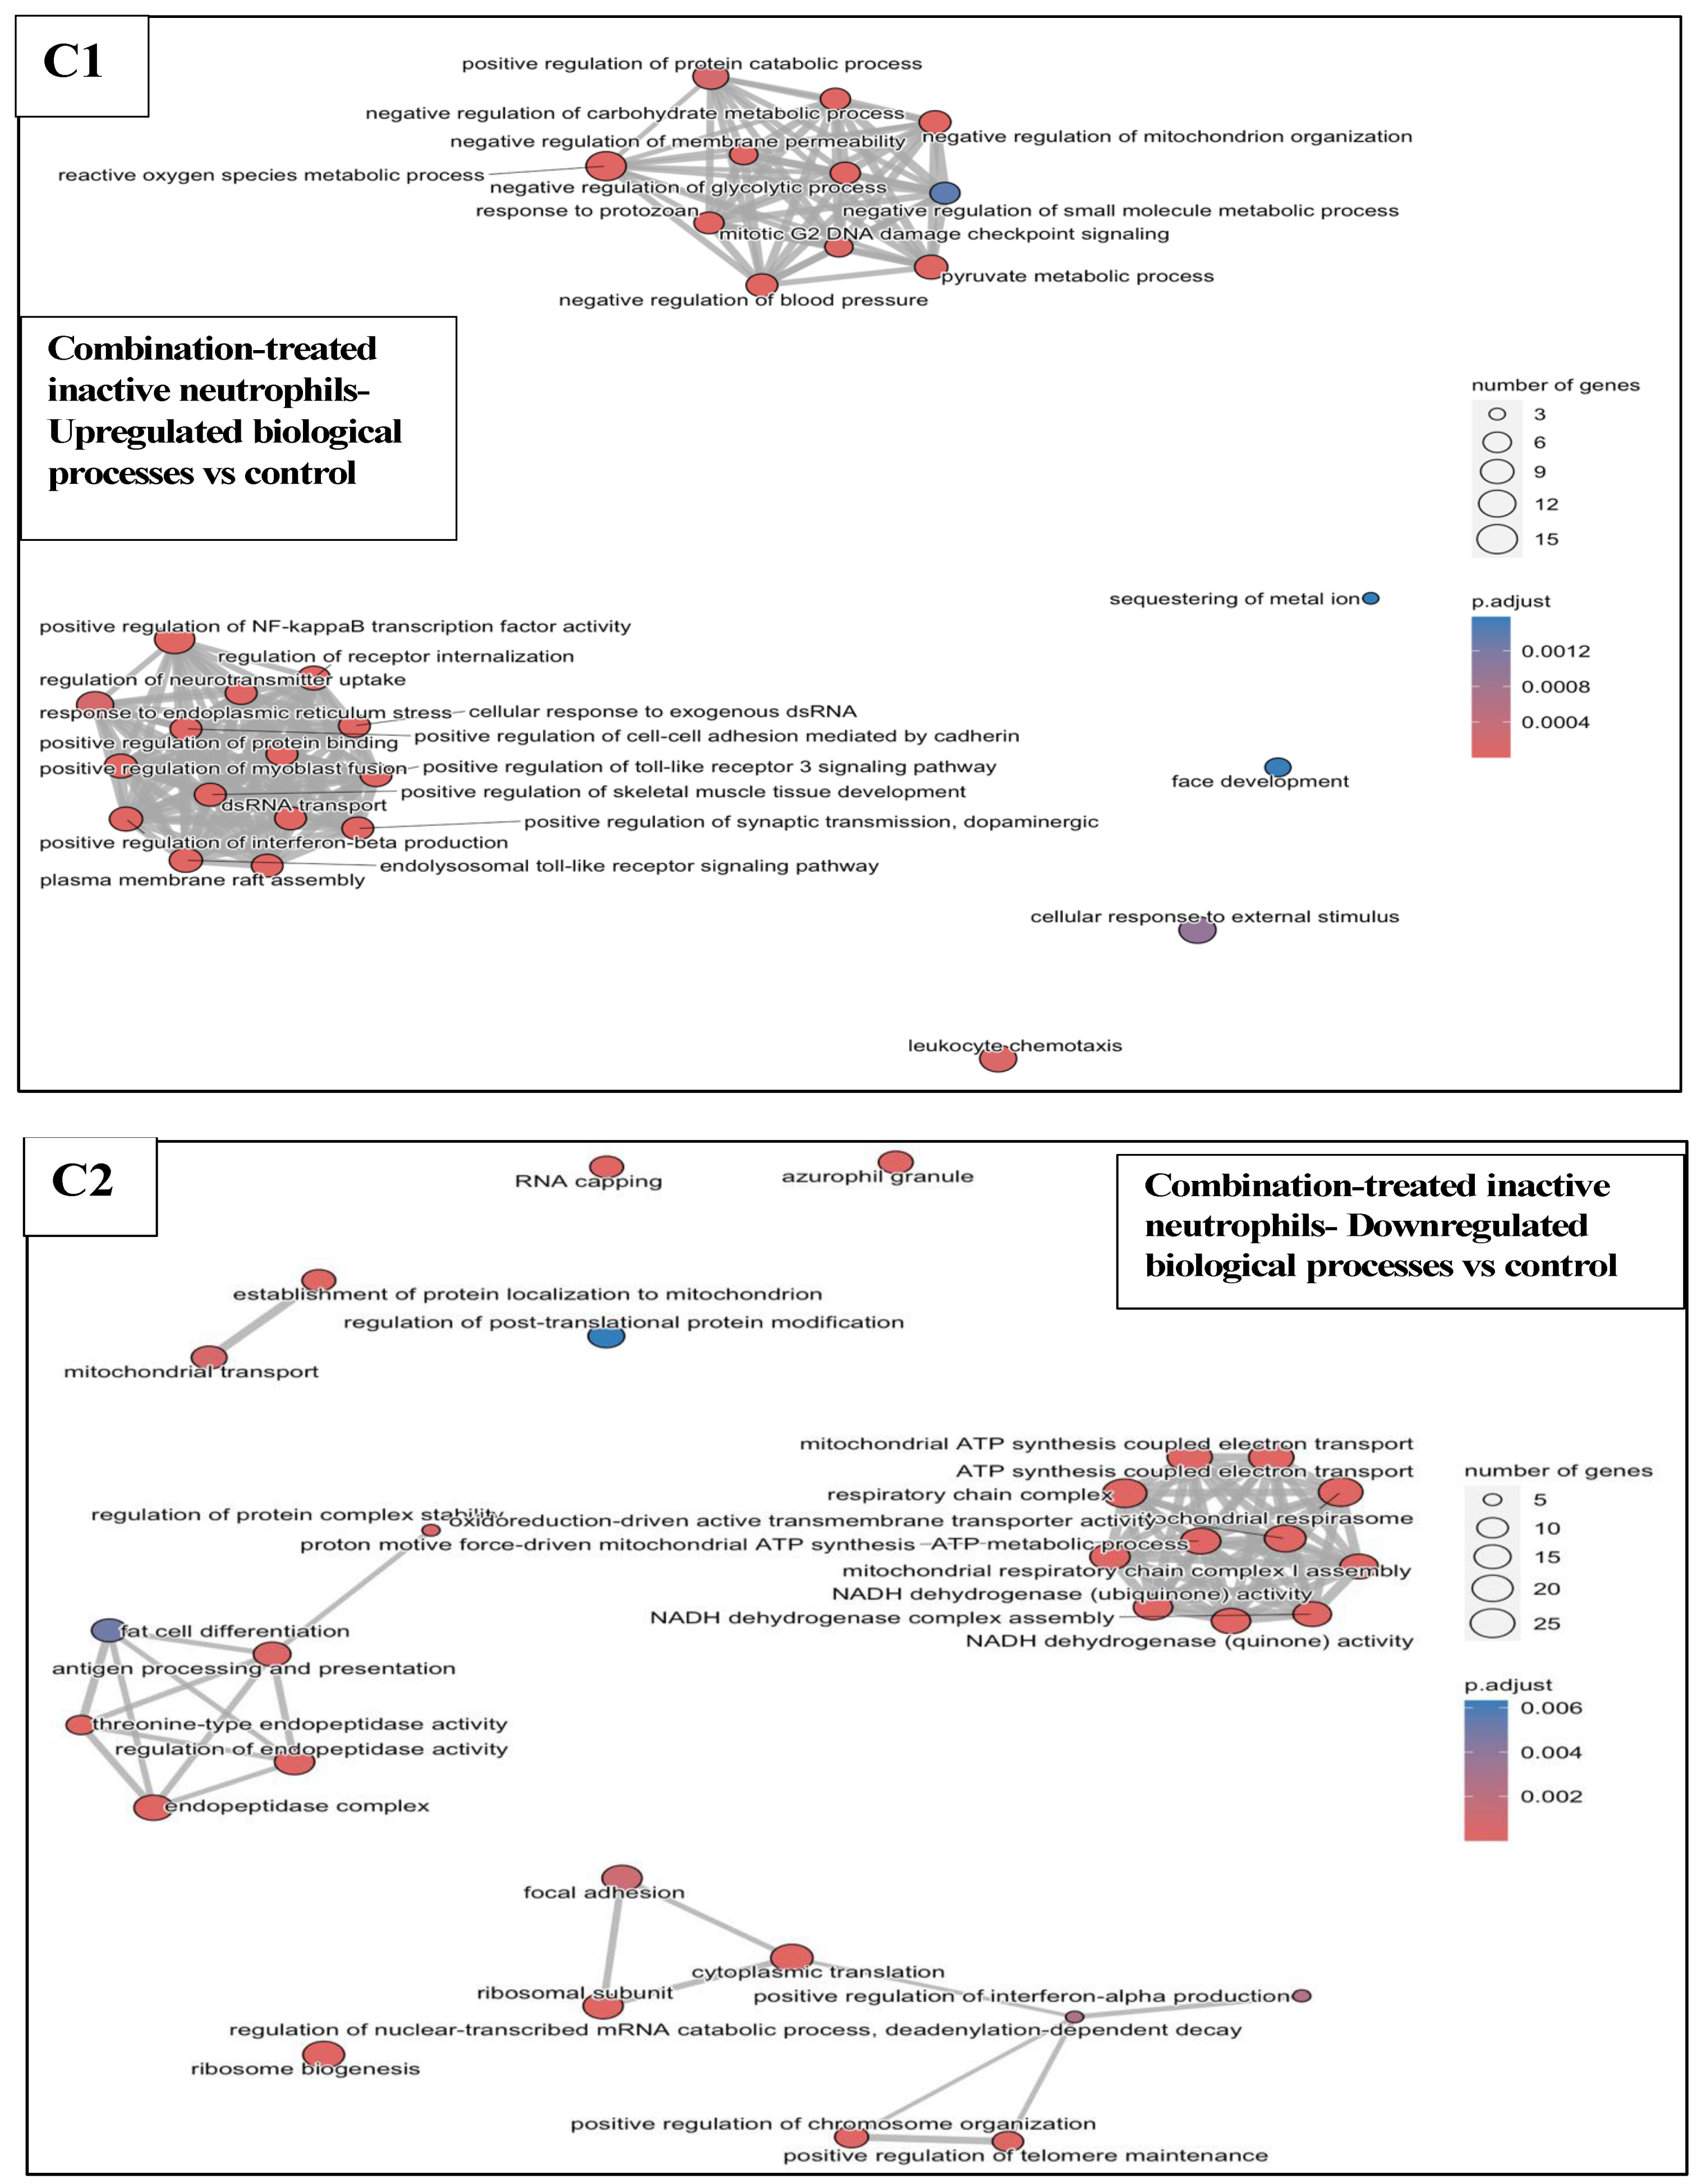
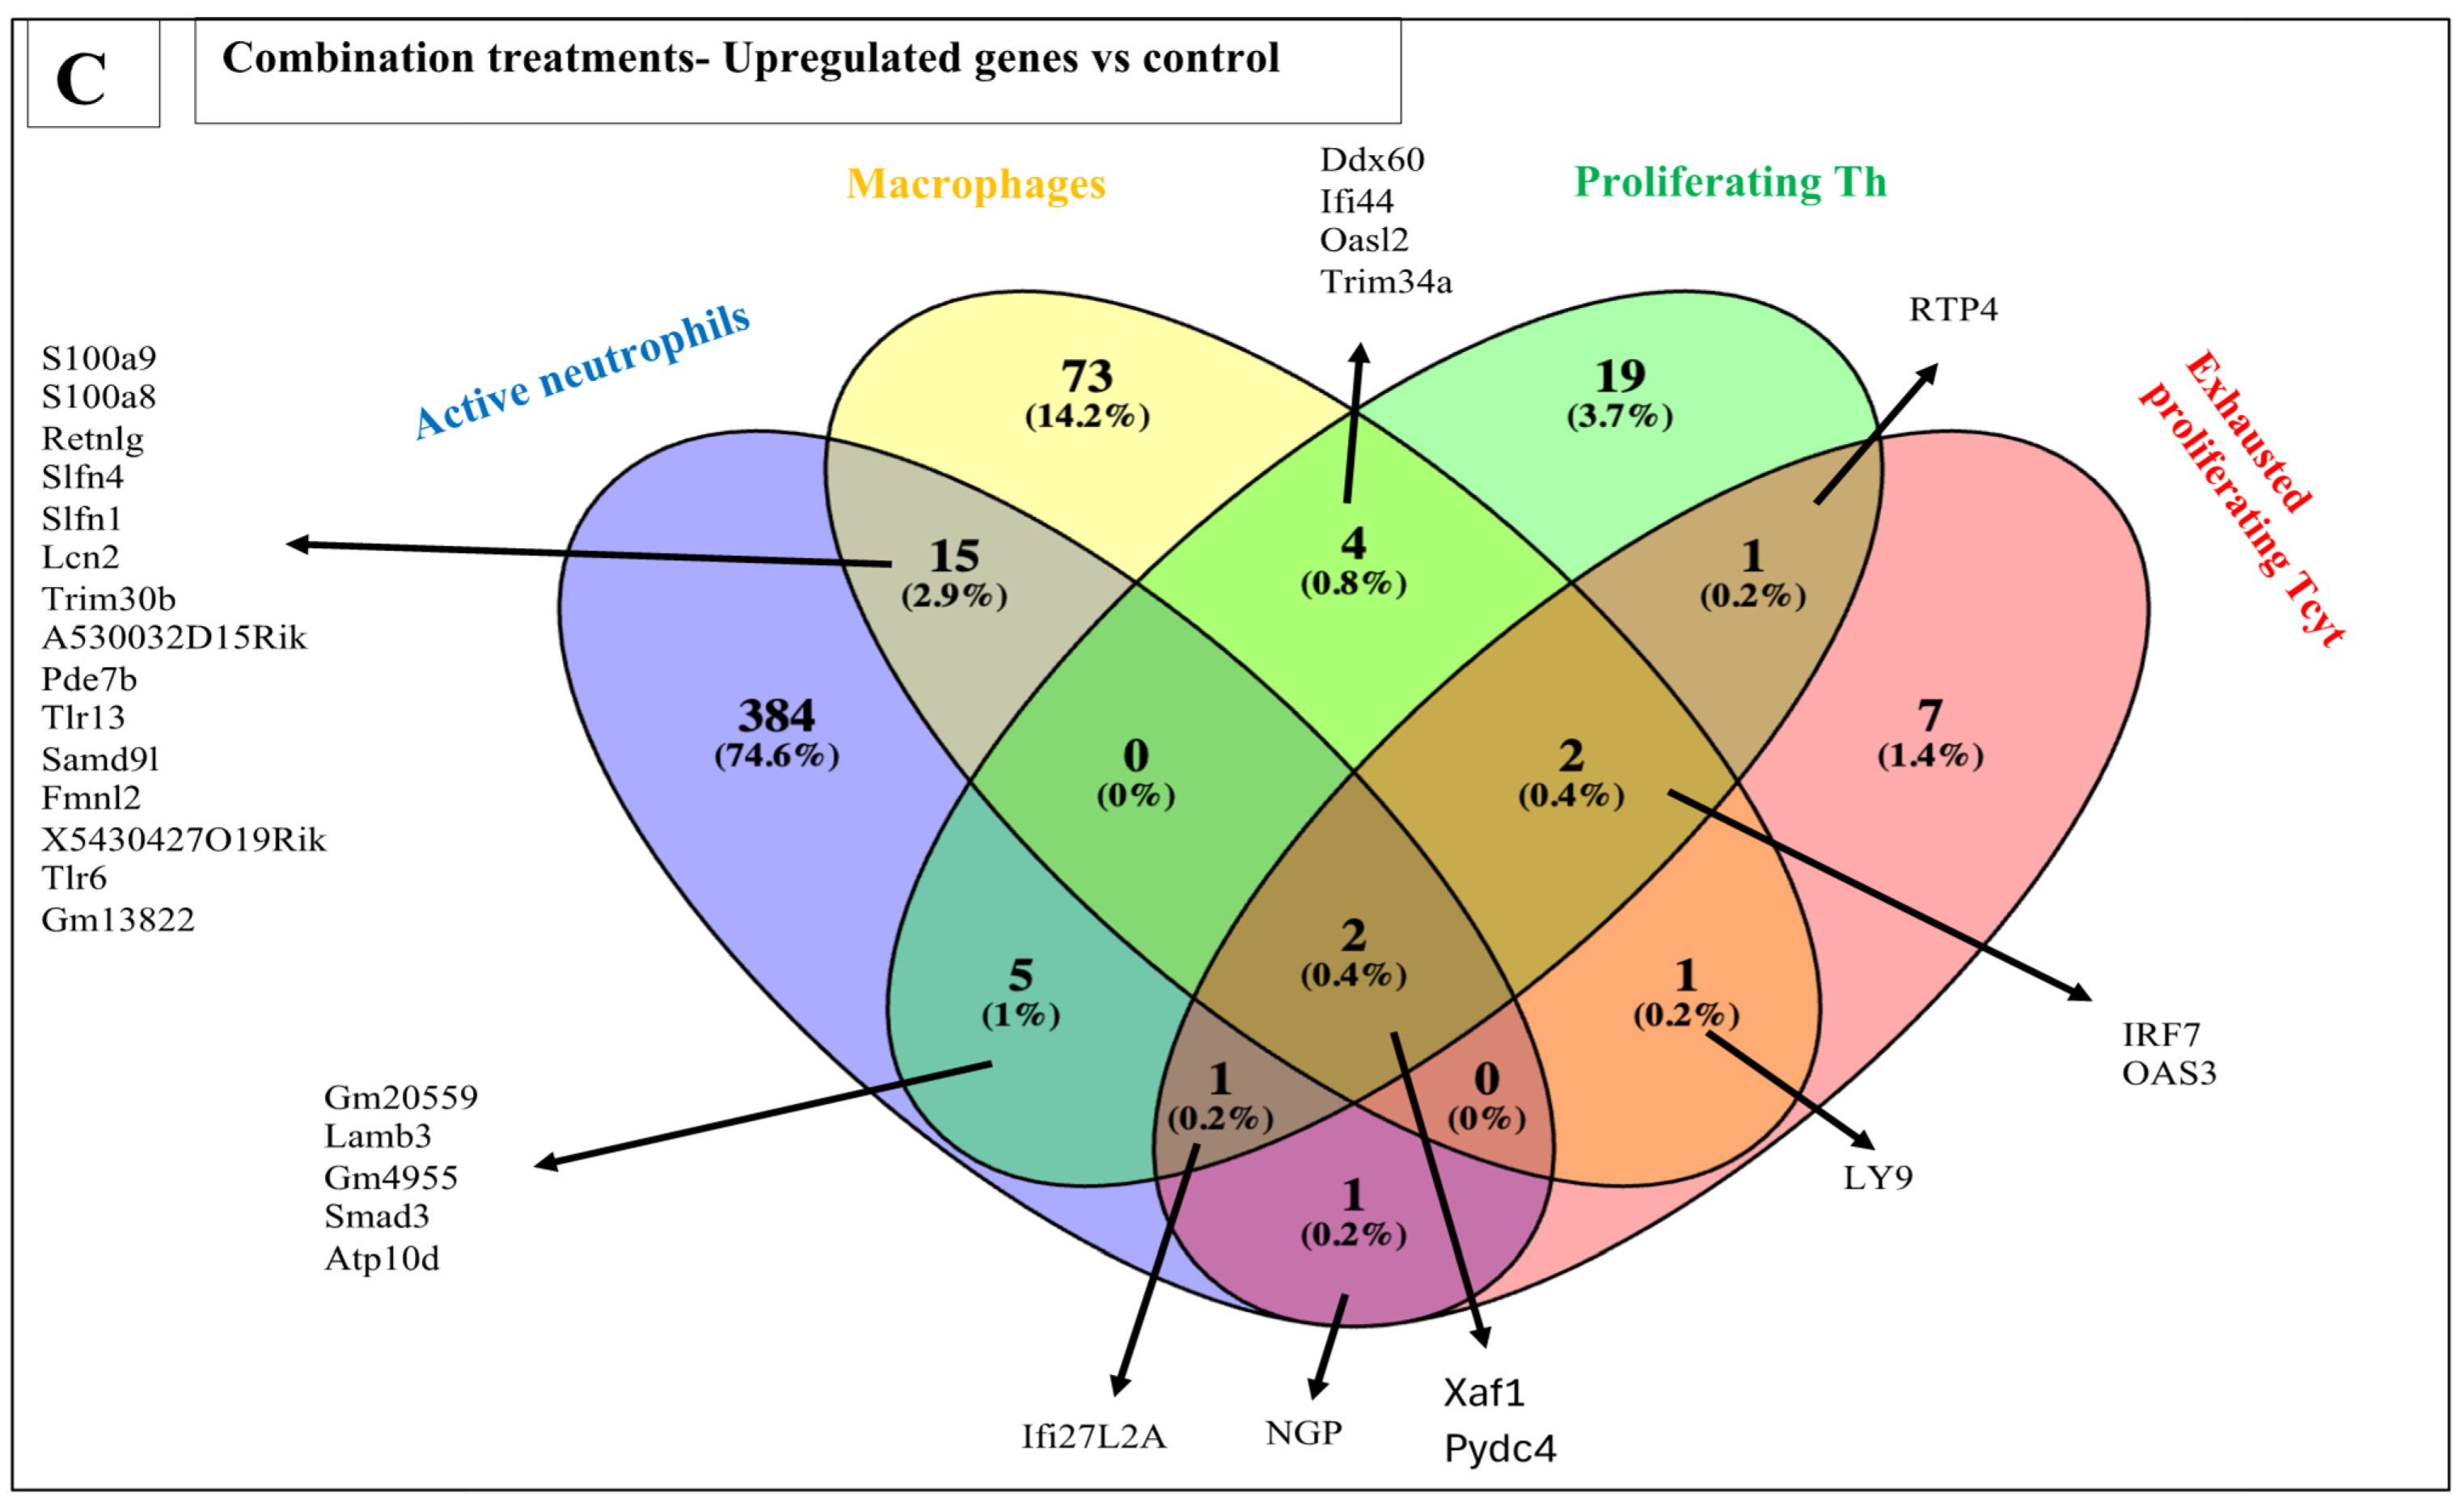
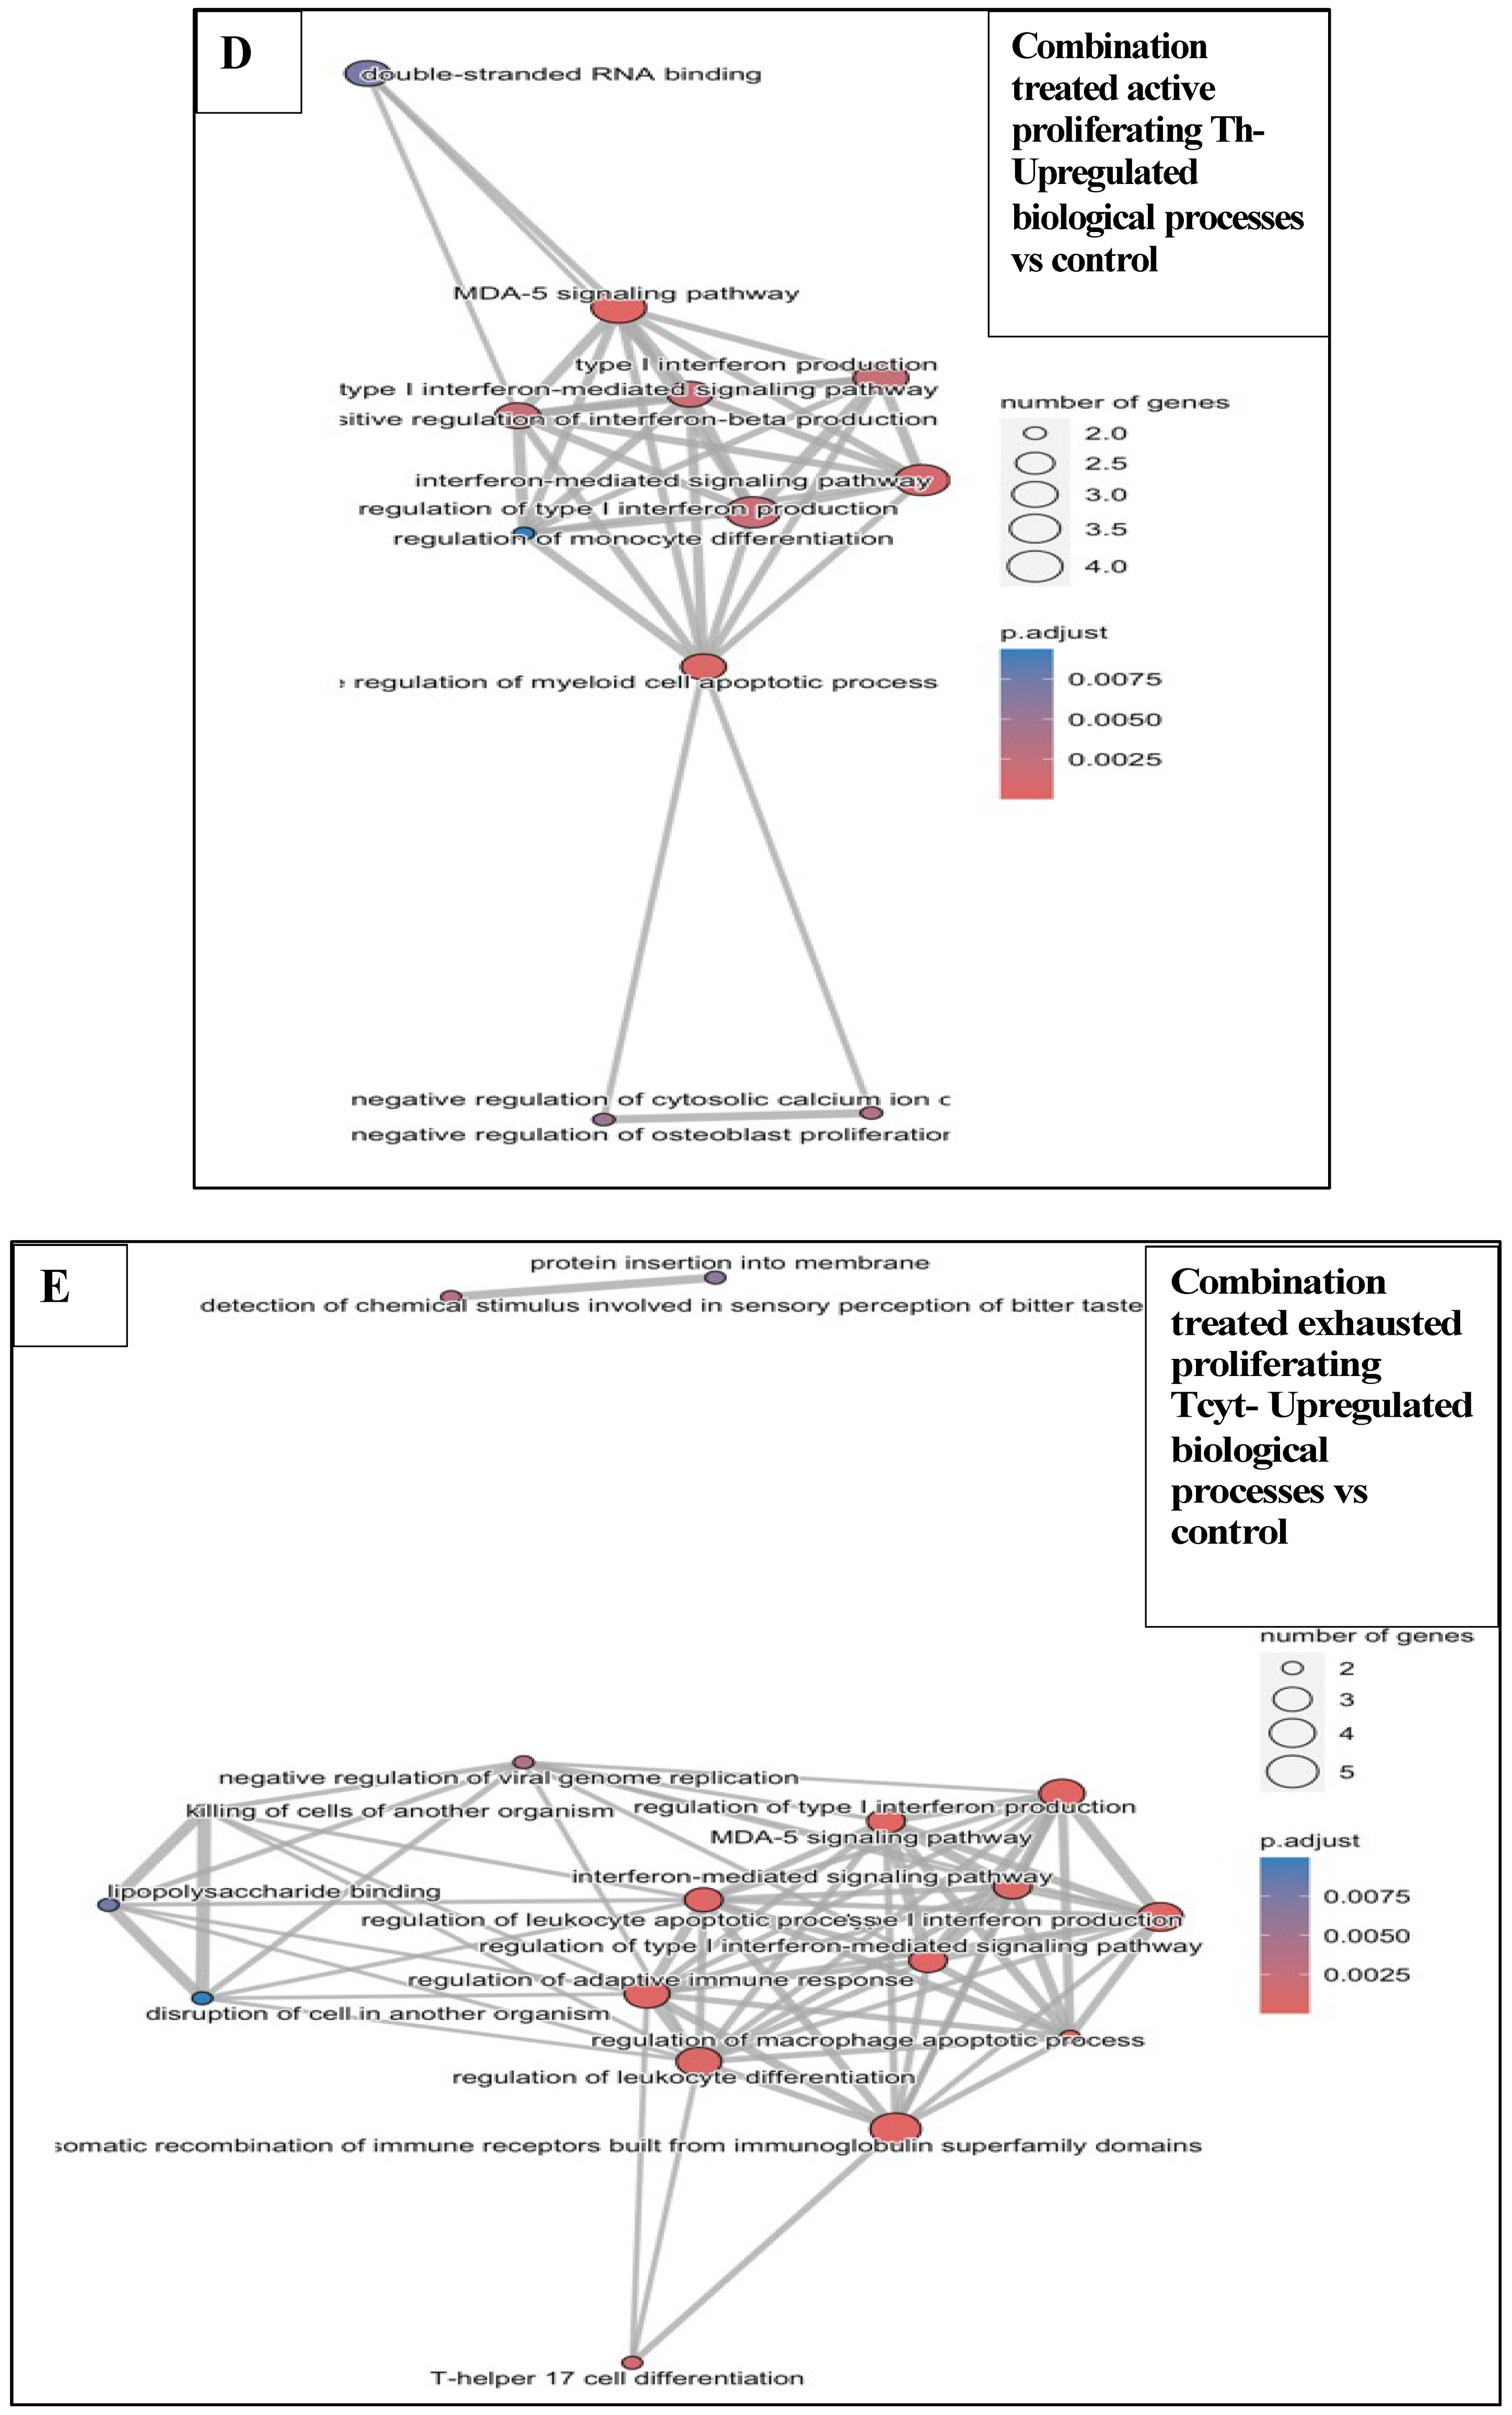
3.6.3. Combination Treatments vs. Sham-Exposed Controls
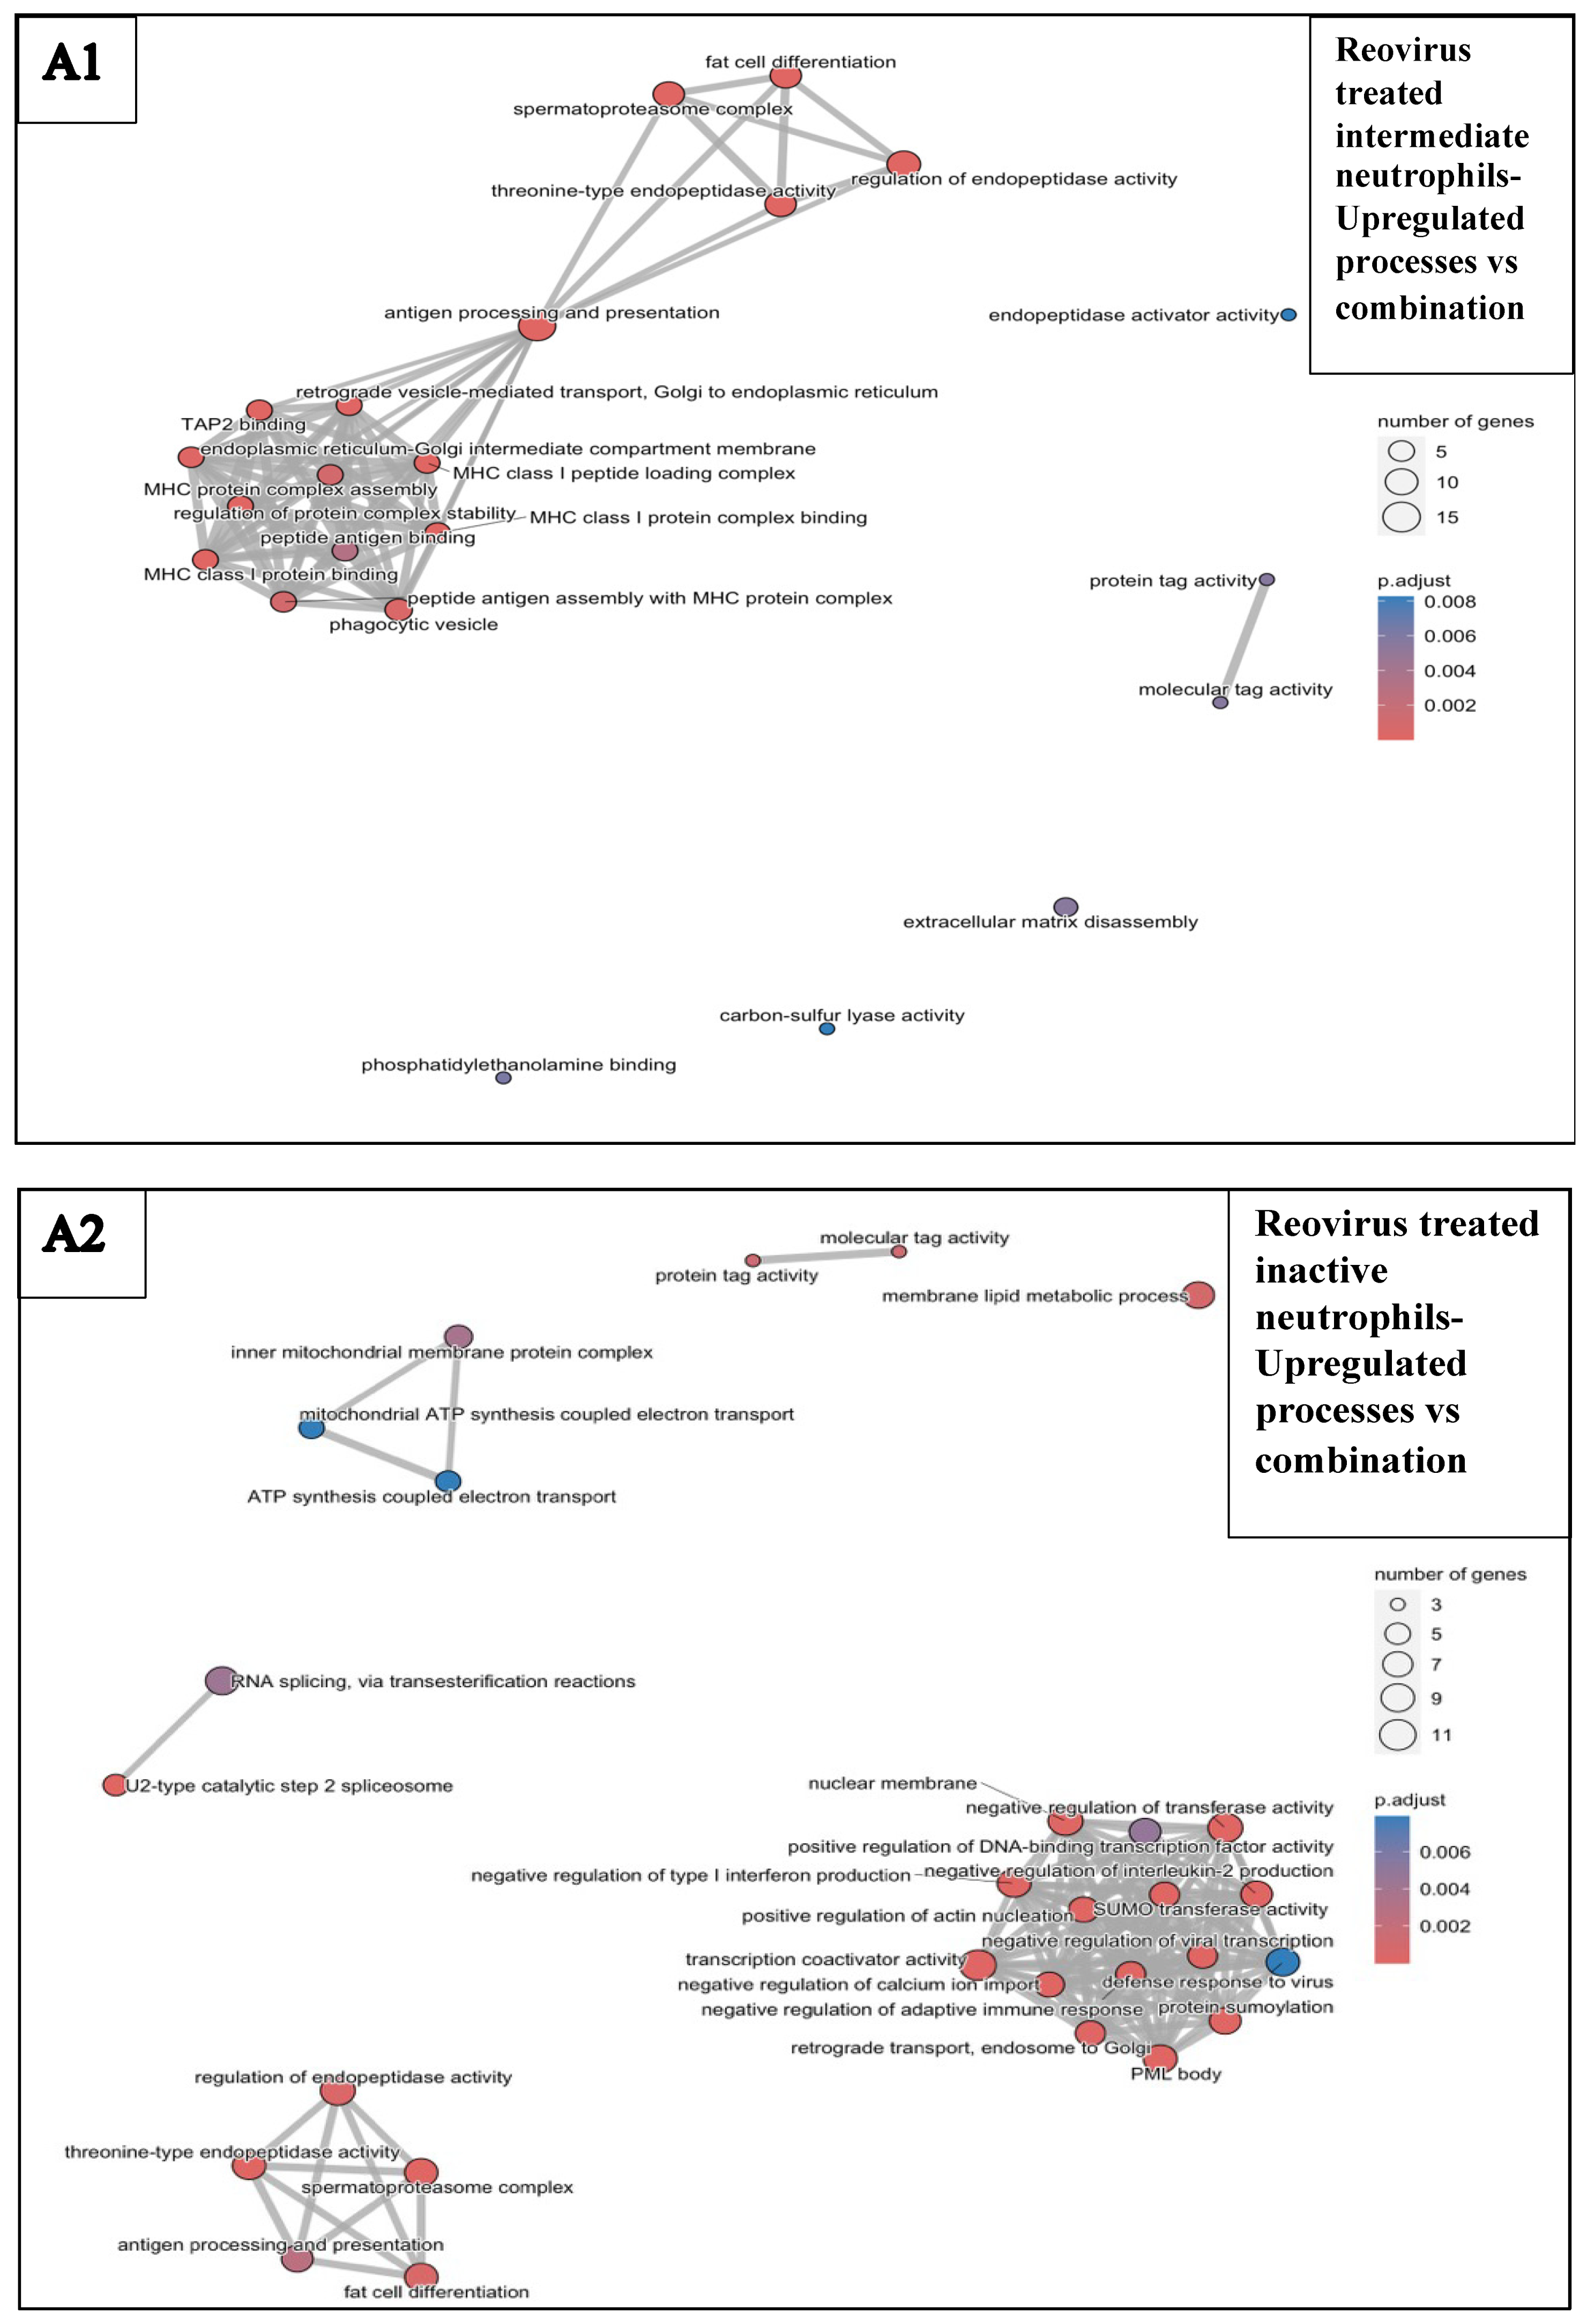
3.6.4. Combination Treatments vs. Reovirus-Alone and BH-Alone Groups
4. Discussion
5. Conclusions
Author Contributions
Funding
Institutional Review Board Statement
Informed Consent Statement
Data Availability Statement
Acknowledgments
Conflicts of Interest
Abbreviations
| BH | Boiling histotripsy |
| d.c. | Duty cycle |
| prf | Pulse repetition frequency |
| P− | Peak negative pressure |
| DC | Dendritic cells |
| NK | Natural killer cells |
| Th | CD4+ T helper cells |
| Tcyt | CD8+ T cytotoxic cells |
| MDSC | Myeloid derived suppressor cells |
| H&E | Haematoxylin and eosin |
| PDAC | Pancreatic ductal adenocarcinoma |
| TME | Tumour microenvironment |
| MHC | Major histocompatibility complex |
| TAP | Transporter associated with antigen processing |
| OV | Oncolytic virus |
| TRM | Tissue resident memory |
| SEM | Standard error of the mean |
| NLR | Neutrophil to lymphocyte ratio |
Appendix A
Appendix B
| AbSeq Ab | Sequence ID | Barcode Seq |
|---|---|---|
| CD172a(SIRPa) | AMM2097 | CGTGGTGAGTTGCGAGTGTGCGTATTATTATCTATG |
| CD19 | AMM2007 | AAGCATGTCGTTTGTGGCGTACTATTAAGGTGAAGC |
| CD11c | AMM2008 | ATTGGGCGTAAAGGGTAAGGCGGTATATGGACTGTG |
| CD44 | AMM2010 | CATGGGTTGTCTCGTTGTAAGTAGTATAGTTGCTGC |
| TCR B CHN | AMM2021 | CAGGTATTAGGAAGATTAGGCCGTTATGATTGGAGC |
| F4/80 | AMM2028 | GTCGTGGTCGGATAGCGTGTAGGTTTAAAGTAGAGG |
| H-2kb | AMM2060 | CGGTATATATCTCGGAGGTAAGCGTCGCGGAAATGT |
| I-Ab | AMM2078 | TGAGGTGTTATGTCGTTAGGGTCGTAGTGAAATTGC |
| Ly-6G | AMM2009 | AACAATAGGGATGCGGGATAAGAATACGAAAGGAGT |
| Ly-6G/C | AMM2015 | CATTGCGAGGAGTAAGGCGATATCTAGTTGTGCTGG |
| CD103 | AMM2168 | CAATATAATAGCCGGTAGGTGTAGTGCGTAATCAGG |
| CD3e | AMM2001 | GAGATAGGCTAGTTGGATAATTGCGCGGTGAGAGTC |
| CD4 | AMM2002 | GTTTAGCGTAGGGTGCATTAGAGCGAGTTAGCGAGT |
| NK-1.1 | AMM2017 | GGTCTGGGATTCGTATAGTTCGCGGTAGTTGAGCTT |
| CD62L | AMM2018 | TAGGAGAGATTCGTGGTAGATTTAGCGTAGGTCATT |
| CD8+ lymphocytes | ||||||||||
| Clusters | Additional annotation genes—Relative expression—AvgLog2Fc > 1 (dark green), 0.5 < AvgLog2Fc < 1 (light green), 0.25 < AvgLog2FC < 0.5 (amber), AvgLog2FC < 0.25 (red). | |||||||||
| Terminally Exhausted Tcyt | MZB1 | DERL3 | CRELD2 | CDK8 | PIK3CG | Ribosomal proteins | SLPI | SPP1 | AIM1 | TCRG.C4 |
| Exhausted Tcyt | MZB1 | DERL3 | CRELD2 | CDK8 | PIK3CG | SLP1 | SPP1 | AIM1 | TCRG.C4 | |
| Natural killer, dendritic, B cells, macrophages/monocytes, damaged, MDSC and SIRPα+ cells—Relative expression of annotation genes- AvgLog2Fc > 1 (dark green), 0.5 < AvgLog2Fc < 1 (light green), 0.25 < AvgLog2FC < 0.5 (amber), AvgLog2FC < 0.25 (red). | ||||||||||||||||||||
| Clusters | Annotation genes | |||||||||||||||||||
| NK | KLRB1 | CD3e | CD8a | GZMB | FASL | KLRK1 | KLRC1 | IL7R | TBET | EOMES | ||||||||||
| DC | ITGAX | CLEC9A | XCR1 | CD40 | CD86 | CD83 | TIM3 | CCR7 | ITGAE | |||||||||||
| B cells | CD24a | CD38 | CD19 | CCR7 | CD69 | MS4A1 | IGHD | CD86 | CR2 | CD69 | CYBB | |||||||||
| B transitioning | CD24a | CD38 | CD19 | CCR7 | CD69 | MS4A1 | IGHD | CD86 | CR2 | CD69 | CYBB | |||||||||
| Macrophages | ITGAX | ITGB2 | CD86 | ADGRE1 | CD68 | ARG1 | FCGR1 | FCGR3 | ITGAM | CCR2 | CSF1R | CYBB | CCR5 | MRC1 | CCL2 | IFITM1 | S100A8 | |||
| Inflammatory Monocytes | CD14 | iNOS | SELL | TNFRSF1α | ITGB2 | CD86 | ADGRE1 | CD68 | ARG1 | FCGR1 | FCGR3 | ITGAM | CCR2 | CSF1R | CYBB | CCR5 | MRC1 | CCL2 | IFITM1 | S100A8 |
| MDSC-enriched | CD33 | CD14 | iNOS | SELL | PDL1 | ADGRE1 | CD68 | ARG1 | FCGR1 | FCGR3 | ITGAM | CCR2 | CSF1R | CYBB | RETNLG | MRC1 | CCL2 | IFITM1 | S100A8 | |
| Damaged cells | MALAT1 | Mitochondrial genes | ||||||||||||||||||
| SIRPα+ cells | ADGRE1 | CD3e | CD68 | CD44 | ITGAX | CD86 | CD14 | CD16 | SELL | CD8α | ITGAL | FAS | CTLA4 | |||||||
| p-Values (Cell Abundance) | Control vs. Reovirus | Control vs. BH | Control vs. Combination |
|---|---|---|---|
| Macrophages | 0.019 | 0.997 | 0.019 |
| Senescent Tcyt | 0.759 | 0.110 | 0.158 |
| Active neutrophils | 0.423 | 0.123 | 0.135 |
| Exhausted proliferating Tcyt | 0.996 | 0.718 | 0.741 |
| Terminal exhausted Tcyt | 0.904 | 0.730 | 0.112 |
| Active Th | 0.844 | 0.437 | 0.635 |
| Intermediate neutrophils | 0.759 | 0.193 | 0.125 |
| Inflammatory monocytes | 0.604 | 0.470 | 0.174 |
| TRM CD8T | 0.286 | 0.062 | 0.046 |
| Proliferating active Th | 0.515 | 0.153 | 0.007 |
| Tcyt subset1 | 0.945 | 0.896 | 0.273 |
| B cells | 0.647 | 0.344 | 0.095 |
| Inactive neutrophils | 0.784 | 0.546 | 0.497 |
| DC | 0.366 | 0.991 | 0.365 |
| Exhausted Tcyt | 0.833 | 0.520 | 0.199 |
| Damaged cells | 0.546 | 0.188 | 0.470 |
| NK | 0.855 | 0.728 | 0.147 |
| Treg | 0.823 | 0.016 | 0.004 |
| Transitioning neutrophils | 0.426 | 0.027 | 0.089 |
| Tcyt subset2 | 0.838 | 0.763 | 0.258 |
| Naïve/inactive Th | 0.819 | 0.769 | 0.285 |
| Inactive neutrophils subset | 0.907 | 0.513 | 0.758 |
| Proliferating Tcyt | 0.225 | 0.016 | 0.310 |
| MDSC-enriched | 0.951 | 0.220 | 0.268 |
| Active neutrophils subset | 0.625 | 0.750 | 0.127 |
| Intermediate neutrophils subset | 0.967 | 0.356 | 0.759 |
| B transitioning | 0.515 | 0.483 | 0.629 |
| Non-proliferating Tcyt | 0.939 | 0.813 | 0.771 |
| SIRPa+ cells | 0.947 | 0.632 | 0.928 |
| Tfh | 0.221 | 0.720 | 0.371 |
| p-Values (Cell Ratios over Treg) | Control vs. Reovirus | Control vs. BH | Control vs. Combination |
|---|---|---|---|
| Macrophages | 0.031 | 0.0132 | 0.056 |
| Senescent Tcyt | 0.892 | 0.798 | 0.079 |
| Active neutrophils | 0.368 | 0.025 | 0.046 |
| Exhausted proliferating Tcyt | 0.930 | 0.441 | 0.095 |
| Terminal exhausted Tcyt | 0.957 | 0.038 | 0.053 |
| Active Th | 0.984 | 0.034 | 0.016 |
| Intermediate neutrophils | 0.664 | 0.010 | 0.013 |
| Inflammatory monocytes | 0.491 | 0.004 | 0.003 |
| TRM CD8T | 0.383 | 0.231 | 0.244 |
| Proliferating active Th | 0.688 | 0.097 | 0.002 |
| Tcyt subset1 | 0.866 | 0.119 | 0.560 |
| B cells | 0.587 | 0.168 | 0.850 |
| Inactive neutrophils | 0.753 | 0.979 | 0.128 |
| DC | 0.27 | 0.030 | 0.009 |
| Exhausted Tcyt | 0.709 | 0.008 | 0.039 |
| Damaged cells | 0.461 | 0.003 | 0.001 |
| NK | 0.990 | 0.058 | 0.041 |
| Transitioning neutrophils | 0.385 | 0.003 | 0.016 |
| Tcyt subset2 | 0.928 | 0.043 | 0.361 |
| Naïve/inactive Th | 0.735 | 0.074 | 0.317 |
| Inactive neutrophils subset | 0.874 | 0.876 | 0.234 |
| Proliferating Tcyt | 0.152 | 0.252 | 0.049 |
| MDSC-enriched | 0.866 | 0.047 | 0.051 |
| Active neutrophils subset | 0.600 | 0.780 | 0.076 |
| Intermediate neutrophils subset | 0.997 | 0.566 | 0.160 |
| B transitioning | 0.539 | 0.833 | 0.631 |
| Non-proliferating Tcyt | 0.978 | 0.536 | 0.219 |
| SIRPa+ cells | 0.991 | 0.841 | 0.161 |
| Tfh | 0.188 | 0.554 | 0.120 |
Appendix C







References
- World Cancer Research Fund Pancreatic Cancer Statistics. Available online: https://www.wcrf.org/cancer-trends/pancreatic-cancer-statistics/ (accessed on 24 October 2024).
- Conroy, T.; Hammel, P.; Hebbar, M.; Ben Abdelghani, M.; Wei, A.C.; Raoul, J.L.; Choné, L.; Francois, E.; Artru, P.; Biagi, J.J.; et al. FOLFIRINOX or Gemcitabine as Adjuvant Therapy for Pancreatic Cancer. N. Engl. J. Med. 2018, 379, 2395–2406. [Google Scholar] [CrossRef] [PubMed]
- Conroy, T.; Desseigne, F.; Ychou, M.; Bouché, O.; Guimbaud, R.; Bécouarn, Y.; Adenis, A.; Raoul, J.L.; Gourgou-Bourgade, S.; de la Fouchardière, C.; et al. FOLFIRINOX vs. Gemcitabine Metastatic Pancreatic Cancer. N. Engl. J. Med. 2011, 364, 1817–1825. [Google Scholar] [CrossRef] [PubMed]
- Goldstein, D.; El-Maraghi, R.H.; Hammel, P.; Heinemann, V.; Kunzmann, V.; Sastre, J.; Scheithauer, W.; Siena, S.; Tabernero, J.; Teixeira, L.; et al. nab-Paclitaxel plus gemcitabine for metastatic pancreatic cancer: Long-term survival from a phase III trial. J. Natl. Cancer Inst. 2015, 107, dju413. [Google Scholar] [CrossRef] [PubMed]
- Provenzano, P.P.; Cuevas, C.; Chang, A.E.; Goel, V.K.; Von Hoff, D.D.; Hingorani, S.R. Enzymatic targeting of the stroma ablates physical barriers to treatment of pancreatic ductal adenocarcinoma. Cancer Cell 2012, 21, 418–429. [Google Scholar] [CrossRef] [PubMed]
- Olive, K.P.; Jacobetz, M.A.; Davidson, C.J.; Gopinathan, A.; McIntyre, D.; Honess, D.; Madhu, B.; Goldgraben, M.A.; Caldwell, M.E.; Allard, D.; et al. Inhibition of Hedgehog signaling enhances delivery of chemotherapy in a mouse model of pancreatic cancer. Science 2009, 324, 1457–1461. [Google Scholar] [CrossRef] [PubMed]
- Bear, A.S.; Vonderheide, R.H.; O’Hara, M.H. Challenges and Opportunities for Pancreatic Cancer Immunotherapy. Cancer Cell 2020, 38, 788–802. [Google Scholar] [CrossRef] [PubMed]
- Harrington, K.; Freeman, D.J.; Kelly, B.; Harper, J.; Soria, J.C. Optimizing oncolytic virotherapy in cancer treatment. Nat. Rev. Drug Discov. 2019, 18, 689–706. [Google Scholar] [CrossRef] [PubMed]
- Howells, A.; Marelli, G.; Lemoine, N.R.; Wang, Y. Oncolytic Viruses-Interaction of Virus and Tumor Cells in the Battle to Eliminate Cancer. Front. Oncol. 2017, 7, 195. [Google Scholar] [CrossRef] [PubMed]
- Marcato, P.; Shmulevitz, M.; Pan, D.; Stoltz, D.; Lee, P. Ras transformation mediates reovirus oncolysis by enhancing virus uncoating, particle infectivity, and apoptosis dependent release. Mol. Ther. 2007, 15, 1522–1530. [Google Scholar] [CrossRef] [PubMed]
- Noonan, A.M.; Farren, M.R.; Geyer, S.M.; Huang, Y.; Tahiri, S.; Ahn, D.; Mikhail, S.; Ciombor, K.K.; Pant, S.; Aparo, S.; et al. Randomized Phase 2 Trial of the Oncolytic Virus Pelareorep (Reolysin) in Upfront Treatment of Metastatic Pancreatic Adenocarcinoma. Mol. Ther. 2016, 24, 1150–1158. [Google Scholar] [CrossRef] [PubMed]
- Farren, M.R.; Mace, T.A.; Geyer, S.; Mikhail, S.; Wu, C.; Ciombor, K.; Tahiri, S.; Ahn, D.; Noonan, A.M.; Villalona-Calero, M.; et al. Systemic Immune Activity Predicts Overall Survival in Treatment-Naïve Patients with Metastatic Pancreatic Cancer. Clin. Cancer Res. 2016, 22, 2565–2574. [Google Scholar] [CrossRef] [PubMed]
- Mahalingam, D.; Goel, S.; Aparo, S.; Patel Arora, S.; Noronha, N.; Tran, H.; Chakrabarty, R.; Selvaggi, G.; Gutierrez, A.; Coffey, M. A Phase II Study of Pelareorep (REOLYSIN®) in Combination with Gemcitabine for Patients with Advanced Pancreatic Adenocarcinoma. Cancers 2018, 10, 160. [Google Scholar] [CrossRef] [PubMed]
- Mahalingam, D.; Chen, S.; Xie, P.; Loghmani, H.; Heineman, T.; Kalyan, A.; Kircher, S.; Helenowski, I.B.; Mi, X.; Maurer, V.; et al. Combination of pembrolizumab and pelareorep promotes anti-tumour immunity in advanced pancreatic adenocarcinoma (PDAC). Br. J. Cancer 2023, 129, 782–790. [Google Scholar] [CrossRef] [PubMed]
- Mahalingam, D.; Wilkinson, G.A.; Eng, K.H.; Fields, P.; Raber, P.; Moseley, J.L.; Cheetham, K.; Coffey, M.; Nuovo, G.; Kalinski, P.; et al. Pembrolizumab in Combination with the Oncolytic Virus Pelareorep and Chemotherapy in Patients with Advanced Pancreatic Adenocarcinoma: A Phase Ib Study. Clin. Cancer Res. 2020, 26, 71–81. [Google Scholar] [CrossRef] [PubMed]
- McLaughlan, J.; Rivens, I.; Leighton, T.; Ter Haar, G. A study of bubble activity generated in ex vivo tissue by high intensity focused ultrasound. Ultrasound Med. Biol. 2010, 36, 1327–1344. [Google Scholar] [CrossRef] [PubMed]
- FUSF State of the Field Report. Available online: https://www.fusfoundation.org/the-foundation/foundation-reports/state-of-the-field-report-2024/ (accessed on 25 May 2025).
- Mouratidis, P.X.; Rivens, I.; Ter Haar, G. A study of thermal dose-induced autophagy, apoptosis and necroptosis in colon cancer cells. Int. J. Hyperthermia 2015, 31, 476–488. [Google Scholar] [CrossRef] [PubMed]
- Bader, K.B.; Vlaisavljevich, E.; Maxwell, A.D. For Whom the Bubble Grows: Physical Principles of Bubble Nucleation and Dynamics in Histotripsy Ultrasound Therapy. Ultrasound Med. Biol. 2019, 45, 1056–1080. [Google Scholar] [CrossRef] [PubMed]
- Mouratidis, P.X.; ter Haar, G. Latest Advances in the Use of Therapeutic Focused Ultrasound in the Treatment of Pancreatic Cancer. Cancers 2022, 14, 638. [Google Scholar] [CrossRef] [PubMed]
- Vidal-Jove, J.; Serres, X.; Vlaisavljevich, E.; Cannata, J.; Duryea, A.; Miller, R.; Merino, X.; Velat, M.; Kam, Y.; Bolduan, R.; et al. First-in-man histotripsy of hepatic tumors: The THERESA trial, a feasibility study. Int. J. Hyperth. 2022, 39, 1115–1123. [Google Scholar] [CrossRef] [PubMed]
- Mendiratta-Lala, M.; Wiggermann, P.; Pech, M.; Serres-Créixams, X.; White, S.B.; Davis, C.; Ahmed, O.; Parikh, N.D.; Planert, M.; Thormann, M.; et al. The #HOPE4LIVER Single-Arm Pivotal Trial for Histotripsy of Primary and Metastatic Liver Tumors. Radiology 2024, 312, e233051. [Google Scholar] [CrossRef] [PubMed]
- Xu, Z.; Hall, T.L.; Vlaisavljevich, E.; Lee, F.T., Jr. Histotripsy: The first noninvasive, non-ionizing, non-thermal ablation technique based on ultrasound. Int. J. Hyperth. 2021, 38, 561–575. [Google Scholar] [CrossRef] [PubMed]
- Mouratidis, P.X.; Costa, M.; Rivens, I.; Repasky, E.; ter Haar, G. Pulsed focused ultrasound can improve the anticancer effects of immune checkpoint inhibitors in murine pancreatic cancer. J. R. Soc. Interface 2021, 18, 20210266. [Google Scholar] [CrossRef] [PubMed]
- Roulstone, V.; Twigger, K.; Zaidi, S.; Pencavel, T.; Kyula, J.N.; White, C.; McLaughlin, M.; Seth, R.; Karapanagiotou, E.M.; Mansfield, D.; et al. Synergistic cytotoxicity of oncolytic reovirus in combination with cisplatin-paclitaxel doublet chemotherapy. Gene Ther. 2013, 20, 521–528. [Google Scholar] [CrossRef] [PubMed]
- McEntee, G.; Kyula, J.N.; Mansfield, D.; Smith, H.; Wilkinson, M.; Gregory, C.; Roulstone, V.; Coffey, M.; Harrington, K.J. Enhanced cytotoxicity of reovirus and radiotherapy in melanoma cells is mediated through increased viral replication and mitochondrial apoptotic signalling. Oncotarget 2016, 7, 48517–48532. [Google Scholar] [CrossRef] [PubMed][Green Version]
- Hendricks-Wenger, A.; Sereno, J.; Gannon, J.; Zeher, A.; Brock, R.M.; Beitel-White, N.; Simon, A.; Davalos, R.V.; Coutermarsh-Ott, S.; Vlaisavljevich, E.; et al. Histotripsy Ablation Alters the Tumor Microenvironment and Promotes Immune System Activation in a Subcutaneous Model of Pancreatic Cancer. IEEE Trans. Ultrason. Ferroelectr. Freq. Control 2021, 68, 2987–3000. [Google Scholar] [CrossRef] [PubMed]
- Adunka, T. Characterization of Murine Pancreatic Carcinoma Models Regarding Immunosuppressive Mechanisms and Therapy with Bifunctional Sirna Targeting Galectin-1. Ph.D. Thesis, Ludwig-Maximilians-Universität zu München, Munich, Germany, 2014; p. 44, section 6.1.2. [Google Scholar]
- Aydin, O.; Chandran, P.; Lorsung, R.R.; Cohen, G.; Burks, S.R.; Frank, J.A. The Proteomic Effects of Pulsed Focused Ultrasound on Tumor Microenvironments of Murine Melanoma and Breast Cancer Models. Ultrasound Med. Biol. 2019, 45, 3232–3245. [Google Scholar] [CrossRef] [PubMed]
- Cohen, G.; Chandran, P.; Lorsung, R.M.; Tomlinson, L.E.; Sundby, M.; Burks, S.R.; Frank, J.A. The Impact of Focused Ultrasound in Two Tumor Models: Temporal Alterations in the Natural History on Tumor Microenvironment and Immune Cell Response. Cancers 2020, 12, 350. [Google Scholar] [CrossRef] [PubMed]
- Cohen, G.; Chandran, P.; Lorsung, R.M.; Aydin, O.; Tomlinson, L.E.; Rosenblatt, R.B.; Burks, S.R.; Frank, J.A. Pulsed-Focused Ultrasound Slows B16 Melanoma and 4T1 Breast Tumor Growth through Differential Tumor Microenvironmental Changes. Cancers 2021, 13, 1546. [Google Scholar] [CrossRef] [PubMed]
- Abe, S.; Nagata, H.; Crosby, E.J.; Inoue, Y.; Kaneko, K.; Liu, C.X.; Yang, X.; Wang, T.; Acharya, C.R.; Agarwal, P.; et al. Combination of ultrasound-based mechanical disruption of tumor with immune checkpoint blockade modifies tumor microenvironment and augments systemic antitumor immunity. J. Immunother. Cancer 2022, 10, e003717. [Google Scholar] [CrossRef] [PubMed]
- Ohms, M.; Möller, S.; Laskay, T. An Attempt to Polarize Human Neutrophils Toward N1 and N2 Phenotypes In Vitro. Front. Immunol. 2020, 11, 532. [Google Scholar] [CrossRef] [PubMed]
- Shaul, M.E.; Levy, L.; Sun, J.; Mishalian, I.; Singhal, S.; Kapoor, V.; Horng, W.; Fridlender, G.; Albelda, S.M.; Fridlender, Z.G. Tumor-associated neutrophils display a distinct N1 profile following TGFβ modulation: A transcriptomics analysis of pro- vs. antitumor TANs. Oncoimmunology 2016, 5, e1232221. [Google Scholar] [CrossRef] [PubMed]
- Sanjurjo, L.; Aran, G.; Téllez, E.; Amézaga, N.; Armengol, C.; López, D.; Prats, C.; Sarrias, M.R. CD5L Promotes M2 Macrophage Polarization Through Autophagy-Mediated Upregulation of ID3. Front. Immunol. 2018, 9, 480. [Google Scholar] [CrossRef] [PubMed]
- Haziot, A.; Tsuberi, B.Z.; Goyert, S.M. Neutrophil CD14: Biochemical properties and role in the secretion of tumor necrosis factor-alpha in response to lipopolysaccharide. J. Immunol. 1993, 150, 5556–5565. [Google Scholar] [CrossRef] [PubMed]
- Takenaka, M.C.; Robson, S.; Quintana, F.J. Regulation of the T Cell Response by CD39. Trends Immunol. 2016, 37, 427–439. [Google Scholar] [CrossRef] [PubMed]
- Wang, S.; Song, R.; Wang, Z.; Jing, Z.; Wang, S.; Ma, J. S100A8/A9 in Inflammation. Front. Immunol. 2018, 9, 1298. [Google Scholar] [CrossRef] [PubMed]
- Horn, K.J.; Fulte, S.; Yang, M.; Lorenz, B.P.; Clark, S.E. Neutrophil responsiveness to IL-10 impairs clearance of Streptococcus pneumoniae from the lungs. J. Leukoc. Biol. 2024, 115, 4–15. [Google Scholar] [CrossRef] [PubMed]
- Neely, C.J.; Kartchner, L.B.; Mendoza, A.E.; Linz, B.M.; Frelinger, J.A.; Wolfgang, M.C.; Maile, R.; Cairns, B.A. Flagellin treatment prevents increased susceptibility to systemic bacterial infection after injury by inhibiting anti-inflammatory IL-10+ IL-12- neutrophil polarization. PLoS ONE 2014, 9, e85623. [Google Scholar] [CrossRef] [PubMed]
- Wang, X.; Qiu, L.; Li, Z.; Wang, X.Y.; Yi, H. Understanding the Multifaceted Role of Neutrophils in Cancer and Autoimmune Diseases. Front. Immunol. 2018, 9, 2456. [Google Scholar] [CrossRef] [PubMed]
- Zhou, G.; Yu, L.; Fang, L.; Yang, W.; Yu, T.; Miao, Y.; Chen, M.; Wu, K.; Chen, F.; Cong, Y.; et al. CD177+ neutrophils as functionally activated neutrophils negatively regulate IBD. Gut 2017, 67, 1052–1063. [Google Scholar] [CrossRef] [PubMed]
- Pothoven, K.L.; Norton, J.E.; Suh, L.A.; Carter, R.G.; Harris, K.E.; Biyasheva, A.; Welch, K.; Shintani-Smith, S.; Conley, D.B.; Liu, M.C.; et al. Neutrophils are a major source of the epithelial barrier disrupting cytokine oncostatin M in patients with mucosal airways disease. J. Allergy Clin. Immunol. 2017, 139, 1966–1978.e9. [Google Scholar] [CrossRef] [PubMed]
- SenGupta, S.; Hein, L.E.; Parent, C.A. The Recruitment of Neutrophils to the Tumor Microenvironment Is Regulated by Multiple Mediators. Front. Immunol. 2021, 12, 734188. [Google Scholar] [CrossRef] [PubMed]
- Chen, X.; Wang, N.; Jing, C.; Li, J.; Liu, X.; Yang, Y.; Song, T.; Jia, H. The TGF-β/MMP9/RAGE axis induces sRAGE secretion by neutrophils and promotes oral carcinogenesis. Biochem. Biophys. Rep. 2024, 38, 101676. [Google Scholar] [CrossRef] [PubMed]
- Mihaila, A.C.; Ciortan, L.; Macarie, R.D.; Vadana, M.; Cecoltan, S.; Bogdan Preda, M.; Hudita, A.; Gan, A.M.; Jakobsson, G.; Tucureanu, M.M.; et al. Transcriptional Profiling and Functional Analysis of N1/N2 Neutrophils Reveal an Immunomodulatory Effect of S100A9-Blockade on the Pro-Inflammatory N1 Subpopulation. Front. Immunol. 2021, 12, 708770. [Google Scholar] [CrossRef] [PubMed]
- Zhang, X.; Shi, H.; Yuan, X.; Jiang, P.; Qian, H.; Xu, W. Tumor-derived exosomes induce N2 polarization of neutrophils to promote gastric cancer cell migration. Mol. Cancer. 2018, 17, 146. [Google Scholar] [CrossRef] [PubMed]
- Gutiérrez-Fernández, A.; Inada, M.; Balbín, M.; Fueyo, A.; Pitiot, A.S.; Astudillo, A.; Hirose, K.; Hirata, M.; Shapiro, S.D.; Noël, A.; et al. Increased inflammation delays wound healing in mice deficient in collagenase-2 (MMP-8). FASEB J. 2007, 21, 2580–2591. [Google Scholar] [CrossRef] [PubMed]
- Li, L.; Yang, L.; Chen, X.; Chen, X.; Diao, L.; Zeng, Y.; Xu, J. TNFAIP6 defines the MSC subpopulation with enhanced immune suppression activities. Stem Cell Res. Ther. 2022, 13, 479. [Google Scholar] [CrossRef] [PubMed]
- Pfirschke, C.; Engblom, C.; Gungabeesoon, J.; Lin, Y.; Rickelt, S.; Zilionis, R.; Messemaker, M.; Siwicki, M.; Gerhard, G.M.; Kohl, A.; et al. Tumor-Promoting Ly-6G+ SiglecFhigh Cells Are Mature and Long-Lived Neutrophils. Cell Rep. 2020, 32, 108164. [Google Scholar] [CrossRef] [PubMed]
- Pan, L.; Wang, B.; Chen, M.; Ma, Y.; Cui, B.; Chen, Z.; Song, Y.; Hu, L.; Jiang, Z. Lack of SIRP-alpha reduces lung cancer growth in mice by promoting anti-tumour ability of macrophages and neutrophils. Cell Prolif. 2023, 56, e13361. [Google Scholar] [CrossRef] [PubMed]
- McCracken, M.N.; Cha, A.C.; Weissman, I.L. Molecular Pathways: Activating T Cells After Cancer Cell Phagocytosis from Blockade of CD47 “Don’t Eat Me” Signals. Clin. Cancer Res. 2015, 21, 3597–3601. [Google Scholar] [CrossRef] [PubMed]
- Cedrés, S.; Torrejon, D.; Martínez, A.; Martinez, P.; Navarro, A.; Zamora, E.; Mulet-Margalef, N.; Felip, E. Neutrophil to lymphocyte ratio (NLR) as an indicator of poor prognosis in stage IV non-small cell lung cancer. Clin. Transl. Oncol. 2012, 14, 864–869. [Google Scholar] [CrossRef] [PubMed]
- Thim, E.A.; Kitelinger, L.E.; Rivera-Escalera, F.; Mathew, A.S.; Elliott, M.R.; Bullock, T.N.J.; Price, R.J. Focused ultrasound ablation of melanoma with boiling histotripsy yields abscopal tumor control and antigen-dependent dendritic cell activation. Theranostics 2024, 14, 1647–1661. [Google Scholar] [CrossRef] [PubMed]
- Bailey, C.C.; Zhong, G.; Huang, I.C.; Farzan, M. IFITM-Family Proteins: The Cell’s First Line of Antiviral Defense. Annu. Rev. Virol. 2014, 1, 261–283. [Google Scholar] [CrossRef] [PubMed]
- Lucas, T.M.; Richner, J.M.; Diamond, M.S. The Interferon-Stimulated Gene Ifi27l2a Restricts West Nile Virus Infection and Pathogenesis in a Cell-Type- and Region-Specific Manner. J. Virol. 2015, 90, 2600–2615. [Google Scholar] [CrossRef] [PubMed]
- Perera, P.Y.; Lichy, J.H.; Waldmann, T.A.; Perera, L.P. The role of interleukin-15 in inflammation and immune responses to infection: Implications for its therapeutic use. Microbes Infect. 2012, 14, 247–261. [Google Scholar] [CrossRef] [PubMed]
- Na, K.; Oh, B.C.; Jung, Y.J. Multifaceted role of CD14 in innate immunity and tissue homeostasis. Cytokine Growth Factor. Rev. 2023, 74, 100–107. [Google Scholar] [CrossRef] [PubMed]
- Bao, Y.; Tong, C.; Xiong, X. CXCL3: A key player in tumor microenvironment and inflammatory diseases. Life Sci. 2024, 348, 122691. [Google Scholar] [CrossRef] [PubMed]
- Song, N.; Cui, K.; Zeng, L.; Li, M.; Fan, Y.; Shi, P.; Wang, Z.; Su, W.; Wang, H. Advance in the role of chemokines/chemokine receptors in carcinogenesis: Focus on pancreatic cancer. Eur. J. Pharmacol. 2024, 967, 176357. [Google Scholar] [CrossRef] [PubMed]
- Korbecki, J.; Kojder, K.; Simińska, D.; Bohatyrewicz, R.; Gutowska, I.; Chlubek, D.; Baranowska-Bosiacka, I. CC Chemokines in a Tumor: A Review of Pro-Cancer and Anti-Cancer Properties of the Ligands of Receptors CCR1, CCR2, CCR3, and CCR4. Int. J. Mol. Sci. 2020, 21, 8412. [Google Scholar] [CrossRef] [PubMed]
- Pang, H.; Ouyang, J.; Yang, Z.; Shang, H.; Liang, G. Urokinase plasminogen activator surface receptor restricts HIV-1 replication by blocking virion release from the cell membrane. Proc. Natl. Acad. Sci. USA 2023, 120, e2212991120. [Google Scholar] [CrossRef] [PubMed]
- Blasi, F. The urokinase receptor. A cell surface, regulated chemokine. APMIS 1999, 107, 96–101. [Google Scholar] [CrossRef] [PubMed]
- Wu, M.X.; Ao, Z.; Prasad, K.V.; Wu, R.; Schlossman, S.F. IEX-1L, an apoptosis inhibitor involved in NF-kappaB-mediated cell survival. Science 1998, 281, 998–1001. [Google Scholar] [CrossRef] [PubMed]
- Liu, C.; Zhou, X.; Zeng, H.; Wu, D.; Liu, L. HILPDA Is a Prognostic Biomarker and Correlates with Macrophage Infiltration in Pan-Cancer. Front. Oncol. 2021, 11, 597860. [Google Scholar] [CrossRef] [PubMed]
- Feng, X.; Ji, Y.; Zhang, C.; Jin, T.; Li, J.; Guo, J. CCL6 promotes M2 polarization and inhibits macrophage autophagy by activating PI3-kinase/Akt signalling pathway during skin wound healing. Exp. Dermatol. 2023, 32, 403–412. [Google Scholar] [CrossRef] [PubMed]
- Zhang, Y.; Lazarus, J.; Steele, N.G.; Yan, W.; Lee, H.J.; Nwosu, Z.C.; Halbrook, C.J.; Menjivar, R.E.; Kemp, S.B.; Sirihorachai, V.R.; et al. Regulatory T-cell Depletion Alters the Tumor Microenvironment and Accelerates Pancreatic Carcinogenesis. Cancer Discov. 2020, 10, 422–439. [Google Scholar] [CrossRef] [PubMed]
- Yi, F.; Jaffe, R.; Prochownik, E.V. The CCL6 chemokine is differentially regulated by c-Myc and L-Myc, and promotes tumorigenesis and metastasis. Cancer Res. 2003, 63, 2923–2932. [Google Scholar] [PubMed]
- Sharma, N.; Atolagbe, O.T.; Ge, Z.; Allison, J.P. LILRB4 suppresses immunity in solid tumors and is a potential target for immunotherapy. J. Exp. Med. 2021, 218, e20201811. [Google Scholar] [CrossRef] [PubMed]
- Gao, Q.; Mo, S.; Han, C.; Liao, X.; Yang, C.; Wang, X.; Liang, T.; He, Y.; Chen, Z.; Zhu, G.; et al. Comprehensive analysis of LILR family genes expression and tumour-infiltrating immune cells in early-stage pancreatic ductal adenocarcinoma. IET Syst. Biol. 2023, 17, 39–57. [Google Scholar] [CrossRef] [PubMed]
- Han, Y.; Bai, X.; Liu, S.; Zhu, J.; Zhang, F.; Xie, L.; Liu, G.; Jiang, X.; Zhang, M.; Huang, Y.; et al. XAF1 Protects Host against Emerging RNA Viruses by Stabilizing IRF1-Dependent Antiviral Immunity. J. Virol. 2022, 96, e0077422. [Google Scholar] [CrossRef] [PubMed]
- Jeong, S.I.; Kim, J.W.; Ko, K.P.; Ryu, B.K.; Lee, M.G.; Kim, H.J.; Chi, S.G. XAF1 forms a positive feedback loop with IRF-1 to drive apoptotic stress response and suppress tumorigenesis. Cell Death Dis. 2018, 9, 806. [Google Scholar] [CrossRef] [PubMed]
- Khare, S.; Ratsimandresy, R.A.; de Almeida, L.; Cuda, C.M.; Rellick, S.L.; Misharin, A.V.; Wallin, M.C.; Gangopadhyay, A.; Forte, E.; Gottwein, E.; et al. The PYRIN domain-only protein POP3 inhibits ALR inflammasomes and regulates responses to infection with DNA viruses. Nat. Immunol. 2014, 15, 343–353. [Google Scholar] [CrossRef] [PubMed]
- McCarthy, M.K.; Weinberg, J.B. The immunoproteasome and viral infection: A complex regulator of inflammation. Front. Microbiol. 2015, 6, 21. [Google Scholar] [CrossRef] [PubMed]
- Lattanzi, L.; Rozera, C.; Marescotti, D.; D’Agostino, G.; Santodonato, L.; Cellini, S.; Belardelli, F.; Gavioli, R.; Ferrantini, M. IFN-α boosts epitope cross-presentation by dendritic cells via modulation of proteasome activity. Immunobiology 2011, 216, 537–547. [Google Scholar] [CrossRef] [PubMed]
- Lu, X. OX40 and OX40L Interaction in Cancer. Curr. Med. Chem. 2021, 28, 5659–5673. [Google Scholar] [CrossRef] [PubMed]
- Pichler, A.C.; Carrié, N.; Cuisinier, M.; Ghazali, S.; Voisin, A.; Axisa, P.P.; Tosolini, M.; Mazzotti, C.; Golec, D.P.; Maheo, S.; et al. TCR-independent CD137 (4-1BB) signaling promotes CD8+ -exhausted T cell proliferation and terminal differentiation. Immunity 2023, 56, 1631–1648.e10. [Google Scholar] [CrossRef] [PubMed]
- Kim, H.D.; Park, S.; Jeong, S.; Lee, Y.J.; Lee, H.; Kim, C.G.; Kim, K.H.; Hong, S.M.; Lee, J.Y.; Kim, S.; et al. 4-1BB Delineates Distinct Activation Status of Exhausted Tumor-Infiltrating CD8+ T Cells in Hepatocellular Carcinoma. Hepatology 2020, 71, 955–971. [Google Scholar] [CrossRef] [PubMed]
- Milde-Langosch, K.; Karn, T.; Müller, V.; Witzel, I.; Rody, A.; Schmidt, M.; Wirtz, R.M. Validity of the proliferation markers Ki67, TOP2A, and RacGAP1 in molecular subgroups of breast cancer. Breast Cancer Res. Treat. 2013, 137, 57–67. [Google Scholar] [CrossRef] [PubMed]
- Juríková, M.; Danihel, Ľ.; Polák, Š.; Varga, I. Ki67, PCNA, and MCM proteins: Markers of proliferation in the diagnosis of breast cancer. Acta Histochem. 2016, 118, 544–552. [Google Scholar] [CrossRef] [PubMed]
- Iyer, S.S.; Latner, D.R.; Zilliox, M.J.; McCausland, M.; Akondy, R.S.; Penaloza-Macmaster, P.; Hale, J.S.; Ye, L.; Mohammed, A.U.; Yamaguchi, T.; et al. Identification of novel markers for mouse CD4+ T follicular helper cells. Eur. J. Immunol. 2013, 43, 3219–3232. [Google Scholar] [CrossRef] [PubMed]
- Hale, J.S.; Ahmed, R. Memory T follicular helper CD4 T cells. Front. Immunol. 2015, 6, 16. [Google Scholar] [CrossRef] [PubMed]
- Laidlaw, B.J.; Lu, Y.; Amezquita, R.A.; Weinstein, J.S.; Vander Heiden, J.A.; Gupta, N.T.; Kleinstein, S.H.; Kaech, S.M.; Craft, J. Interleukin-10 from CD4+ follicular regulatory T cells promotes the germinal center response. Sci. Immunol. 2017, 2, eaan4767. [Google Scholar] [CrossRef] [PubMed]
- Liang, R.; Zhu, X.; Lan, T.; Ding, D.; Zheng, Z.; Chen, T.; Huang, Y.; Liu, J.; Yang, X.; Shao, J.; et al. TIGIT promotes CD8+ T cells exhaustion and predicts poor prognosis of colorectal cancer. Cancer Immunol. Immunother. 2021, 70, 2781–2793. [Google Scholar] [CrossRef] [PubMed]
- Wieland, E.; Shipkova, M. Lymphocyte surface molecules as immune activation biomarkers. Clin. Biochem. 2016, 49, 347–354. [Google Scholar] [CrossRef] [PubMed]
- Göthert, J.R.; Eisele, L.; Klein-Hitpass, L.; Weber, S.; Zesewitz, M.L.; Sellmann, L.; Röth, A.; Pircher, H.; Dührsen, U.; Dürig, J. Expanded CD8+ T cells of murine and human CLL are driven into a senescent KLRG1+ effector memory phenotype. Cancer Immunol. Immunother. 2013, 62, 1697–1709. [Google Scholar] [CrossRef] [PubMed]
- Xu, M.; Feng, Y.; Xiang, X.; Liu, L.; Tang, G. MZB1 regulates cellular proliferation, mitochondrial dysfunction, and inflammation and targets the PI3K-Akt signaling pathway in acute pancreatitis. Cell Signal. 2024, 118, 111143. [Google Scholar] [CrossRef] [PubMed]
- Lai, C.; Coltart, G.; Shapanis, A.; Healy, C.; Alabdulkareem, A.; Selvendran, S.; Theaker, J.; Sommerlad, M.; Rose-Zerilli, M.; Al-Shamkhani, A.; et al. CD8+CD103+ tissue-resident memory T cells convey reduced protective immunity in cutaneous squamous cell carcinoma. J. Immunother. Cancer 2021, 9, e001807. [Google Scholar] [CrossRef] [PubMed]
- FitzPatrick, M.E.B.; Provine, N.M.; Garner, L.C.; Powell, K.; Amini, A.; Irwin, S.L.; Ferry, H.; Ambrose, T.; Friend, P.; Vrakas, G.; et al. Human intestinal tissue-resident memory T cells comprise transcriptionally and functionally distinct subsets. Cell Rep. 2021, 34, 108661. [Google Scholar] [CrossRef] [PubMed]
- Kirkham, C.L.; Carlyle, J.R. Complexity and Diversity of the NKR-P1:Clr (Klrb1:Clec2) Recognition Systems. Front. Immunol. 2014, 5, 214. [Google Scholar] [CrossRef] [PubMed]
- Caminschi, I.; Proietto, A.I.; Ahmet, F.; Kitsoulis, S.; The, J.S.; Lo, J.C.Y.; Rizzitelli, A.; Wu, L.; Vremec, D.; van Dommelen, S.L.H.; et al. The dendritic cell subtype-restricted C-type lectin Clec9A is a target for vaccine enhancement. Blood 2008, 112, 3264–3273. [Google Scholar] [CrossRef] [PubMed]
- Gurka, S.; Hartung, E.; Becker, M.; Kroczek, R.A. Mouse Conventional Dendritic Cells Can be Universally Classified Based on the Mutually Exclusive Expression of XCR1 and SIRPα. Front. Immunol. 2015, 6, 35. [Google Scholar] [CrossRef] [PubMed]
- Li, Z.; Ju, X.; Silveira, P.A.; Abadir, E.; Hsu, W.H.; Hart, D.N.J.; Clark, G.J. CD83: Activation Marker for Antigen Presenting Cells and its Therapeutic Potential. Front. Immunol. 2019, 10, 1312. [Google Scholar] [CrossRef] [PubMed]
- Duhan, V.; Khairnar, V.; Kitanovski, S.; Hamdan, T.A.; Klein, A.D.; Lang, J.; Ali, M.; Adomati, T.; Bhat, H.; Friedrich, S.K.; et al. Integrin Alpha E (CD103) Limits Virus-Induced IFN-I Production in Conventional Dendritic Cells. Front. Immunol. 2021, 11, 607889. [Google Scholar] [CrossRef] [PubMed]
- Wacleche, V.S.; Cattin, A.; Goulet, J.P.; Gauchat, D.; Gosselin, A.; Cleret-Buhot, A.; Zhang, Y.; Tremblay, C.L.; Routy, J.P.; Ancuta, P. CD16+ monocytes give rise to CD103+RALDH2+TCF4+ dendritic cells with unique transcriptional and immunological features. Blood Adv. 2018, 2, 2862–2878. [Google Scholar] [CrossRef] [PubMed]
- Zhou, Y.; Zhang, Y.; Han, J.; Yang, M.; Zhu, J.; Jin, T. Transitional B cells involved in autoimmunity and their impact on neuroimmunological diseases. J. Transl. Med. 2020, 18, 131. [Google Scholar] [CrossRef] [PubMed]
- Bronte, V.; Brandau, S.; Chen, S.H.; Colombo, M.P.; Frey, A.B.; Greten, T.F.; Mandruzzato, S.; Murray, P.J.; Ochoa, A.; Ostrand-Rosenberg, S.; et al. Recommendations for myeloid-derived suppressor cell nomenclature and characterization standards. Nat. Commun. 2016, 7, 12150. [Google Scholar] [CrossRef] [PubMed]









| Subject | Number of Exposure Positions per Tumour | Number of Exposure Pulses per Tumour | Percentage of HH-Positive Exposure Pulses (%) | Number of HH Positive Exposure Pulses per Tumour | Percentage of Broadband Signal Exposure Positive Pulses (%) | Number of Broadband-Positive Exposure Pulses per Tumour | Hyper-Echoic Signals |
|---|---|---|---|---|---|---|---|
| BH- Subject 1 | 28 | 660 | 98 | 650 | 14 | 95 | Yes |
| BH 2- Subject 2 | 17 | 350 | 100 | 350 | 94 | 330 | Yes |
| BH 3- Subject 3 | 30 | 720 | 100 | 720 | 20 | 150 | In-conclusive |
| BH 4- Subject 4 | 19 | 450 | 100 | 450 | 77 | 345 | Yes |
| BH 5- Subject 5 | 25 | 535 | 100 | 535 | 67 | 360 | Yes |
| Comb 1- Subject 1 | 13 | 310 | 97 | 300 | 100 | 310 | Yes |
| Comb 2- Subject 2 | 10 | 230 | 91 | 210 | 95 | 220 | Yes |
| Comb 3- Subject 3 | 22 | 530 | 100 | 530 | 4 | 20 | Yes |
| Comb 4- Subject 4 | 17 | 350 | 100 | 350 | 2 | 6 | Yes |
| A—Neutrophils | ||||||||||||||||||||||||||||||||||||||||||||||||||
| Clusters | Relative expression of annotation genes—AvgLog2Fc > 1 (dark green), 0.5 < AvgLog2Fc < 1 (light green), 0.25 < AvgLog2FC < 0.5 (amber), AvgLog2FC < 0.25 (red). | |||||||||||||||||||||||||||||||||||||||||||||||||
| Transitioning | CD63 | ITGAM | FCGR3 | SELL | ENTPD1 | PDL1 | CYBB | CD177 | CXCR2 | MMP9 | IL10R | OSM | TGF-βR | IFNγ/IFNγR | TLR4/CD14 | TLR2 | CCL2 | S100A8 S100A9 | TNF | CD24A | ||||||||||||||||||||||||||||||
| Active | CD63 | ITGAM | FCGR3 | SELL | ENTPD1 | PDL1 | CYBB | CD177 | CXCR2 | MMP9 | IL10R | OSM | TGF-βR | IFNγ/IFNγR | TLR4/CD14 | TLR2 | CCL2 | S100A8 S100A9 | TNF | CD24A | ||||||||||||||||||||||||||||||
| Active subset | CD63 | ITGAM | FCGR3 | SELL | ENTPD1 | PDL1 | CYBB | CD177 | CXCR2 | MMP9 | IL10R | OSM | TGF-βR | IFNγ/IFNγR | TLR4/CD14 | TLR2 | CCL2 | S100A8 S100A9 | TNF | CD24A | ||||||||||||||||||||||||||||||
| Intermediate | CD63 | ITGAM | FCGR3 | SELL | ENTPD1 | PDL1 | CYBB | CD177 | CXCR2 | MMP9 | IL10R | OSM | TGF-βR | IFNγ/IFNγR | TLR4/CD14 | TLR2 | CCL2 | S100A8 S100A9 | TNF | CD24A | ||||||||||||||||||||||||||||||
| Intermediate subset | CD63 | ITGAM | FCGR3 | SELL | ENTPD1 | PDL1 | CYBB | CD177 | CXCR2 | MMP9 | IL10R | OSM | TGF-βR | IFNγ/IFNγR | TLR4/CD14 | TLR2 | CCL2 | S100A8 S100A9 | TNF | CD24A | ||||||||||||||||||||||||||||||
| Inactive | CD63 | ITGAM | FCGR3 | SELL | ENTPD1 | PDL1 | CYBB | CD177 | CXCR2 | MMP9 | IL10R | OSM | TGFbR | IFNγ/IFNγR | TLR4/CD14 | TLR2 | CCL2 | S100A8 S100A9 | TNF | CD24A | ||||||||||||||||||||||||||||||
| Inactive subset | CD63 | ITGAM | FCGR3 | SELL | ENTPD1 | PDL1 | CYBB | CD177 | CXCR2 | MMP9 | IL10R | OSM | TGF-βR | IFNγ/IFNγR | TLR4/CD4 | TLR2 | CCL2 | S100A8 S100A9 | TNF | CD24A | ||||||||||||||||||||||||||||||
| B—Neutrophils | ||||||||||||||||||||||||||||||||||||||||||||||||||
| Clusters | Additional annotation genes. Relative expression—AvgLog2Fc > 1 (dark green), 0.5 < AvgLog2Fc < 1 (light green), 0.25 < AvgLog2FC < 0.5 (amber), AvgLog2FC < 0.25 (red). | |||||||||||||||||||||||||||||||||||||||||||||||||
| Active | MMP8 | IFIT2 | IFITM6 | CXCL10 | CXCL3 | CCL4 | CCL6 | IFIT3 | IFIT3B | IFITM3 | IFIT1 | ISG20 | IFIT1BL2 | TNFAIP6 | DACH1 | MRGPRA2B | GSTM1 | IL23A | SIGLECF | LTF | ADAM8 | ADAMDEC1 | ||||||||||||||||||||||||||||
| Active subset | MMP8 | IFIT2 | IFITM6 | CXCL10 | CXCL3 | CCL4 | CCL6 | IFIT3 | IFIT3B | IFITM3 | IFIT1 | ISG20 | IFIT1BL2 | TNFAIP6 | DACH1 | MRGPRA2B | GSTM1 | IL23A | SIGLECF | LTF | ADAM8 | ADAMDEC1 | ||||||||||||||||||||||||||||
| Intermediate | MMP8 | IFIT2 | IFITM6 | CXCL10 | CXCL3 | CCL4 | CCL6 | IFIT3 | IFIT3B | IFITM3 | IFIT1 | ISG20 | IFIT1BL2 | TNFAIP6 | DACH1 | MRGPRA2B | GSTM1 | IL23A | SIGLECF | LTF | ADAM8 | ADAMDEC1 | ||||||||||||||||||||||||||||
| Intermediate subset | MMP8 | IFIT2 | IFITM6 | CXCL10 | CXCL3 | CCL4 | CCL6 | IFIT3 | IFIT3B | IFITM3 | IFIT1 | ISG20 | IFIT1BL2 | TNFAIP6 | DACH1 | MRGPRA2B | GSTM1 | IL23A | SIGLECF | LTF | ADAM8 | ADAMDEC1 | ||||||||||||||||||||||||||||
| Transitioning | MMP8 | IFIT2 | IFITM6 | CXCL10 | CXCL3 | CCL4 | CCL6 | IFIT3 | IFIT3B | IFITM3 | IFIT1 | ISG20 | IFIT1BL2 | TNFAIP6 | DACH1 | MRGPRA2B | GSTM1 | IL23A | SIGLECF | LTF | ADAM8 | ADAMDEC1 | ||||||||||||||||||||||||||||
| Inactive | MMP8 | IFIT2 | IFITM6 | CXCL10 | CXCL3 | CCL4 | CCL6 | IFIT3 | IFIT3B | IFITM3 | IFIT1 | ISG20 | IFIT1BL2 | TNFAIP6 | DACH1 | MRGPRA2B | GSTM1 | IL23A | SIGLECF | LTF | ADAM8 | ADAMDEC1 | ||||||||||||||||||||||||||||
| Inactive subset | MMP8 | IFIT2 | IFITM6 | CXCL10 | CXCL3 | CCL4 | CCL6 | IFIT3 | IFIT3B | IFITM3 | IFIT1 | ISG20 | IFIT1BL2 | TNFAIP6 | DACH1 | MRGPRA2B | GSTM1 | IL23A | SIGLECF | LTF | ADAM8 | ADAMDEC1 | ||||||||||||||||||||||||||||
| C—CD4+ lymphocytes—Relative expression of annotation genes—AvgLog2Fc > 1 (dark green), 0.5 < AvgLog2Fc < 1 (light green), 0.25 < AvgLog2FC < 0.5 (amber), AvgLog2FC < 0.25 (red). | ||||||||||||||||||||||||||||||||||||||||||||||||||
| Clusters | Marker genes | Activation genes | Immune checkpoint genes | Proliferation genes | Various genes | |||||||||||||||||||||||||||||||||||||||||||||
| Naïve/ inactive Th | FOXP3 | CD3e | CD4 | FR4 | CD25 | CD69 | TNFRSF9 | TNFRSF4 | CCR5 | IFNγ | CTLA4 | PDCD1 | LAG3 | TIM3 | TIGIT | ICOS | MKI67 | TOP2A | PCNA | CD40LG | TBET | IL7R | ||||||||||||||||||||||||||||
| Active Th | FOXP3 | CD3e | CD4 | FR4 | CD25 | CD69 | TNFRSF9 | TNFRSF4 | CCR5 | IFNγ | CTLA4 | PDCD1 | LAG3 | TIM3 | TIGIT | ICOS | MKI67 | TOP2A | PCNA | CD40LG | TBET | IL7R | ||||||||||||||||||||||||||||
| Proliferating active Th | FOXP3 | CD3e | CD4 | FR4 | CD25 | CD69 | TNFRSF9 | TNFRSF4 | CCR5 | IFNγ | CTLA4 | PDCD1 | LAG3 | TIM3 | TIGIT | ICOS | MKI67 | TOP2A | PCNA | CD40LG | TBET | IL7R | ||||||||||||||||||||||||||||
| Treg | FOXP3 | CD3e | CD4 | FR4 | CD25 | CD69 | TNFRSF9 | TNFRSF4 | CCR5 | IL10 | CTLA4 | PDCD1 | LAG3 | TIM3 | TIGIT | ICOS | MKI67 | TOP2A | PCNA | CD40LG | KLRG1/CCR2 | ITGAE | IL7R | |||||||||||||||||||||||||||
| Tfh | FOXP3 | CD3g | CD4 | FR4 | CD25 | CD69 | TNFRSF9 | TNFRSF4 | CCR5 | IL10 | CTLA4 | PDCD1 | LAG3 | TIM3 | TIGIT | ICOS | MKI67 | TOP2A | CCNA2 | CD40LG | IL10/FCGR3 | TNF | IL7R | |||||||||||||||||||||||||||
| D—CD8+ lymphocytes—Relative expression of annotation genes—AvgLog2Fc > 1 (dark green), 0.5 < AvgLog2Fc < 1 (light green), 0.25 < AvgLog2FC < 0.5 (amber), AvgLog2FC < 0.25 (red). | ||||||||||||||||||||||||||||||||||||||||||||||||||
| Clusters | Lineage genes | Activation genes | Immune checkpoint genes | Proliferation/cell cycle genes | Transcription factor genes | Various genes | ||||||||||||||||||||||||||||||||||||||||||||
| Senescent Tcyt | KLRG1 | CD3e | CD8α | GZMB | FASL | CD69 | TNFRSF9 | PFN | LAG3 | PDCD1 | CTLA4 | TIGIT | TIM3 | MKI67 | TOP2A | PCNA | CCNA2 | TBET | TOX | EOMES | IFNγ | SELL | IL7R | CD44 | ||||||||||||||||||||||||||
| Exhausted proliferating Tcyt | KLRG | CD3e | CD8α | GZMB | FASL | CD69 | TNFRSF9 | PFN | LAG3 | PDCD1 | CTLA4 | TIGIT | TIM3 | MKI67 | TOP2A | PCNA | CCNA2 | TBET | TOX | EOMES | IFN-γ | SELL | IL7R | CD44 | ||||||||||||||||||||||||||
| Terminally Exhausted Tcyt | KLRG | CD3e | CD8α | GZMB | FASL | CD69 | TNFRSF9 | PFN | LAG3 | PDCD1 | CTLA4 | TIGIT | TIM3 | MKI67 | TOP2A | PCNA | CCNA2 | TBET | TOX | EOMES | IFNγ | SELL | IL7R | CD44 | ||||||||||||||||||||||||||
| Exhausted Tcyt | KLRG | CD3e | CD8α | GZMB | FASL | CD69 | TNFRSF9 | PFN | LAG3 | PDCD1 | CTLA4 | TIGIT | TIM3 | MKI67 | TOP2A | PCNA | CCNA2 | TBET | TOX | EOMES | IFNγ | SELL | IL7R | CD44 | ||||||||||||||||||||||||||
| Tcyt subset 1 | KLRG | CD3e | CD8α | GZMB | FASL | CD69 | TNFTSF9 | PFN | LAG3 | PDCD1 | CTLA4 | TIGIT | TIM3 | MKI67 | TOP2A | PCNA | CCNA2 | TBET | TOX | EOMES | IFNγ | SELL | IL7R | CD44 | ||||||||||||||||||||||||||
| Tcyt subset 2 | KLRG | CD3e | CD8α | GZMB | FASL | CD69 | TNFTSF9 | PFN | LAG3 | PDCD1 | CTLA4 | TIGIT | TIM3 | MKI67 | TOP2A | PCNA | CCNA2 | TBET | TOX | EOMES | IFNγ | SELL | IL7R | CD44 | ||||||||||||||||||||||||||
| Proliferating Tcyt | KLRG | CD3e | CD8α | GZMB | FASL | CD69 | TNFTSF9 | PFN | LAG3 | PDCD1 | CTLA4 | TIGIT | TIM3 | MKI67 | TOP2A | PCNA | CCNA2 | TBET | TOX | EOMES | IFNγ | SELL | IL7R | CD44 | ||||||||||||||||||||||||||
| Non-proliferating Tcyt | KLRG | CD3e | CD8α | GZMB | FASL | CD69 | TNFTSF9 | PFN | LAG3 | PDCD1 | CTLA4 | TIGIT | TIM3 | MKI67 | TOP2A | PCNA | CCNA2 | TBET | TOX | EOMES | IFNγ | SELL | IL7R | CD44 | ||||||||||||||||||||||||||
| TRM CD8T | ITGAE | CD3e | CD8α | GZMB | FASL | CD69 | TNFRSF9 | PFN | LAG3 | PDCD1 | CTLA4 | TIGIT | TIM3 | MKI67 | TOP2A | PCNA | CCNA2 | TBET | TOX | EOMES | ICOS | IL2RB | IL7R | ITGA1 | ||||||||||||||||||||||||||
| Cell Abundance as a % of CD45+ Cells | Control (n = 6) | Reovirus (n = 6) | BH (n = 5) | Combination (n = 4) |
|---|---|---|---|---|
| Macrophages | 12.20 ± 1.4 | 7.75 ± 1.3 | 12.21 ± 2.1 | 6.94 ± 1.4 |
| Senescent Tcyt | 8.30 ± 1.9 | 7.67 ± 1.4 | 4.78 ± 1.1 | 4.96 ± 0.9 |
| Active neutrophils | 4.86 ± 1.6 | 6.76 ± 2.3 | 10.04 ± 3.3 | 13.81 ± 6.5 |
| Exhausted proliferating Tcyt | 7.18 ± 2.2 | 7.166 ± 3.5 | 5.99 ± 3.03 | 8.49 ± 3.9 |
| Terminal exhausted Tcyt | 5.58 ± 1.2 | 5.41 ± 1.2 | 5.12 ± 0.8 | 3.26 ± 0.5 |
| Active Th | 6.11 ± 1.4 | 5.82 ± 1.2 | 5.08 ± 0.4 | 5.29 ± 1.2 |
| Intermediate neutrophils | 4.62 ± 1.0 | 5.12 ± 1.6 | 6.81 ± 1.6 | 8.90 ± 2.9 |
| Inflammatory monocytes | 4.59 ± 1.4 | 5.28 ± 0.7 | 5.63 ± 0.6 | 7.60 ± 1.8 |
| TRM CD8T | 6.04 ± 0.8 | 4.73 ± 1.2 | 4.11 ± 0.7 | 3.25 ± 1.1 |
| Proliferating active Th | 5.42 ± 0.6 | 4.82 ± 0.9 | 4.14 ± 0.7 | 3.08 ± 0.2 |
| Tcyt subset1 | 4.46 ± 1.7 | 4.60 ± 1.8 | 4.71 ± 1.4 | 2.20 ± 1.1 |
| B cells | 3.60 ± 1.1 | 4.49 ± 2.0 | 7.25 ± 4.3 | 1.34 ± 0.3 |
| Inactive neutrophils | 3.96 ± 3.0 | 5.22 ± 4.5 | 2.07 ± 1.5 | 7.15 ± 4.1 |
| DC | 3.16 ± 0.2 | 3.76 ± 0.8 | 3.15 ± 0.7 | 2.67 ± 0.6 |
| Exhausted Tcyt | 2.64 ± 0.5 | 2.79 ± 0.6 | 3.11 ± 0.5 | 1.67 ± 0.3 |
| Damaged cells | 1.98 ± 0.5 | 2.39 ± 0.6 | 2.79 ± 0.5 | 2.42 ± 0.4 |
| NK | 2.00 ± 0.5 | 1.91 ± 0.4 | 2.24 ± 0.6 | 1.20 ± 0.2 |
| Treg | 2.29 ± 0.3 | 2.19 ± 0.5 | 1.23 ± 0.2 | 0.80 ± 0.2 |
| Transitioning neutrophils | 1.35 ± 0.2 | 1.98 ± 0.9 | 2.81 ± 0.6 | 3.03 ± 1.1 |
| Tcyt subset2 | 1.72 ± 0.6 | 1.59 ± 0.4 | 1.91 ± 0.4 | 0.90 ± 0.3 |
| Naïve/inactive Th | 1.52 ± 0.5 | 1.66 ± 0.6 | 1.38 ± 0.2 | 0.87 ± 0.4 |
| Inactive neutrophils subset | 1.54 ± 1.3 | 1.73 ± 1.6 | 0.69 ± 0.6 | 2.07 ± 1.4 |
| Proliferating Tcyt | 1.13 ± 0.1 | 1.39 ± 0.2 | 0.72 ± 0.1 | 0.87 ± 0.3 |
| MDSC-enriched | 0.81 ± 0.2 | 0.83 ± 0.4 | 1.39 ± 0.5 | 1.46 ± 0.6 |
| Active neutrophils subset | 0.61 ± 0.5 | 1.02 ± 0.9 | 0.43 ± 0.4 | 3.36 ± 1.9 |
| Intermediate neutrophils subset | 0.87 ± 0.7 | 0.83 ± 0.8 | 0.23 ± 0.2 | 1.14 ± 0.6 |
| B transitioning | 0.80 ± 0.6 | 0.41 ± 0.3 | 0.33 ± 0.4 | 0.45 ± 0.4 |
| Non-proliferating Tcyt | 0.29 ± 0.2 | 0.27 ± 0.2 | 0.39 ± 0.4 | 0.38 ± 0.3 |
| SIRPa+ cells | 0.19 ± 0.1 | 0.18 ± 0.1 | 0.12 ± 0.1 | 0.21 ± 0.1 |
| Tfh | 0.04 ± 0.1 | 0.08 ± 0.1 | 0.03 ± 0.1 | 0.09 ± 0.1 |
| Immune Cell Ratio to Treg | Control (n = 6) | Reovirus (n = 6) | BH (n = 5) | Combination (n = 4) |
|---|---|---|---|---|
| Macrophages | 5.31 ± 0.61 | 3.52 ± 0.62 | 9.93 ± 1.73 | 8.67 ± 1.73 |
| Senescent Tcyt | 3.61 ± 0.85 | 3.48 ± 0.66 | 3.89 ± 0.89 | 6.20 ± 1.20 |
| Active neutrophils | 2.11 ± 0.71 | 3.07 ± 1.02 | 8.16 ± 2.67 | 17.27 ± 8.11 |
| Exhausted proliferating Tcyt | 3.12 ± 0.97 | 3.25 ± 1.57 | 4.87 ± 2.46 | 10.61 ± 4.85 |
| Terminal exhausted Tcyt | 2.42 ± 0.53 | 2.46 ± 0.52 | 4.16 ± 0.66 | 4.07 ± 0.61 |
| Active Th | 2.65 ± 0.59 | 2.64 ± 0.52 | 4.13 ± 0.30 | 6.61 ± 1.46 |
| Intermediate neutrophils | 2.01 ± 0.44 | 2.32 ± 0.74 | 5.54 ± 1.27 | 11.13 ± 3.60 |
| Inflammatory monocytes | 1.99 ± 0.62 | 2.40 ± 0.31 | 4.58 ± 0.49 | 9.50 ± 2.20 |
| TRM CD8T | 2.62 ± 0.34 | 2.15 ± 0.54 | 3.34 ± 0.57 | 4.06 ± 1.38 |
| Proliferating active Th | 2.35 ± 0.27 | 2.19 ± 0.40 | 3.36 ± 0.60 | 3.85 ± 0.23 |
| Tcyt subset1 | 1.94 ± 0.72 | 2.09 ± 0.80 | 3.83 ± 1.09 | 2.75 ± 1.42 |
| B cells | 1.56 ± 0.49 | 2.04 ± 0.91 | 5.89 ± 3.5 | 1.68 ± 0.42 |
| Inactive neutrophils | 1.72 ± 1.33 | 2.37 ± 2.07 | 1.68 ± 1.23 | 8.94 ± 5.10 |
| DC | 1.37 ± 0.09 | 1.71 ± 0.34 | 2.56 ± 0.56 | 3.34 ± 0.72 |
| Exhausted Tcyt | 1.14 ± 0.28 | 1.27 ± 0.27 | 2.53 ± 0.40 | 2.09 ± 0.32 |
| Damaged cells | 0.86 ± 0.20 | 1.08 ± 0.29 | 2.27 ± 0.37 | 3.03 ± 0.52 |
| NK | 0.87 ± 0.20 | 0.87 ± 0.17 | 1.82 ± 0.49 | 1.50 ± 0.20 |
| Transitioning neutrophils | 0.58 ± 0.09 | 0.90 ± 0.41 | 2.28 ± 0.52 | 3.78 ± 1.33 |
| Tcyt subset2 | 0.74 ± 0.27 | 0.72 ± 0.20 | 1.56 ± 0.30 | 1.12 ± 0.34 |
| Naïve/inactive Th | 0.66 ± 0.21 | 0.75 ± 0.26 | 1.12 ± 0.16 | 1.09 ± 0.44 |
| Inactive neutrophils subset | 0.66 ± 0.54 | 0.79 ± 0.72 | 0.56 ± 0.50 | 2.59 ± 1.76 |
| Proliferating Tcyt | 0.49 ± 0.05 | 0.63 ± 0.09 | 0.58 ± 0.07 | 1.09 ± 0.32 |
| MDSC-enriched | 0.35 ± 0.08 | 0.37 ± 0.16 | 1.13 ± 0.41 | 1.82 ± 0.81 |
| Active neutrophils subset | 0.26 ± 0.21 | 0.46 ± 0.39 | 0.35 ± 0.30 | 4.20 ± 2.43 |
| Intermediate neutrophils subset | 0.37 ± 0.30 | 0.37 ± 0.35 | 0.19 ± 0.19 | 1.42 ± 0.76 |
| B transitioning | 0.34 ± 0.27 | 0.18 ± 0.14 | 0.27 ± 0.31 | 0.56 ± 0.43 |
| Non-proliferating Tcyt | 0.12 ± 0.09 | 0.12 ± 0.09 | 0.31 ± 0.35 | 0.47 ± 0.31 |
| SIRPa+ cells | 0.08 ± 0.06 | 0.08 ± 0.05 | 0.10 ± 0.06 | 0.26 ± 0.12 |
| Tfh | 0.02 ± 0.01 | 0.04 ± 0.01 | 0.03 ± 0.01 | 0.11 ± 0.07 |
| Cell Clusters | Number of Genes | |||||||||||
|---|---|---|---|---|---|---|---|---|---|---|---|---|
| Control vs. Reovirus | Control vs. BH | Control vs. Combination | Combination vs. Reovirus | Comb. vs. BH | Reovirus vs. BH | |||||||
| Virus Up | Virus Down | BH Up | BH Down | Combination Up | Combination Down | Virus Up | Virus Down | BH Up | BH Down | BH Up | BH Down | |
| Senescent Tcyt | 2 | 0 | 0 | 0 | 3 | 1 | 1 | 0 | 0 | 3 | 1 | 0 |
| Exhausted prolifer. Tcyt | 18 | 0 | 30 | 6 | 15 | 1 | 1 | 1 | 16 | 63 | 153 | 23 |
| Terminal exhausted Tcyt | 7 | 0 | 0 | 0 | 4 | 1 | 1 | 0 | 0 | 0 | 0 | 0 |
| Exhausted Tcyt | 10 | 1 | 0 | 1 | 1 | 5 | 3 | 0 | 7 | 15 | 3 | 4 |
| Tcyt subset1 | 0 | 0 | 0 | 0 | 5 | 2 | 2 | 2 | 1 | 2 | 0 | 0 |
| Tcyt subset2 | 1 | 0 | 5 | 2 | 2 | 1 | 1 | 1 | 1 | 1 | 4 | 3 |
| Proliferating Tcyt | 1 | 0 | 0 | 0 | 0 | 0 | 0 | 0 | 0 | 0 | 0 | 0 |
| Non-proliferating Tcyt | 0 | 0 | 0 | 0 | 1 | 0 | 0 | 1 | 0 | 0 | 0 | 0 |
| TRM CD8T | 1 | 0 | 0 | 0 | 2 | 0 | 0 | 1 | 0 | 0 | 0 | 1 |
| NK | 6 | 0 | 0 | 0 | 3 | 6 | 0 | 2 | 1 | 0 | 3 | 1 |
| DC | 0 | 0 | 0 | 38 | 0 | 0 | 0 | 0 | 1 | 1 | 0 | 0 |
| B cells | 11 | 0 | 0 | 1 | 11 | 2 | 1 | 30 | 23 | 0 | 0 | 0 |
| B transitioning | 0 | 0 | 0 | 0 | 11 | 2 | 0 | 0 | 16 | 0 | 0 | 0 |
| Naïve/inactive Th | 2 | 1 | 0 | 0 | 3 | 0 | 0 | 0 | 1 | 1 | 0 | 0 |
| Active Th | 34 | 4 | 0 | 0 | 18 | 5 | 0 | 1 | 14 | 3 | 0 | 0 |
| Proliferating active Th | 32 | 3 | 0 | 0 | 34 | 17 | 0 | 5 | 12 | 11 | 1 | 0 |
| Treg | 2 | 0 | 0 | 0 | 1 | 1 | 1 | 0 | 0 | 1 | 0 | 0 |
| Tfh | 0 | 0 | 0 | 0 | 0 | 0 | 0 | 0 | 0 | 0 | 0 | 0 |
| Macrophages | 152 | 73 | 15 | 105 | 97 | 49 | 0 | 0 | 36 | 52 | 72 | 205 |
| Inflammatory monocytes | 130 | 94 | 0 | 0 | 165 | 34 | 0 | 1 | 83 | 43 | 109 | 205 |
| MDSC enriched | 9 | 4 | 1 | 0 | 89 | 17 | 4 | 31 | 8 | 4 | 0 | 0 |
| SIRPα+ cells | 3 | 0 | 2 | 0 | 3 | 0 | 3 | 0 | 18 | 3 | 0 | 0 |
| Active neutrophils | 37 | 1 | 151 | 17 | 408 | 217 | 0 | 1 | 12 | 1 | 4 | 11 |
| Active neutrophils subset | 0 | 0 | 1 | 0 | 1 | 0 | 0 | 0 | 0 | 0 | 0 | 0 |
| Intermediate neutrophils | 1 | 0 | 176 | 21 | 451 | 190 | 55 | 155 | 11 | 4 | 40 | 13 |
| Intermed. Neutroph. subset | 0 | 0 | 0 | 0 | 0 | 1 | 0 | 0 | 0 | 0 | 0 | 0 |
| Transitioning neutrophils | 15 | 0 | 9 | 9 | 131 | 51 | 2 | 13 | 10 | 1 | 0 | 4 |
| Inactive neutrophils | 0 | 0 | 17 | 1 | 203 | 325 | 111 | 58 | 26 | 49 | 2 | 1 |
| Inactive neutrophils subset | 0 | 0 | 0 | 0 | 31 | 44 | 8 | 15 | 4 | 0 | 0 | 0 |
| Total number of genes differentially regulated | 474 | 181 | 407 | 201 | 1693 | 972 | 194 | 318 | 301 | 258 | 392 | 471 |
| 655 | 608 | 2665 | 512 | 559 | 863 | |||||||
Disclaimer/Publisher’s Note: The statements, opinions and data contained in all publications are solely those of the individual author(s) and contributor(s) and not of MDPI and/or the editor(s). MDPI and/or the editor(s) disclaim responsibility for any injury to people or property resulting from any ideas, methods, instructions or products referred to in the content. |
© 2025 by the authors. Licensee MDPI, Basel, Switzerland. This article is an open access article distributed under the terms and conditions of the Creative Commons Attribution (CC BY) license (https://creativecommons.org/licenses/by/4.0/).
Share and Cite
Mouratidis, P.; Ferreira, R.C.; Anbalagan, S.; Chauhan, R.; Rivens, I.; ter Haar, G. Transcriptomic Profiling of the Immune Response in Orthotopic Pancreatic Tumours Exposed to Combined Boiling Histotripsy and Oncolytic Reovirus Treatment. Pharmaceutics 2025, 17, 949. https://doi.org/10.3390/pharmaceutics17080949
Mouratidis P, Ferreira RC, Anbalagan S, Chauhan R, Rivens I, ter Haar G. Transcriptomic Profiling of the Immune Response in Orthotopic Pancreatic Tumours Exposed to Combined Boiling Histotripsy and Oncolytic Reovirus Treatment. Pharmaceutics. 2025; 17(8):949. https://doi.org/10.3390/pharmaceutics17080949
Chicago/Turabian StyleMouratidis, Petros, Ricardo C. Ferreira, Selvakumar Anbalagan, Ritika Chauhan, Ian Rivens, and Gail ter Haar. 2025. "Transcriptomic Profiling of the Immune Response in Orthotopic Pancreatic Tumours Exposed to Combined Boiling Histotripsy and Oncolytic Reovirus Treatment" Pharmaceutics 17, no. 8: 949. https://doi.org/10.3390/pharmaceutics17080949
APA StyleMouratidis, P., Ferreira, R. C., Anbalagan, S., Chauhan, R., Rivens, I., & ter Haar, G. (2025). Transcriptomic Profiling of the Immune Response in Orthotopic Pancreatic Tumours Exposed to Combined Boiling Histotripsy and Oncolytic Reovirus Treatment. Pharmaceutics, 17(8), 949. https://doi.org/10.3390/pharmaceutics17080949


