Use of Factorial Designs to Reduce Stability Studies for Parenteral Drug Products: Determination of Factor Effects via Accelerated Stability Data Analysis
Abstract
1. Introduction
2. Materials and Methods
2.1. Drug Product
2.2. Stability Study Design
2.3. Tested Parameters and Analytical Methods
2.4. Factorial Analysis
2.5. Data Analysis
3. Results
3.1. Factorial Analysis
3.1.1. Iron Product
| EA *, % | EB, % | EAB, % | |
|---|---|---|---|
| Batch (A): 1 (−), 3 (+) Orientation (B): → (−), ↑ (+) | 0.145 | 0.045 | 0.075 |
| Batch (A): 1 (−), 2 (+) Orientation (B): → (−), ↑ (+) | −0.010 | −0.010 | 0.020 |
| Batch (A): 2 (−), 3 (+) Orientation (B): → (−), ↑ (+) | 0.155 | 0.065 | 0.055 |
3.1.2. Pemetrexed
| EA *, % | EB, % | EC, % | EAB, % | EAC, % | EBC, % | EABC, % | |
|---|---|---|---|---|---|---|---|
| Batch (A): 1 (−), 3 (+) Orientation (B): ↓ (−), ↑ (+) Fill volume (C): 4 mL (−), 40 mL (+) | −0.038 | −0.063 | −0.458 | 0.007 | 0.043 | 0.058 | −0.013 |
| Batch (A): 1 (−), 2 (+) Orientation (B): ↓ (−), ↑ (+) Fill volume (C): 4 mL (−), 40 mL (+) | −0.043 | −0.033 | −0.453 | 0.038 | 0.048 | 0.038 | −0.033 |
| Batch (A): 2 (−), 3 (+) Orientation (B): ↓ (−), ↑ (+) Fill volume (C): 4 mL (−), 40 mL (+) | 0.005 | −0.025 | −0.410 | −0.030 | −0.005 | 0.025 | 0.020 |
| Batch (A): 1 (−), 3 (+) Orientation (B): ↓ (−), ↑ (+) Fill volume (C): 4 mL (−), 20 mL (+) | −0.040 | −0.060 | −0.415 | 0.015 | 0.040 | 0.060 | −0.005 |
| Batch (A): 1 (−), 2 (+) Orientation (B): ↓ (−), ↑ (+) Fill volume (C): 4 mL (−), 20 mL (+) | −0.040 | −0.040 | −0.405 | 0.035 | 0.050 | 0.030 | −0.035 |
| Batch (A): 2 (−), 3 (+) Orientation (B): ↓ (−), ↑ (+) Fill volume (C): 4 mL (−), 20 mL (+) | 0.000 | −0.025 | −0.365 | −0.020 | −0.010 | 0.025 | 0.030 |
| Batch (A): 1 (−), 3 (+) Orientation (B): ↓ (−), ↑ (+) Fill volume (C): 20 mL (−), 40 mL (+) | 0.003 | −0.003 | −0.043 | 0.002 | 0.003 | −0.003 | −0.007 |
| Batch (A): 1 (−), 2 (+) Orientation (B): ↓ (−), ↑ (+) Fill volume (C): 20 mL (−), 40 mL (+) | 0.007 | −0.002 | −0.048 | 0.002 | −0.002 | 0.007 | 0.003 |
| Batch (A): 2 (−), 3 (+) Orientation (B): ↓ (−), ↑ (+) Fill volume (C): 20 mL (−), 40 mL (+) | −0.005 | 0.000 | −0.045 | 0.000 | 0.005 | 0.000 | −0.010 |
3.1.3. Sugammadex
| Batch (A): 1 (−), 3 (+) Orientation (B): → (−), ↑ (+) Fill Volume (C): 2 mL (−), 5 mL (+) API (D): 1 (−), 2 (+) | Batch (A): 1 (−), 2 (+) Orientation (B): → (−), ↑ (+) Fill Volume (C): 2 mL (−), 5 mL (+) API (D): 1 (−), 2 (+) | Batch (A): 2 (−), 3 (+) Orientation (B): → (−), ↑ (+) Fill Volume (C): 2 mL (−), 5 mL (+) API (D): 1 (−), 2 (+) | |
|---|---|---|---|
| EA *, % | 0.0037 | −0.0588 | 0.0625 |
| EB, % | 0.0062 | 0.0038 | 0.0050 |
| EC, % | −0.0438 | 0.0013 | −0.0125 |
| ED, % | −0.1563 | −0.1038 | −0.1250 |
| EAB, % | 0.0012 | −0.0012 | 0.0025 |
| EAC, % | −0.0137 | 0.0313 | −0.0450 |
| EAD, % | −0.0213 | 0.0313 | −0.0525 |
| EBC, % | −0.0062 | −0.0062 | −0.0075 |
| EBD, % | −0.0037 | −0.0013 | −0.0050 |
| ECD, % | −0.0587 | −0.0038 | −0.0175 |
| EABC, % | −0.0013 | −0.0012 | 0.0000 |
| EABD, % | −0.0037 | −0.0013 | −0.0025 |
| EACD, % | −0.0137 | 0.0412 | −0.0550 |
| EBCD, % | −0.0013 | −0.0013 | −0.0025 |
| EABCD, % | −0.0013 | −0.0013 | 0.0000 |
3.2. Regression Analysis
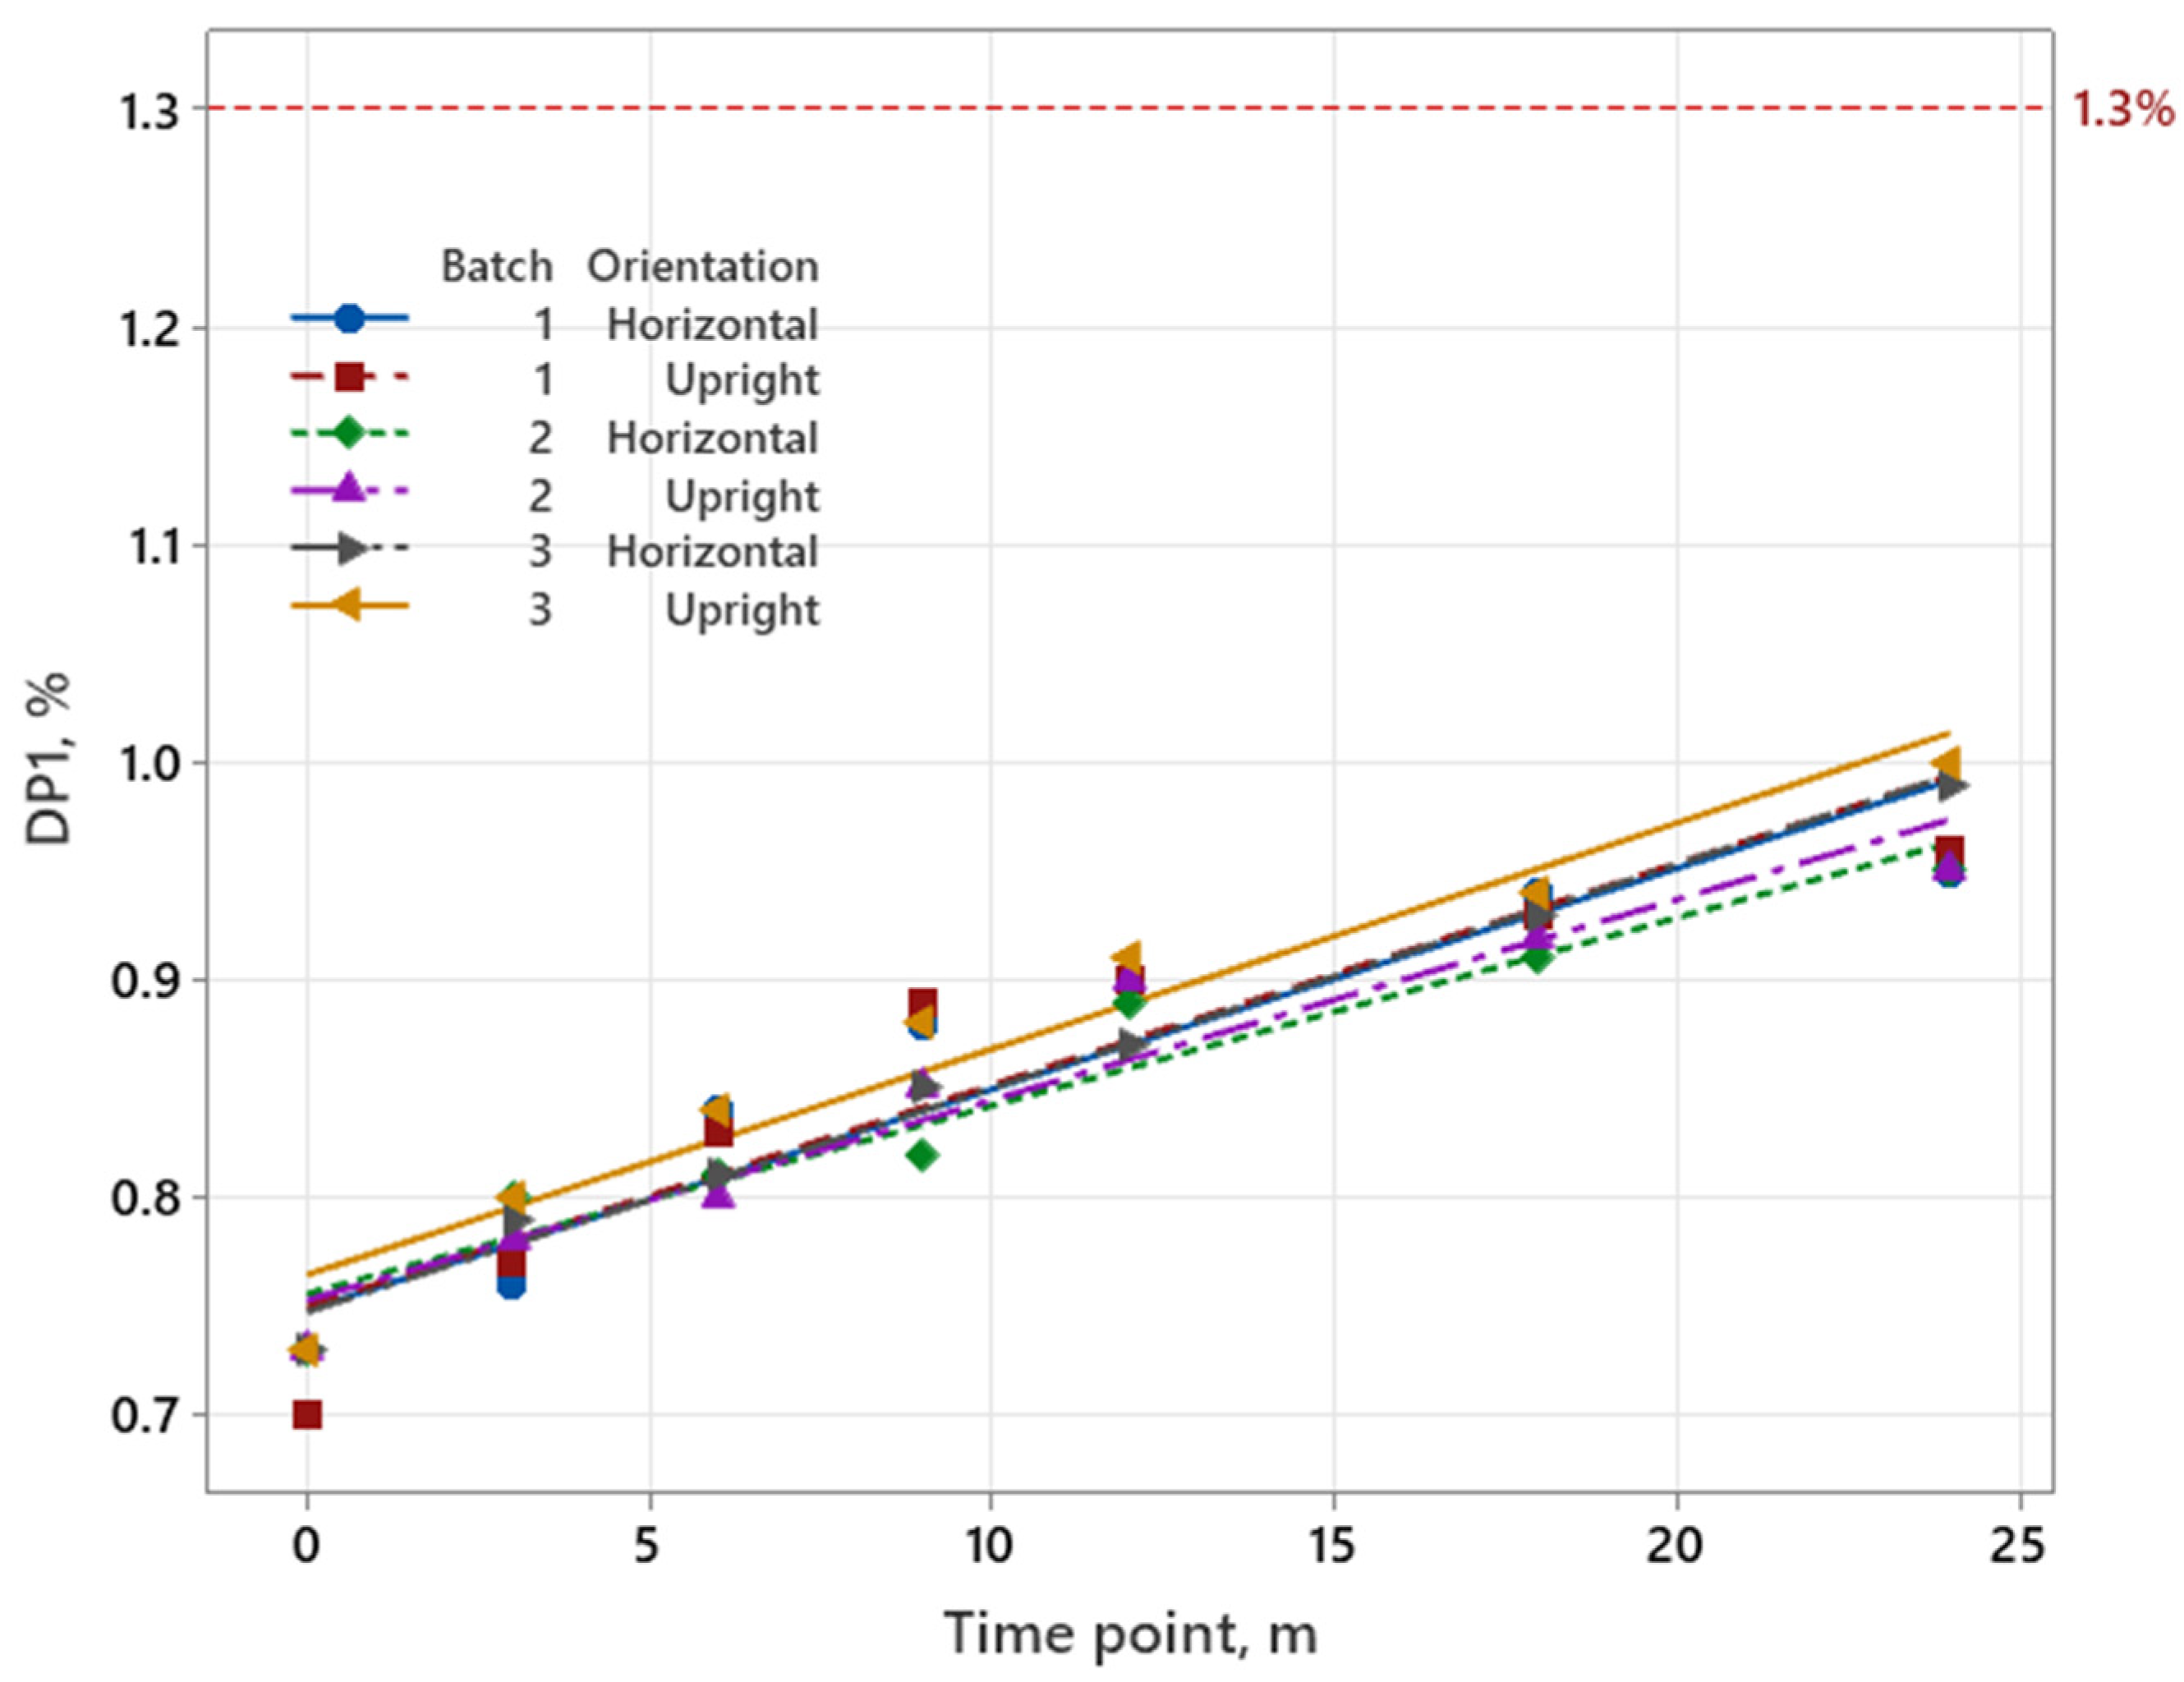
3.2.1. Iron Product
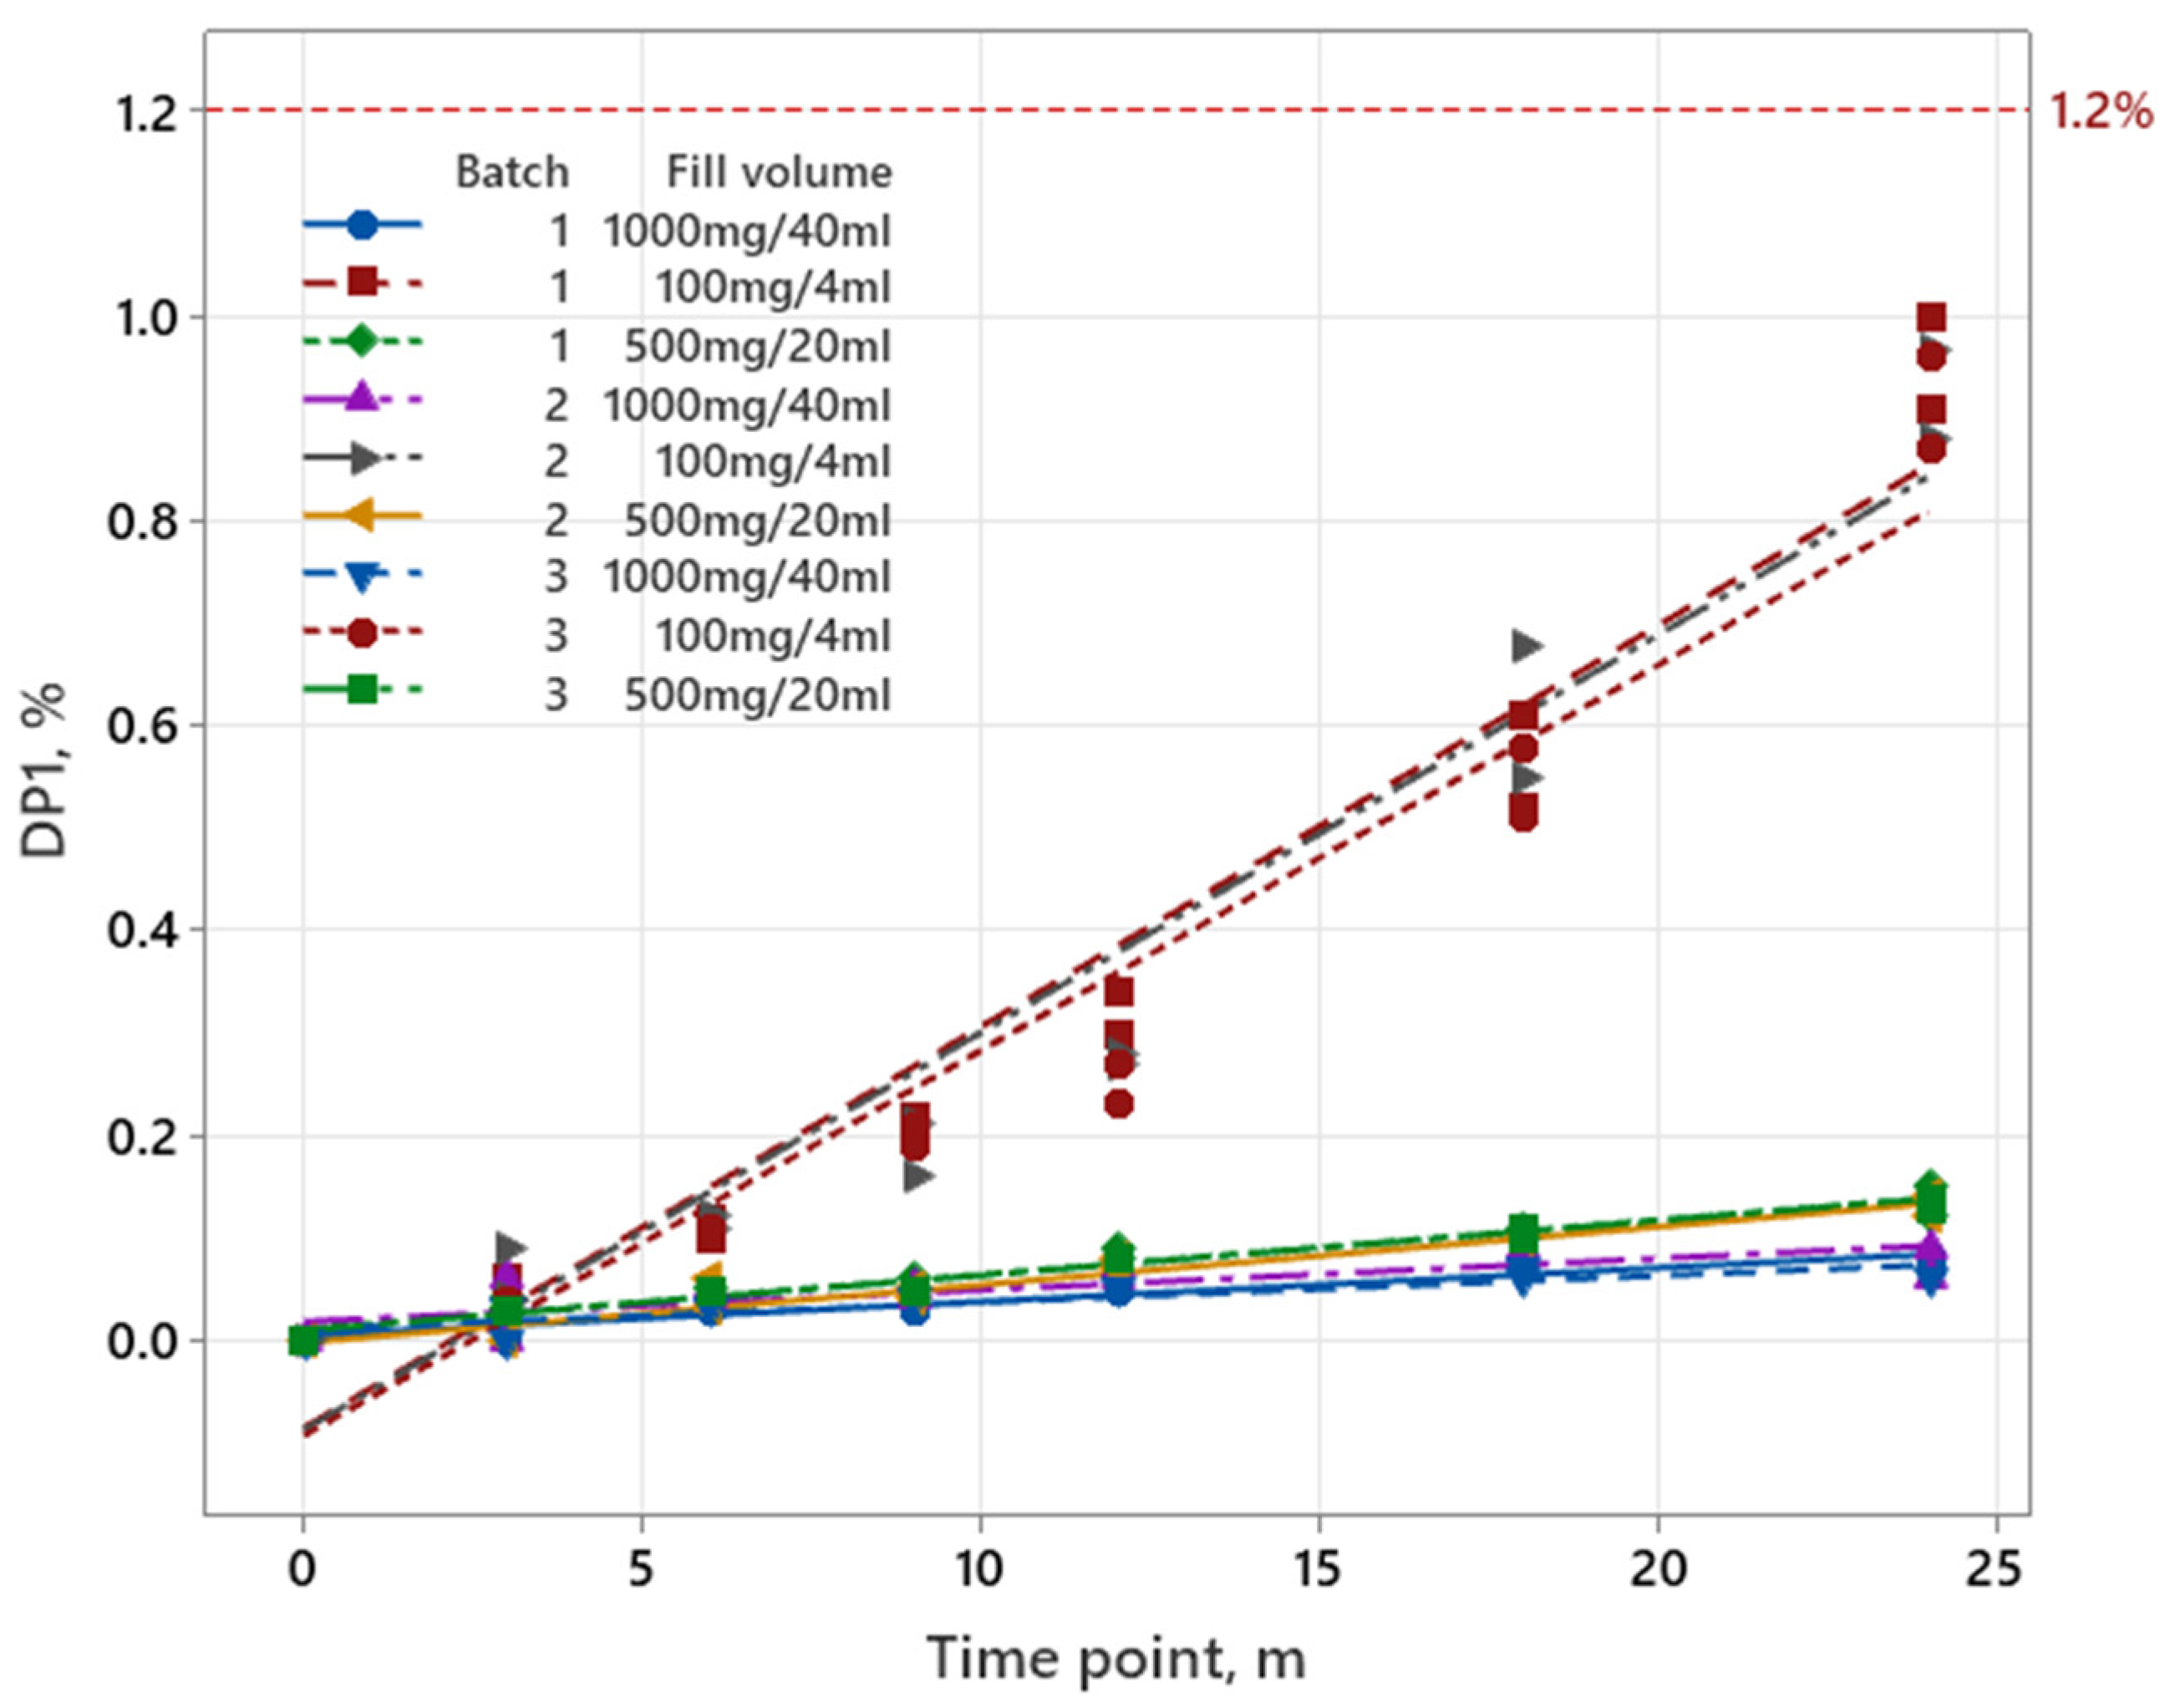
3.2.2. Pemetrexed
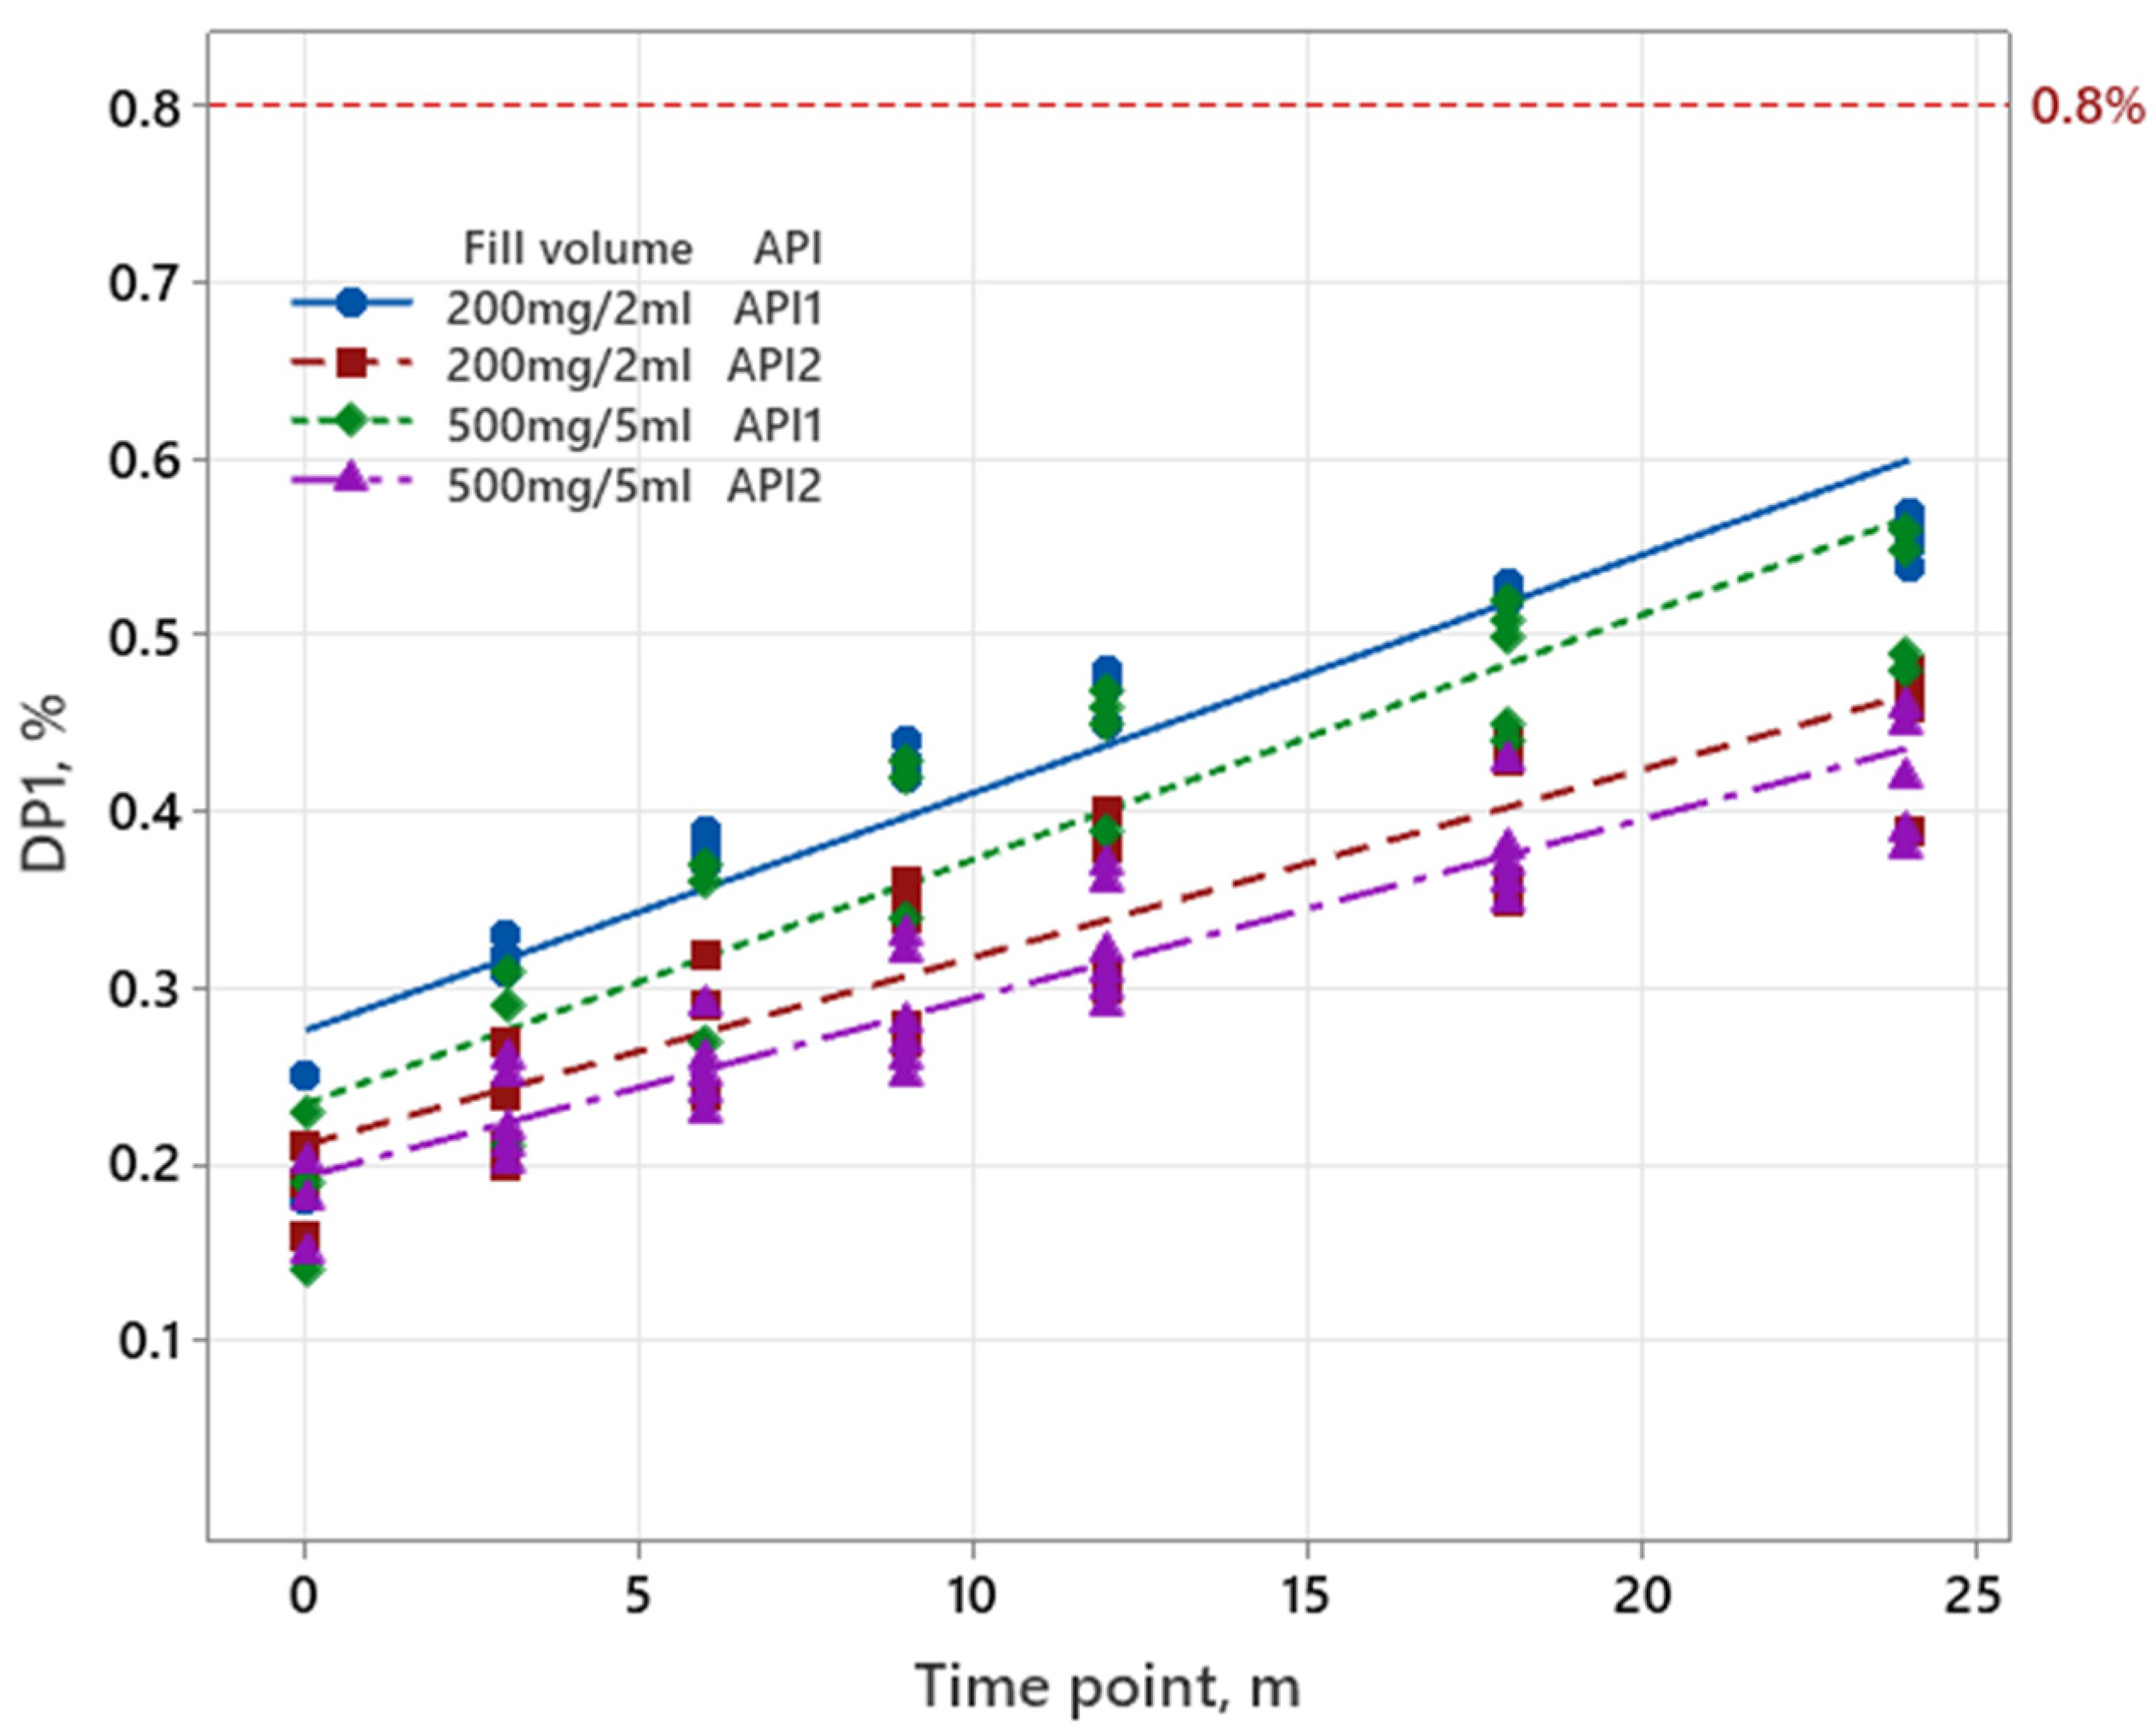
3.2.3. Sugammadex
4. Discussion
4.1. Factorial Analysis for Two-Level Complete Factorial Design
4.2. Reduction of Long-Term Stability Study and Regression Analysis for Confirmation of Reduction
5. Conclusions
Supplementary Materials
Author Contributions
Funding
Institutional Review Board Statement
Informed Consent Statement
Data Availability Statement
Conflicts of Interest
References
- Q1A(R2); Stability Testing of New Drug Substances and Products. ICH Steering Committee: Minneapolis, MN, USA, 2003.
- Aulton, M.E.; Taylor, K.M. Aulton’s Pharmaceutics: The Design and Manufacture of Medicines; Elsevier Health Sciences: Amsterdam, The Netherlands, 2021. [Google Scholar]
- Liu, F.; Hutchinson, R. Visible particles in parenteral drug products: A review of current safety assessment practice. Curr. Res. Toxicol. 2024, 7, 100175. [Google Scholar] [CrossRef] [PubMed]
- Q1D; Bracketing and Matrixing Designs for Stability Testing of New Drug Substances and Products. ICH Steering Committee: Minneapolis, MN, USA, 2002.
- Q1; Stability Testing of New Drug Substances and Products—Draft Revision. ICH: Geneva, Switzerland, 2025.
- Bohanec, S. Data Collection and the Design of Experiments. In Proceedings of the Informa Life Sciences’ 5th Annual Stability Testing for Pharmaceuticals, Vienna, Austria, 28 November 2007. [Google Scholar]
- Box, G.E.P.; Hunter, J.S.; Hunter, W.G. Statistics for Experimenters: Design, Innovation, and Discovery; Wiley-Interscience: Hoboken, NJ, USA, 2005. [Google Scholar]
- Eriksson, L.; Johansson, E.; Kettaneh-Wold, N.; Wikström, C.; Wold, S. Design of Experiments: Principles and Applications; Umetrics AB: Umeå, Sweden; Learnways AB: Stockholm, Sweden, 2008. [Google Scholar]
- Singh, A.; Chauhan, C.S. Factorial Designing—An Essential Tool in Pharmaceutical Optimization. YMER Digit. 2022, 21, 519–525. [Google Scholar] [CrossRef]
- Antony, J. Design of Experiments for Engineers and Scientists; Elsevier: Amsterdam, The Netherlands, 2021. [Google Scholar]
- Jordan, N.; Zakrajšek, J.; Bohanec, S.; Roškar, R.; Grabnar, I. Applying the methodology of Design of Experiments to stability studies: A Partial Least Squares approach for evaluation of drug stability. Drug Dev. Ind. Pharm. 2017, 44, 778–786. [Google Scholar] [CrossRef] [PubMed]
- Bohanec, S.; Peterka, T.R.; Blazic, P.; Jurecic, R.; Grmas, J.; Krivec, A.; Zakrajsek, J. Using Different Experimental Designs in Drug-Excipient Compatibility Studies During the Preformulation Development of a Stable Solid Dosage Formulation. Acta Chim. Slov. 2010, 57, 895–903. [Google Scholar] [PubMed]
- Petelin, P.; Homar, M.; Bajc, A.; Kerč, J.; Simona, B. Use of factorial design for evaluation of factors affecting the chemical stability of sirolimus (rapamycin) in solid dosage form. Acta Chim. Slov. 2012, 59, 156–162. [Google Scholar] [PubMed]
- Nordbrock, E. Statistical comparison of stability study designs. J. Biopharm. Stat. 1992, 2, 91–113. [Google Scholar] [CrossRef] [PubMed]
- Chow, S.-C. Statistical Design and Analysis of Stability Studies; Chapman & Hall/CRC: New York, NY, USA, 2007. [Google Scholar]
- Natarajan, J.; Altan, S.; Raghavarao, D. Expiration Dating of Pharmaceutical Compounds in Relation to Analytical Variation, Degradation Rate, and Matrix Designs. Drug Inf. J. 1997, 31, 589–595. [Google Scholar] [CrossRef]
- DeWoody, K.; Raghavarao, D. Some optimal matrix designs in stability studies. J. Biopharm. Stat. 1997, 7, 205–213. [Google Scholar] [CrossRef] [PubMed]
- Oliva, A.; Fariña, J.; Llabrés, M. Comparison of Shelf-Life Estimates for a Human Insulin Pharmaceutical Preparation Using the Matrix and Full-Testing Approaches. Drug Dev. Ind. Pharm. 2003, 29, 513–521. [Google Scholar] [CrossRef] [PubMed]
- Pavčnik, L.; Locatelli, I.; Lušin, T.T.; Roškar, R. Matrixing Designs for Shelf-Life Determination of Parenteral Drug Product: A Comparative Analysis of Full and Reduced Stability Testing Design. Pharmaceutics 2024, 16, 1117. [Google Scholar] [CrossRef] [PubMed]
- Pavčnik, L.; Prunk, M.; Lušin, T.T.; Roškar, R. Accelerated Predictive Stability Testing: Accelerating Registration Phase and Application of Reduced Designs for Shelf-Life Determination of Parenteral Drug Product. Pharmaceutics 2025, 17, 160. [Google Scholar] [CrossRef]
- Akers, M.J. Sterile Drug Products: Formulation, Packaging, Manufacturing and Quality; CRC Press: Boca Raton, FL, USA, 2010. [Google Scholar]
- Barrado, E. Two-Level Factorial Designs. In Design of Experiments for Chemical, Pharmaceutical, and Food Industries; IGI Global Scientific Publishing: Hershey, PA, USA, 2020; Chapter 13; pp. 300–314. [Google Scholar]
- Moder, M.; Bohanec, S.; Zupan, J. A tool for the determination and classification of the main and interactive effects using experimental designs. Acta Chim. Slov. 1997, 44, 181–196. [Google Scholar]
- ICH Q1E; Evaluation of Stability Data. European Medicines Agency (EMA): Amsterdam, The Netherlands, 2003.
- Carstensen, J.T. Stability and Dating of Solid Dosage Forms. In Pharmaceutics of Solids and Solid Dosage Forms; Wiley-Interscience: Hoboken, NJ, USA, 1977; pp. 182–185. [Google Scholar]


| Iron Product | Pemetrexed | Sugammadex | |
|---|---|---|---|
| Number of batches | 3 | 3 | 3 |
| Number of filling volumes | 1 | 3 | 2 |
| Number of orientations | 2 | 2 | 2 |
| Number of API | 1 | 1 | 2 |
| Sampling time (months): | |||
| Long-term testing | 0, 3, 6, 9, 12, 18, 24 | 0, 3, 6, 9, 12, 18, 24 | 0, 3, 6, 9, 12, 18, 24 |
| Accelerated testing | 0, 3, 6 | 0, 3, 6 | 0, 3, 6 |
| Total number of samples tested | 60 | 180 | 240 |
| Experiment | A | B | AB | Answer |
|---|---|---|---|---|
| 1 | − | − | + | y1 |
| 2 | − | + | − | y2 |
| 3 | + | − | − | y3 |
| 4 | + | + | + | y4 |
| Effect | EA | EB | EAB | / |
| Experiment | A | B | C | AB | AC | BC | ABC | Answer |
|---|---|---|---|---|---|---|---|---|
| 1 | − | − | − | + | + | + | − | y1 |
| 2 | − | − | + | + | − | − | + | y2 |
| 3 | − | + | − | − | + | − | + | y3 |
| 4 | − | + | + | − | − | + | − | y4 |
| 5 | + | − | − | − | − | + | + | y5 |
| 6 | + | − | + | − | + | − | − | y6 |
| 7 | + | + | − | + | − | − | − | y7 |
| 8 | + | + | + | + | + | + | + | y8 |
| Effect | EA | EB | EC | EAB | EAC | EBC | EABC | / |
| Experiment | A | B | C | D | AB | AC | AD | BC | BD | CD | ABC | ABD | ACD | BCD | ABCD | Answer |
|---|---|---|---|---|---|---|---|---|---|---|---|---|---|---|---|---|
| 1 | − | − | − | − | + | + | + | + | + | + | − | − | − | − | + | y1 |
| 2 | − | − | − | + | + | + | − | + | − | − | − | + | + | + | − | y2 |
| 3 | − | − | + | − | + | − | + | − | + | − | + | − | + | + | − | y3 |
| 4 | − | − | + | + | + | − | − | − | − | + | + | + | − | − | + | y4 |
| 5 | − | + | − | − | − | + | + | − | − | + | + | + | − | + | − | y5 |
| 6 | − | + | − | + | − | + | − | − | + | − | + | − | + | − | + | y6 |
| 7 | − | + | + | − | − | − | + | + | − | − | − | + | + | − | + | y7 |
| 8 | − | + | + | + | − | − | − | + | + | + | − | − | − | + | − | y8 |
| 9 | + | − | − | − | − | − | − | + | + | + | + | + | + | − | − | y9 |
| 10 | + | − | − | + | − | − | + | + | − | − | + | − | − | + | + | y10 |
| 11 | + | − | + | − | − | + | − | − | + | − | − | + | + | + | y11 | |
| 12 | + | − | + | + | − | + | + | − | − | + | − | − | + | − | − | y12 |
| 13 | + | + | − | − | + | − | − | − | − | + | − | − | + | + | + | y13 |
| 14 | + | + | − | + | + | − | + | − | + | − | − | + | − | − | − | y14 |
| 15 | + | + | + | − | + | + | − | + | − | − | + | − | − | − | − | y15 |
| 16 | + | + | + | + | + | + | + | + | + | + | + | + | + | + | + | y16 |
| Effect | EA | EB | EC | ED | EAB | EAC | EAD | EBC | EBD | ECD | EABC | EABD | EACD | EBCD | EABCD | / |
| Full Stability Design | Reduced Stability Design | ||
|---|---|---|---|
| M1 | M2 A | M3 B | |
| Number of batches | 3 | 2 | 3 |
| Number of orientations | 2 | 2 | 1 |
| Shelf life, months | 52.0 | 49.0 | 49.4 |
| RMSE, % C | / | 0.00462 | 0.00439 |
| reduction of long-term stability study, % | / | 33 | 50 |
| Full Stability Design | Reduced Stability Design | ||
|---|---|---|---|
| M1 | M2 A | M3 B | |
| Number of batches | 3 | 3 | 3 |
| Number of orientations | 2 | 2 | 1 |
| Number of filling volumes | 3 | 1 | 1 |
| Shelf life, months | 31.9 | 31.9 | 29.8 |
| RMSE, % C | / | / | 0.02701 |
| reduction of long-term stability study, % | / | 66 | 83 |
| Full Stability Design | Reduced Stability Design | ||||
|---|---|---|---|---|---|
| M1 | M2 A | M3 B | M4 C | M5 D | |
| Number of batches | 3 | 3 | 3 | 3 | 3 |
| Number of orientations | 2 | 2 | 2 | 1 | 1 |
| Number of fill volumes | 2 | 2 | 1 | 2 | 1 |
| Number of APIs | 2 | 1 | 1 | 1 | 1 |
| Shelf life, months | 37.5 | 37.5 | 36.3 | 37.0 | 35.4 |
| RMSE, % E | / | / | 0.01877 | 0.00236 | 0.01703 |
| reduction of long-term stability study, % | / | 50 | 75 | 75 | 87.5 |
Disclaimer/Publisher’s Note: The statements, opinions and data contained in all publications are solely those of the individual author(s) and contributor(s) and not of MDPI and/or the editor(s). MDPI and/or the editor(s) disclaim responsibility for any injury to people or property resulting from any ideas, methods, instructions or products referred to in the content. |
© 2025 by the authors. Licensee MDPI, Basel, Switzerland. This article is an open access article distributed under the terms and conditions of the Creative Commons Attribution (CC BY) license (https://creativecommons.org/licenses/by/4.0/).
Share and Cite
Pavčnik, L.; Bohanec, S.; Trdan Lušin, T.; Roškar, R. Use of Factorial Designs to Reduce Stability Studies for Parenteral Drug Products: Determination of Factor Effects via Accelerated Stability Data Analysis. Pharmaceutics 2025, 17, 1067. https://doi.org/10.3390/pharmaceutics17081067
Pavčnik L, Bohanec S, Trdan Lušin T, Roškar R. Use of Factorial Designs to Reduce Stability Studies for Parenteral Drug Products: Determination of Factor Effects via Accelerated Stability Data Analysis. Pharmaceutics. 2025; 17(8):1067. https://doi.org/10.3390/pharmaceutics17081067
Chicago/Turabian StylePavčnik, Lara, Simona Bohanec, Tina Trdan Lušin, and Robert Roškar. 2025. "Use of Factorial Designs to Reduce Stability Studies for Parenteral Drug Products: Determination of Factor Effects via Accelerated Stability Data Analysis" Pharmaceutics 17, no. 8: 1067. https://doi.org/10.3390/pharmaceutics17081067
APA StylePavčnik, L., Bohanec, S., Trdan Lušin, T., & Roškar, R. (2025). Use of Factorial Designs to Reduce Stability Studies for Parenteral Drug Products: Determination of Factor Effects via Accelerated Stability Data Analysis. Pharmaceutics, 17(8), 1067. https://doi.org/10.3390/pharmaceutics17081067


