
Preclinical Pharmacokinetic Evaluation of Mithramycin and Mithramycin SA Tryptophan-Conjugated Analog


 ,
,  ,
,
Abstract

1. Introduction
2. Materials and Methods
2.1. Test Compounds and Animals
2.2. Plasma Protein Binding
2.3. Pharmacokinetic Studies
2.3.1. Pharmacokinetic Studies in Mice
2.3.2. Pharmacokinetic Studies in Rats
2.3.3. Pharmacokinetic Studies in Monkeys
2.3.4. Allometric Scaling
2.4. LC-MS/MS Analysis
2.5. Pharmacokinetic Data Analysis
3. Results and Discussion
3.1. Plasma Protein Binding
3.2. Pharmacokinetic Studies
3.3. Dose Proportionality
4. Conclusions
Author Contributions
Funding
Institutional Review Board Statement
Informed Consent Statement
Data Availability Statement
Acknowledgments
Conflicts of Interest
Abbreviations
| NCA | Noncompartmental analysis |
| Clast | Last measurable concentration |
| AUClast | Area under the curve from time zero to last measurable concentration-time point |
| AUC0–inf | Area under the curve from time zero extrapolated to infinity |
| CL | Systemic clearance |
| Vd | Volume of distribution |
| MRTinf | Mean residence time from time zero to infinity |
| PK | Pharmacokinetics |
References
- Riggi, N.; Suvà, M.L.; Stamenkovic, I. Ewing’s Sarcoma. N. Engl. J. Med. 2021, 384, 154–164. [Google Scholar] [CrossRef]
- Grünewald, T.G.P.; Cidre-Aranaz, F.; Surdez, D.; Tomazou, E.M.; de Álava, E.; Kovar, H.; Sorensen, P.H.; Delattre, O.; Dirksen, U. Ewing sarcoma. Nat. Rev. Dis. Primers 2018, 4, 5. [Google Scholar] [CrossRef] [PubMed]
- Osgood, C.L.; Maloney, N.; Kidd, C.G.; Kitchen-Goosen, S.; Segars, L.; Gebregiorgis, M.; Woldemichael, G.M.; He, M.; Sankar, S.; Lessnick, S.L.; et al. Identification of Mithramycin Analogues with Improved Targeting of the EWS-FLI1 Transcription Factor. Clin. Cancer Res. 2016, 22, 4105–4118. [Google Scholar] [CrossRef] [PubMed]
- Mitra, P.; Eckenrode, J.M.; Mandal, A.; Jha, A.K.; Salem, S.M.; Leggas, M.; Rohr, J. Development of Mithramycin Analogues with Increased Selectivity toward ETS Transcription Factor Expressing Cancers. J. Med. Chem. 2018, 61, 8001–8016. [Google Scholar] [CrossRef] [PubMed]
- Liu, Y.; Eckenrode, J.M.; Zhang, Y.; Zhang, J.; Hayden, R.C.; Kyomuhangi, A.; Ponomareva, L.V.; Cui, Z.; Rohr, J.; Tsodikov, O.V.; et al. Mithramycin 2′-Oximes with Improved Selectivity, Pharmacokinetics, and Ewing Sarcoma Antitumor Efficacy. J. Med. Chem. 2020, 63, 14067–14086. [Google Scholar] [CrossRef]
- Grohar, P.J.; Woldemichael, G.M.; Griffin, L.B.; Mendoza, A.; Chen, Q.R.; Yeung, C.; Currier, D.G.; Davis, S.; Khanna, C.; Khan, J.; et al. Identification of an inhibitor of the EWS-FLI1 oncogenic transcription factor by high-throughput screening. J. Natl. Cancer Inst. 2011, 103, 962–978. [Google Scholar] [CrossRef]
- Grohar, P.J.; Glod, J.; Peer, C.J.; Sissung, T.M.; Arnaldez, F.I.; Long, L.; Figg, W.D.; Whitcomb, P.; Helman, L.J.; Widemann, B.C. A phase I/II trial and pharmacokinetic study of mithramycin in children and adults with refractory Ewing sarcoma and EWS-FLI1 fusion transcript. Cancer Chemother. Pharmacol. 2017, 80, 645–652. [Google Scholar] [CrossRef]
- Sissung, T.M.; Huang, P.A.; Hauke, R.J.; McCrea, E.M.; Peer, C.J.; Barbier, R.H.; Strope, J.D.; Ley, A.M.; Zhang, M.; Hong, J.A.; et al. Severe Hepatotoxicity of Mithramycin Therapy Caused by Altered Expression of Hepatocellular Bile Transporters. Mol. Pharmacol. 2019, 96, 158–167. [Google Scholar] [CrossRef]
- Remsing, L.L.; González, A.M.; Nur-e-Alam, M.; Fernández-Lozano, M.J.; Braña, A.F.; Rix, U.; Oliveira, M.A.; Méndez, C.; Salas, J.A.; Rohr, J. Mithramycin SK, a novel antitumor drug with improved therapeutic index, mithramycin SA, and demycarosyl-mithramycin SK: Three new products generated in the mithramycin producer Streptomyces argillaceus through combinatorial biosynthesis. J. Am. Chem. Soc. 2003, 125, 5745–5753. [Google Scholar] [CrossRef]
- Leggas, M.; Niloy, K.K.; Yetijaram, R.; Horn, J.; Kazuto, Y.; Prisinzano, T.; Thorson, J.S.; Tsoikov, O.; Rohr, J. Abstract B150: Targeting EWS-FLI1 with mithramycin analogues for Ewing sarcoma treatment. Mol. Cancer Ther. 2023, 22 (Suppl. S12), B150. [Google Scholar] [CrossRef]
- Yetirajam, R.; Acharya, S.; Niloy, K.K.; Kazuto, Y.; Horn, J.; Prisinzano, T.; Thorson, J.S.; Tsodikov, O.; Rohr, J.; Leggas, M. Development of a novel mithramycin analogue with improved pharmacokinetics and therapeutic window for targeted inhibition of EWS-FLI1 in Ewing sarcoma. Cancer Res. 2025, 85 (Suppl. S8), 4360. [Google Scholar] [CrossRef]
- Weidenbach, S.; Hou, C.; Chen, J.M.; Tsodikov, O.V.; Rohr, J. Dimerization and DNA recognition rules of mithramycin and its analogues. J. Inorg. Biochem. 2016, 156, 40–47. [Google Scholar] [CrossRef] [PubMed]
- Ryu, S.; Tess, D.; Di, L. Addressing the Accuracy of Plasma Protein Binding Measurement for Highly Bound Compounds Using the Dilution Method. AAPS J. 2022, 25, 7. [Google Scholar] [CrossRef]
- U.S. Food and Drug Administration. Estimating the Maximum Safe Starting Dose in Initial Clinical Trials for Therapeutics in Adult Healthy Volunteers. 2005. Available online: https://www.fda.gov/media/72309/download (accessed on 3 June 2025).
- Eckenrode, J.M.; Mitra, P.; Rohr, J.; Leggas, M. Bioanalytical method for quantitative determination of mithramycin analogs in mouse plasma by HPLC-QTOF. Biomed. Chromatogr. 2019, 33, e4544. [Google Scholar] [CrossRef]
- Roth, J.; Peer, C.J.; Widemann, B.; Cole, D.E.; Ershler, R.; Helman, L.; Schrump, D.; Figg, W.D. Quantitative determination of mithramycin in human plasma by a novel, sensitive ultra-HPLC-MS/MS method for clinical pharmacokinetic application. J. Chromatogr. B Anal. Technol. Biomed. Life Sci. 2014, 970, 95–101. [Google Scholar] [CrossRef]
- Gabrielsson, J.; Weiner, D. Non-Compartmental Analysis. Methods Mol Biol. 2012, 929, 377–389. [Google Scholar] [CrossRef]
- Kamei, N.; Tamiwa, H.; Miyata, M.; Haruna, Y.; Matsumura, K.; Ogino, H.; Hirano, S.; Higashiyama, K.; Takeda-Morishita, M. Hydrophobic Amino Acid Tryptophan Shows Promise as a Potential Absorption Enhancer for Oral Delivery of Biopharmaceuticals. Pharmaceutics 2018, 10, 182. [Google Scholar] [CrossRef] [PubMed]
- Watanabe, R.; Esaki, T.; Kawashima, H.; Natsume-Kitatani, Y.; Nagao, C.; Ohashi, R.; Mizuguchi, K. Predicting Fraction Unbound in Human Plasma from Chemical Structure: Improved Accuracy in the Low Value Ranges. Mol. Pharm. 2018, 15, 5302–5311. [Google Scholar] [CrossRef]
- Ermondi, G.; Lorenti, M.; Caron, G. Contribution of ionization and lipophilicity to drug binding to albumin: A preliminary step toward biodistribution prediction. J. Med. Chem. 2004, 47, 3949–3961. [Google Scholar] [CrossRef]
- Han, S.; Mei, L.; Quach, T.; Porter, C.; Trevaskis, N. Lipophilic Conjugates of Drugs: A Tool to Improve Drug Pharmacokinetic and Therapeutic Profiles. Pharm. Res. 2021, 38, 1497–1518. [Google Scholar] [CrossRef]
- Roberts, J.A.; Pea, F.; Lipman, J. The clinical relevance of plasma protein binding changes. Clin. Pharmacokinet. 2013, 52, 1–8. [Google Scholar] [CrossRef] [PubMed]
- Deitchman, A.N.; Singh, R.S.P.; Derendorf, H. Nonlinear Protein Binding: Not What You Think. J. Pharm. Sci. 2018, 107, 1754–1760. [Google Scholar] [CrossRef] [PubMed]
- Malek, A.; Núñez, L.-E.; Magistri, M.; Brambilla, L.; Jovic, S.; Carbone, G.M.; Morís, F.; Catapano, C.V. Modulation of the Activity of Sp Transcription Factors by Mithramycin Analogues as a New Strategy for Treatment of Metastatic Prostate Cancer. PLoS ONE 2012, 7, e35130. [Google Scholar] [CrossRef] [PubMed]
- Núñez, L.E.; Nybo, S.E.; González-Sabín, J.; Pérez, M.; Menéndez, N.; Braña, A.F.; Shaaban, K.A.; He, M.; Morís, F.; Salas, J.A.; et al. A Novel Mithramycin Analogue with High Antitumor Activity and Less Toxicity Generated by Combinatorial Biosynthesis. J. Med. Chem. 2012, 55, 5813–5825. [Google Scholar] [CrossRef]
- Elmeliegy, M.; Udata, C.; Liao, K.; Yin, D. Considerations on the Calculation of the Human Equivalent Dose from Toxicology Studies for Biologic Anticancer Agents. Clin. Pharmacokinet. 2021, 60, 563–567. [Google Scholar] [CrossRef]
- Singh, R.S.P.; Mukker, J.K.; Deitchman, A.N.; Drescher, S.K.; Derendorf, H. Role of Divalent Metal Ions in Atypical Nonlinear Plasma Protein Binding Behavior of Tigecycline. J. Pharm. Sci. 2016, 105, 3409–3414. [Google Scholar] [CrossRef]


| Study | Species | Strain | Gender | Compound | Dose | No. of Animals | Time Points | Sampling Procedure |
|---|---|---|---|---|---|---|---|---|
| 1 | Mouse | Athymic nude | Male | MTM | 2 mg/kg | 15 | 5 min, 30 min, 1.5 h, 3 h, 6 h | Destructive |
| MTMSA-Trp | 2 mg/kg | 15 | ||||||
| 2 | Rat | Sprague Dawley | Male | MTM | 0.5 mg/kg | 6 | 5 min, 20 min, 1 h, 3 h, 6 h, 9 h | Serial |
| MTMSA-Trp | 0.5 mg/kg | 6 | ||||||
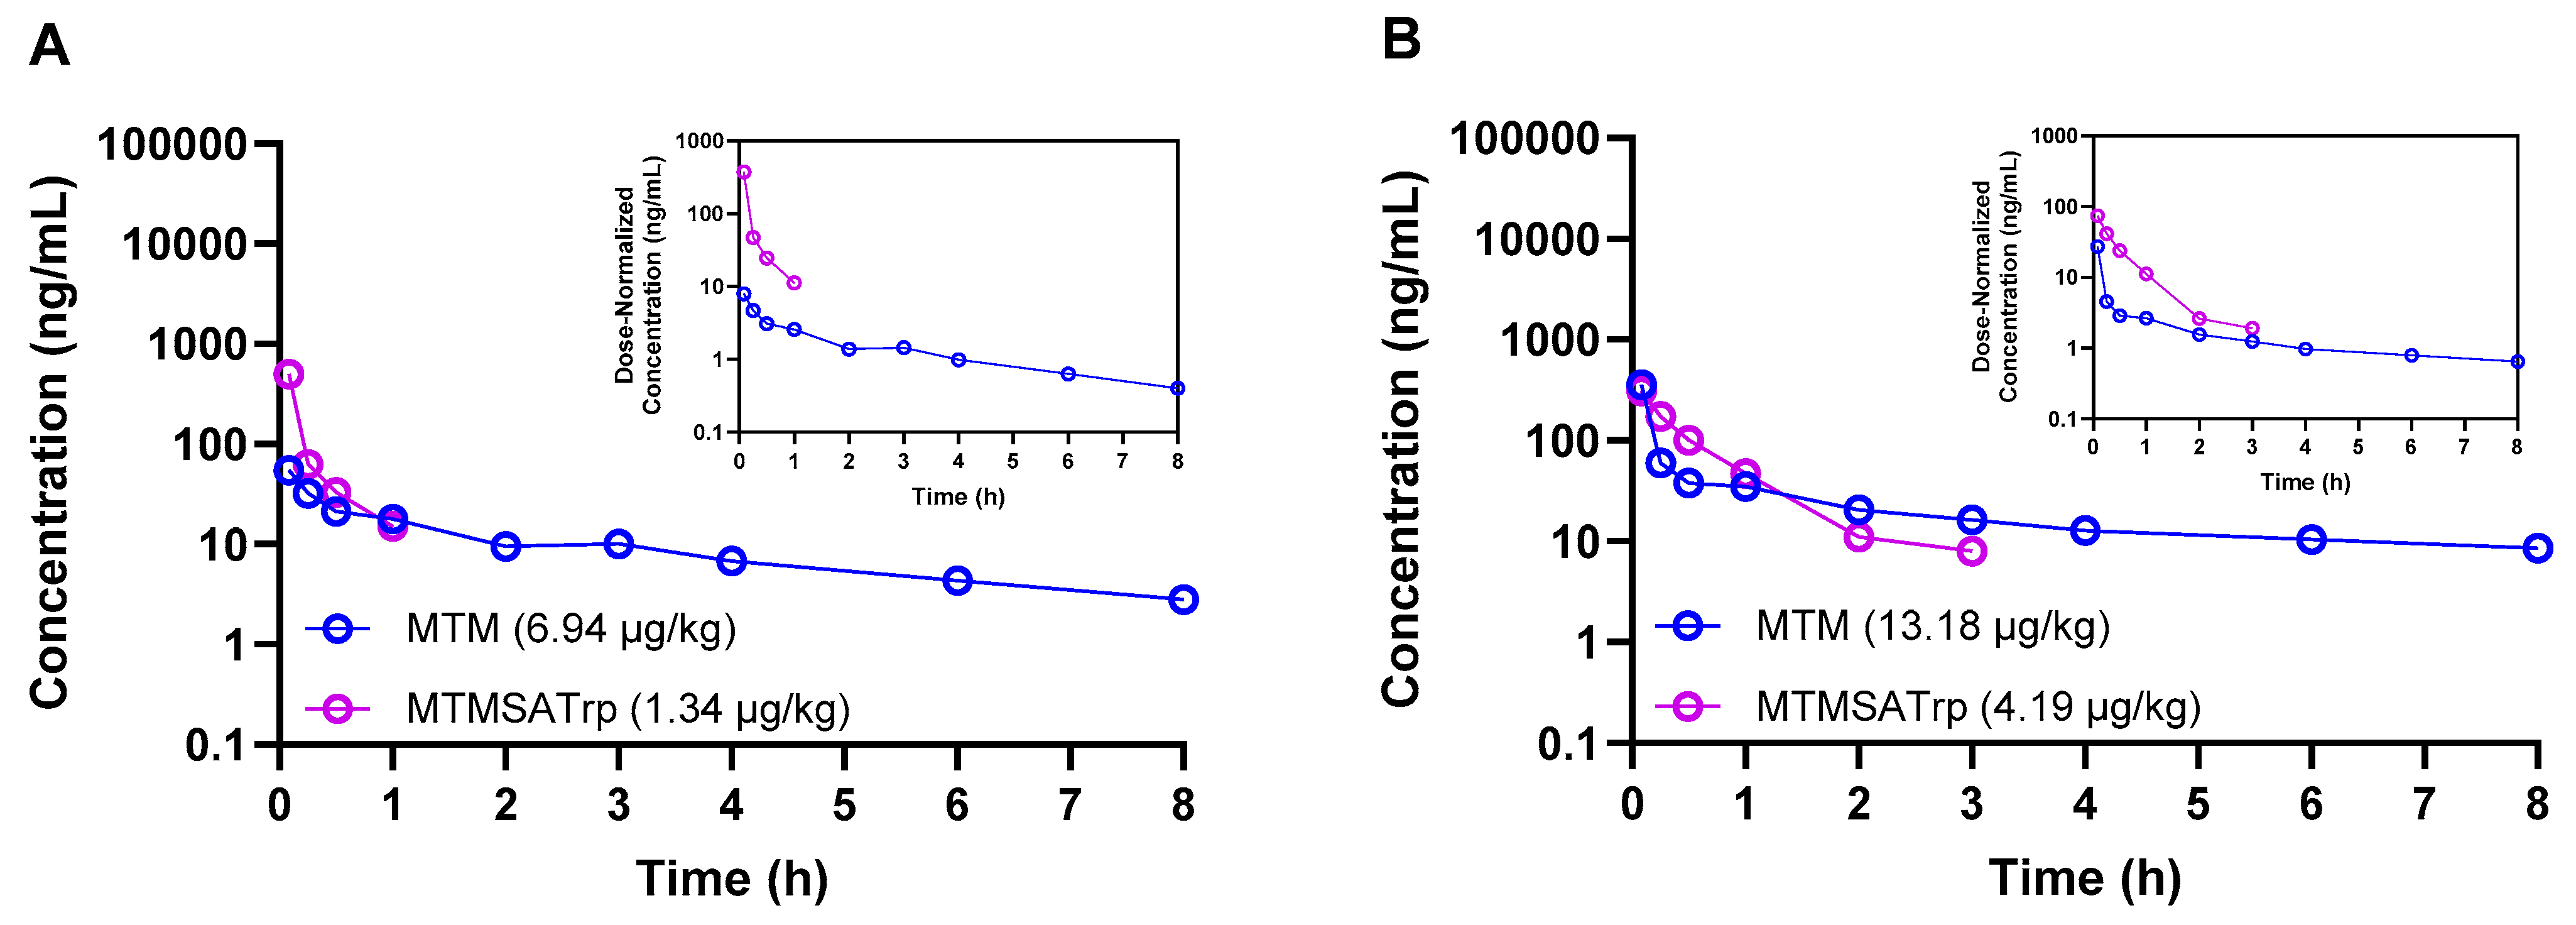
| 3 | Monkey | Cynomolgus | Male | MTM | 6.94 µg/kg | 1 | 5 min, 15 min, 30 min, 1 h, 2 h, 3 h, 4 h, 6 h, 8 h | Serial |
| MTMSA-Trp | 1.34 µg/kg | 1 | 5 min, 15 min, 30 min, 1 h, 2 h, 3 h, 4 h, 6 h, 8 h | |||||
| 4 | Monkey | Cynomolgus | Male | MTM | 13.18 µg/kg | 1 | 5 min, 15 min, 30 min, 1 h, 2 h, 3 h, 4 h, 6 h, 8 h | Serial |
| MTMSA-Trp | 4.19 µg/kg | 1 | 5 min, 15 min, 30 min, 1 h, 2 h, 3 h, 4 h, 6 h, 8 h | |||||
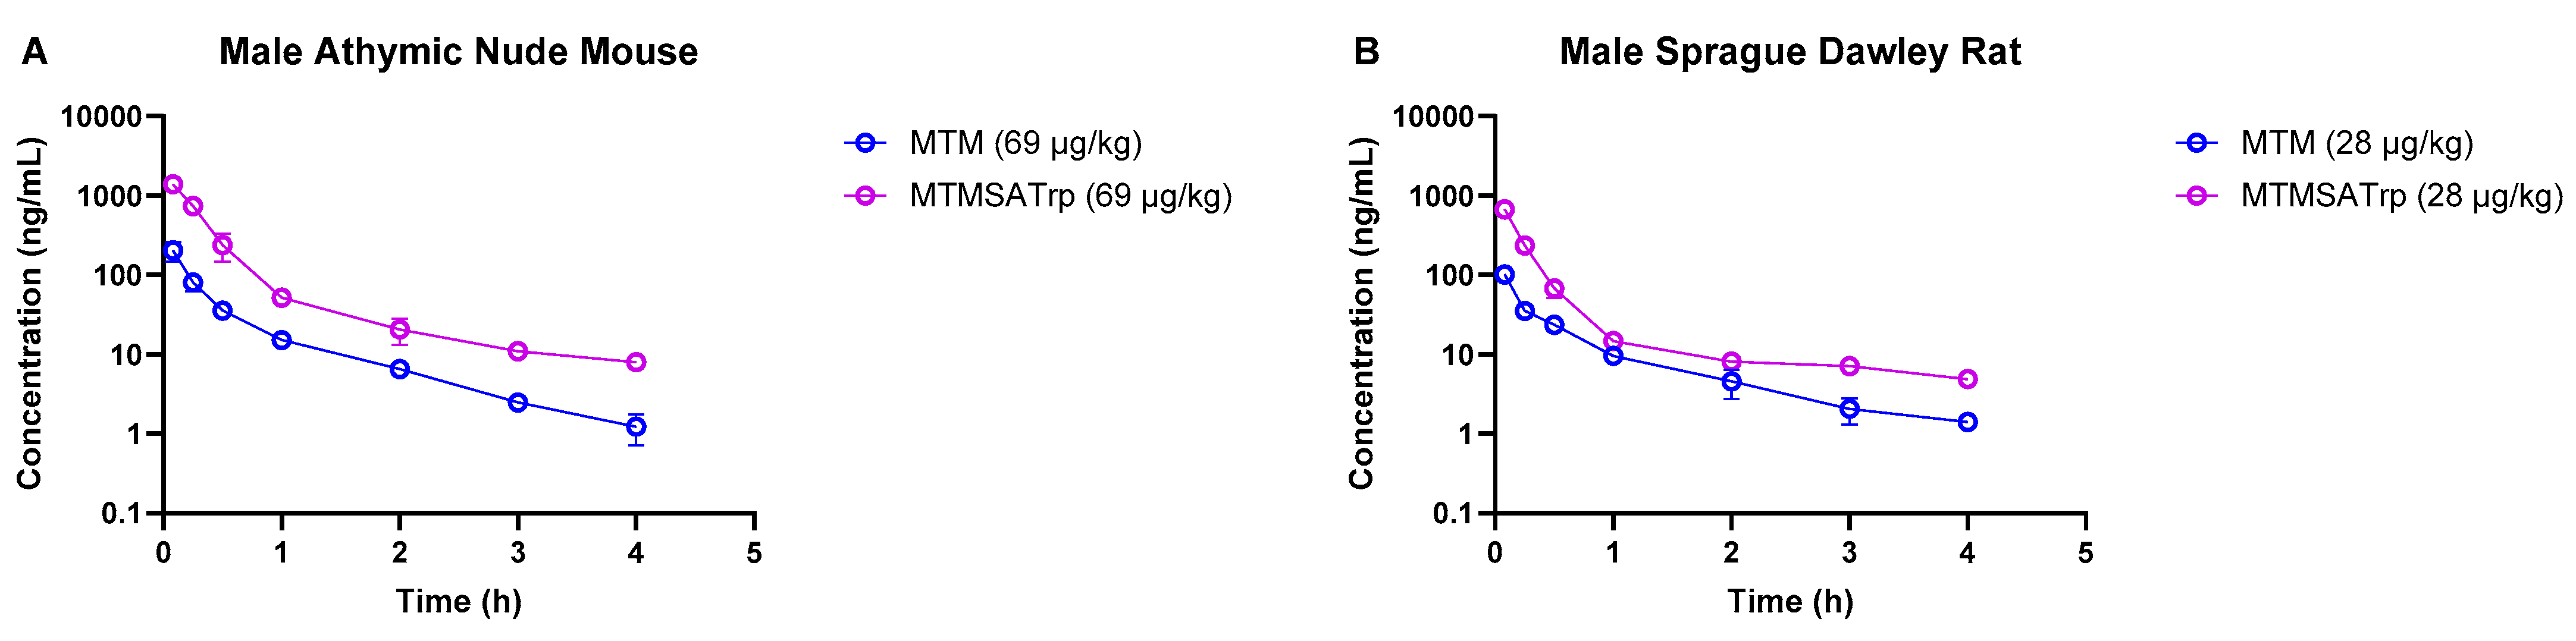
| 5 | Mouse | Athymic nude | Male | MTM and MTMSA-Trp 1 | 69 µg/kg 2 | 9 | 5 min, 15 min, 30 min, 1 h, 2 h, 3 h, 4 h, 5 h, 6 h | Serial |
| 6 | Rat | Sprague Dawley | Male | MTM and MTMSA-Trp 1 | 28 µg/kg 2 | 9 | Serial | |
| 7 | Mouse | Athymic nude | Female | MTMSA-Trp | 1 mg/kg | 12 | 5 min, 30 min, 2 h, 5 h | Destructive |
| 3 mg/kg | 12 | |||||||
| 10 mg/kg | 12 | |||||||
| 8 | Mouse | Athymic nude | Female | MTMSA-Trp | 0.3 mg/kg | 9 | 10 min, 20 min, 30 min, 45 min, 1 h, 1.5 h, 2 h, 2.5 h, 3 h | Serial |
| 1 mg/kg | 9 | 5 min, 15 min, 30 min, 1 h, 2 h, 3 h, 4 h, 6 h, 8 h | ||||||
| 3 mg/kg | 9 | 5 min, 15 min, 30 min, 1 h, 2 h, 4 h, 6 h, 9 h, 12 h | ||||||
| 9 | Mouse | Athymic nude | Female | MTMSA-Trp | 5 mg/kg | 10 | 10 min, 30 min, 1 h, 3 h, 6 h | Destructive |
| Plasma | Compound | Fraction Unbound (%) | ||
|---|---|---|---|---|
| 1 µM | 3 µM | 10 µM | ||
| Mouse 1 | MTM | 4.61 ± 0.63 | 1.95 ± 0.14 | 1.08 ± 0.35 |
| MTMSA-Trp | <1 | <1 | <1 | |
| Rat 2 | MTM | 17.99 ± 1.57 | 15.15 ± 2.85 | 16.82 ± 1.21 |
| MTMSA-Trp | 2.41 ± 1.29 | 3.85 ± 0.08 | 3.88 ± 0.54 | |
| Monkey 3 | MTM | 10.07 ± 1.34 | 12.75 ± 0.38 | 12.77 ± 1.19 |
| MTMSA-Trp | 1.03 ± 0.27 | 1.02 ± 0.09 | 1.14 ± 0.15 | |
| Human | MTM | 19.34 ± 1.57 | 18.28 ± 1.19 | 17.17 ± 0.70 |
| MTMSA-Trp | <1 | <1 | <1 | |
| Species | Gender | Compound | Dose | AUC0–inf (ng/mL·h) | Extrapolated AUC0–inf (%) | CL (mL/h/kg) | Terminal t1/2 (h) | Vd (mL/kg) |
|---|---|---|---|---|---|---|---|---|
| Mouse | Male | MTM | 2 mg/kg | 1905 | 6.74 | 1050 | 2.72 | 4125 |
| MTMSA-Trp | 2 mg/kg | 38,564 | 8.07 | 52 | 1.85 | 138 | ||
| Rat | Male | MTM | 0.5 mg/kg | 175 | 53.52 | 2855 | 12.16 | 50,111 |
| MTMSA-Trp | 0.5 mg/kg | 3486 | 1.43 | 143 | 1.56 | 324 | ||
| Monkey | Male | MTM | 6.94 µg/kg | 92 | 15.32 | 75 | 3.27 | 354 |
| MTMSA-Trp | 1.34 µg/kg | 139 | 5.77 | 10 | 0.37 | 5 | ||
| MTM | 13.18 µg/kg | 254 | 17.88 | 52 | 3.49 | 262 | ||
| MTMSA-Trp | 4.19 µg/kg | 181 | 4.99 | 23 | 0.78 | 26 |
| Species | Gender | Compound | Dose | AUC0–inf (ng/mL·h) | Extrapolated AUC0–inf (%) | CL (mL/h/kg) | Terminal t1/2 (h) | Vd (mL/kg) |
|---|---|---|---|---|---|---|---|---|
| Mouse | Male | MTM | 69 µg/kg | 89 | 1.3 | 777 | 0.7 | 821 |
| MTMSA-Trp | 69 µg/kg | 569 | 3.2 | 121 | 1.8 | 318 | ||
| Rat | Male | MTM | 28 µg/kg | 46 | 3.1 | 608 | 0.8 | 713 |
| MTMSA-Trp | 28 µg/kg | 223 | 8.4 | 126 | 2.4 | 428 |
| Dose | AUC0–inf | Extrapolated AUC0–inf | CL | t1/2 | Vd |
|---|---|---|---|---|---|
| ng/mL·h | % | mL/h/kg | h | mL/kg | |
| 0.3 mg/kg | 4373 | 0.4 | 69 | 0.5 | 45 |
| 1 mg/kg | 24,419 | 0.2 | 41 | 1.3 | 75 |
| 3 mg/kg | 91,778 | 0.2 | 33 | 2.6 | 123 |
| 5 mg/kg | 13,7176 | 6.5 | 36 | 1.5 | 80 |
| 10 mg/kg | 216,281 | 5.6 | 46 | 1.2 | 81 |
Disclaimer/Publisher’s Note: The statements, opinions and data contained in all publications are solely those of the individual author(s) and contributor(s) and not of MDPI and/or the editor(s). MDPI and/or the editor(s) disclaim responsibility for any injury to people or property resulting from any ideas, methods, instructions or products referred to in the content. |
© 2025 by the authors. Licensee MDPI, Basel, Switzerland. This article is an open access article distributed under the terms and conditions of the Creative Commons Attribution (CC BY) license (https://creativecommons.org/licenses/by/4.0/).
Share and Cite
Niloy, K.K.; Horn, J.; Bhuiyan, N.H.; Shaaban, K.A.; Bhosale, S.S.; Prisinzano, T.E.; Thorson, J.S.; Rohr, J.; Leggas, M. Preclinical Pharmacokinetic Evaluation of Mithramycin and Mithramycin SA Tryptophan-Conjugated Analog. Pharmaceutics 2025, 17, 765. https://doi.org/10.3390/pharmaceutics17060765
Niloy KK, Horn J, Bhuiyan NH, Shaaban KA, Bhosale SS, Prisinzano TE, Thorson JS, Rohr J, Leggas M. Preclinical Pharmacokinetic Evaluation of Mithramycin and Mithramycin SA Tryptophan-Conjugated Analog. Pharmaceutics. 2025; 17(6):765. https://doi.org/10.3390/pharmaceutics17060765
Chicago/Turabian StyleNiloy, Kumar Kulldeep, Jamie Horn, Nazmul H. Bhuiyan, Khaled A. Shaaban, Suhas S. Bhosale, Thomas E. Prisinzano, Jon S. Thorson, Jurgen Rohr, and Markos Leggas. 2025. "Preclinical Pharmacokinetic Evaluation of Mithramycin and Mithramycin SA Tryptophan-Conjugated Analog" Pharmaceutics 17, no. 6: 765. https://doi.org/10.3390/pharmaceutics17060765
APA StyleNiloy, K. K., Horn, J., Bhuiyan, N. H., Shaaban, K. A., Bhosale, S. S., Prisinzano, T. E., Thorson, J. S., Rohr, J., & Leggas, M. (2025). Preclinical Pharmacokinetic Evaluation of Mithramycin and Mithramycin SA Tryptophan-Conjugated Analog. Pharmaceutics, 17(6), 765. https://doi.org/10.3390/pharmaceutics17060765