Evaluation of Violacein Metabolic Stability and Metabolite Identification in Human, Mouse, and Rat Liver Microsomes


 , , ,
, , ,  ,
,  ,
,
Abstract
1. Introduction
2. Materials and Methods
2.1. Chemicals and Reagents
Preparation of Stock Solutions and Microsomes
2.2. Microsomal Incubation
2.2.1. Microsomal Cofactors
2.2.2. In Vitro Metabolic Stability of Violacein in HLMs, MLMs, and RLMs
2.2.3. Identification of Violacein Metabolites in HLMs and RLMs
2.3. Analysis of Violacein for Metabolic Stability by LC-MS/MS
2.4. Identification of Violacein and Its Metabolites by LC-QTOF
2.5. In Silico Prediction of the Physicochemical Properties and Metabolism of Violacein
2.6. Data Analysis
2.6.1. In Vitro Metabolic Stability of Violacein
2.6.2. Identification of Violacein and Its Metabolites
3. Results
3.1. In Silico Prediction of the Physicochemical Properties of Violacein by ADMET Predictor®
3.2. In Silico Prediction of In Vitro Metabolism of Violacein
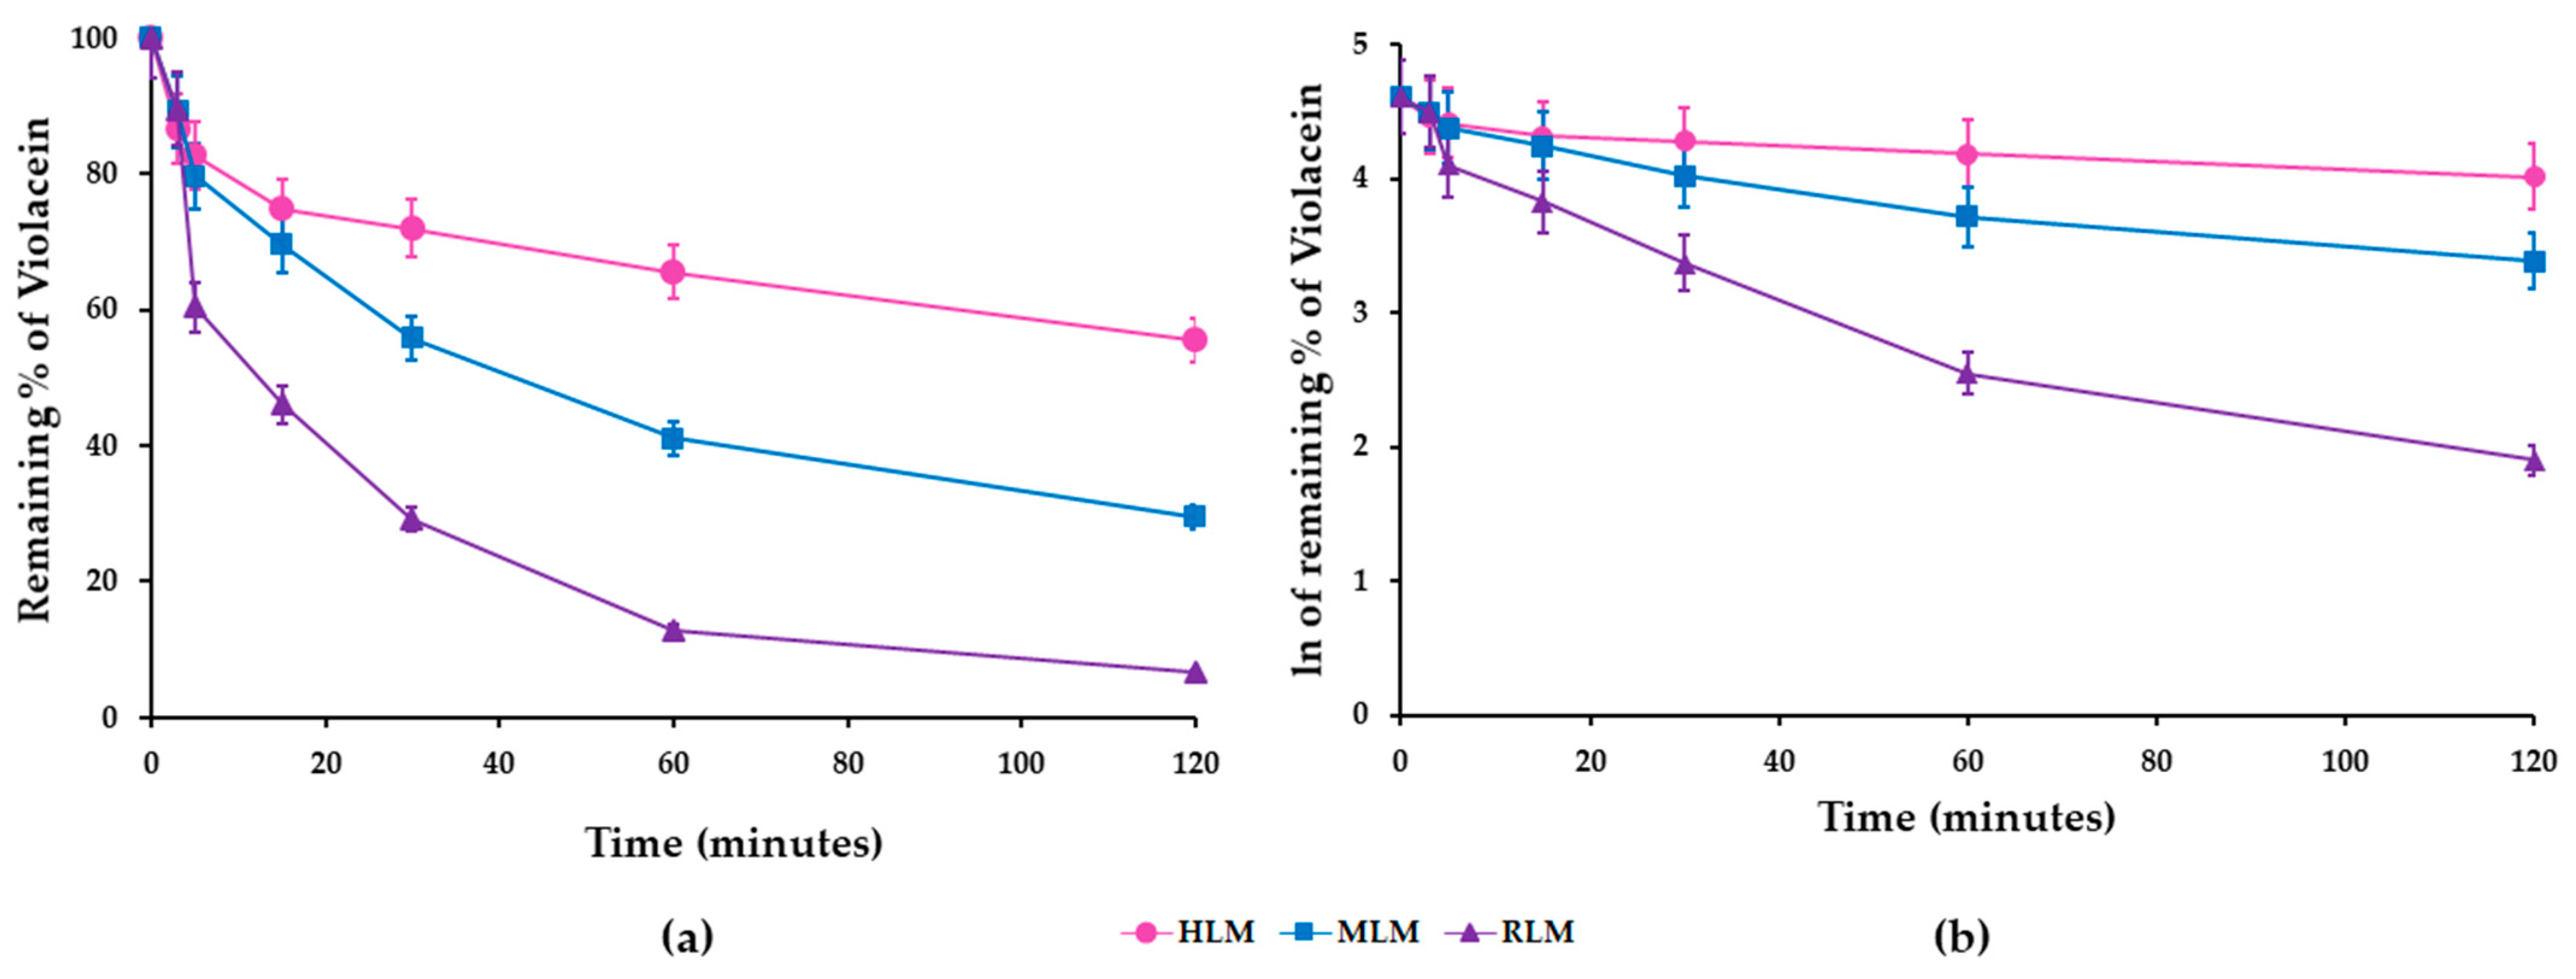
3.3. In Vitro Metabolic Stability of Violacein in HLMs, MLMs, and RLMs
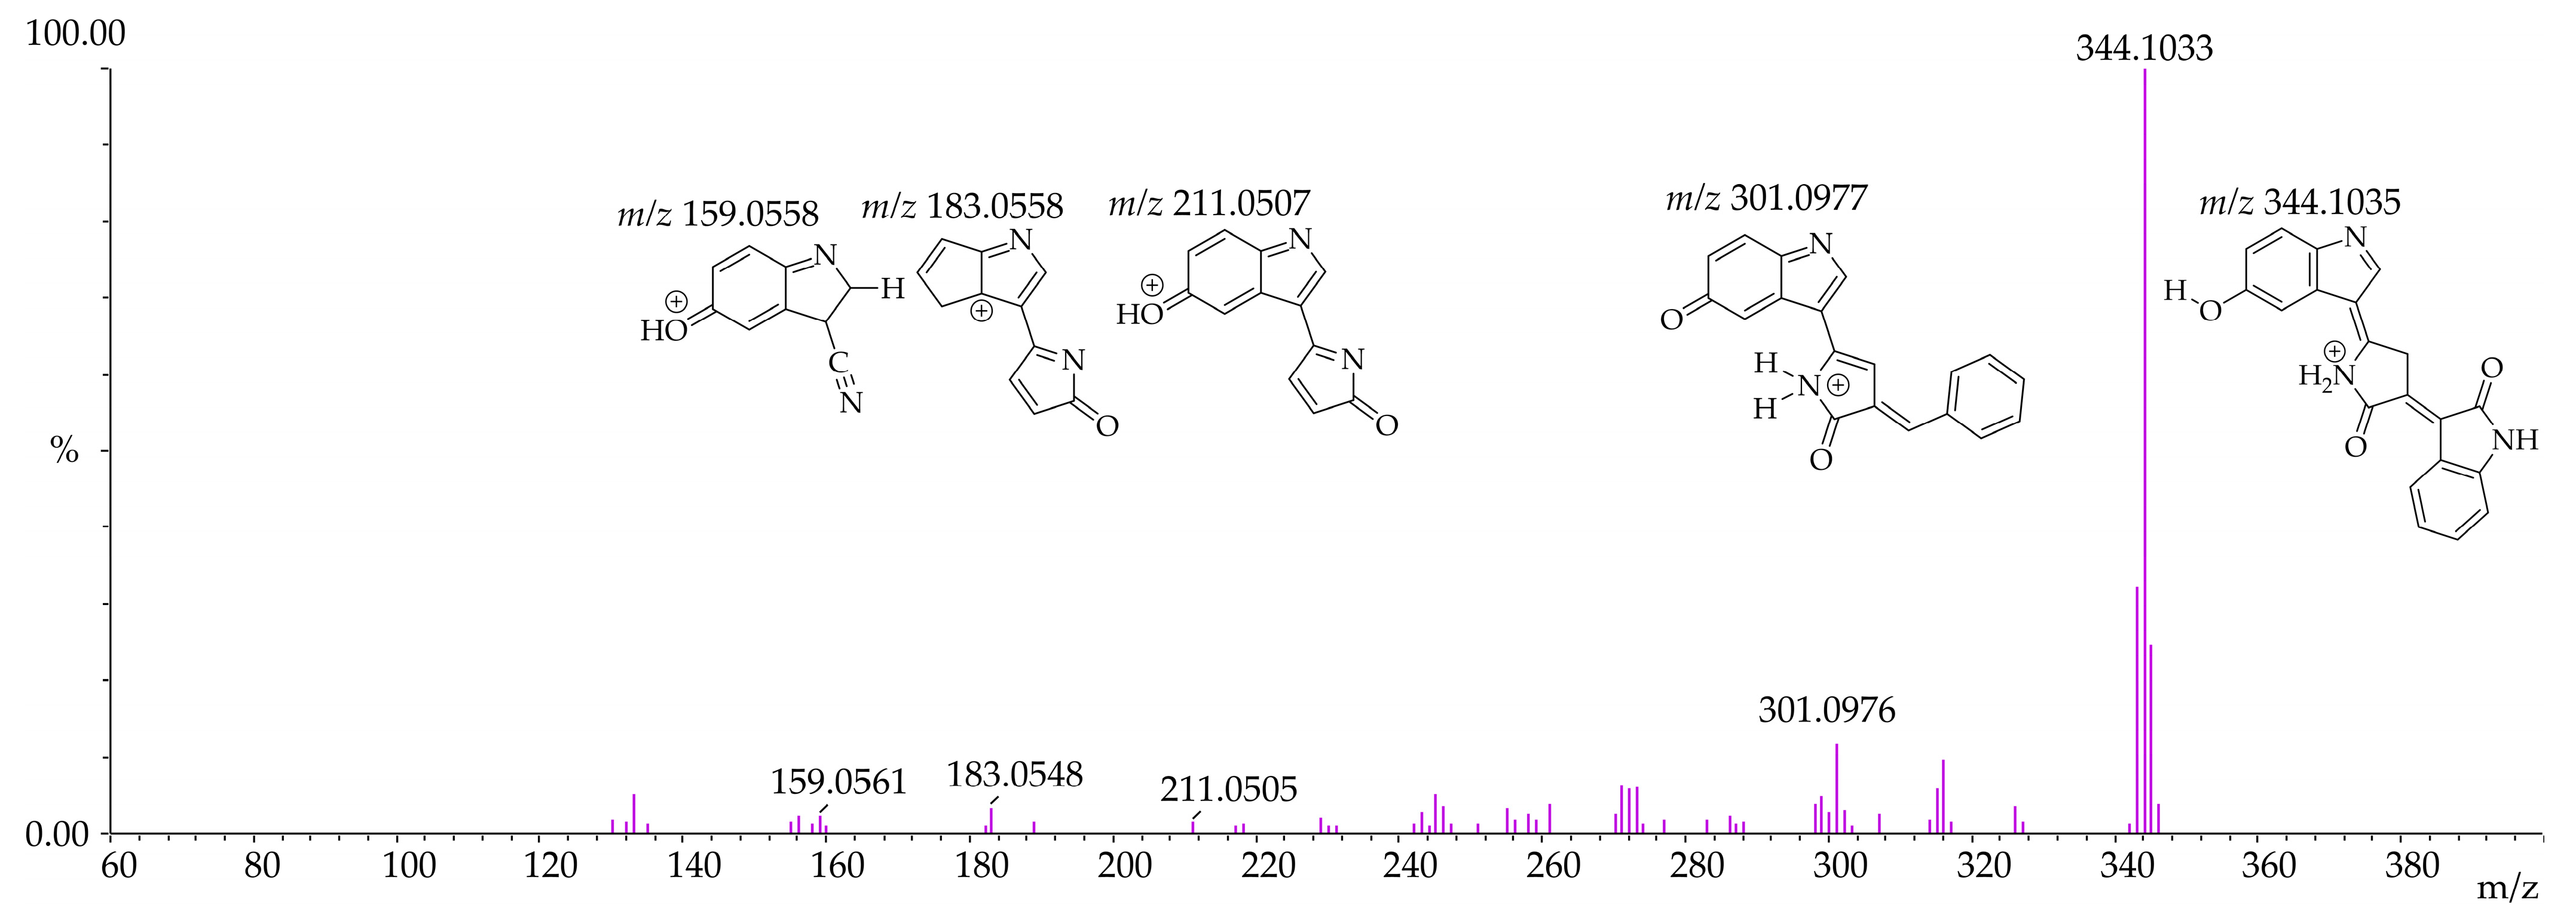
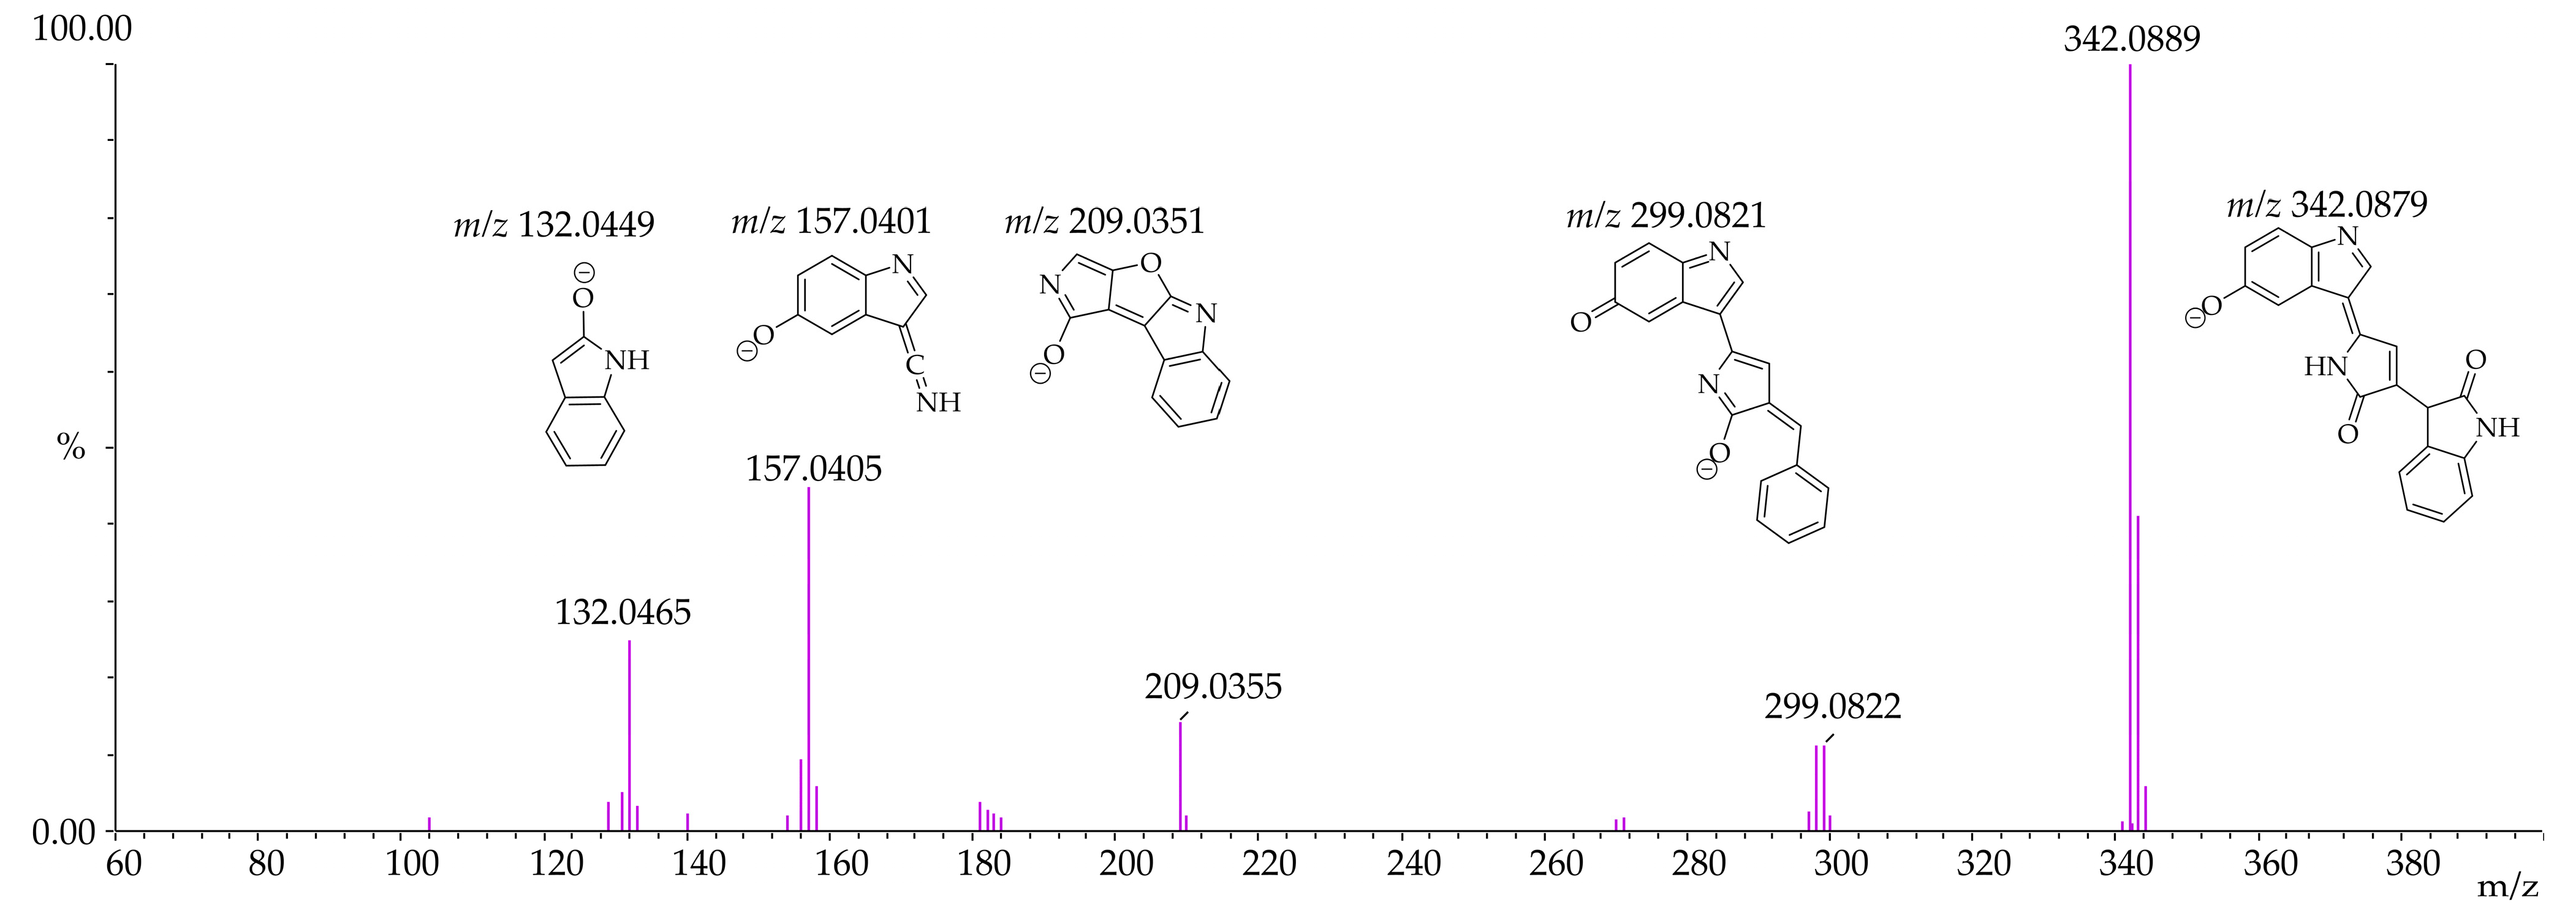
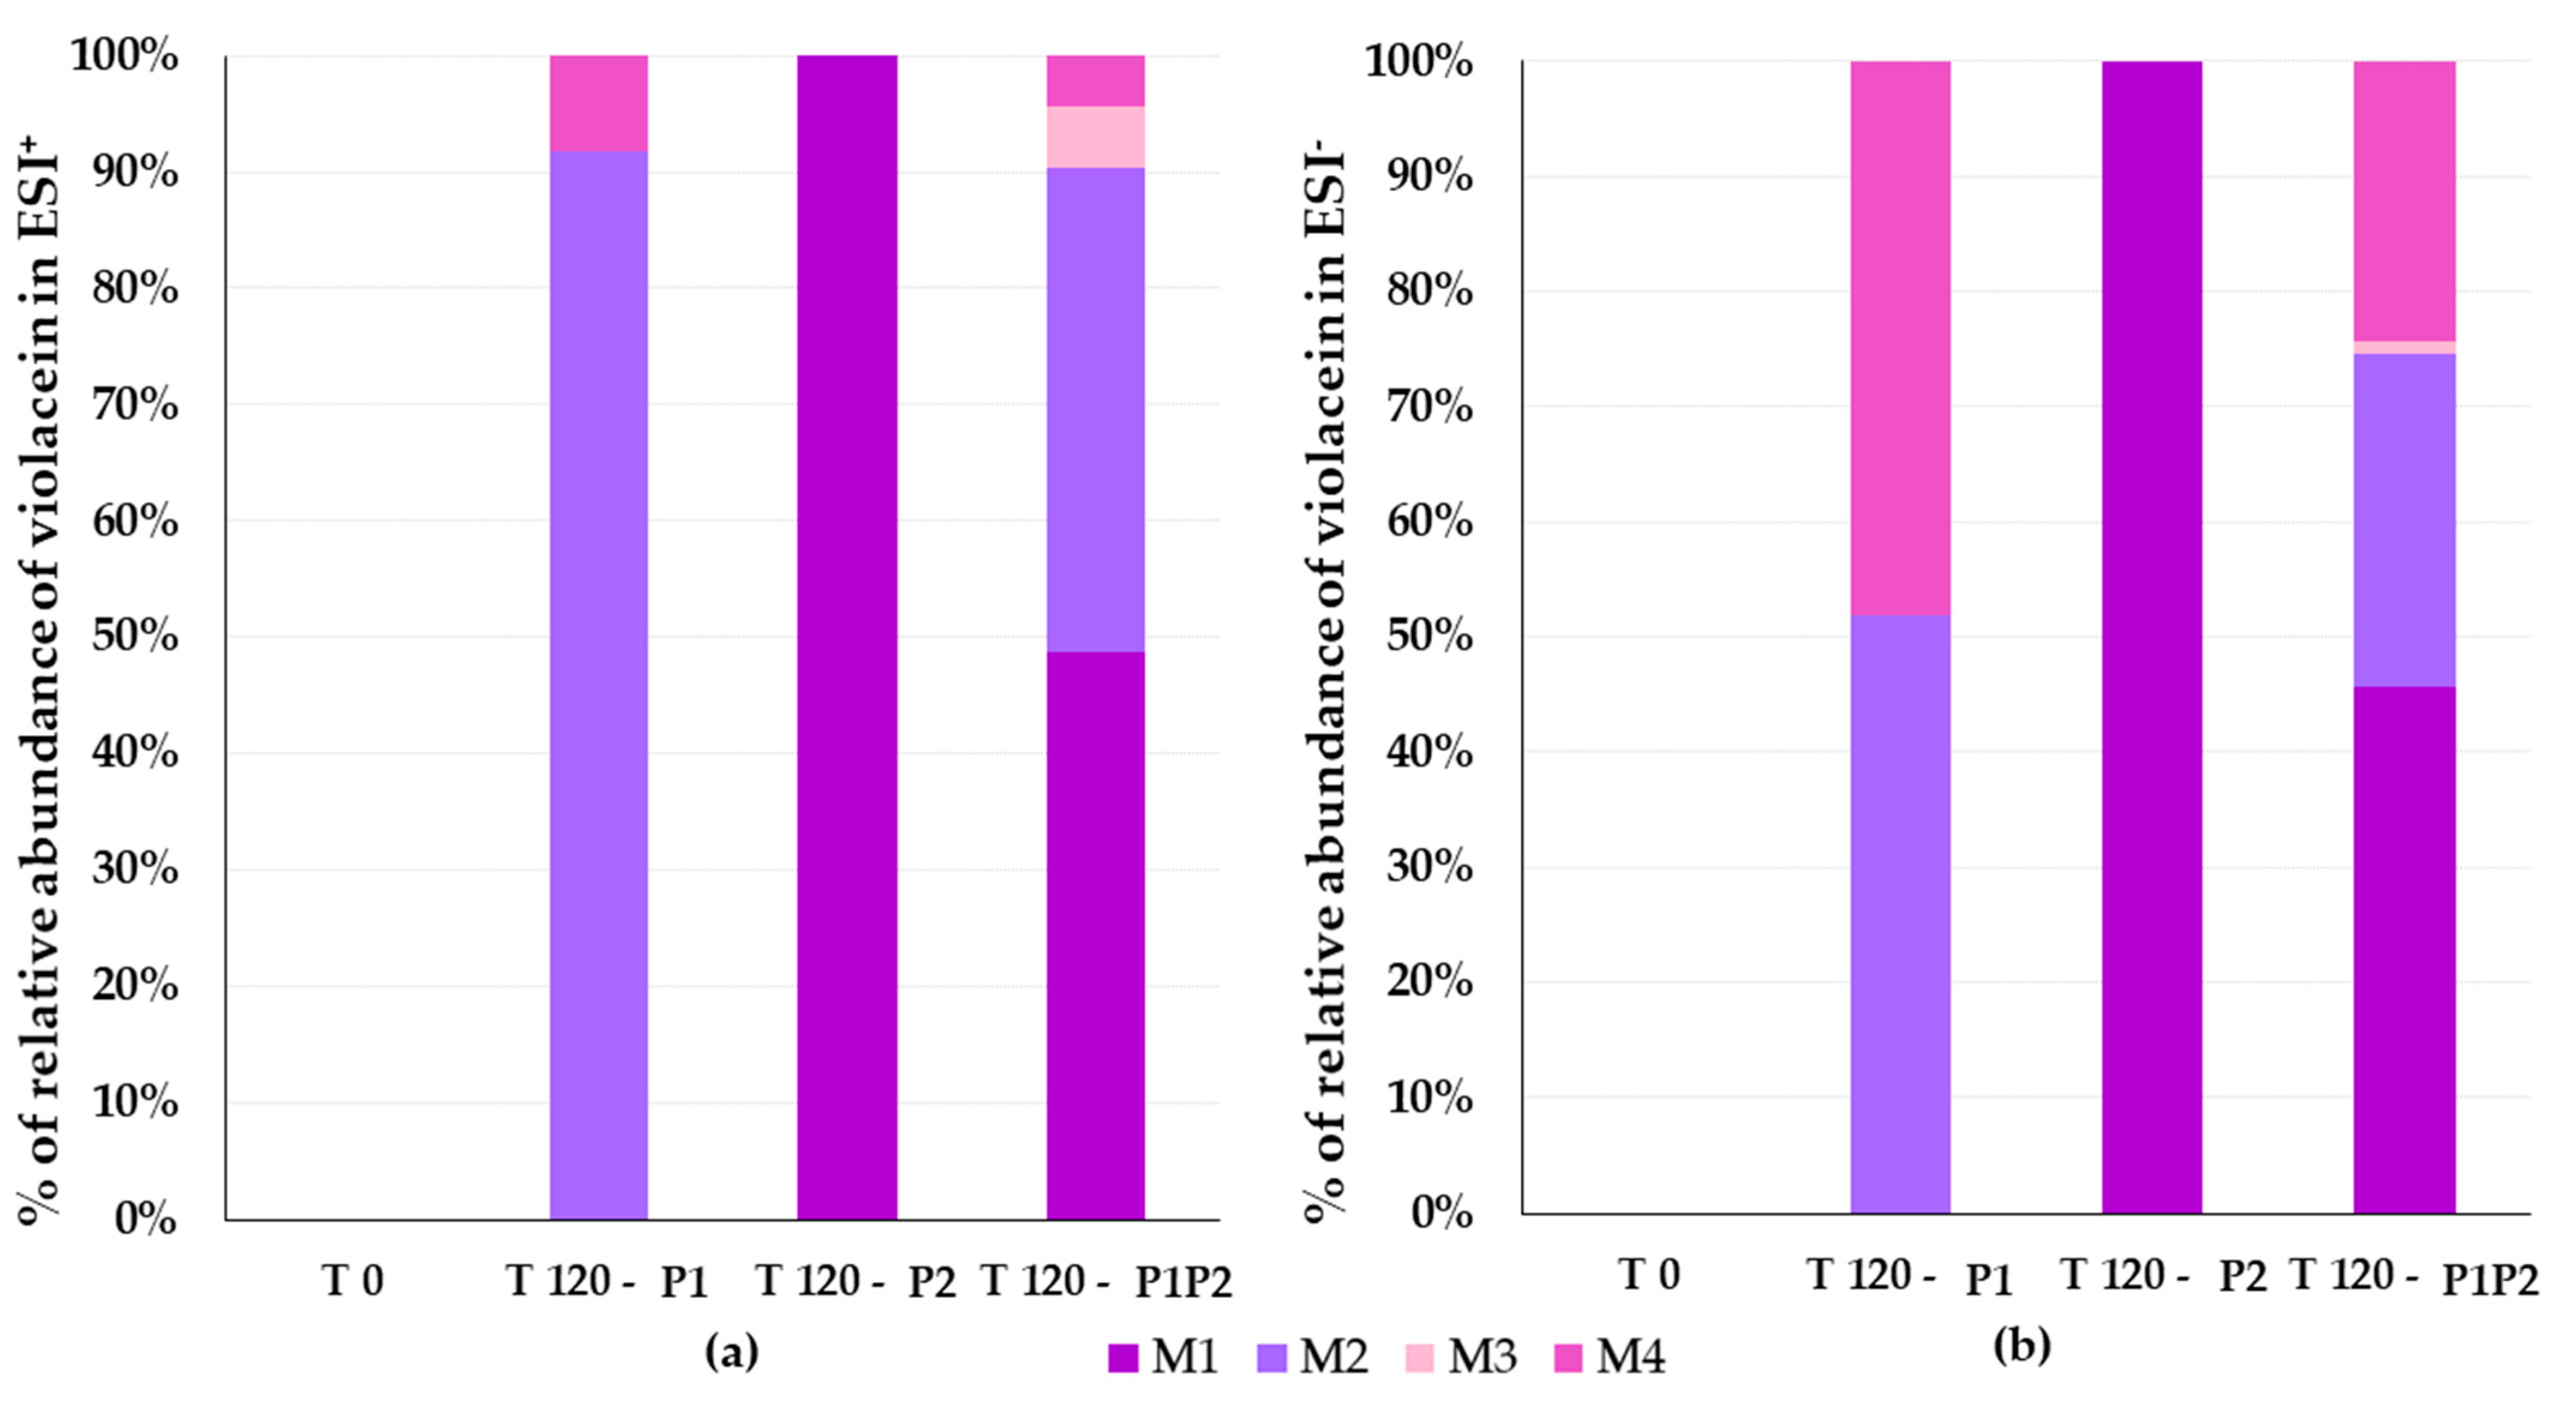
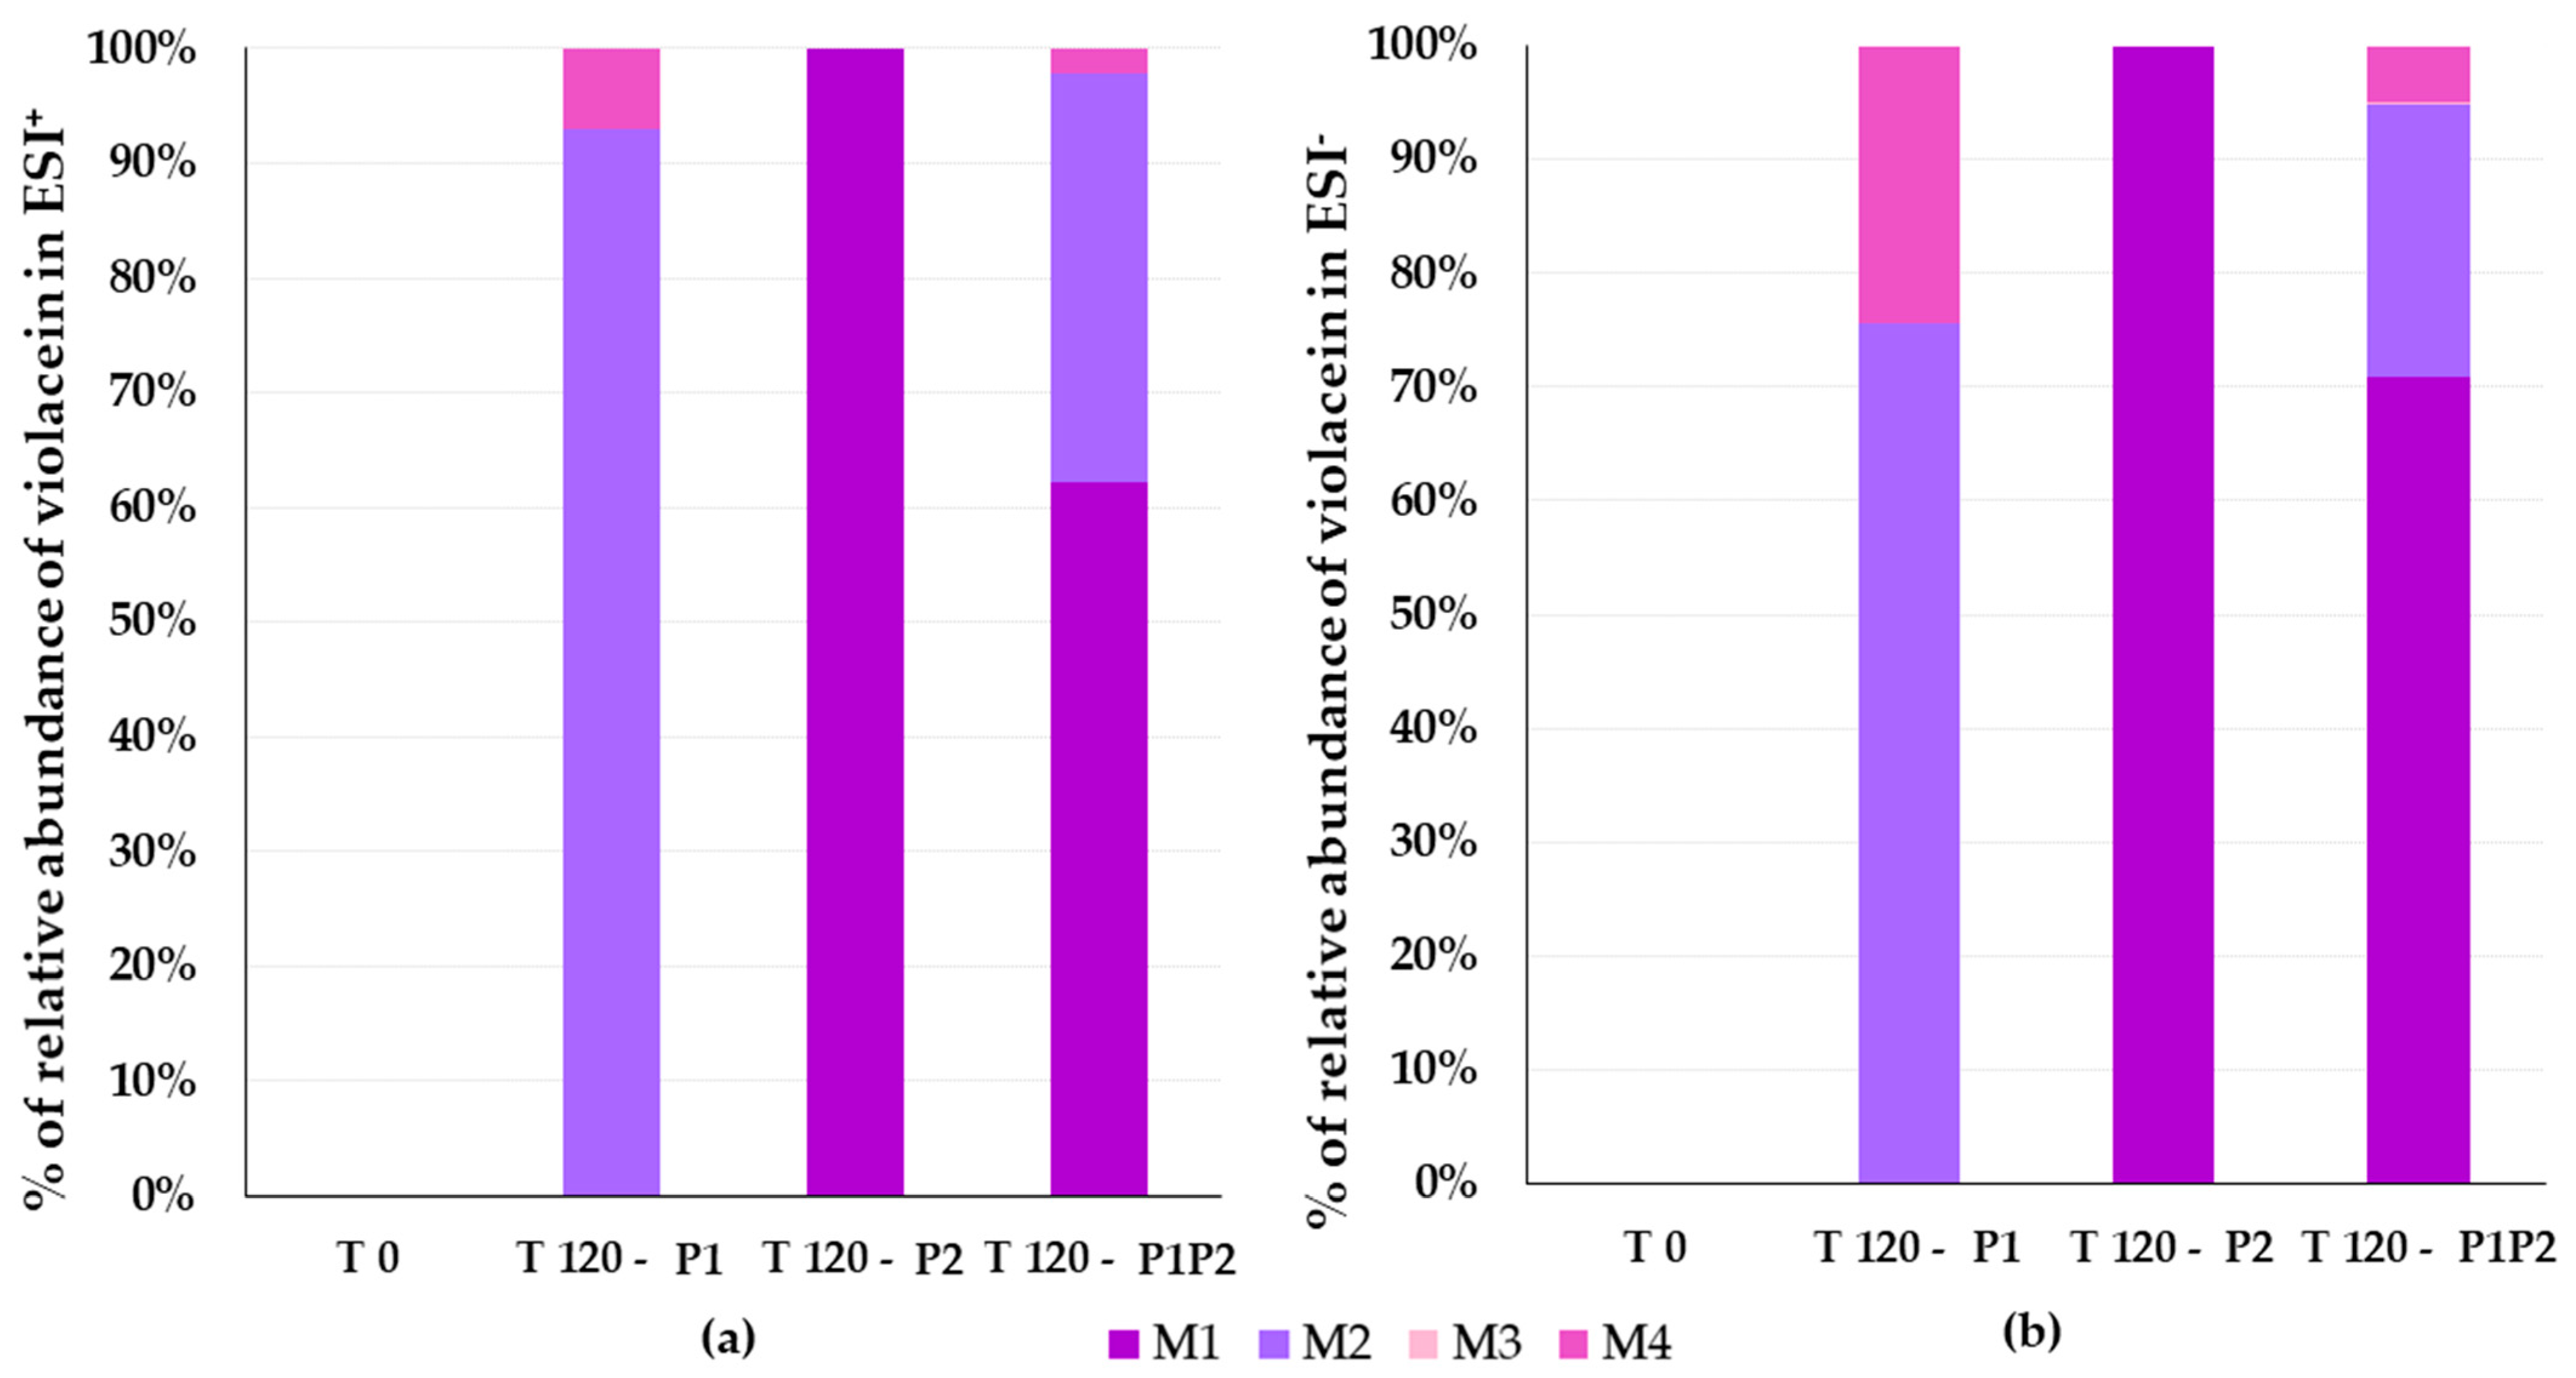
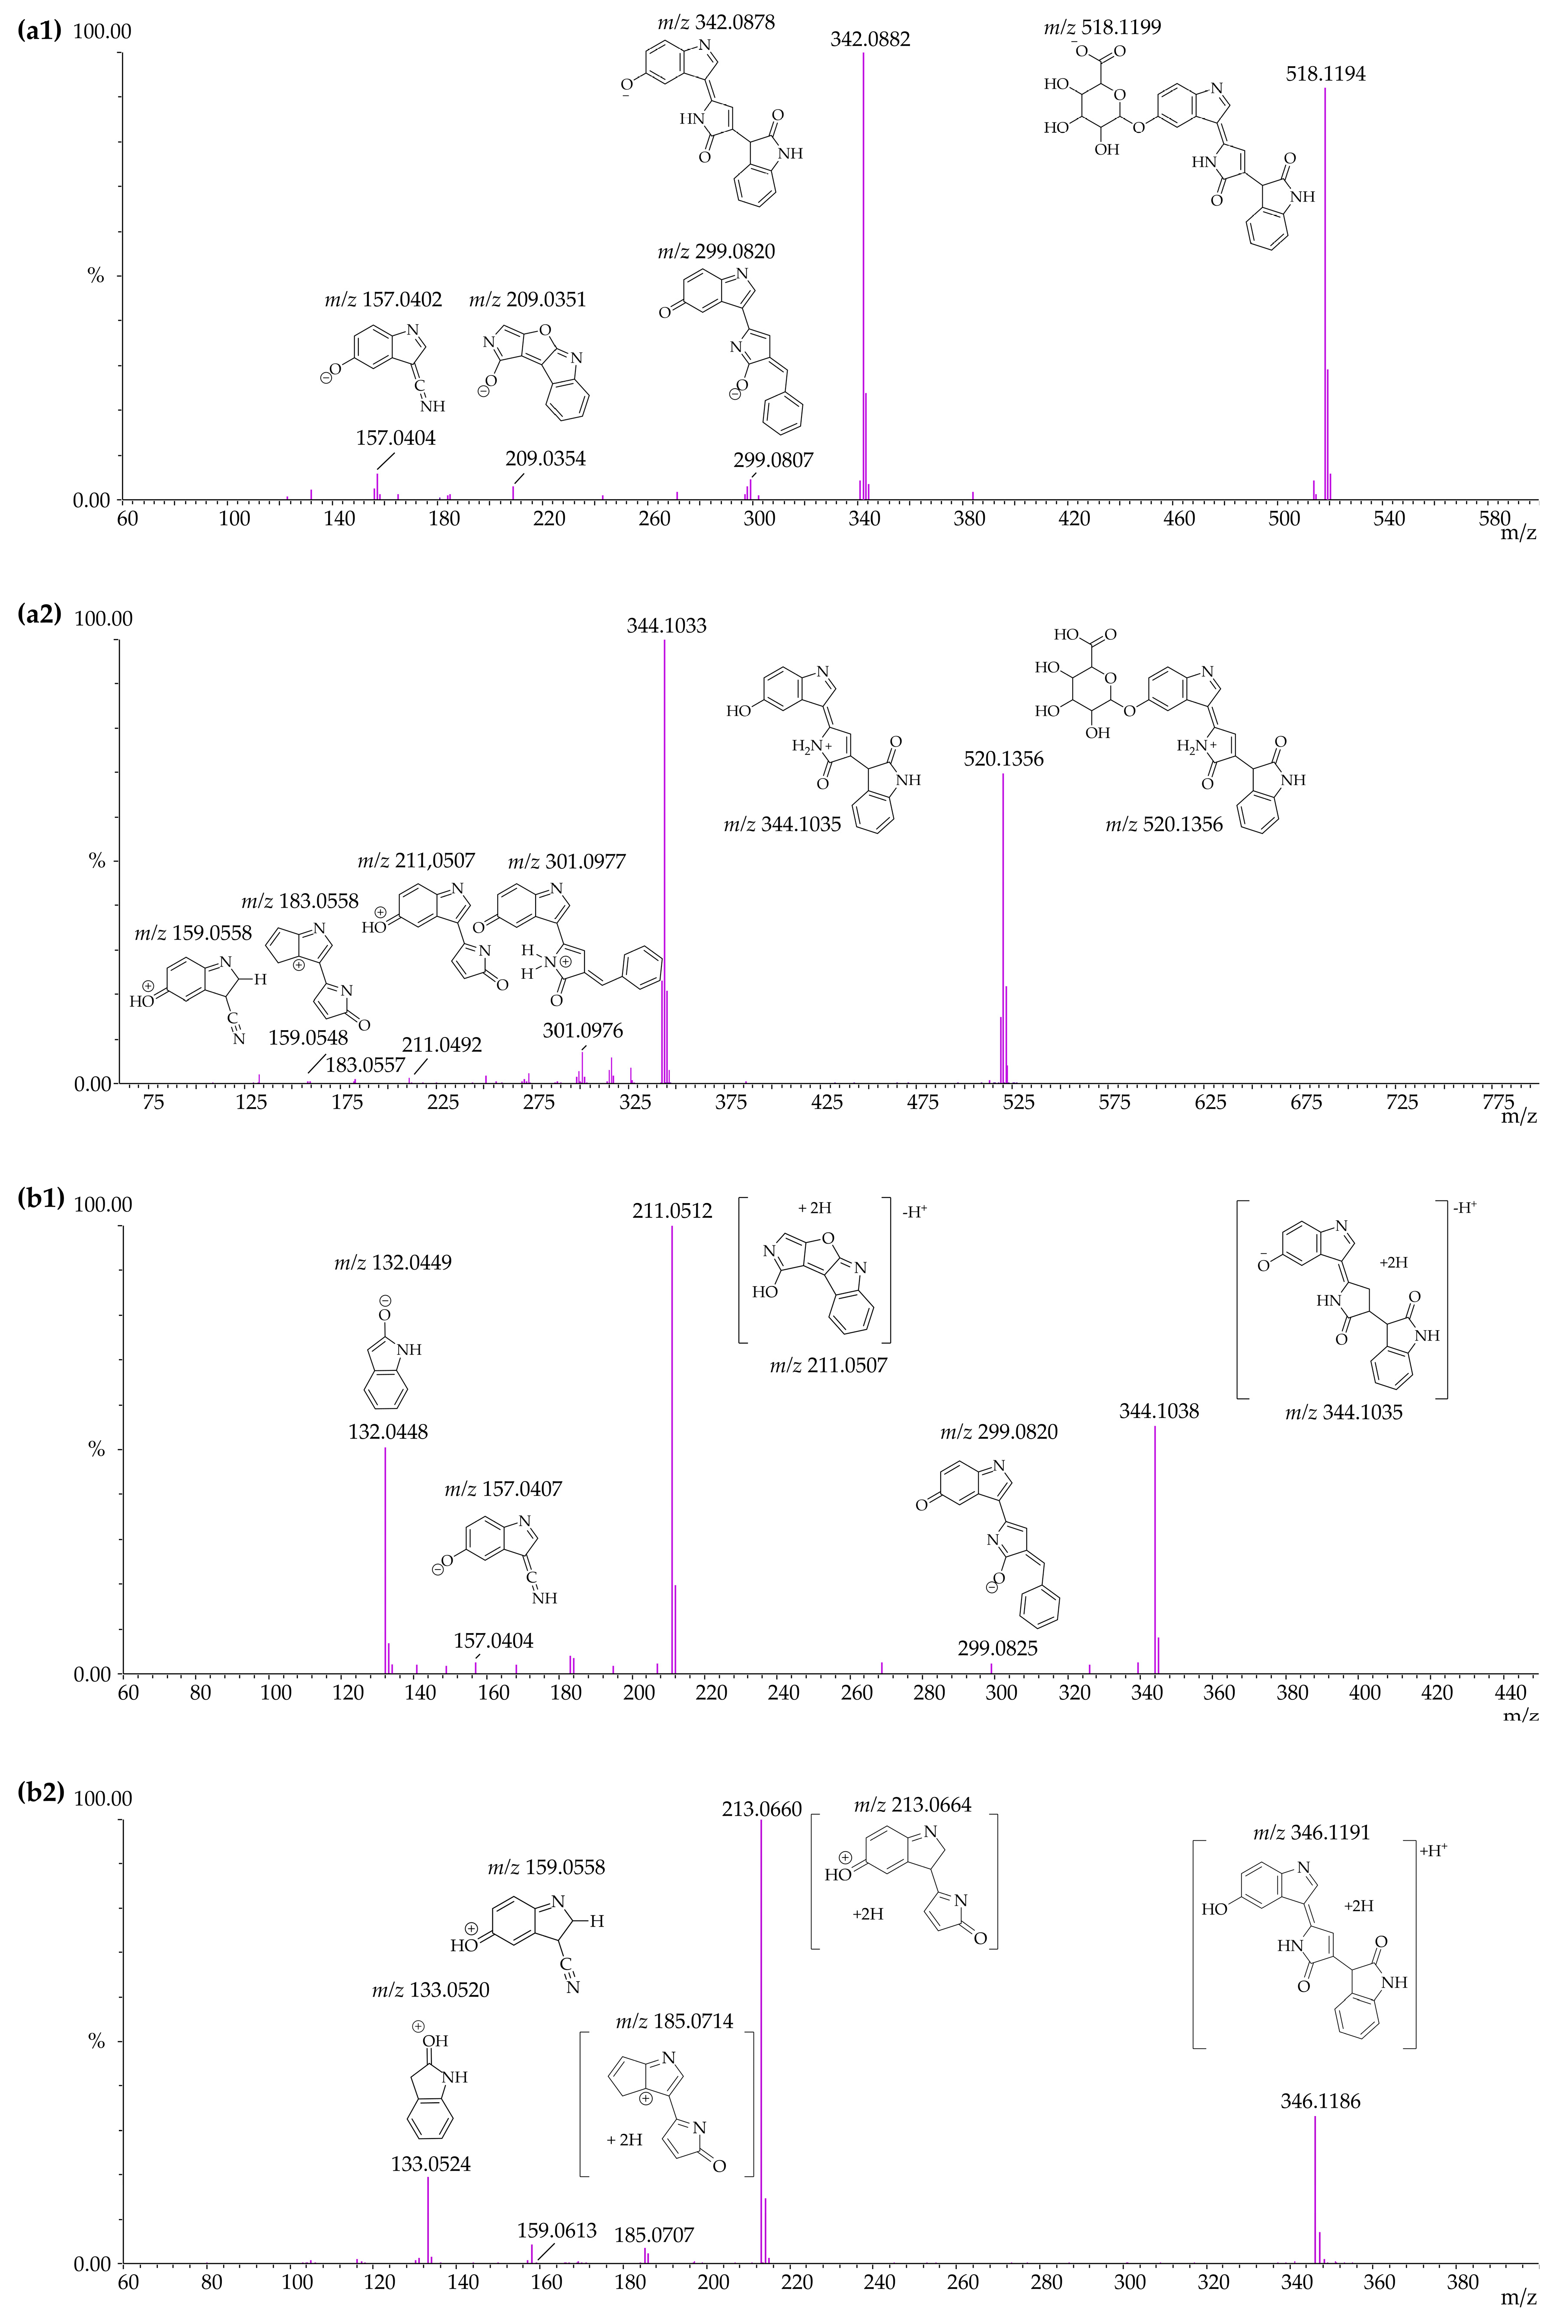
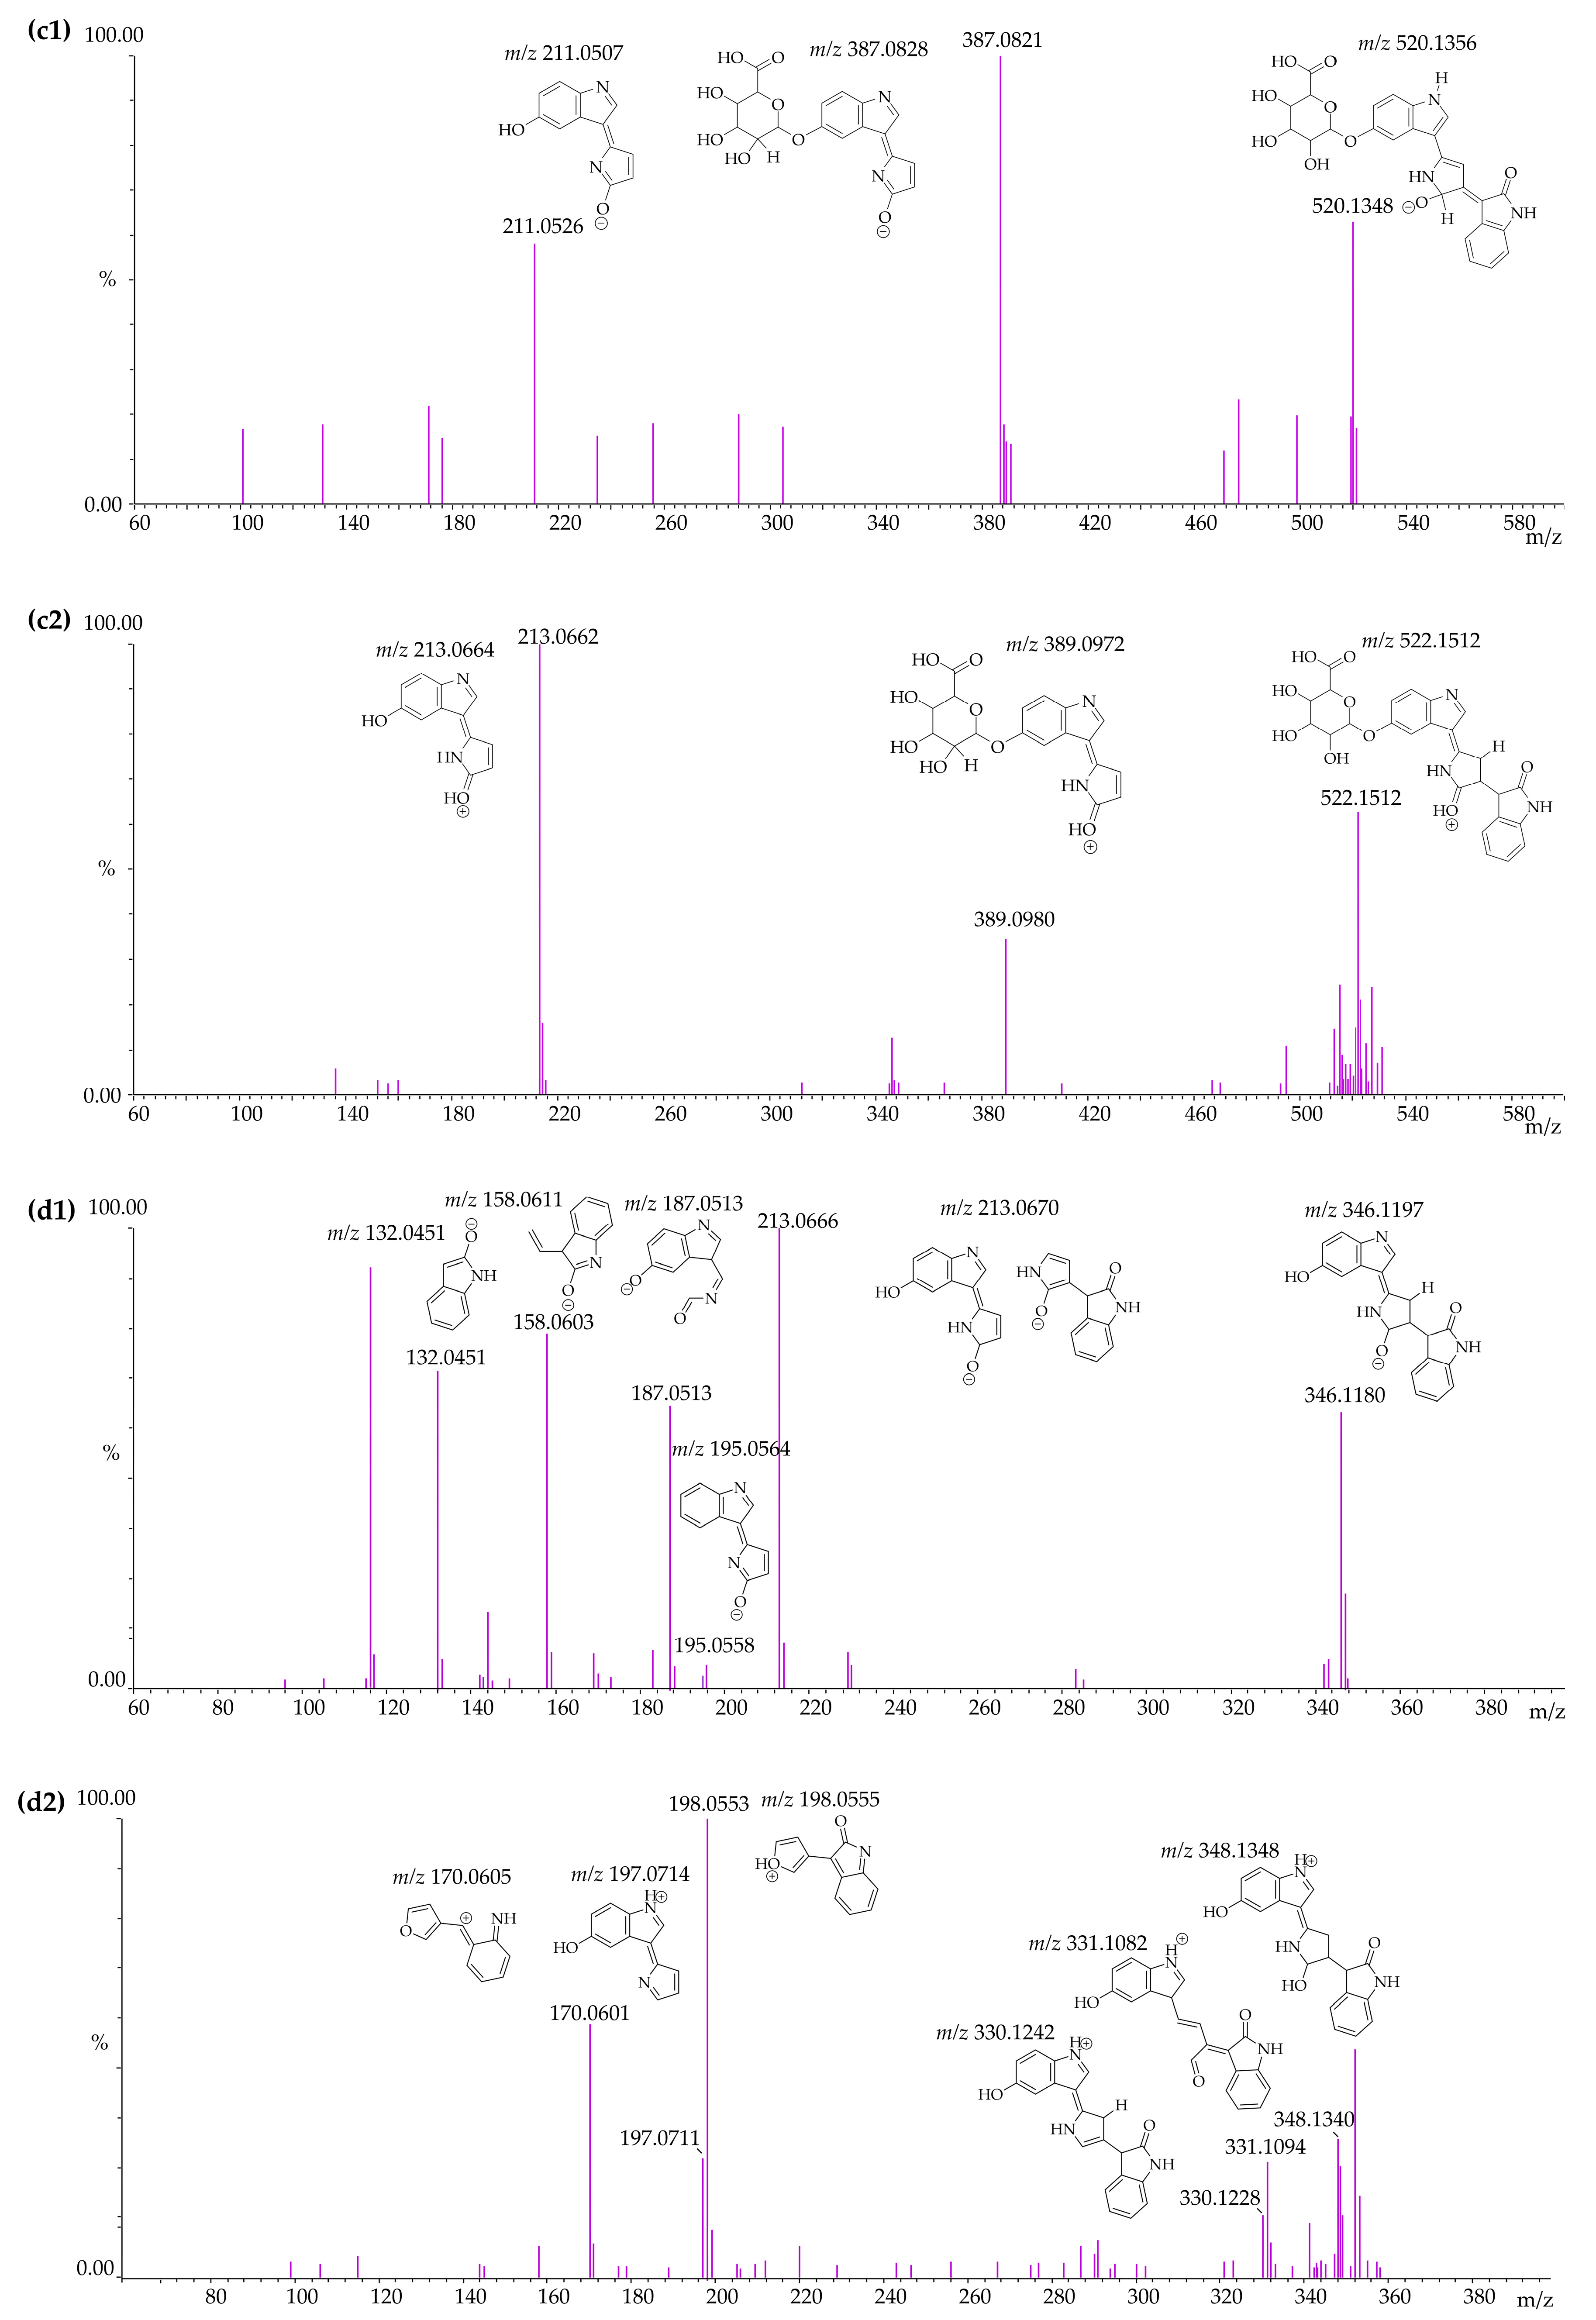
3.4. Identification of Violacein Metabolites in RLMs and HLMs by LC-QTOF
4. Discussion
5. Conclusions
Supplementary Materials
Author Contributions
Funding
Institutional Review Board Statement
Informed Consent Statement
Data Availability Statement
Acknowledgments
Conflicts of Interest
References
- Duffy, P.E.; Gorres, J.P.; Healy, S.A.; Fried, M. Malaria vaccines: A new era of prevention and control. Nat. Rev. Microbiol. 2024, 22, 756–772. [Google Scholar] [CrossRef] [PubMed]
- Poespoprodjo, J.R.; Douglas, N.M.; Ansong, D.; Kho, S.; Anstey, N.M. Malaria. Lancet 2023, 402, 2328–2345. [Google Scholar] [CrossRef]
- World Health Organization. World Malaria Report 2024: Addressing Inequity in the Global Malaria Response; World Health Organization: Geneva, Switzerland, 2024. [Google Scholar]
- Demsash, A.W.; Worku, Z.; Shibabaw, A.A.; Walle, A.D.; Lemu, J.C.; Jifar, W.W.; Bekana, T.; Gontie, G.B.; Tesfahun, E.; Kitil, G.W.; et al. Pooled prevalence of malaria and associated factors among vulnerable populations in Ethiopia: A systematic review and meta-analysis. BMC Infect. Dis. 2024, 24, 828. [Google Scholar] [CrossRef] [PubMed]
- Rosenthal, P.J.; Asua, V.; Conrad, M.D. Emergence, transmission dynamics and mechanisms of artemisinin partial resistance in malaria parasites in Africa. Nat. Rev. Microbiol. 2024, 22, 373–384. [Google Scholar] [CrossRef] [PubMed]
- Amambua-Ngwa, A.; Button-Simons, K.A.; Li, X.; Kumar, S.; Brenneman, K.V.; Ferrari, M.; Checkley, L.A.; Haile, M.T.; Shoue, D.A.; McDew-White, M.; et al. Chloroquine resistance evolution in Plasmodium falciparum is mediated by the putative amino acid transporter AAT1. Nat. Microbiol. 2023, 8, 1213–1226. [Google Scholar] [CrossRef]
- Pandey, S.K.; Anand, U.; Siddiqui, W.A.; Tripathi, R. Drug development strategies form: With the hope for new antimalarial drug discovery-an update. Adv. Med. 2023, 2023, 5060665. [Google Scholar] [CrossRef]
- Yang, T.; Ottilie, S.; Istvan, E.S.; Godinez-Macias, K.P.; Lukens, A.K.; Baragana, B.; Campo, B.; Walpole, C.; Niles, J.C.; Chibale, K.; et al. MalDA, accelerating malaria drug discovery. Trends Parasitol. 2021, 37, 493–507. [Google Scholar] [CrossRef]
- Rivero Berti, I.; Gantner, M.E.; Rodriguez, S.; Islan, G.A.; Fávaro, W.J.; Talevi, A.; Castro, G.R.; Durán, N. Potential biocide roles of violacein. Front. Nanotechnol. 2023, 5, 1186386. [Google Scholar] [CrossRef]
- Cauz, A.C.G.; Carretero, G.P.B.; Saraiva, G.K.V.; Park, P.; Mortara, L.; Cuccovia, I.M.; Brocchi, M.; Gueiros-Filho, F.J. Violacein targets the cytoplasmic membrane of bacteria. ACS Infect. Dis. 2019, 5, 539–549. [Google Scholar] [CrossRef]
- Verinaud, L.; Lopes, S.C.; Prado, I.C.; Zanucoli, F.; Alves da Costa, T.; Di Gangi, R.; Issayama, L.K.; Carvalho, A.C.; Bonfanti, A.P.; Niederauer, G.F.; et al. Violacein treatment modulates acute and chronic inflammation through the suppression of cytokine production and induction of regulatory T cells. PLoS ONE 2015, 10, e0125409. [Google Scholar] [CrossRef]
- Duran, N.; Castro, G.R.; Portela, R.W.D.; Favaro, W.J.; Duran, M.; Tasic, L.; Nakazato, G. Violacein and its antifungal activity: Comments and potentialities. Lett. Appl. Microbiol. 2022, 75, 796–803. [Google Scholar] [CrossRef] [PubMed]
- Kanade, Y.; Mohan, W.; Patwardhan, R. Violacein: A Promising Bacterial Secondary Metabolite. Res. J. Chem. Environ. 2022, 26, 165–177. [Google Scholar] [CrossRef]
- Bilsland, E.; Tavella, T.A.; Krogh, R.; Stokes, J.E.; Roberts, A.; Ajioka, J.; Spring, D.R.; Andricopulo, A.D.; Costa, F.T.M.; Oliver, S.G. Antiplasmodial and trypanocidal activity of violacein and deoxyviolacein produced from synthetic operons. BMC Biotechnol. 2018, 18, 22. [Google Scholar] [CrossRef]
- Tavella, T.A.; da Silva, N.S.M.; Spillman, N.; Kayano, A.; Cassiano, G.C.; Vasconcelos, A.A.; Camargo, A.P.; da Silva, D.C.B.; Fontinha, D.; Salazar Alvarez, L.C.; et al. Violacein-induced chaperone system collapse underlies multistage antiplasmodial activity. ACS Infect. Dis. 2021, 7, 759–776. [Google Scholar] [CrossRef]
- Choi, S.Y.; Lim, S.; Yoon, K.H.; Lee, J.I.; Mitchell, R.J. Biotechnological activities and applications of bacterial pigments violacein and prodigiosin. J. Biol. Eng. 2021, 15, 10. [Google Scholar] [CrossRef] [PubMed]
- Sasidharan, A.; Sasidharan, N.K.; Amma, D.B.; Vasu, R.K.; Nataraja, A.V.; Bhaskaran, K. Antifungal activity of violacein purified from a novel strain of Chromobacterium sp. NIIST (MTCC 5522). J. Microbiol. 2015, 53, 694–701. [Google Scholar] [CrossRef] [PubMed]
- Sindhu, R.; Bhat, S.S.; Sangta, J.; Dharmashekar, C.; Shreevatsa, B.; Shivamallu, C.; Devegowda, D.; Kollur, S.P.; Ahmad, S.F.; Attia, S.M.; et al. Gaining molecular insights towards inhibition of foodborne fungi Aspergillus fumigatus by a food colourant violacein via computational approach. Sci. Rep. 2024, 14, 29905. [Google Scholar] [CrossRef]
- de Carvalho, D.D.; Costa, F.T.; Duran, N.; Haun, M. Cytotoxic activity of violacein in human colon cancer cells. Toxicol. In Vitro 2006, 20, 1514–1521. [Google Scholar] [CrossRef]
- Olivera-Bravo, S.; Bolatto, C.; Damianovich, G.O.; Stancov, M.; Cerri, S.; Rodriguez, P.; Boragno, D.; Hernandez Mir, K.; Cuitino, M.N.; Larrambembere, F.; et al. Neuroprotective effects of violacein in a model of inherited amyotrophic lateral sclerosis. Sci. Rep. 2022, 12, 4439. [Google Scholar] [CrossRef]
- Lopes, S.C.; Blanco, Y.C.; Justo, G.Z.; Nogueira, P.A.; Rodrigues, F.L.; Goelnitz, U.; Wunderlich, G.; Facchini, G.; Brocchi, M.; Duran, N.; et al. Violacein extracted from Chromobacterium violaceum inhibits Plasmodium growth in vitro and in vivo. Antimicrob. Agents Chemother. 2009, 53, 2149–2152. [Google Scholar] [CrossRef]
- Siqueira-Neto, J.L.; Wicht, K.J.; Chibale, K.; Burrows, J.N.; Fidock, D.A.; Winzeler, E.A. Antimalarial drug discovery: Progress and approaches. Nat. Rev. Drug Discov. 2023, 22, 807–826. [Google Scholar] [CrossRef]
- Sakura, T.; Ishii, R.; Yoshida, E.; Kita, K.; Kato, T.; Inaoka, D.K. Accelerating antimalarial drug discovery with a new high-throughput screen for fast-killing compounds. ACS Infect. Dis. 2024, 10, 4115–4126. [Google Scholar] [CrossRef] [PubMed]
- Wishart, D.S. Improving early drug discovery through ADME modelling: An overview. Drugs R D 2007, 8, 349–362. [Google Scholar] [CrossRef]
- Singh, N.; Vayer, P.; Tanwar, S.; Poyet, J.-L.; Tsaioun, K.; Villoutreix, B.O. Drug discovery and development: Introduction to the general public and patient groups. Front. Drug Discov. 2023, 3, 1201419. [Google Scholar] [CrossRef]
- Baranczewski, P.; Stanczak, A.; Sundberg, K.; Svensson, R.; Wallin, A.; Jansson, J.; Garberg, P.; Postlind, H. Introduction to in vitro estimation of metabolic stability and drug interactions of new chemical entities in drug discovery and development. Pharmacol. Rep. 2006, 58, 453–472. [Google Scholar]
- Masimirembwa, C.M.; Bredberg, U.; Andersson, T.B. Metabolic stability for drug discovery and development: Pharmacokinetic and biochemical challenges. Clin. Pharmacokinet. 2003, 42, 515–528. [Google Scholar] [CrossRef] [PubMed]
- Nagar, S.; Argikar, A.U.; Tweedie, D. Enzyme Kinetics in Drug Metabolism: Fundamentals and Applications, 2nd ed.; Methods in Molecular Biology; Springer Science + Business Media: New York, NY, USA, 2021; Volume 2342. [Google Scholar] [CrossRef]
- Davies, B.; Morris, T. Physiological parameters in laboratory animals and humans. Pharm. Res. 1993, 10, 1093–1095. [Google Scholar] [CrossRef] [PubMed]
- Hakooz, N.; Ito, K.; Rawden, H.; Gill, H.; Lemmers, L.; Boobis, A.R.; Edwards, R.J.; Carlile, D.J.; Lake, B.G.; Houston, J.B. Determination of a human hepatic microsomal scaling factor for predicting in vivo drug clearance. Pharm. Res. 2006, 23, 533–539. [Google Scholar] [CrossRef]
- Houston, J.B. Utility of in vitro drug metabolism data in predicting in vivo metabolic clearance. Biochem. Pharmacol. 1994, 47, 1469–1479. [Google Scholar] [CrossRef]
- Riley, R.J.; McGinnity, D.F.; Austin, R.P. A unified model for predicting human hepatic, metabolic clearance from in vitro intrinsic clearance data in hepatocytes and microsomes. Drug Metab. Dispos. 2005, 33, 1304–1311. [Google Scholar] [CrossRef]
- Smith, R.; Jones, R.D.; Ballard, P.G.; Griffiths, H.H. Determination of microsome and hepatocyte scaling factors for in vitro/in vivo extrapolation in the rat and dog. Xenobiotica 2008, 38, 1386–1398. [Google Scholar] [CrossRef] [PubMed]
- Dominguez-Oliva, A.; Hernandez-Avalos, I.; Martinez-Burnes, J.; Olmos-Hernandez, A.; Verduzco-Mendoza, A.; Mota-Rojas, D. The Importance of animal models in biomedical research: Current insights and applications. Animals 2023, 13, 1223. [Google Scholar] [CrossRef]
- Pognan, F.; Beilmann, M.; Boonen, H.C.M.; Czich, A.; Dear, G.; Hewitt, P.; Mow, T.; Oinonen, T.; Roth, A.; Steger-Hartmann, T.; et al. The evolving role of investigative toxicology in the pharmaceutical industry. Nat. Rev. Drug Discov. 2023, 22, 317–335. [Google Scholar] [CrossRef] [PubMed]
- Ghosal, A.; Ramanathan, R.; Kishnani, N.S.; Chowdhury, S.K.; Alton, K.B. Cytochrome p450 (CYP) and UDP-glucuronosyltransferase (UGT) enzymes: Role in drug metabolism, polymorphism, and identification of their involvement in drug metabolism. In Identification and Quantification of Drugs, Metabolites and Metabolizing Enzymes by LC-MS; Pearson, P.G., Wienkers, L.C., Eds.; Progress in Pharmaceutical and Biomedical Analysis; CRC Press: Boca Raton, FL, USA, 2005; pp. 295–336. [Google Scholar]
- Mohsin, N.A.; Farrukh, M.; Shahzadi, S.; Irfan, M. Drug Metabolism: Phase I and Phase II Metabolic Pathways. In Drug Metabolism and Pharmacokinetics; Rudrapal, M., Ed.; IntechOpen: London, UK, 2024. [Google Scholar] [CrossRef]
- Rowland, A.; Miners, J.O.; Mackenzie, P.I. The UDP-glucuronosyltransferases: Their role in drug metabolism and detoxification. Int. J. Biochem. Cell Biol. 2013, 45, 1121–1132. [Google Scholar] [CrossRef]
- Jia, L.; Xiaodong, L. The conduct of drug metabolism studies considered good practice (II): In vitro experiments. Curr. Drug Metab. 2007, 8, 822–829. [Google Scholar] [CrossRef] [PubMed]
- Alseekh, S.; Aharoni, A.; Brotman, Y.; Contrepois, K.; D’Auria, J.; Ewald, J.; Ewald, J.C.; Fraser, P.D.; Giavalisco, P.; Hall, R.D.; et al. Mass spectrometry-based metabolomics: A guide for annotation, quantification and best reporting practices. Nat. Methods 2021, 18, 747–756. [Google Scholar] [CrossRef]
- Attwa, M.W.; Abdelhameed, A.S.; Alsaif, N.A.; Kadi, A.A.; AlRabiah, H. A validated LC-MS/MS analytical method for the quantification of pemigatinib: Metabolic stability evaluation in human liver microsomes. RSC Adv. 2022, 12, 20387–20394. [Google Scholar] [CrossRef]
- Attwa, M.W.; AlRabiah, H.; Mostafa, G.A.E.; Kadi, A.A. Development of an LC-MS/MS method for quantification of sapitinib in human liver microsomes: In silico and in vitro metabolic stability evaluation. Molecules 2023, 28, 2322. [Google Scholar] [CrossRef]
- Godoi, A.B.; Antunes, N.J.; Cunha, K.F.; Martins, A.F.; Huestis, M.A.; Costa, J.L. Metabolic stability and metabolite identification of N-ethyl pentedrone using rat, mouse and human liver microsomes. Pharmaceutics 2024, 16, 257. [Google Scholar] [CrossRef]
- Godoi, A.B.; Antunes, N.J.; Rodrigues, L.C.; Martins, A.F.; Costa, J.L. In vitro metabolism and metabolite identification of eutylone using rat liver microsomes. J. Pharm. Biomed. Anal. 2025, 260, 116827. [Google Scholar] [CrossRef]
- Lou, Y.; Zou, X.; Pan, Z.; Huang, Z.; Zheng, S.; Zheng, X.; Yang, X.; Bao, M.; Zhang, Y.; Gu, J.; et al. The mechanism of action of Botrychium (Thunb.) Sw. for prevention of idiopathic pulmonary fibrosis based on 1H-NMR-based metabolomics. J. Pharm. Pharmacol. 2024, 76, 1018–1027. [Google Scholar] [CrossRef]
- Komura, H.; Watanabe, R.; Mizuguchi, K. The trends and future prospective of in silico models from the viewpoint of ADME evaluation in drug discovery. Pharmaceutics 2023, 15, 2619. [Google Scholar] [CrossRef]
- Ekins, S. Systems-ADME/Tox: Resources and network approaches. J. Pharmacol. Toxicol. Methods 2006, 53, 38–66. [Google Scholar] [CrossRef] [PubMed]
- Shin, H.K.; Kang, Y.-M.; No, K.T. Predicting ADME properties of chemicals. In Handbook of Computational Chemistry, 2nd ed.; Leszczynski, J., Kaczmarek-Kedziera, A., Puzyn, T., Papadopoulos, M.G., Reis, H., Shukla, M.K., Eds.; Springer: Cham, Switzerland, 2017; pp. 2265–2301. [Google Scholar]
- Yamashita, F.; Hashida, M. In silico approaches for predicting ADME properties of drugs. Drug Metab. Pharmacokinet. 2004, 19, 327–338. [Google Scholar] [CrossRef] [PubMed]
- Sohlenius-Sternbeck, A.K.; Terelius, Y. Evaluation of ADMET predictor in early discovery drug metabolism and pharmacokinetics project work. Drug Metab. Dispos. 2022, 50, 95–104. [Google Scholar] [CrossRef]
- Antunes, N.J.; Coombes, G.; da Cunha, K.F.; Moreira, F.L.; Pilon, A.C.; Lopes, N.P.; Costa, J.L.D.; Kipper, K.; Couchman, L.; Johnston, A.; et al. In vitro metabolism of the new antifungal dapaconazole using liver microsomes. Drug Metab. Pharmacokinet. 2022, 47, 100475. [Google Scholar] [CrossRef] [PubMed]
- FDA, U.S. Guidance for Industry: M12 Drug Interaction Studies: Guidance for Industry; 2024. Available online: https://www.fda.gov/regulatory-information/search-fda-guidance-documents/m12-drug-interaction-studies (accessed on 18 November 2024).
- Bradford, M.M. A rapid and sensitive method for the quantitation of microgram quantities of protein utilizing the principle of protein-dye binding. Anal. Biochem. 1976, 72, 248–254. [Google Scholar] [CrossRef]
- Antunes, N.J.; Moreira, F.L.; Kipper, K.; Couchman, L.; Lebre, D.T.; Johnston, A.; De Nucci, G. Prospective prediction of dapaconazole clinical drug-drug interactions using an in vitro to in vivo extrapolation equation and PBPK modeling. Pharmaceuticals 2022, 16, 28. [Google Scholar] [CrossRef]
- Langowski, J.; Long, A. Computer systems for the prediction of xenobiotic metabolism. Adv. Drug Deliv. Rev. 2002, 54, 407–415. [Google Scholar] [CrossRef]
- Marchant, C.A.; Briggs, K.A.; Long, A. In silico tools for sharing data and knowledge on toxicity and metabolism: Derek for windows, meteor, and vitic. Toxicol. Mech. Methods 2008, 18, 177–187. [Google Scholar] [CrossRef]
- Boyce, M.; Meyer, B.; Grulke, C.; Lizarraga, L.; Patlewicz, G. Comparing the performance and coverage of selected in silico (liver) metabolism tools relative to reported studies in the literature to inform analogue selection in read-across: A case study. Comput. Toxicol. 2022, 21, 100208. [Google Scholar] [CrossRef] [PubMed]
- Najjar, A.; Lange, D.; Genies, C.; Kuehnl, J.; Zifle, A.; Jacques, C.; Fabian, E.; Hewitt, N.; Schepky, A. Development and validation of PBPK models for genistein and daidzein for use in a next-generation risk assessment. Front. Pharmacol. 2024, 15, 1421650. [Google Scholar] [CrossRef] [PubMed]
- Djoumbou-Feunang, Y.; Pon, A.; Karu, N.; Zheng, J.; Li, C.; Arndt, D.; Gautam, M.; Allen, F.; Wishart, D.S. CFM-ID 3.0: Significantly improved ESI-MS/MS prediction and compound identification. Metabolites 2019, 9, 72. [Google Scholar] [CrossRef]
- Benet, L.Z.; Zia-Amirhosseini, P. Basic Principles of Pharmacokinetics. Toxicol. Pathol. 1995, 23, 115–123. [Google Scholar] [CrossRef]
- Choi, G.W.; Lee, Y.B.; Cho, H.Y. Interpretation of Non-Clinical Data for Prediction of Human Pharmacokinetic Parameters: In Vitro-In Vivo Extrapolation and Allometric Scaling. Pharmaceutics 2019, 11, 168. [Google Scholar] [CrossRef]
- Fraczkiewicz, R.; Lobell, M.; Goller, A.H.; Krenz, U.; Schoenneis, R.; Clark, R.D.; Hillisch, A. Best of both worlds: Combining pharma data and state of the art modeling technology to improve in silico pKa prediction. J. Chem. Inf. Model. 2015, 55, 389–397. [Google Scholar] [CrossRef]
- Demarque, D.P.; Crotti, A.E.; Vessecchi, R.; Lopes, J.L.; Lopes, N.P. Fragmentation reactions using electrospray ionization mass spectrometry: An important tool for the structural elucidation and characterization of synthetic and natural products. Nat. Prod. Rep. 2016, 33, 432–455. [Google Scholar] [CrossRef] [PubMed]
- Verma, S.; Ak, P. An in-silico approach to explore the possible multifunctional neuroprotective efficacy of violacein against ischemic stroke. J. Silico Vitr. Pharmacol. 2017, 3, 17. [Google Scholar] [CrossRef]
- Hamzah, M.A.A.M.; Rusdi, N.A.; Wahidin, M.A.; Aruldass, C.A.; Maarof, H.; Ahmad, W.A.; Setu, S.A. Synthesis of water-soluble violacein nanoparticles and molecular dynamic study. Colloid Polym. Sci. 2024, 302, 791–802. [Google Scholar] [CrossRef]
- Ahmad, W.A.; Yusof, N.Z.; Nordin, N.; Zakaria, Z.A.; Rezali, M.F. Production and characterization of violacein by locally isolated Chromobacterium violaceum grown in agricultural wastes. Appl. Biochem. Biotechnol. 2012, 167, 1220–1234. [Google Scholar] [CrossRef]
- Arrow, K.J.; Panosian, C.; Gelband, H. Saving Lives, Buying Time: Economics of Malaria Drugs in an Age of Resistance; National Academies Press: Washington, DC, USA, 2004. [Google Scholar]
- Hewitt, P.; Hartmann, A.; Tornesi, B.; Ferry-Martin, S.; Valentin, J.P.; Desert, P.; Gresham, S.; Demarta-Gatsi, C.; Venishetty, V.K.; Kolly, C. Importance of tailored non-clinical safety testing of novel antimalarial drugs: Industry best-practice. Regul. Toxicol. Pharmacol. 2024, 154, 105736. [Google Scholar] [CrossRef] [PubMed]
- Kouakou, Y.I.; Tod, M.; Leboucher, G.; Lavoignat, A.; Bonnot, G.; Bienvenu, A.L.; Picot, S. Systematic review of artesunate pharmacokinetics: Implication for treatment of resistant malaria. Int. J. Infect. Dis. 2019, 89, 30–44. [Google Scholar] [CrossRef] [PubMed]
- Ferreira, M.V.D.; Vieira, J.L.F.; Almeida, E.D.; Rivera, J.G.B.; Gomes, M.S.M.; de Siqueira, A.M. Pharmacokinetics of mefloquine administered with artesunate in patients with uncomplicated falciparum malaria from the Brazilian Amazon basin. Malar. J. 2018, 17, 268. [Google Scholar] [CrossRef]
- Devries, P.J.; Oosterhuis, B.; Vanboxtel, C.J. Single-dose pharmacokinetics of chloroquine and its main metabolite in healthy-volunteers. Drug Investig. 1994, 8, 143–149. [Google Scholar] [CrossRef]
- Lupin Pharmaceuticals, Inc. Quinine Sulfate Capsules USP; Lupin Pharmaceuticals, Inc.: Baltimore, MD, USA, 2023. [Google Scholar]
- Li, X.Q.; Bjorkman, A.; Andersson, T.B.; Gustafsson, L.L.; Masimirembwa, C.M. Identification of human cytochrome P(450)s that metabolise anti-parasitic drugs and predictions of in vivo drug hepatic clearance from in vitro data. Eur. J. Clin. Pharmacol. 2003, 59, 429–442. [Google Scholar] [CrossRef] [PubMed]
- White, N.J. Pharmacokinetic and pharmacodynamic considerations in antimalarial dose optimization. Antimicrob. Agents Chemother. 2013, 57, 5792–5807. [Google Scholar] [CrossRef]
- Constantino, L.; Paixao, P.; Moreira, R.; Portela, M.J.; Do Rosario, V.E.; Iley, J. Metabolism of primaquine by liver homogenate fractions. Evidence for monoamine oxidase and cytochrome P450 involvement in the oxidative deamination of primaquine to carboxyprimaquine. Exp. Toxicol. Pathol. 1999, 51, 299–303. [Google Scholar] [CrossRef]
- Alia, J.D.; Karl, S.; Kelly, T.D. Quantum chemical lipophilicities of antimalarial drugs in relation to terminal half-life. ACS Omega 2020, 5, 6500–6515. [Google Scholar] [CrossRef]
- Moore, B.R.; Page-Sharp, M.; Stoney, J.R.; Ilett, K.F.; Jago, J.D.; Batty, K.T. Pharmacokinetics, pharmacodynamics, and allometric scaling of chloroquine in a murine malaria model. Antimicrob. Agents Chemother. 2011, 55, 3899–3907. [Google Scholar] [CrossRef]
- Nakijoba, R.; Nakayiwa Kawuma, A.; Ojara, F.W.; Tabwenda, J.C.; Kyeyune, J.; Turyahabwe, C.; Asiimwe, S.P.; Magoola, J.; Banda, C.G.; Castelnuovo, B.; et al. Pharmacokinetics of antimalarial drugs used to treat uncomplicated malaria in breastfeeding mother-infant pairs: An observational pharmacokinetic study. Wellcome Open Res. 2023, 8, 12. [Google Scholar] [CrossRef]
- Lu, C.; Li, P.; Gallegos, R.; Uttamsingh, V.; Xia, C.Q.; Miwa, G.T.; Balani, S.K.; Gan, L.S. Comparison of intrinsic clearance in liver microsomes and hepatocytes from rats and humans: Evaluation of free fraction and uptake in hepatocytes. Drug Metab. Dispos. 2006, 34, 1600–1605. [Google Scholar] [CrossRef]
- Richardson, V.M.; Ferguson, S.S.; Sey, Y.M.; Devito, M.J. In vitro metabolism of thyroxine by rat and human hepatocytes. Xenobiotica 2014, 44, 391–403. [Google Scholar] [CrossRef] [PubMed]
- Yeleswaram, K.; McLaughlin, L.G.; Knipe, J.O.; Schabdach, D. Pharmacokinetics and oral bioavailability of exogenous melatonin in preclinical animal models and clinical implications. J. Pineal. Res. 1997, 22, 45–51. [Google Scholar] [CrossRef] [PubMed]
- Cosson, V.F.; Fuseau, E.; Efthymiopoulos, C.; Bye, A. Mixed effect modeling of sumatriptan pharmacokinetics during drug development. I: Interspecies allometric scaling. J. Pharmacokinet. Biopharm. 1997, 25, 149–167. [Google Scholar] [CrossRef] [PubMed]
- Martignoni, M.; Groothuis, G.; de Kanter, R. Comparison of mouse and rat cytochrome P450-mediated metabolism in liver and intestine. Drug Metab. Dispos. 2006, 34, 1047–1054. [Google Scholar] [CrossRef]
- Martignoni, M.; Groothuis, G.M.M.; de Kanter, R. Species differences between mouse, rat, dog, monkey and human CYP-mediated drug metabolism, inhibition and induction. Expert. Opin. Drug Metab. Toxicol. 2006, 2, 875–894. [Google Scholar] [CrossRef]
- Karthikeyan, B.S.; Akbarsha, M.A.; Parthasarathy, S. Network analysis and cross species comparison of protein-protein interaction networks of human, mouse and rat cytochrome P450 proteins that degrade xenobiotics. Mol. Biosyst. 2016, 12, 2119–2134. [Google Scholar] [CrossRef]
- Court, M.H. Feline drug metabolism and disposition: Pharmacokinetic evidence for species differences and molecular mechanisms. Vet. Clin. N. Am. Small Anim. Pract. 2013, 43, 1039–1054. [Google Scholar] [CrossRef]

| Parameter Predicted | In Silico | |
|---|---|---|
| Data | Source | |
| log P | 3.226 | ADMET Predictor® |
| Water solubility | 0.005 mg/mL | |
| pKa (strongest base) | 11.38 | |
| pKa (strongest acid) | 10.21 | |
| HLMs | |||||
| Time | Average Area | RSD (%) | Z (%) | Ln Z | Linear Regression Equation Analytical Parameters |
| 0 | 1.057 | 0.3 | 100 | 4.605 | y = −0.0032x + 4.3894 r2 = 0.9651 Slope (k) = 0.0032 |
| 3 | 0.916 | 0.1 | 87 | 4.462 | |
| 5 * | 0.876 | 0.0 | 83 | 4.417 | |
| 15 | 0.792 | 0.2 | 75 | 4.316 | |
| 30 | 0.762 | 0.0 | 72 | 4.277 | |
| 60 | 0.693 | 0.1 | 66 | 4.183 | |
| 120 | 0.587 | 0.0 | 56 | 4.017 | |
| MLMs | |||||
| Time | Average Area | RSD (%) | Z (%) | Ln Z | Linear Regression Equation Analytical Parameters |
| 0 | 0.796 | 0.0 | 100 | 4.605 | y = −0.0085x + 4.3405 r2 = 0.9554 Slope (k) = 0.0085 |
| 3 | 0.710 | 0.1 | 89 | 4.490 | |
| 5 * | 0.635 | 0.0 | 80 | 4.379 | |
| 15 | 0.554 | 0.0 | 70 | 4.244 | |
| 30 | 0.444 | 0.0 | 56 | 4.022 | |
| 60 | 0.327 | 0.0 | 41 | 3.715 | |
| 120 | 0.235 | 0.0 | 30 | 3.385 | |
| RLMs | |||||
| Time | Average Area | RSD (%) | Z (%) | Ln Z | Linear Regression Equation Analytical Parameters |
| 0 | 1.333 | 0.0 | 100 | 4.605 | |
| 3 | 1.193 | 0.8 | 90 | 4.495 | y = −0.0192x + 4.0344 r2 = 0.9459 Slope (k) = 0.0192 |
| 5 * | 0.805 | 0.4 | 60 | 4.101 | |
| 15 | 0.615 | 0.1 | 46 | 3.832 | |
| 30 | 0.388 | 0.1 | 29 | 3.371 | |
| 60 | 0.171 | 0.1 | 13 | 2.549 | |
| 120 | 0.089 | 0.1 | 7 | 1.899 | |
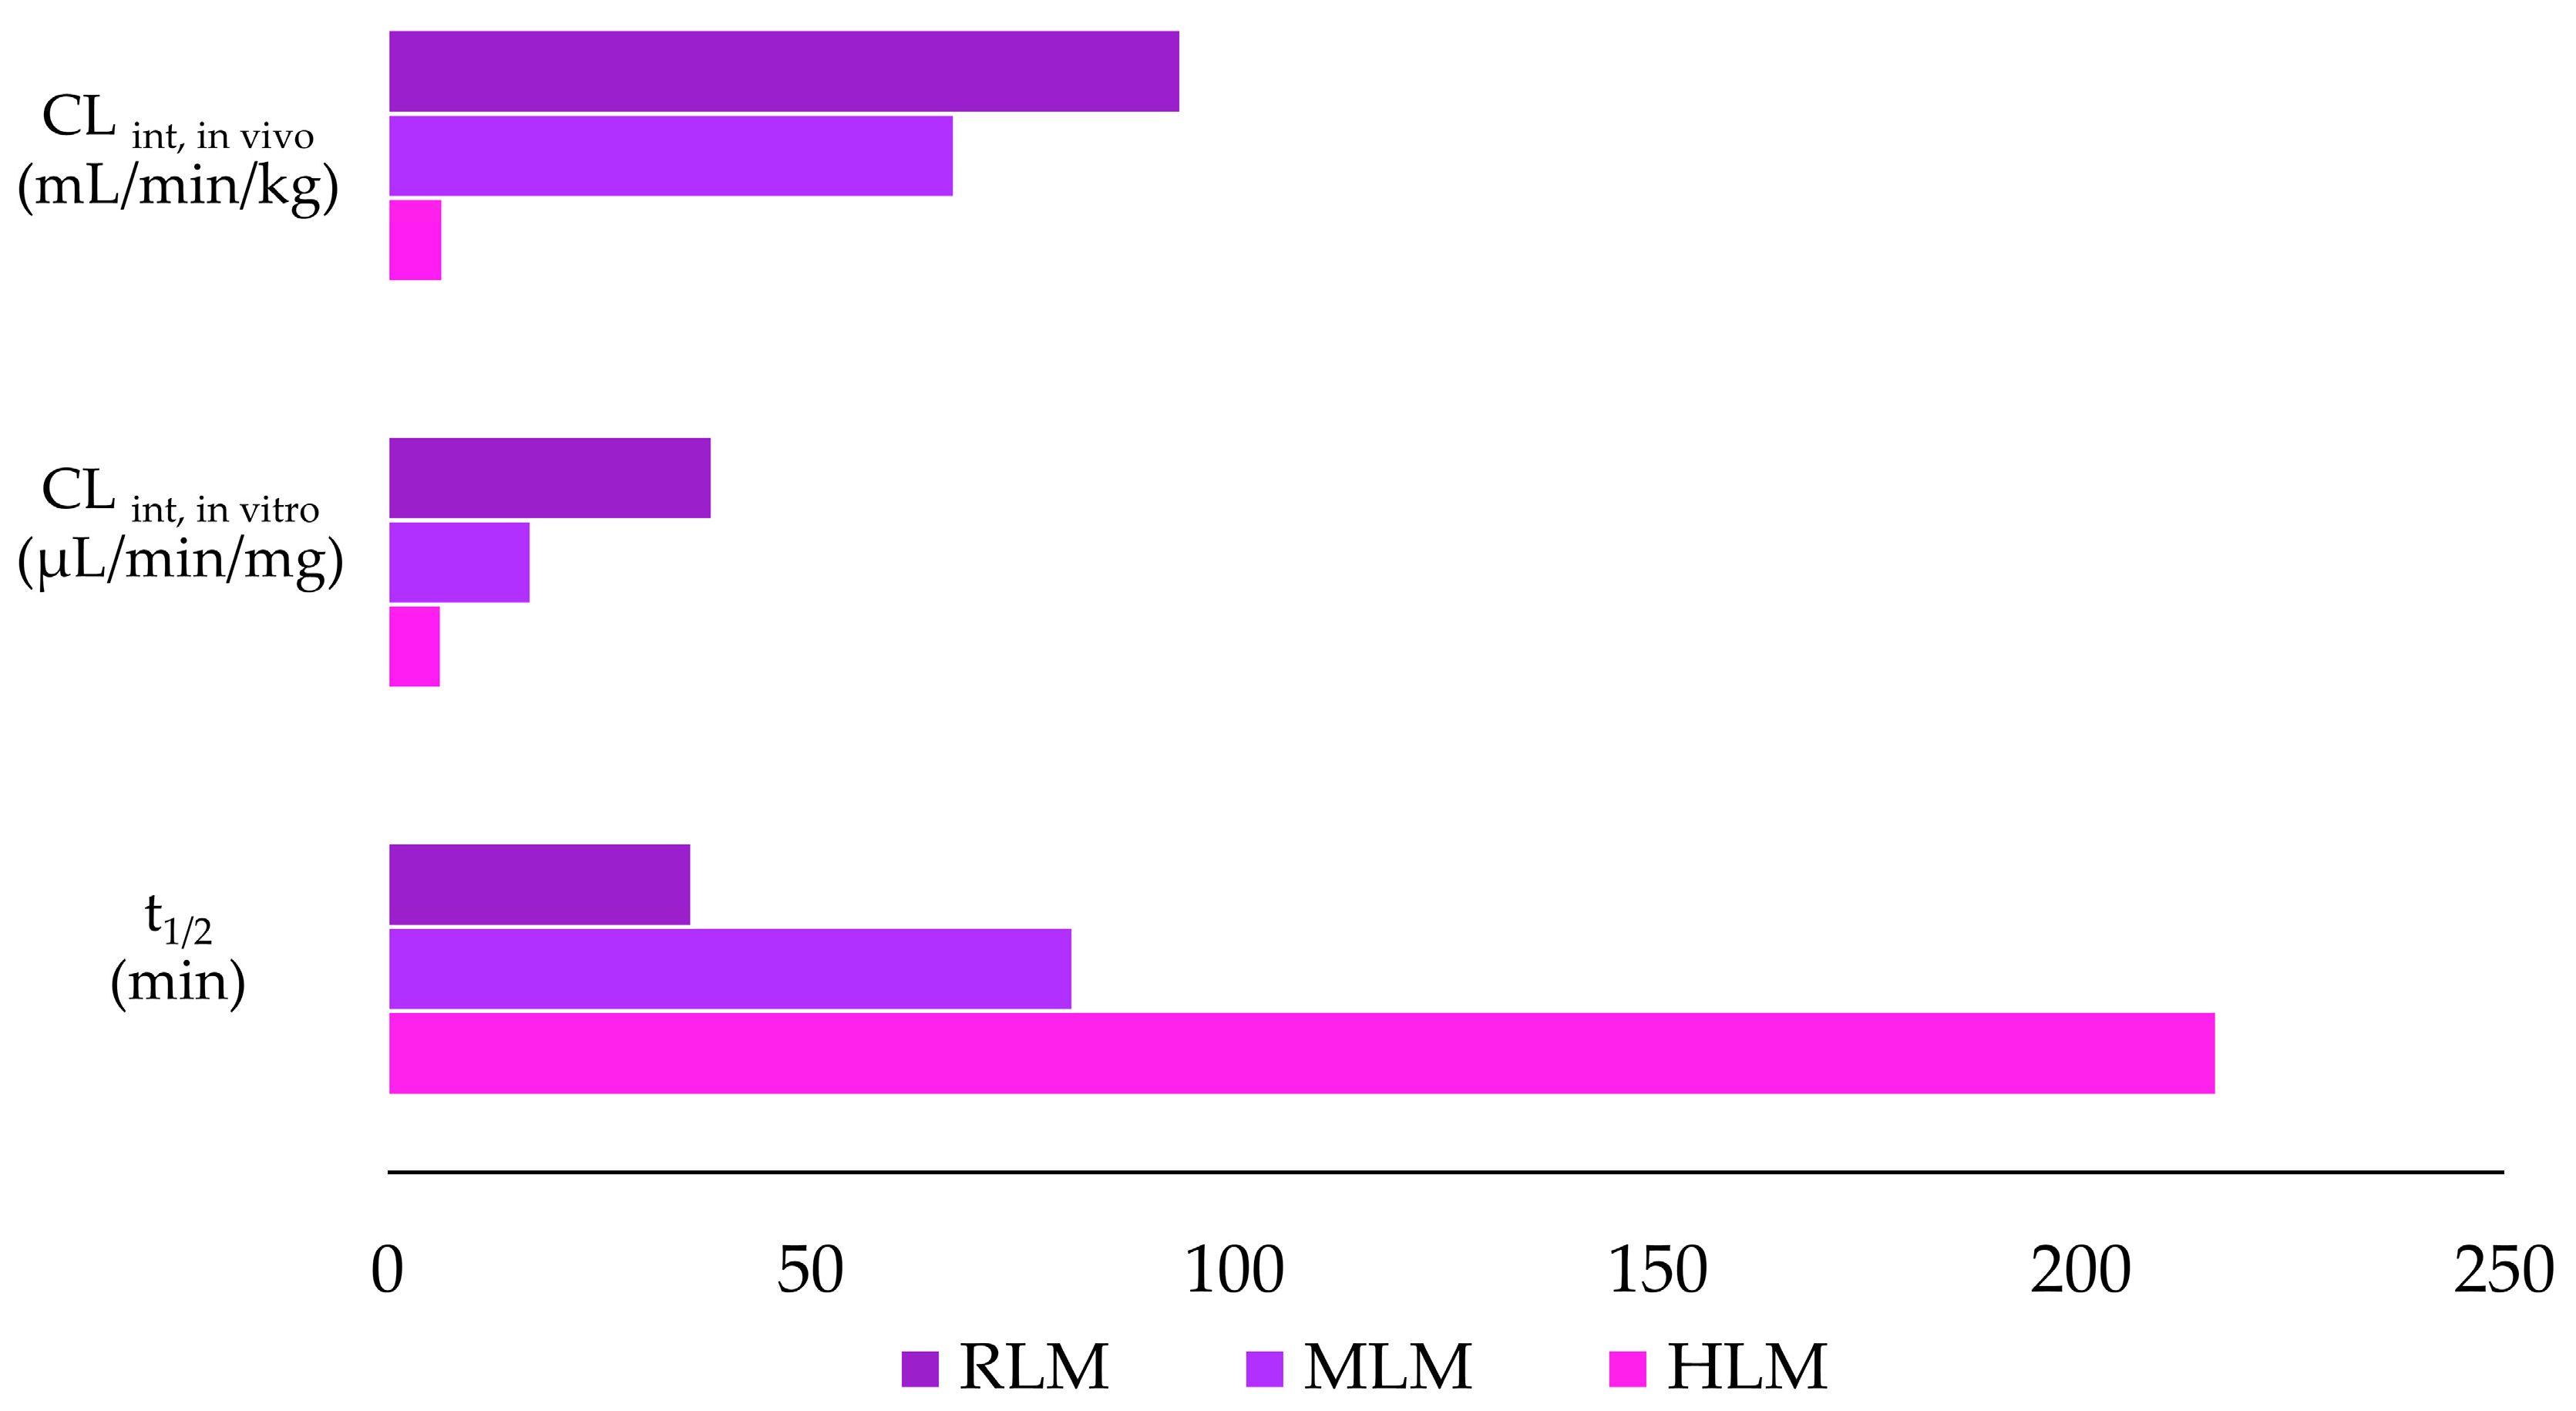
| Parameter | Species | ||
|---|---|---|---|
| Human | Mouse | Rat | |
| t1/2 (min) | 216 | 81 | 36 |
| CLint, in vitro (µL/min/mg) | 6.40 | 17.01 | 38.41 |
| CLint, in vivo (mL/min/kg) | 6.58 | 66.99 | 93.72 |
| Microsomal Model | Metabolism Reaction | Fragment | Molecular Formula Neutral | Exact Mass (ppm) | Theoretical Exact Mass [M + H]+ | Measured Exact Mass [M + H]+ | Mass Error (ppm) | Theoretical Exact Mass [M − H]− | Measured Exact Mass [M − H]− | Mass Error (ppm) | Retention Time (min) |
|---|---|---|---|---|---|---|---|---|---|---|---|
| Violacein | - | C20H13N3O3 | 343.0956 | 344.1035 | 344.1033 | 0.63 | 342.0878 | 342.0889 | −3.02 | [M + H]+ 12.15 [M − H]− 12.14 | |
| RLMs HLMs | Violacein - | F1 | C19H12N2O2 | 300.0898 | 301.0977 | 301.0976 | 0.34 | 299.0821 | 299.0822 | −0.49 | |
| F2 | C12H6N2O2 | 210.0429 | 211.0507 | 211.0505 | 0.95 | 209.0351 | 209.0355 | −1.91 | |||
| F3 | C11H6N2O | 182.0480 | 183.0558 | 183.0548 | 5.67 | - | - | - | |||
| F4 | C9H6N2O | 158.0480 | 159.0558 | 159.0561 | −1.65 | 157.0401 | 157.0405 | −2.55 | |||
| F5 | C8H7NO | 133.0527 | - | - | - | 132.0449 | 132.0465 | −12.12 | |||
| Violacein–glucuronide | M1 | C26H21N3O9 | 519.1277 | 520.1356 | 520.1356 | 0.00 | 518.1199 | 518.1194 | 0.97 | [M + H]+ 10.10 and 10.85 [M − H]− 10.42 and 10.86 | |
| RLMs HLMs | Glucuronidation | F6 | C20H13N3O3 | 343.0957 | 344.1035 | 344.1033 | 0.58 | 342.0878 | 342.0882 | −1.17 | |
| F1 | C19H12N2O2 | 300.0899 | 301.0977 | 301.0976 | 0.33 | 299.0820 | 299.0807 | 4.35 | |||
| F2 | C12H6N2O2 | 210.0429 | 211.0507 | 211.0492 | 7.11 | 209.0351 | 209.0354 | −1.44 | |||
| F3 | C11H6N2O | 182.0480 | 183.0558 | 183.0557 | 0.55 | - | - | - | |||
| F4 | C9H6N2O | 158.0480 | 159.0558 | 159.0548 | 6.29 | 157.0402 | 157.0404 | −1.35 | |||
| Violacein–reduced | M2 | C20H15N3O3 | 345.1113 | 346.1191 | 346.1186 | 1.44 | 344.1035 | 344.1038 | −0.82 | [M + H]+ 7.41 and 7.84 [M − H]− 7.39 and 7.83 | |
| RLMs HLMs | Reduction | F1 | C19H12N2O2 | 300.0898 | - | - | - | 299.0820 | 299.0825 | −1.67 | |
| F7 | C12H8N2O2 | 212.0585 | 213.0664 | 213.066 | 1.88 | 211.0507 | 211.0512 | −2.37 | |||
| F8 | C11H8N2O | 184.0636 | 185.0714 | 185.0707 | 3.78 | - | - | - | |||
| F4 | C9H6N2O | 158.0480 | 159.0558 | 159.0613 | −34.58 * | 157.0401 | 157.0404 | −1.91 | |||
| F9 | C8H6NO | 133.0527 | 133.0520 | 133.0524 | −3.01 | 132.0449 | 132.0448 | 0.76 | |||
| Violacein reduced glucuronide | M3 | C26H23N3O9 | 521.1434 | 522.1512 | 522.1512 | 0.00 | 520.1356 | 520.1348 | 1.54 | [M + H]+ 5.13 and 6.25 [M − H]− 5.04 and 6.25 | |
| RLMs | Reduction + glucuronidation | F10 | C18H16N2O8 | 388.0906 | 389.0984 | 389.0972 | 3.08 | 387.0828 | 387.0821 | 1.81 | |
| F7 | C12H8N2O2 | 212.0585 | 213.0664 | 213.0662 | 0.94 | 211.0507 | 211.0526 | −9.00 | |||
| Violacein–reduced–reduced | M4 | C20H17N3O3 | 347.1269 | 348.1348 | 348.1340 | 2.30 | 346.1191 | 346.1180 | 3.18 | [M + H]+ 12.15 [M − H]− 12.14 | |
| RLMs HLMs | Reduction + reduction | F11 | C20H16N2O3 | 332.1160 | 331.1082 | 331.1094 | −3.62 | - | - | - | |
| F12 | C20H17N3O2 | 331.1320 | 330.1242 | 330.1228 | 4.24 | - | - | - | |||
| F13 | C12H10N2O2 | 214.0742 | - | - | - | 213.0664 | 213.0666 | −0.94 | |||
| F14 | C12H9NO2 | 199.0633 | 198.0555 | 198.0553 | 1.01 | - | - | - | |||
| F15 | C12H10N2O | 198.0793 | 197.0714 | 197.0711 | 1.52 | - | - | - | |||
| F16 | C12H10N2O2 | 196.0636 | - | - | - | 195.0558 | 195.0558 | 0.00 | |||
| F17 | C10H8N2O2 | 188.0585 | - | - | - | 187.0507 | 187.0513 | −3.21 | |||
| F18 | C11H8NO | 171.0684 | 170.0605 | 170.0601 | 2.35 | - | - | - | |||
Disclaimer/Publisher’s Note: The statements, opinions and data contained in all publications are solely those of the individual author(s) and contributor(s) and not of MDPI and/or the editor(s). MDPI and/or the editor(s) disclaim responsibility for any injury to people or property resulting from any ideas, methods, instructions or products referred to in the content. |
© 2025 by the authors. Licensee MDPI, Basel, Switzerland. This article is an open access article distributed under the terms and conditions of the Creative Commons Attribution (CC BY) license (https://creativecommons.org/licenses/by/4.0/).
Share and Cite
Calemi, D.B.d.A.; Godoi, A.B.; Minuti, G.; Neto, F.C.; Hispagnol, G.F.; Pilon, A.C.; Costa, J.L.; Hyslop, S.; Antunes, N.d.J. Evaluation of Violacein Metabolic Stability and Metabolite Identification in Human, Mouse, and Rat Liver Microsomes. Pharmaceutics 2025, 17, 601. https://doi.org/10.3390/pharmaceutics17050601
Calemi DBdA, Godoi AB, Minuti G, Neto FC, Hispagnol GF, Pilon AC, Costa JL, Hyslop S, Antunes NdJ. Evaluation of Violacein Metabolic Stability and Metabolite Identification in Human, Mouse, and Rat Liver Microsomes. Pharmaceutics. 2025; 17(5):601. https://doi.org/10.3390/pharmaceutics17050601
Chicago/Turabian StyleCalemi, Debora Bressanim de Aquino, Alexandre Barcia Godoi, Giulia Minuti, Fausto Carnevale Neto, Gabriel Felipe Hispagnol, Alan Cesar Pilon, Jose Luiz Costa, Stephen Hyslop, and Natalicia de Jesus Antunes. 2025. "Evaluation of Violacein Metabolic Stability and Metabolite Identification in Human, Mouse, and Rat Liver Microsomes" Pharmaceutics 17, no. 5: 601. https://doi.org/10.3390/pharmaceutics17050601
APA StyleCalemi, D. B. d. A., Godoi, A. B., Minuti, G., Neto, F. C., Hispagnol, G. F., Pilon, A. C., Costa, J. L., Hyslop, S., & Antunes, N. d. J. (2025). Evaluation of Violacein Metabolic Stability and Metabolite Identification in Human, Mouse, and Rat Liver Microsomes. Pharmaceutics, 17(5), 601. https://doi.org/10.3390/pharmaceutics17050601