
Liquid Chromatography-Mass Spectrometry Analytical Methods for the Quantitation of p-Cresol Sulfate and Indoxyl Sulfate in Human Matrices: Biological Applications and Diagnostic Potentials


Abstract
1. Introduction
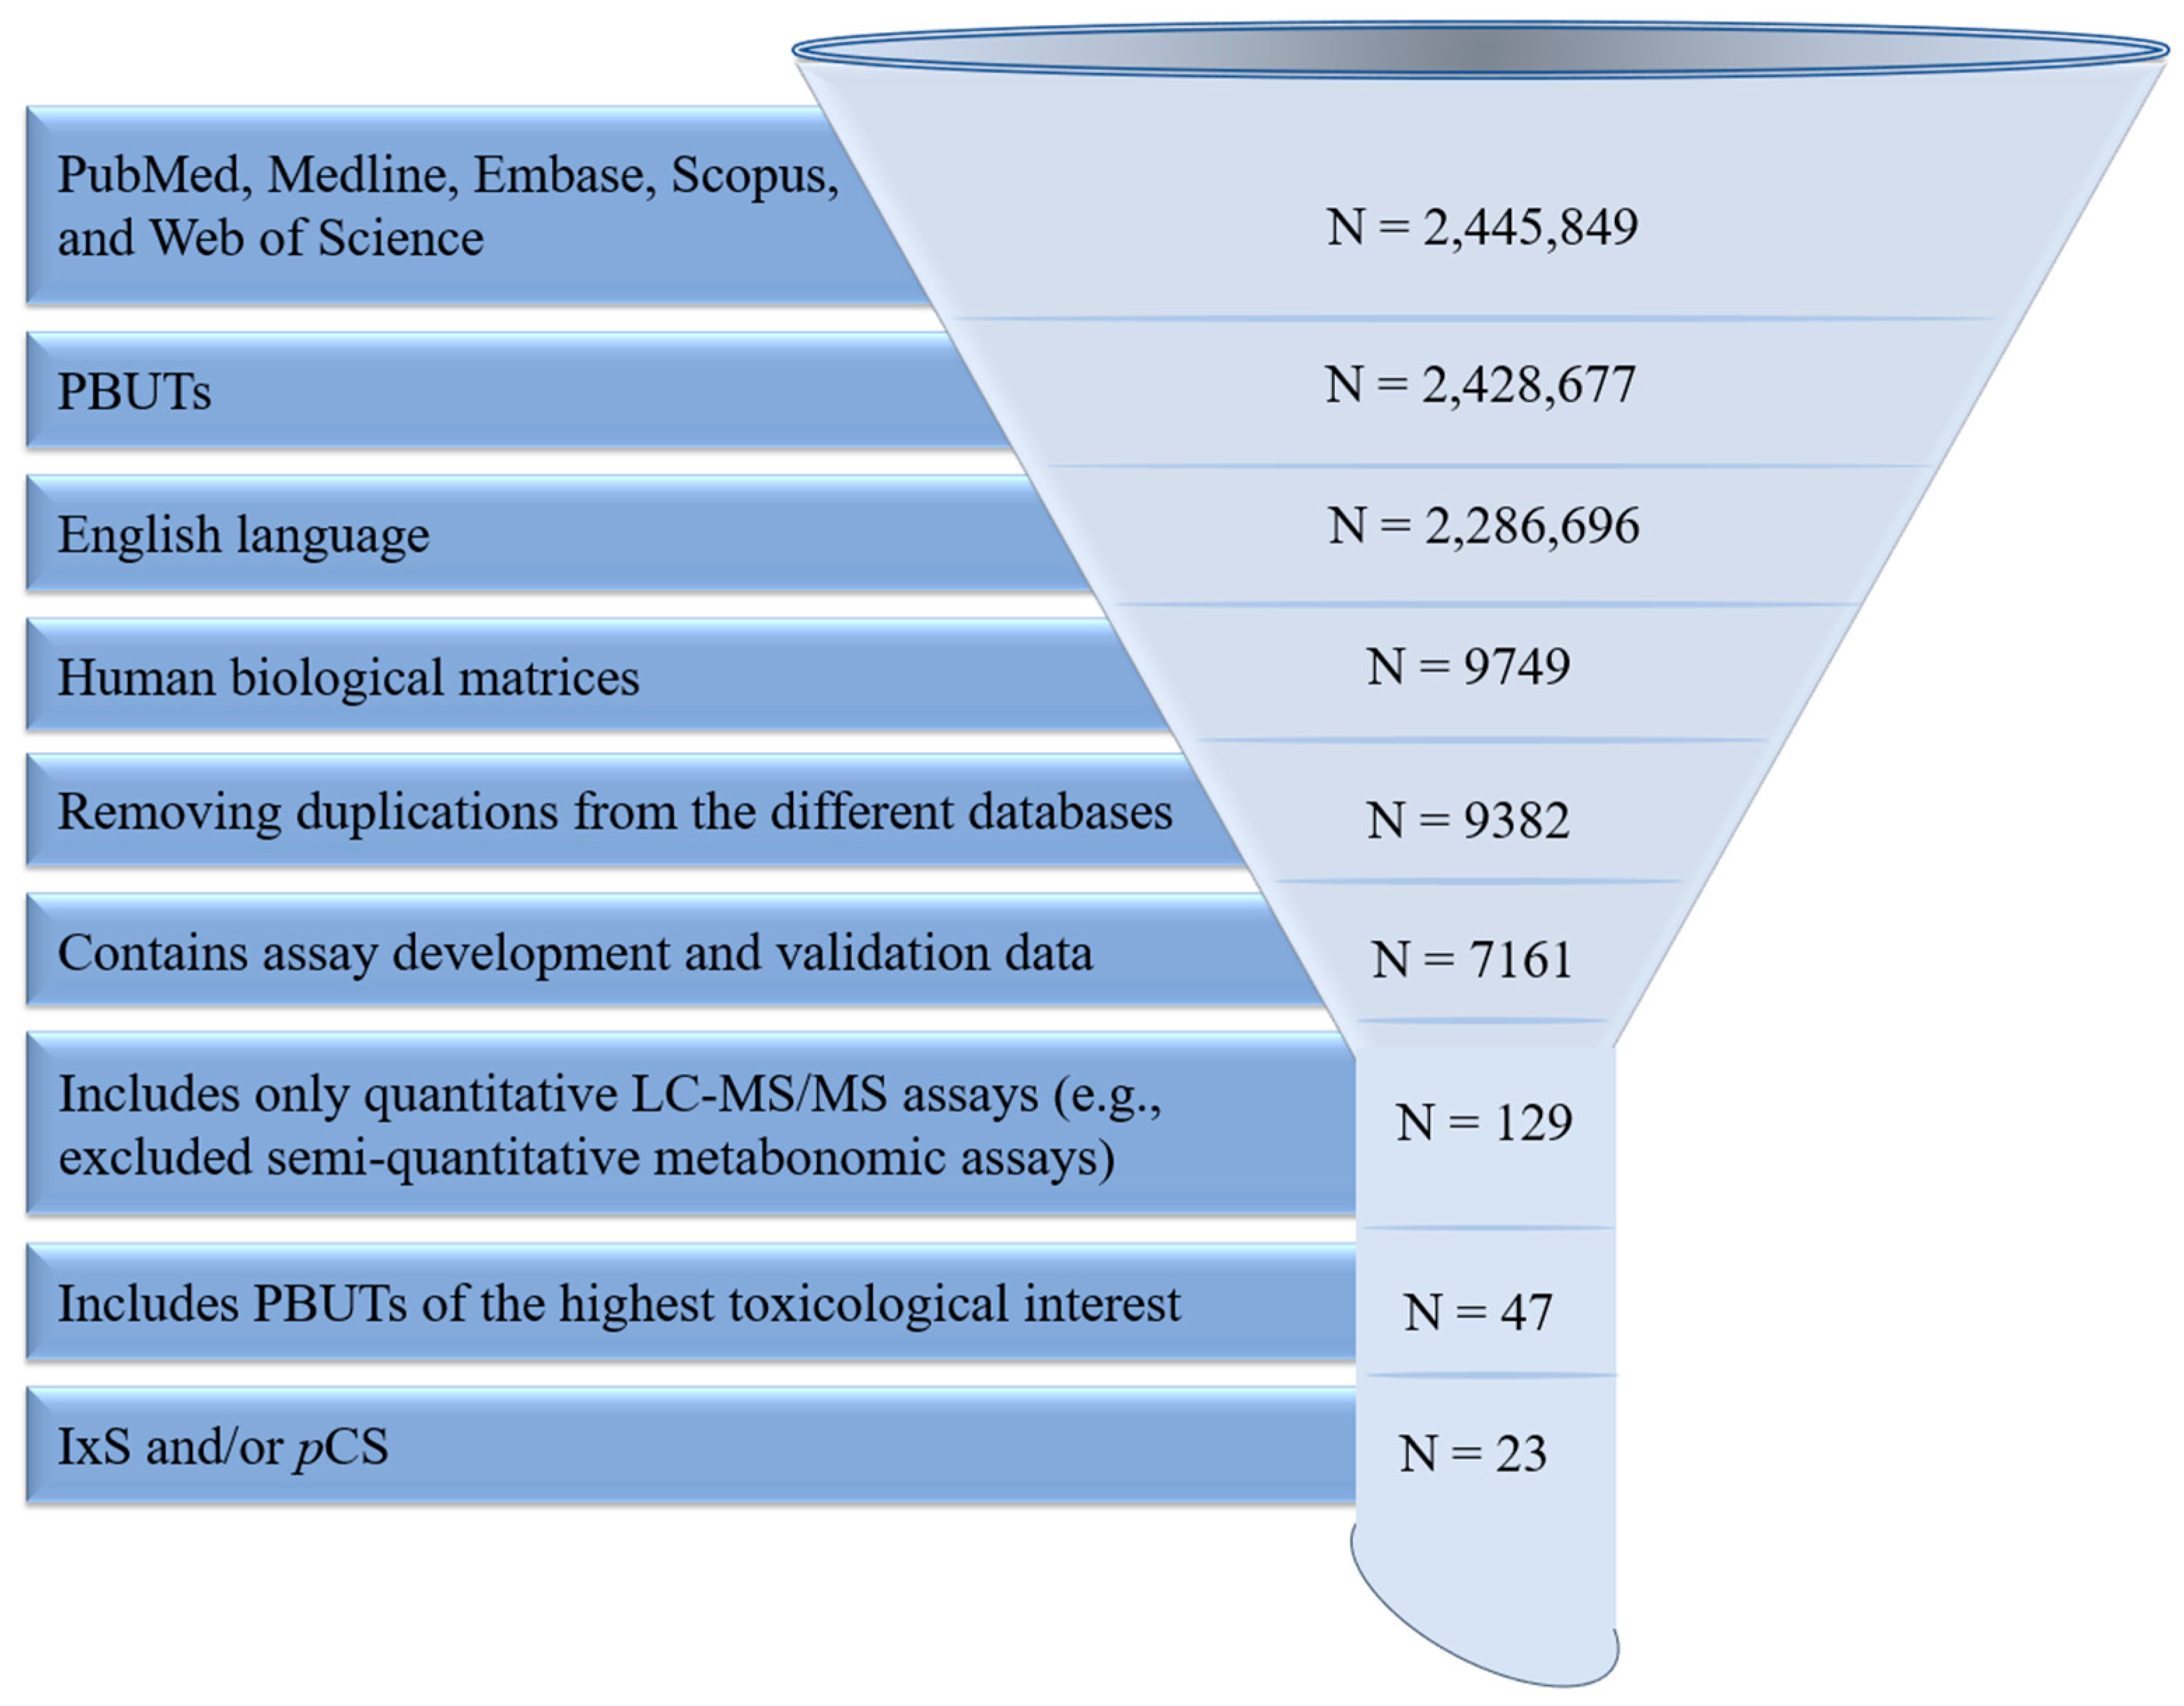
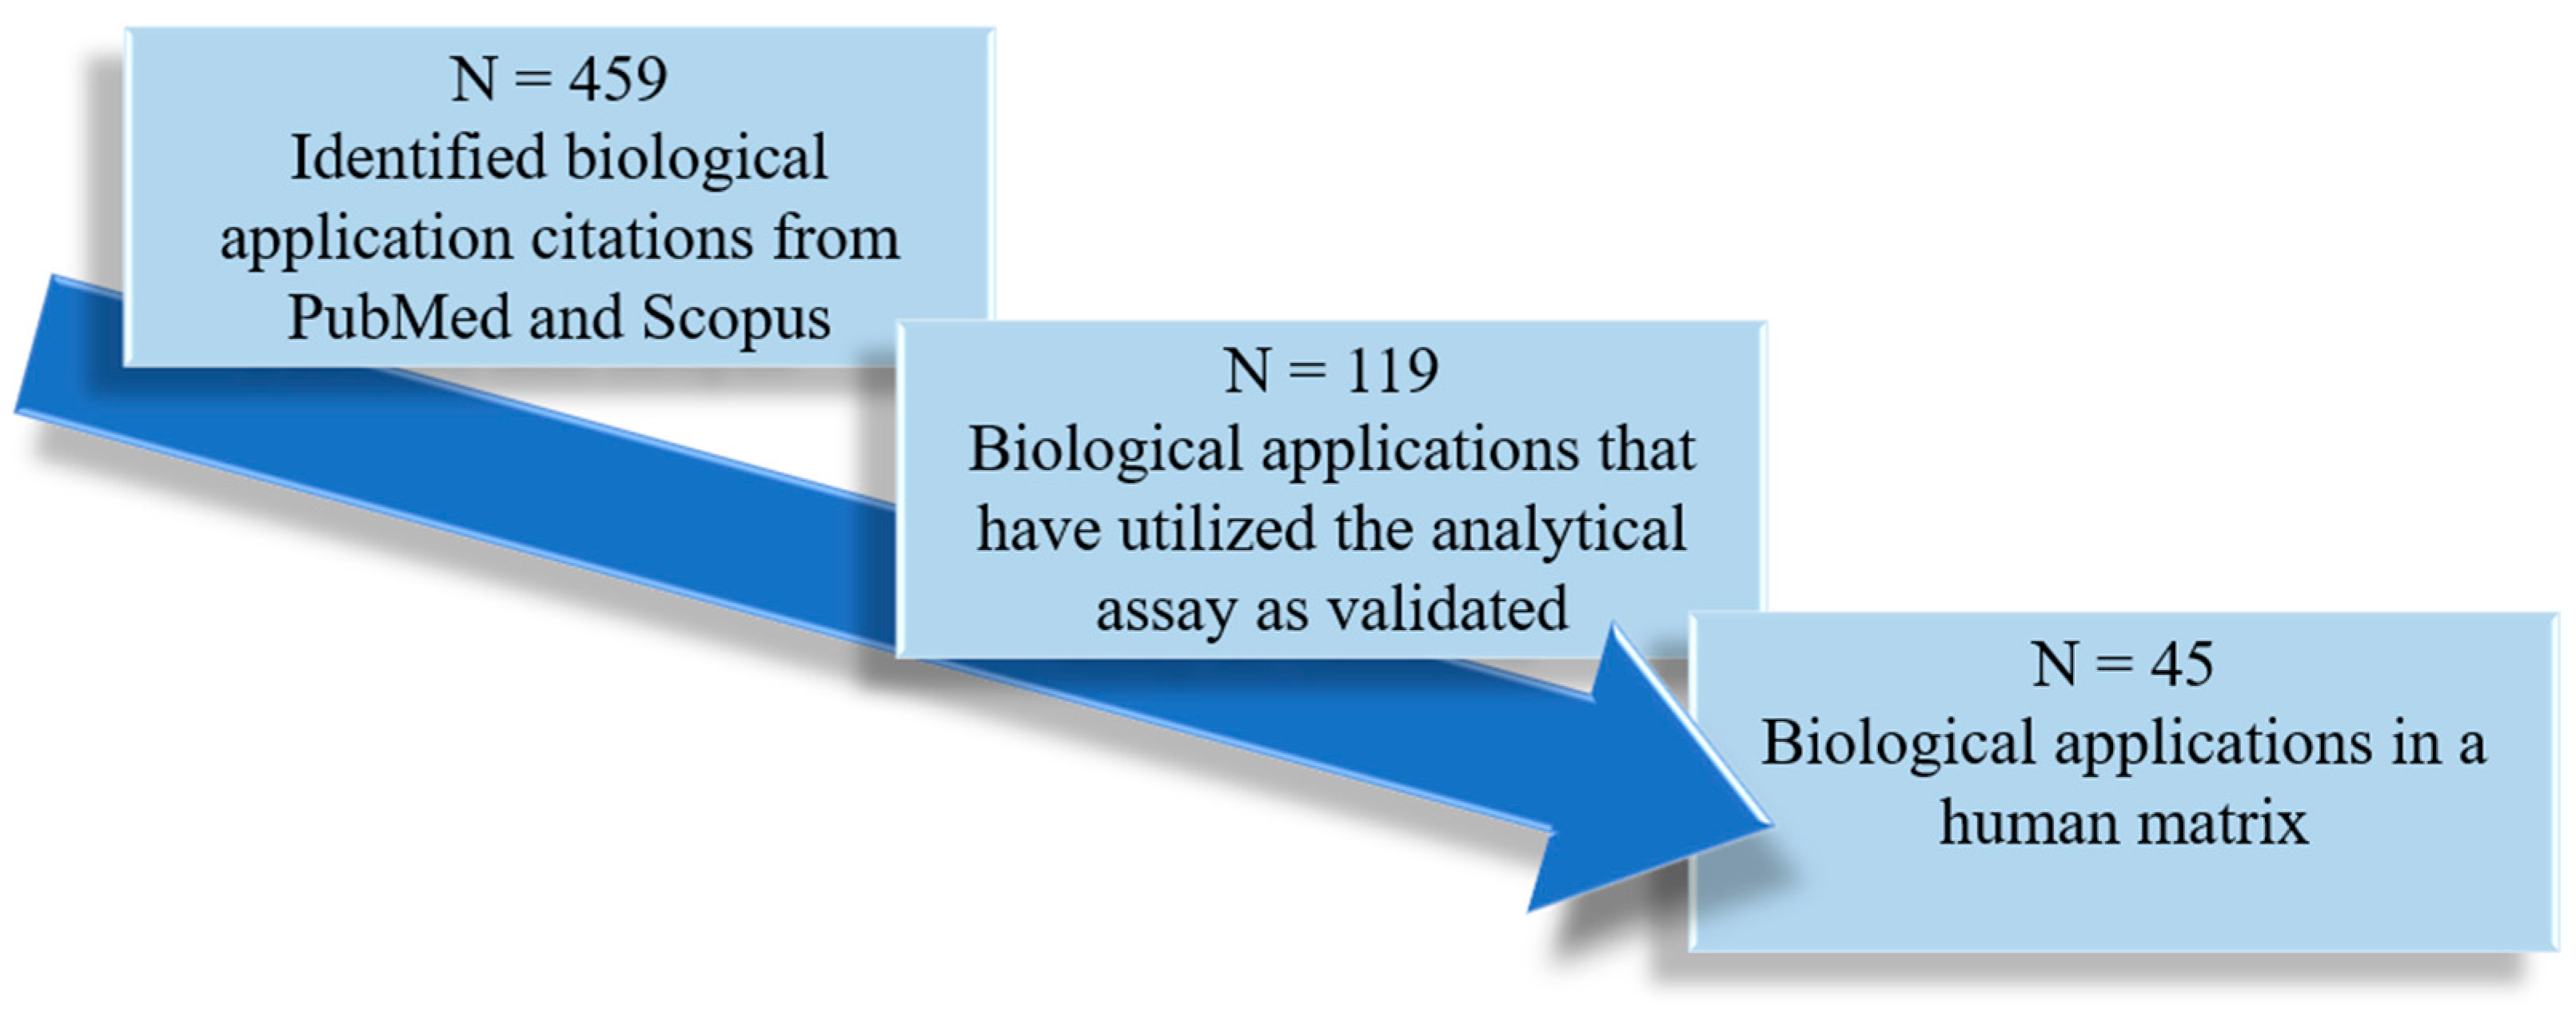
2. Materials and Methods
3. Results and Discussion
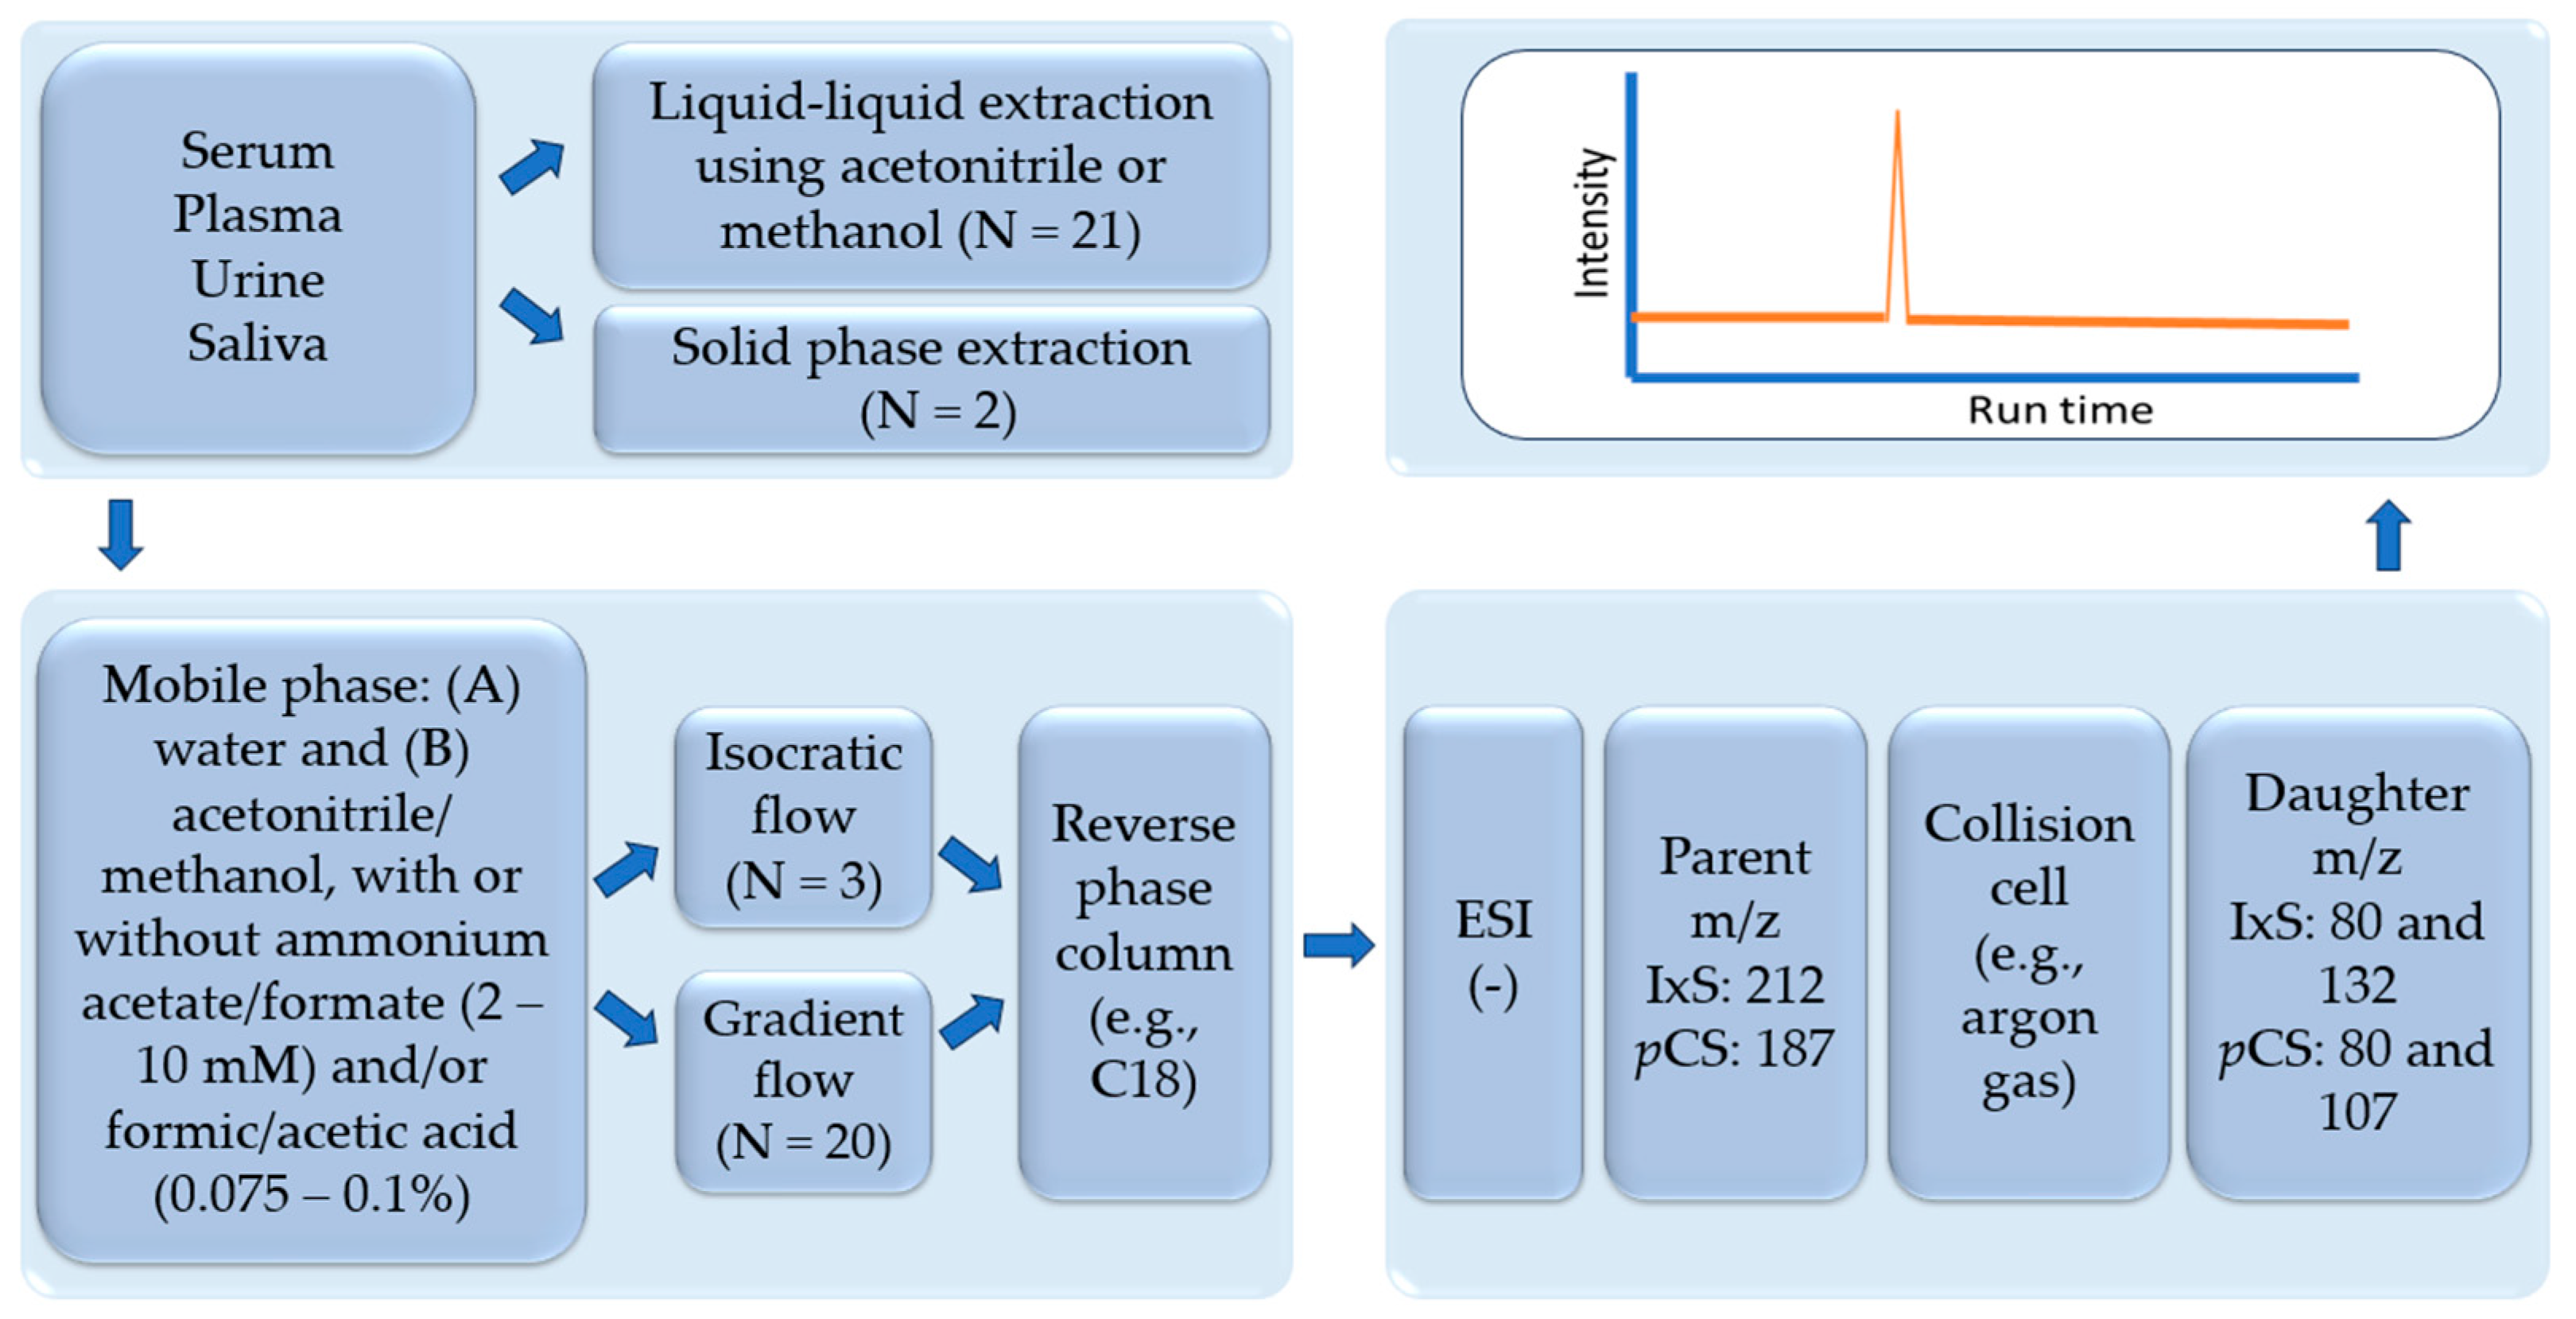
3.1. Analytical Assays in Serum and Plasma
3.1.1. Sample Preparation
3.1.2. Liquid Chromatography
3.2. Analytical Assays in Other Matrices
3.2.1. Sample Preparation
3.2.2. Liquid Chromatography Conditions
3.3. Mass Spectrometry
3.4. Assay Validation
3.5. Analytical Assay Summary and Future Directions
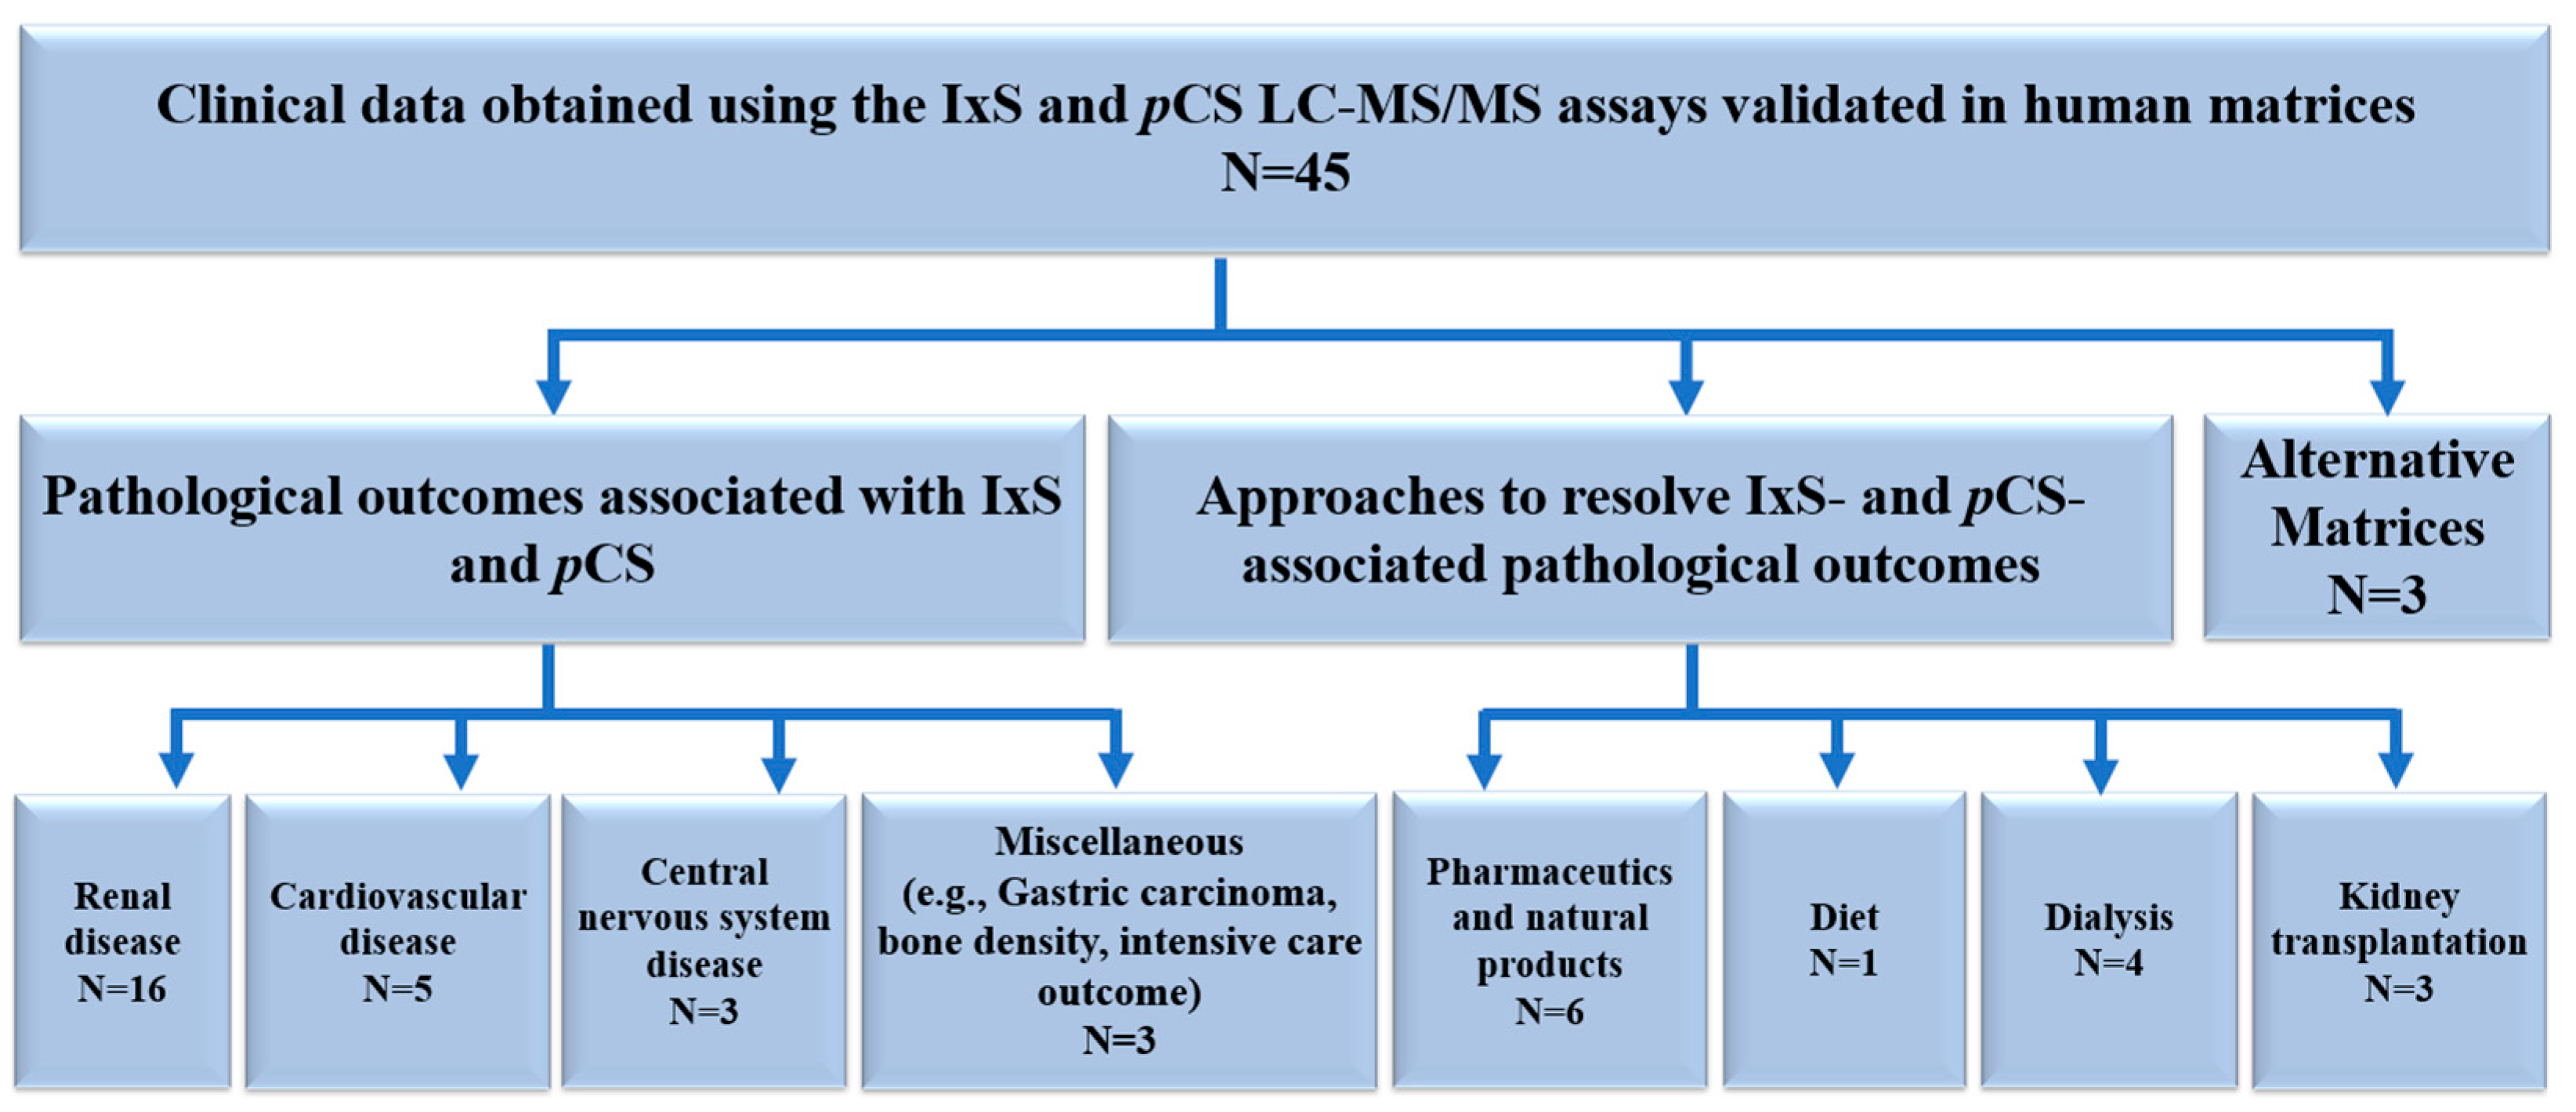
3.6. Clinical Data Obtained Using the IxS and pCS LCMS/MS Assays Validated in Human Biological Matrices
3.6.1. Liquid Chromatography Conditions
Renal Disease
Cardiovascular Disease
Central Nervous System Disease
Miscellaneous
3.6.2. Approaches to Mitigate IxS and pCS Associated Pathological Outcomes
Pharmaceutics and Natural Products
Diet
Dialysis
Kidney Transplantation
Alternative Matrices
3.7. Biological Applications Summary and Future Directions
4. Conclusions
Author Contributions
Funding
Institutional Review Board Statement
Informed Consent Statement
Data Availability Statement
Acknowledgments
Conflicts of Interest
References
- Denic, A.; Rule, A.D.; Glassock, R.J. Healthy and unhealthy aging on kidney structure and function: Human studies. Curr. Opin. Nephrol. Hypertens. 2022, 31, 228–234. [Google Scholar] [CrossRef] [PubMed]
- Lim, Y.J.; Sidor, N.A.; Tonial, N.C.; Che, A.; Urquhart, B.L. Uremic Toxins in the Progression of Chronic Kidney Disease and Cardiovascular Disease: Mechanisms and Therapeutic Targets. Toxins 2021, 13, 142. [Google Scholar] [CrossRef] [PubMed]
- Wilson, S.; Mone, P.; Jankauskas, S.S.; Gambardella, J.; Santulli, G. Chronic kidney disease: Definition, updated epidemiology, staging, and mechanisms of increased cardiovascular risk. J. Clin. Hypertens. 2021, 23, 831–834. [Google Scholar] [CrossRef]
- Charles, C.; Ferris, A.H. Chronic Kidney Disease. Prim. Care 2020, 47, 585–595. [Google Scholar] [CrossRef] [PubMed]
- Chen, T.K.; Knicely, D.H.; Grams, M.E. Chronic Kidney Disease Diagnosis and Management: A Review. JAMA 2019, 322, 1294–1304. [Google Scholar] [CrossRef]
- Vanholder, R.; Pletinck, A.; Schepers, E.; Glorieux, G. Biochemical and clinical impact of organic uremic retention solutes: A comprehensive update. Toxins 2018, 10, 33. [Google Scholar] [CrossRef] [PubMed]
- Duranton, F.; Cohen, G.; De Smet, R.; Rodriguez, M.; Jankowski, J.; Vanholder, R.; Argiles, A. Normal and pathologic concentrations of uremic toxins. J. Am. Soc. Nephrol. 2012, 23, 1258–1270. [Google Scholar] [CrossRef] [PubMed]
- Fernandes, S.R.; Meireles, A.N.; Marques, S.S.; Silva, L.; Barreiros, L.; Sampaio-Maia, B.; Miró, M.; Segundo, M.A. Sample preparation and chromatographic methods for the determination of protein-bound uremic retention solutes in human biological samples: An overview. J. Chromatogr. B Analyt Technol. Biomed. Life Sci. 2023, 1215, 123578. [Google Scholar] [CrossRef]
- The European Uremic Toxins (EUTox) Database. Available online: www.uremic-toxins.org (accessed on 15 March 2024).
- Reis, T.; Hutchison, C.; de Assis Rocha Neves, F.; Zawadzki, B.; Zanella, M.; Ronco, C.; Rosner, M.H. Rationale for a New Classification of Solutes of Interest in Chronic Kidney Disease and Hemodialysis. Blood Purif. 2023, 52, 242–254. [Google Scholar] [CrossRef] [PubMed]
- Graboski, A.L.; Redinbo, M.R. Gut-Derived Protein-Bound Uremic Toxins. Toxins 2020, 12, 590. [Google Scholar] [CrossRef] [PubMed]
- Daneshamouz, S.; Eduok, U.; Abdelrasoul, A.; Shoker, A. Protein-bound uremic toxins (PBUTs) in chronic kidney disease (CKD) patients: Production pathway, challenges and recent advances in renal PBUTs clearance. NanoImpact 2021, 21, 100299. [Google Scholar] [CrossRef] [PubMed]
- Rosner, M.H.; Reis, T.; Husain-Syed, F.; Vanholder, R.; Hutchison, C.; Stenvinkel, P.; Blankestijn, P.J.; Cozzolino, M.; Juillard, L.; Kashani, K.; et al. Classification of Uremic Toxins and Their Role in Kidney Failure. Clin. J. Am. Soc. Nephrol. 2021, 16, 1918–1928. [Google Scholar] [CrossRef] [PubMed]
- Niwa, T. Overview of Uremic Toxins. In Uremic Toxins and Organ Failure; Saito, H., Abe, T., Eds.; Springer: Singapore, 2020; pp. 1–15. [Google Scholar] [CrossRef]
- Di Paola, R.; De, A.; Izhar, R.; Abate, M.; Zappavigna, S.; Capasso, A.; Perna, A.F.; La Russa, A.; Capasso, G.; Caraglia, M.; et al. Possible Effects of Uremic Toxins p-Cresol, Indoxyl Sulfate, p-Cresyl Sulfate on the Development and Progression of Colon Cancer in Patients with Chronic Renal Failure. Genes 2023, 14, 1257. [Google Scholar] [CrossRef] [PubMed]
- Lu, C.; Wu, L.; Tang, M.Y.; Liu, Y.F.; Liu, L.; Liu, X.Y.; Zhang, C.; Huang, L. Indoxyl sulfate in atherosclerosis. Toxicol. Lett. 2023, 383, 204–212. [Google Scholar] [CrossRef] [PubMed]
- Gryp, T.; Vanholder, R.; Vaneechoutte, M.; Glorieux, G. p-Cresyl sulfate. Toxins 2017, 9, 52. [Google Scholar] [CrossRef] [PubMed]
- Prokopienko, A.J.; Nolin, T.D. Microbiota-derived uremic retention solutes: Perpetrators of altered nonrenal drug clearance in kidney disease. Expert. Rev. Clin. Pharmacol. 2018, 11, 71–82. [Google Scholar] [CrossRef] [PubMed]
- Leong, S.C.; Sirich, T.L. Indoxyl Sulfate-Review of Toxicity and Therapeutic Strategies. Toxins 2016, 8, 358. [Google Scholar] [CrossRef] [PubMed]
- Falconi, C.A.; Junho, C.; Fogaça-Ruiz, F.; Vernier, I.C.S.; da Cunha, R.S.; Stinghen, A.E.M.; Carneiro-Ramos, M.S. Uremic Toxins: An Alarming Danger Concerning the Cardiovascular System. Front. Physiol. 2021, 12, 686249. [Google Scholar] [CrossRef] [PubMed]
- Stockler-Pinto, M.B.; Fouque, D.; Soulage, C.O.; Croze, M.; Mafra, D. Indoxyl sulfate and p-cresyl sulfate in chronic kidney disease. Could these toxins modulate the antioxidant Nrf2-Keap1 pathway? J. Ren. Nutr. 2014, 24, 286–291. [Google Scholar] [CrossRef]
- Magnani, S.; Atti, M. Uremic Toxins and Blood Purification: A Review of Current Evidence and Future Perspectives. Toxins 2021, 13, 246. [Google Scholar] [CrossRef]
- Rong, Y.; Kiang, T.K.L. Characterization of human sulfotransferases catalyzing the formation of p-cresol sulfate and identification of mefenamic acid as a potent metabolism inhibitor and potential therapeutic agent for detoxification. Toxicol. Appl. Pharmacol. 2021, 425, 115553. [Google Scholar] [CrossRef] [PubMed]
- Deltombe, O.; Van Biesen, W.; Glorieux, G.; Massy, Z.; Dhondt, A.; Eloot, S. Exploring Protein Binding of Uremic Toxins in Patients with Different Stages of Chronic Kidney Disease and during Hemodialysis. Toxins 2015, 7, 3933–3946. [Google Scholar] [CrossRef] [PubMed]
- Suchy-Dicey, A.M.; Laha, T.; Hoofnagle, A.; Newitt, R.; Sirich, T.L.; Meyer, T.W.; Thummel, K.E.; Yanez, N.D.; Himmelfarb, J.; Weiss, N.S.; et al. Tubular Secretion in CKD. J. Am. Soc. Nephrol. 2016, 27, 2148–2155. [Google Scholar] [CrossRef]
- Wakabayashi, I.; Marumo, M. Evidence for Indoxyl Sulfate as an Inducer of Oxidative Stress in Patients with Diabetes. Vivo 2022, 36, 1790–1794. [Google Scholar] [CrossRef] [PubMed]
- Tan, X.; Zou, J.; Xiang, F.; Zhang, P.; Shen, B.; Wang, Y.; Ding, X.; Cao, X. p-Cresyl Sulfate Predicts Ischemic Stroke among Patients on Hemodialysis: A Prospective Cohort Study. Dis. Markers 2022, 2022, 1358419. [Google Scholar] [CrossRef]
- Pretorius, C.J.; McWhinney, B.C.; Sipinkoski, B.; Johnson, L.A.; Rossi, M.; Campbell, K.L.; Ungerer, J.P. Reference ranges and biological variation of free and total serum indoxyl- and p-cresyl sulphate measured with a rapid UPLC fluorescence detection method. Clin. Chim. Acta 2013, 419, 122–126. [Google Scholar] [CrossRef] [PubMed]
- Lin, C.N.; Wu, I.W.; Huang, Y.F.; Peng, S.Y.; Huang, Y.C.; Ning, H.C. Measuring serum total and free indoxyl sulfate and p-cresyl sulfate in chronic kidney disease using UPLC-MS/MS. J. Food Drug Anal. 2019, 27, 502–509. [Google Scholar] [CrossRef] [PubMed]
- Duan, S.; Pi, J.; Wang, C.H.; Hou, Y.C.; Andy Lee, C.Y.; Lin, C.J.; Shi, L.; Young, K.C.; Sun, H.Y. Assessment of ELISA-based method for the routine examination of serum indoxyl sulfate in patients with chronic kidney disease. Heliyon 2022, 8, e12220. [Google Scholar] [CrossRef] [PubMed]
- Fabresse, N.; Uteem, I.; Lamy, E.; Massy, Z.; Larabi, I.A.; Alvarez, J.C. Quantification of free and protein bound uremic toxins in human serum by LC-MS/MS: Comparison of rapid equilibrium dialysis and ultrafiltration. Clin. Chim. Acta 2020, 507, 228–235. [Google Scholar] [CrossRef]
- Zhu, W.; Stevens, A.P.; Dettmer, K.; Gottfried, E.; Hoves, S.; Kreutz, M.; Holler, E.; Canelas, A.B.; Kema, I.; Oefner, P.J. Quantitative profiling of tryptophan metabolites in serum, urine, and cell culture supernatants by liquid chromatography-tandem mass spectrometry. Anal. Bioanal. Chem. 2011, 401, 3249–3261. [Google Scholar] [CrossRef]
- Heaney, L.M. Applying mass spectrometry-based assays to explore gut microbial metabolism and associations with disease. Clin. Chem. Lab. Med. 2020, 58, 719–732. [Google Scholar] [CrossRef] [PubMed]
- Niwa, T. Recent progress in the analysis of uremic toxins by mass spectrometry. J. Chromatogr. B Analyt Technol. Biomed. Life Sci. 2009, 877, 2600–2606. [Google Scholar] [CrossRef] [PubMed]
- Niwa, T. Update of uremic toxin research by mass spectrometry. Mass. Spectrom. Rev. 2011, 30, 510–521. [Google Scholar] [CrossRef] [PubMed]
- U.S. Food and Drug Administration. Bioanalytical Method Validation, Guidance for Industry; FD Administration: Washington, DC, USA, 2018.
- Shu, C.; Chen, X.; Xia, T.; Zhang, F.; Gao, S.; Chen, W. LC-MS/MS method for simultaneous determination of serum p-cresyl sulfate and indoxyl sulfate in patients undergoing peritoneal dialysis. Biomed. Chromatogr. 2016, 30, 1782–1788. [Google Scholar] [CrossRef] [PubMed]
- Cuoghi, A.; Caiazzo, M.; Bellei, E.; Monari, E.; Bergamini, S.; Palladino, G.; Ozben, T.; Tomasi, A. Quantification of p-cresol sulphate in human plasma by selected reaction monitoring. Anal. Bioanal. Chem. 2012, 404, 2097–2104. [Google Scholar] [CrossRef] [PubMed]
- Ahmed, S.; Sparidans, R.W.; Lu, J.; Mihaila, S.M.; Gerritsen, K.G.F.; Masereeuw, R. A robust, accurate, sensitive LC-MS/MS method to measure indoxyl sulfate, validated for plasma and kidney cells. Biomed. Chromatogr. 2022, 36, e5307. [Google Scholar] [CrossRef] [PubMed]
- Boelaert, J.; Lynen, F.; Glorieux, G.; Eloot, S.; Van Landschoot, M.; Waterloos, M.A.; Sandra, P.; Vanholder, R. A novel UPLC-MS-MS method for simultaneous determination of seven uremic retention toxins with cardiovascular relevance in chronic kidney disease patients. Anal. Bioanal. Chem. 2013, 405, 1937–1947. [Google Scholar] [CrossRef] [PubMed]
- Armbruster, D.A.; Tillman, M.D.; Hubbs, L.M. Limit of detection (LQD)/limit of quantitation (LOQ): Comparison of the empirical and the statistical methods exemplified with GC-MS assays of abused drugs. Clin. Chem. 1994, 40 Pt 1, 1233–1238. [Google Scholar] [CrossRef] [PubMed]
- de Loor, H.; Poesen, R.; De Leger, W.; Dehaen, W.; Augustijns, P.; Evenepoel, P.; Meijers, B. A liquid chromatography—Tandem mass spectrometry method to measure a selected panel of uremic retention solutes derived from endogenous and colonic microbial metabolism. Anal. Chim. Acta 2016, 936, 149–156. [Google Scholar] [CrossRef]
- Zhang, A.; Rijal, K.; Ng, S.K.; Ravid, K.; Chitalia, V. A mass spectrometric method for quantification of tryptophan-derived uremic solutes in human serum. J. Biol. Methods 2017, 4, e75. [Google Scholar] [CrossRef]
- Prokopienko, A.J.; West, R.E., 3rd; Stubbs, J.R.; Nolin, T.D. Development and validation of a UHPLC-MS/MS method for measurement of a gut-derived uremic toxin panel in human serum: An application in patients with kidney disease. J. Pharm. Biomed. Anal. 2019, 174, 618–624. [Google Scholar] [CrossRef] [PubMed]
- André, C.; Bennis, Y.; Titeca-Beauport, D.; Caillard, P.; Cluet, Y.; Kamel, S.; Choukroun, G.; Maizel, J.; Liabeuf, S.; Bodeau, S. Two rapid, accurate liquid chromatography tandem mass spectrometry methods for the quantification of seven uremic toxins: An application for describing their accumulation kinetic profile in a context of acute kidney injury. J. Chromatogr. B Analyt Technol. Biomed. Life Sci. 2020, 1152, 122234. [Google Scholar] [CrossRef] [PubMed]
- Ma, Y.R.; Xin, M.Y.; Li, K.; Wang, H.; Rao, Z.; Liu, T.X.; Wu, X.A. An LC-MS/MS analytical method for the determination of uremic toxins in patients with end-stage renal disease. J. Pharm. Biomed. Anal. 2020, 191, 113551. [Google Scholar] [CrossRef] [PubMed]
- Wang, Z.; Jiang, H.; Chen, X.; Song, X.; Xu, F.; Chen, F.; Mao, Z.; Gao, S.; Chen, W. A rapid and sensitive method for simultaneous determination of eight protein-bound uremic toxins in human serum by UHPLC-MS/MS: Application in assessing peritoneal dialysis. J. Pharm. Biomed. Anal. 2020, 186, 113312. [Google Scholar] [CrossRef] [PubMed]
- Gürdeniz, G.; Kristensen, M.; Skov, T.; Dragsted, L.O. The Effect of LC-MS Data Preprocessing Methods on the Selection of Plasma Biomarkers in Fed vs. Fasted Rats. Metabolites 2012, 2, 77–99. [Google Scholar] [CrossRef] [PubMed]
- Monošík, R.; Dragsted, L.O. A versatile UHPLC-MSMS method for simultaneous quantification of various alcohol intake related compounds in human urine and blood. Anal. Methods 2016, 8, 6865–6871. [Google Scholar] [CrossRef]
- Kanemitsu, Y.; Asaji, K.; Matsumoto, Y.; Tsukamoto, H.; Saigusa, D.; Mukawa, C.; Tachikawa, T.; Abe, T.; Tomioka, Y. Simultaneous quantitative analysis of uremic toxins by LC-MS/MS with a reversed-phase/cation-exchange/anion-exchange tri-modal mixed-mode column. J. Chromatogr. B Analyt Technol. Biomed. Life Sci. 2017, 1068–1069, 1–8. [Google Scholar] [CrossRef] [PubMed]
- Oda, A.; Suzuki, Y.; Sato, B.; Sato, H.; Tanaka, R.; Ono, H.; Ando, T.; Shin, T.; Mimata, H.; Itoh, H.; et al. Highly sensitive simultaneous quantification of indoxyl sulfate and 3-carboxy-4-methyl-5-propyl-2-furanpropanoic acid in human plasma using ultra-high-performance liquid chromatography coupled with tandem mass spectrometry. J. Sep. Sci. 2022, 45, 1672–1682. [Google Scholar] [CrossRef] [PubMed]
- Ragi, N.; Pallerla, P.; Babi Reddy Gari, A.R.; Lingampelly, S.S.; Ketavarapu, V.; Addipilli, R.; Chirra, N.; Kantevari, S.; Yadla, M.; Sripadi, P. Assessment of uremic toxins in advanced chronic kidney disease patients on maintenance hemodialysis by LC-ESI-MS/MS. Metabolomics 2023, 19, 14. [Google Scholar] [CrossRef]
- Choi, J.M.; Park, W.S.; Song, K.Y.; Lee, H.J.; Jung, B.H. Development of simultaneous analysis of tryptophan metabolites in serum and gastric juice—An investigation towards establishing a biomarker test for gastric cancer diagnosis. Biomed. Chromatogr. 2016, 30, 1963–1974. [Google Scholar] [CrossRef]
- Wijeyesekera, A.; Clarke, P.A.; Bictash, M.; Brown, I.J.; Fidock, M.; Ryckmans, T.; Yap, I.K.; Chan, Q.; Stamler, J.; Elliott, P.; et al. Quantitative UPLC-MS/MS analysis of the gut microbial co-metabolites phenylacetylglutamine, 4-cresyl sulphate and ippurate in human urine: INTERMAP Study. Anal. Methods 2012, 4, 65–72. [Google Scholar] [CrossRef] [PubMed]
- Olesova, D.; Galba, J.; Piestansky, J.; Celusakova, H.; Repiska, G.; Babinska, K.; Ostatnikova, D.; Katina, S.; Kovac, A. A Novel UHPLC-MS Method Targeting Urinary Metabolomic Markers for Autism Spectrum Disorder. Metabolites 2020, 10, 443. [Google Scholar] [CrossRef] [PubMed]
- Giebułtowicz, J.; Korytowska, N.; Sankowski, B.; Wroczyński, P. Development and validation of a LC-MS/MS method for quantitative analysis of uraemic toxins p-cresol sulphate and indoxyl sulphate in saliva. Talanta 2016, 150, 593–598. [Google Scholar] [CrossRef] [PubMed]
- Fabresse, N.; Larabi, I.A.; Abe, E.; Lamy, E.; Rigothier, C.; Massy, Z.A.; Alvarez, J.C. Correlation between Saliva Levels and Serum Levels of Free Uremic Toxins in Healthy Volunteers. Toxins 2023, 15, 150. [Google Scholar] [CrossRef]
- Nam, M.; Jo, S.R.; Park, J.H.; Kim, M.S. Evaluation of critical factors in the preparation of saliva sample from healthy subjects for metabolomics. J. Pharm. Biomed. Anal. 2023, 223, 115145. [Google Scholar] [CrossRef] [PubMed]
- Tsuzuki, S.; Wales, D. Intermolecular forces and clusters I. Struct. Bond. 2005, 115, 149. [Google Scholar]
- van der Lubbe, S.C.C.; Fonseca Guerra, C. The Nature of Hydrogen Bonds: A Delineation of the Role of Different Energy Components on Hydrogen Bond Strengths and Lengths. Chem. Asian J. 2019, 14, 2760–2769. [Google Scholar] [CrossRef] [PubMed]
- Eloot, S.; Schneditz, D.; Cornelis, T.; Van Biesen, W.; Glorieux, G.; Dhondt, A.; Kooman, J.; Vanholder, R. Protein-Bound Uremic Toxin Profiling as a Tool to Optimize Hemodialysis. PLoS ONE 2016, 11, e0147159. [Google Scholar] [CrossRef] [PubMed]
- PubChem. Indoxyl Sulfate. Available online: https://pubchem.ncbi.nlm.nih.gov/compound/Indoxyl-sulfate (accessed on 15 March 2024).
- PubChem. p-Cresol Sulfate. Available online: https://pubchem.ncbi.nlm.nih.gov/compound/4615423 (accessed on 15 March 2024).
- PubChem. Ammonium Acetate. Available online: https://pubchem.ncbi.nlm.nih.gov/compound/Ammonium-acetate (accessed on 15 March 2024).
- Huang, S.T.; Shu, K.H.; Cheng, C.H.; Wu, M.J.; Yu, T.M.; Chuang, Y.W.; Chen, C.H. Serum total p-cresol and indoxyl sulfate correlated with stage of chronic kidney disease in renal transplant recipients. Transplant. Proc. 2012, 44, 621–624. [Google Scholar] [CrossRef]
- Korytowska, N.; Wyczałkowska-Tomasik, A.; Pączek, L.; Giebułtowicz, J. Evaluation of Salivary Indoxyl Sulfate with Proteinuria for Predicting Graft Deterioration in Kidney Transplant Recipients. Toxins 2021, 13, 571. [Google Scholar] [CrossRef]
- Celec, P.; Tóthová, Ľ.; Šebeková, K.; Podracká, Ľ.; Boor, P. Salivary markers of kidney function—Potentials and limitations. Clin. Chim. Acta 2016, 453, 28–37. [Google Scholar] [CrossRef] [PubMed]
- Kiang, T.K.L.; Ranamukhaarachchi, S.A.; Ensom, M.H.H. Revolutionizing Therapeutic Drug Monitoring with the Use of Interstitial Fluid and Microneedles Technology. Pharmaceutics 2017, 9, 43. [Google Scholar] [CrossRef] [PubMed]
- SHIMADZU Excellence in Science. Interfaces for LC-MS. Available online: https://www.shimadzu.com/an/service-support/technical-support/analysis-basics/basics_of_lcms/interfaces_for_lcms.html (accessed on 15 March 2024).
- Shimadzu. Introduction to LC-MS Part4. Available online: https://www.shimadzu.com/an/service-support/technical-support/analysis-basics/lcms-intro/57intro.html#:~:text=M%20%2B%20BH%2B%20%E2%86%92MH%2B%20%2B%20B%20The%20positive,compounds%20with%20carboxyl%20groups%20or%20phenolic%20hydroxyl%20groups. (accessed on 15 March 2024).
- FDA. Bioanalytical Method Validation Guidance for Industry. 2018. Available online: https://www.fda.gov/regulatory-information/search-fda-guidance-documents/bioanalytical-method-validation-guidance-industry (accessed on 15 March 2024).
- EMA. Guideline on Bioanalytical Method Validation. 2011. Available online: https://www.ema.europa.eu/en/bioanalytical-method-validation-scientific-guideline (accessed on 15 March 2024).
- Kaza, M.; Karaźniewicz-Łada, M.; Kosicka, K.; Siemiątkowska, A.; Rudzki, P.J. Bioanalytical method validation: New FDA guidance vs. EMA guideline. Better or worse? J. Pharm. Biomed. Anal. 2019, 165, 381–385. [Google Scholar] [CrossRef] [PubMed]
- Jongers, B.; Hotterbeekx, A.; Bielen, K.; Vervliet, P.; Boddaert, J.; Lammens, C.; Fransen, E.; Baggerman, G.; Covaci, A.; Goossens, H.; et al. Identification of Potential Urinary Metabolite Biomarkers of Pseudomonas aeruginosa Ventilator-Associated Pneumonia. Biomark. Insights 2022, 17, 11772719221099131. [Google Scholar] [CrossRef] [PubMed]
- Hobson, S.; de Loor, H.; Kublickiene, K.; Beige, J.; Evenepoel, P.; Stenvinkel, P.; Ebert, T. Lipid Profile Is Negatively Associated with Uremic Toxins in Patients with Kidney Failure-A Tri-National Cohort. Toxins 2022, 14, 412. [Google Scholar] [CrossRef]
- Te Linde, E.; van Roij, C.J.M.; Meijers, B.K.I.; De Loor, H.; Kessels, R.P.C.; Wetzels, J.F.M. Cognitive Function and Uremic Toxins after Kidney Transplantation: An Exploratory Study. Kidney360 2020, 1, 1398–1406. [Google Scholar] [CrossRef] [PubMed]
- Biruete, A.; Cross, T.L.; Allen, J.M.; Kistler, B.M.; de Loor, H.; Evenepoel, P.; Fahey, G.C., Jr.; Bauer, L.; Swanson, K.S.; Wilund, K.R. Effect of Dietary Inulin Supplementation on the Gut Microbiota Composition and Derived Metabolites of Individuals Undergoing Hemodialysis: A Pilot Study. J. Ren. Nutr. 2021, 31, 512–522. [Google Scholar] [CrossRef]
- Vandenbosch, I.; Dejongh, S.; Claes, K.; Bammens, B.; De Vusser, K.; Van Craenenbroeck, A.; Kuypers, D.; Evenepoel, P.; Meijers, B. Strategies for asymmetrical triacetate dialyser heparin-free effective haemodialysis: The SAFE study. Clin. Kidney J. 2021, 14, 1901–1907. [Google Scholar] [CrossRef]
- Nazzal, L.; Soiefer, L.; Chang, M.; Tamizuddin, F.; Schatoff, D.; Cofer, L.; Aguero-Rosenfeld, M.E.; Matalon, A.; Meijers, B.; Holzman, R.; et al. Effect of Vancomycin on the Gut Microbiome and Plasma Concentrations of Gut-Derived Uremic Solutes. Kidney Int. Rep. 2021, 6, 2122–2133. [Google Scholar] [CrossRef]
- Dai, L.; Meijers, B.K.; Bammens, B.; de Loor, H.; Schurgers, L.J.; Qureshi, A.R.; Stenvinkel, P.; Evenepoel, P. Sevelamer Use in End-Stage Kidney Disease (ESKD) Patients Associates with Poor Vitamin K Status and High Levels of Gut-Derived Uremic Toxins: A Drug-Bug Interaction? Toxins 2020, 12, 351. [Google Scholar] [CrossRef]
- Etinger, A.; Kumar, S.R.; Ackley, W.; Soiefer, L.; Chun, J.; Singh, P.; Grossman, E.; Matalon, A.; Holzman, R.S.; Meijers, B.; et al. The effect of isohydric hemodialysis on the binding and removal of uremic retention solutes. PLoS ONE 2018, 13, e0192770. [Google Scholar] [CrossRef] [PubMed]
- Deltombe, O.; de Loor, H.; Glorieux, G.; Dhondt, A.; Van Biesen, W.; Meijers, B.; Eloot, S. Exploring binding characteristics and the related competition of different protein-bound uremic toxins. Biochimie 2017, 139, 20–26. [Google Scholar] [CrossRef] [PubMed]
- Keddar, M.; Muylle, T.; Carrie, E.; Trefois, P.; Nachit, M.; Crott, R.; Christiaens, C.; Bammens, B.; Jadoul, M.; Goffin, E.; et al. Non-invasive Quantification of Fat Deposits in Skeletal Muscle Predicts Cardiovascular Outcome in Kidney Failure. Front. Physiol. 2020, 11, 130. [Google Scholar] [CrossRef] [PubMed]
- Chen, X.; Gao, S.; Ruan, M.; Chen, S.; Xu, J.; Xing, X.; Pan, X.; Mei, C.; Mao, Z. Shen-Shuai-Ning granule decreased serum concentrations of indoxyl sulphate in uremic patients undergoing peritoneal dialysis. Biosci. Rep. 2018, 38, BSR2017164. [Google Scholar] [CrossRef] [PubMed]
- Wang, S.C.; Lai, Y.H.; Liu, C.H.; Wang, C.H.; Hsu, B.G.; Tsai, J.P. Association between serum indoxyl sulfate levels with carotid-femoral pulse wave velocity in patients with chronic kidney disease. Ren. Fail. 2021, 43, 796–802. [Google Scholar] [CrossRef] [PubMed]
- Kolachalama, V.B.; Shashar, M.; Alousi, F.; Shivanna, S.; Rijal, K.; Belghasem, M.E.; Walker, J.; Matsuura, S.; Chang, G.H.; Gibson, C.M.; et al. Uremic Solute-Aryl Hydrocarbon Receptor-Tissue Factor Axis Associates with Thrombosis after Vascular Injury in Humans. J. Am. Soc. Nephrol. 2018, 29, 1063–1072. [Google Scholar] [CrossRef] [PubMed]
- Lai, Y.R.; Cheng, B.C.; Lin, C.N.; Chiu, W.C.; Lin, T.Y.; Chiang, H.C.; Kuo, C.A.; Huang, C.C.; Lu, C.H. The Effects of Indoxyl Sulfate and Oxidative Stress on the Severity of Peripheral Nerve Dysfunction in Patients with Chronic Kidney Diseases. Antioxidants 2022, 11, 2350. [Google Scholar] [CrossRef] [PubMed]
- Wu, I.W.; Lee, C.C.; Hsu, H.J.; Sun, C.Y.; Chen, Y.C.; Yang, K.J.; Yang, C.W.; Chung, W.H.; Lai, H.C.; Chang, L.C.; et al. Compositional and Functional Adaptations of Intestinal Microbiota and Related Metabolites in CKD Patients Receiving Dietary Protein Restriction. Nutrients 2020, 12, 2799. [Google Scholar] [CrossRef] [PubMed]
- Wu, I.W.; Lin, C.Y.; Chang, L.C.; Lee, C.C.; Chiu, C.Y.; Hsu, H.J.; Sun, C.Y.; Chen, Y.C.; Kuo, Y.L.; Yang, C.W.; et al. Gut Microbiota as Diagnostic Tools for Mirroring Disease Progression and Circulating Nephrotoxin Levels in Chronic Kidney Disease: Discovery and Validation Study. Int. J. Biol. Sci. 2020, 16, 420–434. [Google Scholar] [CrossRef]
- Cheng, B.C.; Lai, Y.R.; Huang, C.C.; Lu, C.H. Improved cardiovascular autonomic function and decreased protein-bound uremic toxins in patients with end-stage renal disease after peritoneal dialysis. J. Int. Med. Res. 2020, 48, 300060520933797. [Google Scholar] [CrossRef]
- Hsu, C.K.; Su, S.C.; Chang, L.C.; Yang, K.J.; Lee, C.C.; Hsu, H.J.; Chen, Y.T.; Sun, C.Y.; Wu, I.W. Oral Absorbent AST-120 Is Associated with Compositional and Functional Adaptations of Gut Microbiota and Modification of Serum Short and Medium-Chain Fatty Acids in Advanced CKD Patients. Biomedicines 2022, 10, 2234. [Google Scholar] [CrossRef] [PubMed]
- André, C.; Mernissi, T.; Choukroun, G.; Bennis, Y.; Kamel, S.; Liabeuf, S.; Bodeau, S. The Prescription of Drugs That Inhibit Organic Anion Transporters 1 or 3 Is Associated with the Plasma Accumulation of Uremic Toxins in Kidney Transplant Recipients. Toxins 2021, 14, 15. [Google Scholar] [CrossRef] [PubMed]
- André, C.; Choukroun, G.; Bennis, Y.; Kamel, S.; Lemaire-Hurtel, A.S.; Masmoudi, K.; Bodeau, S.; Liabeuf, S. Potential interactions between uraemic toxins and drugs: An application in kidney transplant recipients treated with calcineurin inhibitors. Nephrol. Dial. Transplant. 2022, 37, 2284–2292. [Google Scholar] [CrossRef] [PubMed]
- Batteux, B.; Bodeau, S.; André, C.; Hurtel-Lemaire, A.S.; Gras-Champel, V.; Desailly-Henry, I.; Masmoudi, K.; Bennis, Y.; Massy, Z.A.; Kamel, S.; et al. Association between Uremic Toxin Concentrations and Bone Mineral Density after Kidney Transplantation. Toxins 2020, 12, 715. [Google Scholar] [CrossRef] [PubMed]
- El Chamieh, C.; Larabi, I.A.; Laville, S.M.; Jacquelinet, C.; Combe, C.; Fouque, D.; Laville, M.; Frimat, L.; Pecoits-Filho, R.; Lange, C.; et al. Proton-Pump Inhibitors and Serum Concentrations of Uremic Toxins in Patients with Chronic Kidney Disease. Toxins 2023, 15, 276. [Google Scholar] [CrossRef] [PubMed]
- Massy, Z.A.; Chesnaye, N.C.; Larabi, I.A.; Dekker, F.W.; Evans, M.; Caskey, F.J.; Torino, C.; Porto, G.; Szymczak, M.; Drechsler, C.; et al. The relationship between uremic toxins and symptoms in older men and women with advanced chronic kidney disease. Clin. Kidney J. 2022, 15, 798–807. [Google Scholar] [CrossRef] [PubMed]
- Kuo, S.Z.; Dettmer, K.; Annavajhala, M.K.; Chong, D.H.; Uhlemann, A.C.; Abrams, J.A.; Oefner, P.J.; Freedberg, D.E. Associations between urinary 3-indoxyl sulfate, a gut microbiome-derived biomarker, and patient outcomes after intensive care unit admission. J. Crit. Care 2021, 63, 15–21. [Google Scholar] [CrossRef]
- Korytowska, N.; Sankowski, B.; Wyczałkowska-Tomasik, A.; Pączek, L.; Wroczyński, P.; Giebułtowicz, J. The utility of saliva testing in the estimation of uremic toxin levels in serum. Clin. Chem. Lab. Med. 2018, 57, 230–237. [Google Scholar] [CrossRef]
- Alaini, A.; Malhotra, D.; Rondon-Berrios, H.; Argyropoulos, C.P.; Khitan, Z.J.; Raj, D.S.C.; Rohrscheib, M.; Shapiro, J.I.; Tzamaloukas, A.H. Establishing the presence or absence of chronic kidney disease: Uses and limitations of formulas estimating the glomerular filtration rate. World J. Methodol. 2017, 7, 73–92. [Google Scholar] [CrossRef]
- Yu, M.; Kim, Y.J.; Kang, D.H. Indoxyl sulfate-induced endothelial dysfunction in patients with chronic kidney disease via an induction of oxidative stress. Clin. J. Am. Soc. Nephrol. 2011, 6, 30–39. [Google Scholar] [CrossRef]
- Dou, L.; Jourde-Chiche, N.; Faure, V.; Cerini, C.; Berland, Y.; Dignat-George, F.; Brunet, P. The uremic solute indoxyl sulfate induces oxidative stress in endothelial cells. J. Thromb. Haemost. 2007, 5, 1302–1308. [Google Scholar] [CrossRef] [PubMed]
- Schepers, E.; Meert, N.; Glorieux, G.; Goeman, J.; Van der Eycken, J.; Vanholder, R. P-cresylsulphate, the main in vivo metabolite of p-cresol, activates leucocyte free radical production. Nephrol. Dial. Transplant. 2007, 22, 592–596. [Google Scholar] [CrossRef] [PubMed]
- Watanabe, H.; Miyamoto, Y.; Honda, D.; Tanaka, H.; Wu, Q.; Endo, M.; Noguchi, T.; Kadowaki, D.; Ishima, Y.; Kotani, S.; et al. p-Cresyl sulfate causes renal tubular cell damage by inducing oxidative stress by activation of NADPH oxidase. Kidney Int. 2013, 83, 582–592. [Google Scholar] [CrossRef] [PubMed]
- Sun, C.Y.; Hsu, H.H.; Wu, M.S. p-Cresol sulfate and indoxyl sulfate induce similar cellular inflammatory gene expressions in cultured proximal renal tubular cells. Nephrol. Dial. Transplant. 2013, 28, 70–78. [Google Scholar] [CrossRef]
- Miyazaki, T.; Ise, M.; Seo, H.; Niwa, T. Indoxyl sulfate increases the gene expressions of TGF-beta 1, TIMP-1 and pro-alpha 1(I) collagen in uremic rat kidneys. Kidney Int. Suppl. 1997, 62, S15–S22. [Google Scholar] [PubMed]
- Gelasco, A.K.; Raymond, J.R. Indoxyl sulfate induces complex redox alterations in mesangial cells. Am. J. Physiol. Renal Physiol. 2006, 290, F1551–F1558. [Google Scholar] [CrossRef]
- Sun, C.Y.; Chang, S.C.; Wu, M.S. Uremic toxins induce kidney fibrosis by activating intrarenal renin-angiotensin-aldosterone system associated epithelial-to-mesenchymal transition. PLoS ONE 2012, 7, e34026. [Google Scholar] [CrossRef] [PubMed]
- Mutsaers, H.A.; Caetano-Pinto, P.; Seegers, A.E.; Dankers, A.C.; van den Broek, P.H.; Wetzels, J.F.; van den Brand, J.A.; van den Heuvel, L.P.; Hoenderop, J.G.; Wilmer, M.J.; et al. Proximal tubular efflux transporters involved in renal excretion of p-cresyl sulfate and p-cresyl glucuronide: Implications for chronic kidney disease pathophysiology. Toxicol. Vitro 2015, 29, 1868–1877. [Google Scholar] [CrossRef] [PubMed]
- Cao, L. Indoxyl sulfate stimulates oxidized LDL uptake through up-regulation of CD36 expression in THP-1 macrophages. J. Appl. Biomed. 2014, 12, 203–209. [Google Scholar] [CrossRef]
- Yamamoto, H.; Tsuruoka, S.; Ioka, T.; Ando, H.; Ito, C.; Akimoto, T.; Fujimura, A.; Asano, Y.; Kusano, E. Indoxyl sulfate stimulates proliferation of rat vascular smooth muscle cells. Kidney Int. 2006, 69, 1780–1785. [Google Scholar] [CrossRef]
- Muteliefu, G.; Enomoto, A.; Niwa, T. Indoxyl sulfate promotes proliferation of human aortic smooth muscle cells by inducing oxidative stress. J. Ren. Nutr. 2009, 19, 29–32. [Google Scholar] [CrossRef] [PubMed]
- Adijiang, A.; Goto, S.; Uramoto, S.; Nishijima, F.; Niwa, T. Indoxyl sulphate promotes aortic calcification with expression of osteoblast-specific proteins in hypertensive rats. Nephrol. Dial. Transplant. 2008, 23, 1892–1901. [Google Scholar] [CrossRef] [PubMed]
- Gross, P.; Massy, Z.A.; Henaut, L.; Boudot, C.; Cagnard, J.; March, C.; Kamel, S.; Drueke, T.B.; Six, I. Para-cresyl sulfate acutely impairs vascular reactivity and induces vascular remodeling. J. Cell Physiol. 2015, 230, 2927–2935. [Google Scholar] [CrossRef] [PubMed]
- Arnold, R.; Issar, T.; Krishnan, A.V.; Pussell, B.A. Neurological complications in chronic kidney disease. JRSM Cardiovasc. Dis. 2016, 5, 2048004016677687. [Google Scholar] [CrossRef] [PubMed]
- Mambelli, E.; Barrella, M.; Facchini, M.G.; Mancini, E.; Sicuso, C.; Bainotti, S.; Formica, M.; Santoro, A. The prevalence of peripheral neuropathy in hemodialysis patients. Clin. Nephrol. 2012, 77, 468–475. [Google Scholar] [CrossRef] [PubMed]
- Liu, W.C.; Tomino, Y.; Lu, K.C. Impacts of Indoxyl Sulfate and p-Cresol Sulfate on Chronic Kidney Disease and Mitigating Effects of AST-120. Toxins 2018, 10, 367. [Google Scholar] [CrossRef] [PubMed]
- Schulman, G.; Berl, T.; Beck, G.J.; Remuzzi, G.; Ritz, E.; Shimizu, M.; Shobu, Y.; Kikuchi, M. The effects of AST-120 on chronic kidney disease progression in the United States of America: A post hoc subgroup analysis of randomized controlled trials. BMC Nephrol. 2016, 17, 141. [Google Scholar] [CrossRef] [PubMed]
- Cha, R.H.; Kang, S.W.; Park, C.W.; Cha, D.R.; Na, K.Y.; Kim, S.G.; Yoon, S.A.; Han, S.Y.; Chang, J.H.; Park, S.K.; et al. A Randomized, Controlled Trial of Oral Intestinal Sorbent AST-120 on Renal Function Deterioration in Patients with Advanced Renal Dysfunction. Clin. J. Am. Soc. Nephrol. 2016, 11, 559–567. [Google Scholar] [CrossRef] [PubMed]
- Akizawa, T.; Asano, Y.; Morita, S.; Wakita, T.; Onishi, Y.; Fukuhara, S.; Gejyo, F.; Matsuo, S.; Yorioka, N.; Kurokawa, K. Effect of a carbonaceous oral adsorbent on the progression of CKD: A multicenter, randomized, controlled trial. Am. J. Kidney Dis. 2009, 54, 459–467. [Google Scholar] [CrossRef] [PubMed]
- Asai, M.; Kumakura, S.; Kikuchi, M. Review of the efficacy of AST-120 (KREMEZIN®) on renal function in chronic kidney disease patients. Ren. Fail. 2019, 41, 47–56. [Google Scholar] [CrossRef]
- Biruete, A.; Hill Gallant, K.M.; Lindemann, S.R.; Wiese, G.N.; Chen, N.X.; Moe, S.M. Phosphate Binders and Nonphosphate Effects in the Gastrointestinal Tract. J. Ren. Nutr. 2020, 30, 4–10. [Google Scholar] [CrossRef] [PubMed]
- Yang, C.Y.; Tarng, D.C. Diet, gut microbiome and indoxyl sulphate in chronic kidney disease patients. Nephrology 2018, 23 (Suppl. 4), 16–20. [Google Scholar] [CrossRef] [PubMed]
- Takkavatakarn, K.; Wuttiputinun, T.; Phannajit, J.; Praditpornsilpa, K.; Eiam-Ong, S.; Susantitaphong, P. Protein-bound uremic toxin lowering strategies in chronic kidney disease: A systematic review and meta-analysis. J. Nephrol. 2021, 34, 1805–1817. [Google Scholar] [CrossRef] [PubMed]
- Rong, Y.; Colbourne, P.; Gourishankar, S.; Kiang, T.K.L. Significant correlations between p-cresol sulfate and mycophenolic acid plasma concentrations in adult kidney transplant recipients. Clin. Drug Investig. 2022, 42, 207–219. [Google Scholar] [CrossRef] [PubMed]
- Rong, Y.; Kiang, T.K.L. Mechanisms of Metabolism Interaction Between p-Cresol and Mycophenolic Acid. Toxicol. Sci. 2020, 173, 267–279. [Google Scholar] [CrossRef] [PubMed]
- Rong, Y.; Kiang, T.K.L. Development and validation of a sensitive liquid-chromatography tandem mass spectrometry assay for mycophenolic acid and metabolites in HepaRG cell culture: Characterization of metabolism interactions between p-cresol and mycophenolic acid. Biomed. Chromatogr. 2019, 33, e4549. [Google Scholar] [CrossRef] [PubMed]
- Gallant, J.; Wichart, J.; Kiang, T.K.L. Predictability of Capillary Blood Spot Toward Venous Whole Blood Sampling for Therapeutic Drug Monitoring of Tacrolimus in Solid Organ Transplant Recipients. Eur. J. Drug Metab. Pharmacokinet. 2019, 44, 729–741. [Google Scholar] [CrossRef] [PubMed]
- Cheng, W.; Kiang, T.K.; Bring, P.; Ensom, M.H. Predictive Performance of the Winter-Tozer and Derivative Equations for Estimating Free Phenytoin Concentration. Can. J. Hosp. Pharm. 2016, 69, 269–279. [Google Scholar] [CrossRef]
- Kiang, T.K.; Ensom, M.H. A Comprehensive Review on the Predictive Performance of the Sheiner-Tozer and Derivative Equations for the Correction of Phenytoin Concentrations. Ann. Pharmacother. 2016, 50, 311–325. [Google Scholar] [CrossRef]
- Samaey, A.; Vázquez-Castellanos, J.F.; Caenepeel, C.; Evenepoel, P.; Vermeire, S.; Raes, J.; Knops, N. Effects of fecal microbiota transplantation for recurrent Clostridium difficile infection in children on kidney replacement therapy: A pilot study. Pediatr. Nephrol. 2024, 39, 1201–1212. [Google Scholar] [CrossRef]
- Zou, X.; Xiong, L.; Guo, Z.; Li, Y.; Ning, K.; Liu, X.; Xie, Y.; Peng, Y.; Liu, Y.; Cai, X.; et al. Trimethylamine-N-oxide (TMAO) and predicted risk of cardiovascular events after partial nephrectomy. Asian J. Surg. 2024, 47, 281–288. [Google Scholar] [CrossRef] [PubMed]

| Analyte(s) | Liquid Chromatography Conditions | Mass Spectrometry Conditions | Validation Data | Citation |
|---|---|---|---|---|
| SERUM | ||||
| Indoxyl sulfate (IxS) p-Cresol sulfate (pCS) In addition to other analytes: 3-carboxy-4-methyl-5-propyl-2-furan propionate (CMPF), hippuric acid (HA), Indole acetic acid (IAA), p-Cresol glucuronide (pCG), Uric acid (UA) | Matrix: Human serum Internal standard(s): Isotope-labeled hippuric acid -d5 (HA-d5, 7.5 µg/mL): IxS Isotope-labeled indole-3-acetic acid-d5 (IAA-d5, 2.5 µg/mL): pCS Column: reversed phase Acquity UPLC BEH C18 column (1.7 μm, 100 mm × 2.1 mm) Acquity UPLC BEH C18 VanGuard pre-column (1.7 μm, 2.1 mm × 5 mm) Temperature(s): Column: 35 °C Autosampler: 8 °C Mobile phase: A: 0.1% acetic acid in methanol B: 0.1% acetic acid in 5 mM ammonium acetate (pH 4.3) Gradient: 0.0–2.0 min: 95 → 80% B 2.0–5.0 min: 80% B 5.0–6.5 min: 80 → 0% B 6.5–9.0 min: 0% B 9.0–15.0 min: re-equilibration Injection volume: 20 µL Flow rate: 0.2 mL/min Retention times: IxS: 5.7 min d5-HA: 4.4 min pCS: 7.1 min d5-IAA: 7.6 min Total run time: 15 min (column washed with isopropanol every 15 runs) Study authors’ sample extraction procedure: 1. Centrifuge the blood samples, collect the serum, and store at −80 °C; 2. Thaw at room temperature and vortex; 3. Add 40 µL of the internal standard solution to 160 µL serum; 4. Vortex, then add 600 µL water; 5. Expose to 90 °C for 30 min to deproteinate samples; 6. Cool for 10 min on ice; 7. Using a Millipore Centrifree ultrafiltration device (molecular weight cut-off (MWCO): 30,000 Da), ultrafilter samples at 1469× g for 25 min; 8. Evaporate 600 μL of ultrafiltrate under nitrogen (N2) at room temperature; 9. Use 120 μL of the initial mobile phase (5 mM ammonium acetate buffer solution at pH 4.3 with 5% methanol with 0.1% acetic acid) to reconstitute. | Mass spectrometer: triple-quadrupole (Waters) Mode of ionization: negative mode Ion source conditions: Electrospray ionization (ESI) Drying gas: N2 De-solvation gas flow: 650 L/h Cone gas flow: 10 L/h De-solvation temperature: 350 °C Source temperature: 110 °C Capillary potential: 2870 V Collision gas: Argon (Ar) at 2.60 × 10⁻³ Torr Scanning mode: Multiple reaction monitoring (MRM) m/z transitions: IxS: 212 → 80 Collision energy = 19 eV Cone voltage = 25 V d5-HA: 183 → 139 Collision energy = 15 eV Cone voltage = 20 V pCS: 187 → 107 Collision energy = 18 eV Cone voltage = 25 V d5-IAA: 179 → 135 Collision energy = 10 eV Cone voltage = 15 V | Validation criteria guideline(s): EPA (a) LLOQ (μg/mL): pCS: 0.095 IxS: 0.075 LLOD (μg/mL): pCS: 0.029 IxS: 0.023 Low, medium, and high-quality control (QC) (μg/mL): IxS: 0.25, 7.5, 15 pCS: 7.5, 15, 45 Calibration range(s): Linearity range (μg/mL): IxS: 0.1–40 pCS: 0.1–80 Linearity: R2 ≥ 0.99 for all analytes Selectivity: No issues Precision (within-day and between-day) and accuracy met the acceptance criteria (a). Accuracy %: <15% IxS; −4.89, −1.33, 0.31 (for low, mid, high QC) pCS; 14.00, −1.40, −8.35 (for low, mid, high QC) Within-day precision %: <15% IxS; 4.05, 3.68, 4.00 (for low, mid, high QC) pCS; 1.10, 0.60, 1.05 (for low, mid, high QC) Between-day precision %: <15% IxS; 9.15, 8.41, 8.50 (for low, mid, high QC) pCS; 7.56, 7.02, 4.69 (for low, mid, high QC) Stability: (b) Matrix effect (%): comparison between peak areas resulting from water samples and other samples in serum at the low QC concentration. IxS: −4.37 ± 2.81 (mean ± sample standard deviation (SD); N = 6) pCS: −2.52 ± 11.12 (mean ± SD; N = 6) Recovery (at medium QC concentration; “similar for the low and high QC levels”): comparison between serum samples spiked before extraction and serum spiked after ultrafiltration. IxS: 91.5 ± 3.9% pCS: 98.5 ± 6.3% Storage conditions: Stock solutions: −20 °C | Boelaert et al. 2013 [40] |
| IxS pCS In addition to other analytes: CMPF, HA, IAA, kynurenic acid (KA), kynurenine (Kn), pCG, phenyl glucuronide (PG), phenylacetylglutamine (PAG), phenylalanine (Phe), phenyl sulfate (PS) Trimethylamine N-oxide (TMAO), tryptophan (Trp), tyrosine (Tyr) | Matrix: Human serum Internal standard(s): Isotope-labeled (IxS-d4), original stock 40 μM, and p-cresol sulfate-d7 (pCS-d7), original stock 20 μM. Column: Acquity CSH Fluoro Phenyl column (50 × 2.5 mm; 1.7 µm particle size (Waters, Zellik, Belgium). Precolumn: Acquity CSH Fluoro Phenyl VanGuard (10 × 2.5 mm; 1.7 µm particle size (Waters, Zellik, Belgium). Temperature(s): Column: 40 °C Autosampler: 10 °C Mobile phase: A: 0.1% formic acid in MQwater B: methanol Gradient: 0.00–1.00 min: 3 → 16% B 1.00–4.00 min: 16 → 80% B 4.00–4.50 min: 80 → 95% B 4.50–5.50 min: 95% B 5.50–8.00 min: 3% B Injection volume: 5 µL Flow rate: 0.5 mL/min Retention time: IxS: 4.73 min IxS-d4: 4.72 min pCS: 4.83 min pCS-d7: 4.82 min Total run time: 8 min Study authors’ sample extraction procedure: Serum sample preparation: 1. Collect blood samples in vacutainer serum tubes; 2. Centrifuge at 1860× g at room temperature for 10 min; 3. Store at –80 °C. LCMS sample preparation: 1. In an Ostro 96-well plate, mix 50 µL serum with 50 µL solution of MQwater/methanol/0.01 N sodium hydroxide (v/v% 75/20/5); 2. Add 20 µL internal standard solution (20 µM pCS-d7, 40 µM IxS-d4, and other deuterated analytes) dissolved in MQwater/methanol, 50/50) and 150 µL acetonitrile (ACN); 3. Mix using an automated pipette (3 times); 4. Apply a positive pressure manifold to separate the precipitate and the supernatant; 5. Collect the supernatant in a 96-well plate (2 mL); 6. Dry precipitate for 30 min at 40 °C using N2; 7. Add 1000 µL MQwater to each sample; 8. Seal 96-well plates with a pre-slit cap mat; 9. Place the plates directly into the precooled autosampler (10 °C). | Mass spectrometer: triple-quadrupole (Waters) Mode of ionization: negative mode Ion source conditions: ESI Nebulizing and de-solution gas: N2 Collision gas: Ar Source temperature: 150 °C De-solvation temperature: 600 °C De-solvation gas flow: 800 L/h Cone gas flow: 150 L/h Capillary voltage: 3000 V Scanning mode: MRM m/z transitions IxS 212.1 → 80.1 Dwell time = 0.02 s Collision energy: 18 V Cone voltage: 35 V IxS-d4 216.1 → 80.2 Dwell time = 0.02 s Collision energy d4-IxS: 16 V Cone voltage: 35 V pCS 187.1 → 107.0 Dwell time = 0.02 s Collision energy pCS: 20 V Cone voltage: 35 V pCS-d7 194.2 → 114.1 Dwell time = 0.02 s Collision energy d7-pCS: 20 V Cone voltage: 35 V | Validation criteria guideline(s): LLOD according to Armbruster et al. 1994 [41]. Precision (as a coefficient of variation percentage (% CV)) according to NCCLS EP5-T (c). Serum samples were obtained from patients prior to HD, with low, medium, and high concentrations. Samples were divided into 20 aliquots and analyzed duplicates on separate days. Accuracy: Two added calibrator concentrations in serum samples from healthy volunteers (N = 4) and patients on hemodialysis (HD) (N = 4). LLOQ: IxS: 0.2 µM = 0.043 μg/mL pCS: 0.3 µM = 0.056 μg/mL LLOD: IxS: 0.03 µM= 0.0064 μg/mL pCS: 0.03 µM= 0.0056 μg/mL Calibration range(s): - Provided in the original manuscript in µM: IxS: 0.2–349 pCS: 0.3–586 - Equivalent in μg/mL to the following: IxS: 0.043–74.41 pCS: 0.056–110.29 Precision % (serum samples from three patients with low, medium, and high toxin concentrations): <15% for all analytes Total precision %: IxS: 4 ± 12, 4 ± 8, 4 ± 0.6 pCS: 4 ± 9, 4 ± 3, 3 ± 6 Within-run precision %: IxS; 2 ± 5, 2 ± 4, 2 ± 1 pCS; 1 ± 3, 2 ± 1, 1 ± 3 Between-run precision %: IxS; 3 ± 9, 2 ± 4, 2 ± 2 pCS; 4 ± 8, 2 ± 2, 2 ± 4 Between-day precision %: IxS; 2 ± 6, 3 ± 7, 3 ± 2 pCS; 0.001 ± 0.001, 2 ± 2, 2 ± 3 Recovery % (medium and high concentrations, N = 8): By comparing the ratio of the difference in the initial concentration and the final concentration to the spiked concentration. IxS: 94 ± 9, 100 ± 8 pCS: 96 ± 7, 96 ± 11 Stability: Freeze–thaw stability at 1, 2, 3, 5, and 10 cycles, from −80 °C to room temperature, N = 8 All analytes had insignificant differences between thawing cycles except for phenylalanine at the 10th freeze–thaw cycle (+20%) Storage conditions: Stock solutions: −20 °C | de Loor et al. 2016 [42] |
| IxS pCS | Matrix: Human serum Internal standard(s): hydrochlorothiazide (DHCT), 2 μg/mL (final concentration for the analysis) Column: Agilent Zorbax SB-C18 column (3.5 μm, 2.1 × 100 mm). Temperature(s): Column: 30 °C Mobile phase: ACN and 10 mM ammonium acetate buffer (10:90, v/v) Gradient: Isocratic elution Injection volume: 5 µL Flow rate: 0.3 mL/min Retention time: IxS: 2.1 min pCS: 3.8 min DHCT (internal standard): 4.3 min Total run time: 5 min Study authors’ sample extraction procedure: 1. Serum samples collected after 12 h fasting in the morning; 2. transferred to coagulation cubes; 3. centrifuged at 4500× g for 10 min; 4. samples stored at −20 °C until analysis: - Sample preparation steps were performed for both the original serum (for total concentration) and the filtrate (for free fraction); 1. 100 µL filtrate/original serum is mixed with 200 µL ACN containing 2 µg/mL DHCT; 2. Vortex for 3 min, then centrifuge at 20,000× g for 5 min; 3. Supernatant is mixed with 10 mM ammonium acetate buffer (1:1, v/v) for analysis: - Filtrate preparation for free concentration measurement: Centrifuge 200 µL of the serum sample at 20,000× g for 5 min and prepare 100 µL of the filtrate with the sample preparation steps described above: - Calibration standards were prepared as 10X in ACN: water (10:90, v/v) and diluted by 1:10 (v/v) with 4% bovine serum albumin (BSA). | Mass spectrometry: triple-quadrupole (Agilent) Mode of ionization: negative mode Ion source conditions: ESI Spray voltage: 4000 V Nebulizer gas: N2 Nebulizer pressure: 40 psi Source temperature: 105 °C De-solvation gas: N2 De-solvation gas temperature: 350 °C De-solvation gas flow rate: 10 L/min Collision gas: N2 Collision gas pressure: 0.1 MPa Scanning mode: MRM m/z transitions: IxS: 212.2 → 80.0 Fragmentor: 130 V Collision energy: 20 eV pCS: 187.0 → 107.1 Fragmentor: 100 V Collision energy: 18 eV DHCT: 296.0 → 205.0 Fragmentor: 180 V Collision energy: 25 eV | Validation criteria guideline(s): FDA (d) Quality control (QC) samples (low, medium, and high concentrations, μg/mL): IxS: 1, 4, and 8 pCS: 0.1, 0.5, and 5 Selectivity: confirmed for IxS, pCS, DHCT Precision and accuracy: Intra- and inter-day precision (%):0.44–10.6 and 0.89–7.34% Accuracy (%): 95.0–105.3% Calibration range(s): Linearity range (μg/mL): IxS: 0.500–10.000 pCS: 0.050−10.000 Quality control concentrations used in the validation (μg/mL): IxS: 1, 4 and 8 pCS: 0.1, 0.5 and 5 Stability: 3 cycles of freeze–thaw Benchtop stability: after 6 h at room temperature. Processed sample stability: after 1 month at −20 °C Accuracy: ±10% Precision: CV < 15% Recovery/Matrix effect: Recovery: By comparing the protein precipitation method (using ACN or methanol) with liquid–liquid extraction. The liquid–liquid extraction recovery data are not provided by the main manuscript. The protein precipitation data using ACN are as follows (exact protocol not specified): pCS: 95.8–99.0% IxS: 84.7–91.8% Matrix effect: By comparing post-extraction samples with samples in the mobile phase. pCS: 97.9–119.9% IxS: 83.3–94.1%% Storage: Calibration standards and QC samples: −20 °C | Shu et al. 2016 [37] |
| IxS In addition to other analytes: anthranilic acid (AnA), indoxyl acetate (IA), KA, Kn, Trp, xanthurenic acid (XA) | Matrix: Human serum Internal standard(s): Isotope-labeled IxS-d4, final concentration 20 μg/mL in methanol. Column: Atlantis T3 C18, dp = 3 μm, 50 × 2.1 mm column (Waters Corporations MA, USA). Temperature(s): (b) Mobile phase: A: 5 mM ammonium acetate [the solvent was not mentioned] B: methanol Gradient: Negative mode: 0.0–0.5 min: 5% B 0.5–5.0 min: 5 → 95% B 5.0–8.5 min: 95 → 98% B After 8.5 min: 98 → 5% B Positive mode: 0.0–0.5 min: 5% B 0.5–8.0 min: 5 → 95% B After 8.0 min: 95 → 5% B Injection volume: 10 μL Flow rate: 0.25 mL/min Retention time: IxS: ~4.5 min Total run time: (b) Study authors’ sample extraction procedure: 1. Dilute a 200 μL sample with 500 μL of 0.1% formic acid with internal standards; 2. Solid phase extraction (SPE); 3. Load samples onto a 3cc HLB cartridge [the cartridge is conditioned with methanol and 1% formic acid]; 4. Wash the cartridge with 1% formic acid; 5. Elute the analytes with 1% ammonium peroxide in methanol/water (50:50); 6. Evaporate the supernatant using a N2 stream; 7. Reconstitute the pellet with 150 μL of 5 mM ammonium acetate. Note: IxS stock solution (100 μM = 21.321 μg/mL) was prepared using methanol as the main solvent and diluted with 5% bovine serum albumin/phosphate buffered saline solution. | Mass spectrometry: triple- quadrupole (Sciex) Mode of ionization: negative mode for IxS, IA, and AnA positive mode for Trp, Kn, KA, and XA Ion source conditions: ESI Negative mode: CAD (definitions and units for abbreviations not found in original paper): 6 CUR: 20 GS1: 45 GS2: 20 IxS: 4500 TEM: 350 DP: 48 EP: 10 Positive mode: CAD: 6 CUR: 15 GS1: 50 GS2: 40 IxS: 4000 TEM: 550 DP: 48 EP: 10 Scanning mode: MRM m/z transitions: IxxS: 213.2 → 212.0, 80.1 Collision energy: −35 V | Validation criteria guideline(s): FDA (d) LLOQ: Determined in triplicate with CV < 15% IxS: 0.1 μM equivalent to 0.02132 μg/mL LLOD (μg/mL): (b) Precision and accuracy met the acceptance criteria (± 15%) (d). Intra-assay variation based on 2 QC concentrations (~16 µM & ~46 µM) CV % = 2.357 and 3.991 Inter-assay variation based on 2 QC concentrations: CV % = 0.403 and 5.847 Calibration range(s): Linearity range (μM): IxS: 0.1–500 equivalents in μg/mL to 0.021–106.605, R2 = 0.9991 Recovery/Matrix effect: Recovery: Percentage of the difference in spiked and non-spiked samples to the spiked amount (33.3 and 10 µmol per original study) IxS: 108.724, 115.321% Storage conditions: −20 °C | Zhang et al. 2017 [43] |
| IxS pCS | Matrix: Human serum Internal standard(s): Isotope-labeled IxS-d4 and pCS-d7 Column: Acquity UPLC BEHC 18 column (2.1 × 100 mm, 1.7-μm particle size, Waters) Temperature(s): Column: 30 °C Mobile phase: A: 0.1% (v/v) formic acid in water B: 0.1% (v/v) formic acid in ACN Gradient: 0.0–1.0 min: 20% B 1.0–1.7 min: 20 → 80% B 1.7–1.8 min: 80 → 95% B 1.8–3.4 min: 95% B 3.5 min–5.5 min: 20% B Injection volume: 5 µL Flow rate: 0.45 mL/min Retention time: IxS: 1.10 min pCS: 1.57 min Total run time: 5.5 min Study authors’ sample extraction procedure: Total IxS and pCS: 1. Thaw serum samples at room temperature; 2. Mix 50 µL sample with 500 µL ACN with 0.2 mg/L IxS-d4 and pCS-d7 (internal standard); 3. Vortex 30 s, then centrifuge at 13,400× g for 15 min; 4. Dilute the supernatant 10-fold with water before injection. Free-form IxS and pCS 1. Centrifuge 100 µL serum for 30 min at 10,621× g (37 °C) using a 3000 MWCO filter (Merck Millipore); 2. 50 µL of the filtrate is subsequently processed the same way as the total concentration analysis starting from Step 2. Clinical samples 1. Centrifuge whole blood sample at 200× g for 10 min within 2 h of sample collection; 2. Store serum at −70 °C. | Mass spectrometry: triple-quadrupole (Waters) Mode of ionization: negative mode Ion source conditions: ESI Capillary voltage: 1500 V De-solvation gas flow: 150 L/h Source temperature: 150 °C Scanning mode: MRM m/z transitions: IxS: 212.04 → 80.14, 132.05 Cone voltage: 6 V Collision energy: 20/18 eV IxxS-d4: 216.04 → 80.14 Cone voltage: 6 V Collision energy: 20 eV pCS: 186.98 → 107.03, 80.02 Cone voltage: 4 V Collision energy: 20/16 eV pCS-d7: 194.04 → 114.04 Cone voltage: 8 V Collision energy: 18 eV | Validation criteria guideline(s): CLIA (e) LLOQ (μg/mL): S/N = 10, imprecision for 40 replicates over five runs is < 20%, inaccuracy < 15%. IxS: 0.05 pCS: 0.05 LLOD (μg/mL): (b) Dilution effect: Serum samples were prepared with a concentration of 10 mg/L for both analytes; then, it was diluted 10- and 20-fold with water (8 replicates) Imprecision < 2.8%, bias < 7.6%. Calibration range(s): Linearity range (μg/mL): IxS: 0.05–5.18 pCS: 0.05–5.12 Precision and accuracy Accuracy (based on concentration range 0.53–4.25 µg/mL) within 15% Precision data met the acceptance criteria (below) (d). intra- and inter-day imprecision tests Within-run, μg/mL, N = 20: IxS QC 1: 0.19 ± 0.01, CV% = 6.4 IxS QC 2: 1.98 ± 0.04, CV% = 1.9 IxS QC 3: 3.84 ± 0.09, CV% = 2.2 pCS QC 1: 0.42 ± 0.01, CV% = 1.9 pCS QC 2: 2.08 ± 0.02, CV5 = 1.1 pCS QC 3: 4.03 ± 0.05, CV% = 1.3 Free IxS QC 1: 0.21 ± 0.01, CV% = 5.7 Free IxS QC 2: 2.64 ± 0.05, CV% = 1.9 Free IxS QC 3: 8.01 ± 0.14, CV% = 1.8 Free pCS QC 1: 0.26 ± 0.01, CV% = 3 Free pCS QC 2: 1.54 ± 0.02, CV% = 1.5 Free pCS QC 3: 4.58 ± 0.04, CV% = 0.9 Between-run, μg/mL, N = 40: IxS QC 1: 0.2 ± 0.01, CV% = 6.9 IxS QC 2: 2.02 ± 0.08, CV% = 3.8 IxS QC 3: 3.96 ± 0.19, CV% = 4.7 pCS QC 1: 0.43 ± 0.01, CV% = 2.5 pCS QC 2: 2.1 ± 0.05, CV% = 2.2 pCS QC 3: 4.03 ± 0.15, CV% = 3.7 Free IxS QC 1: 0.21 ± 0.02, CV% = 10.1 Free IxS QC 2: 2.58 ± 0.21, CV% = 8.1 Free IxS QC 3: 7.37 ± 0.6, CV% = 8.1 Free pCS QC 1: 0.24 ± 0.02, CV% = 10.6 Free pCS QC 2: 1.46 ± 0.11, CV% = 7.8 Free pCS QC 3: 4.19 ± 0.35, CV% = 8.5 Stability: Criteria 4 °C for 7 days; −20 °C and −70 °C for 3 months (data not provided) Carryover: Criteria: high and low concentrations, 10 and 0.4 mg/L (data not provided) Recovery: Three concentrations (0.5, 1, and 4 mg/L) were prepared in distilled water and serum and analyzed for 10 replicates. IxS: 104.7% pCS: 101.1% Matrix effect: Criteria: Comparing results from 12 serum samples spiked with analytes post-extraction with samples spiked into a “neat solution” (data not provided). Storage conditions: −80 °C | Lin et al. 2019 [29] |
| IxS pCS In addition to other analytes: HA, KA | Matrix: Human serum Internal standards: isotope-labeled internal standards indoxyl sulfate-d4 (IxS-d4) and p-cresol-sulfate-d7 (pCS-d7), both at 5 µg/mL Column: Acquity BEH C18 (2.1 × 100 mm, 1.7 µm column) pre-column: Acquity BEH C18 VanGuard (2.1 × 5 mm, 1.7 µm). Temperature: Column: 35 °C Autosampler: 10 °C Mobile phase: A: 10 mM ammonium formate; pH 4.3 Formic acid: used to produce the required pH of A. B: ACN Gradient: isocratic elution (A: B, 85:15, v/v) Injection volume: 20 µL Flow rate: 0.3 mL/min Retention time: IxS: 2.11 min pCS: 3.30 min Total run time: 4 min Study authors’ sample extraction procedure: 1. Mix 50 µL of serum sample with 100 µL ACN containing internal standards; 2. Vortex 30 s, then centrifuge at 10,000× g for 5 min (temperature not provided); 3. Transfer the supernatant into a microcentrifuge tube to be evaporated under N2 at 40 °C; 5. Reconstitute with 150 µL water: ACN at 80:20%; 6. Vortex 30 s. | Mass spectrometry: triple-quadrupole (Thermo Scientific) Mode of ionization: ESI, switched from positive to negative mode at 1.4 min. Ion source conditions: Spray voltages: 3000 V (+ve) and 2000 V (−ve), vaporizer temperature: 300 °C, ion transfer tube temperature: 300 °C, collision gas pressure: 1.5 mTorr, auxiliary gas: 50 (arbitrary units), sheath gas: 60 (arbitrary units), scan time: 0.05 s, scan width: 0.05 m/z. Scanning mode: MRM m/z transitions: IxS: 212.0 → 80.4 Collision energy: 27 V IxS-d4: 215.9 → 80.4- Collision energy: 31 V pCS: 186.9→107.5 Collision energy: 26 V pCS-d7: 193.9 →114.6 Collision energy: 24 V | Validation criteria guideline(s): FDA (d) LLOQ (μg/mL): IxS: 0.20 pCS: 0.25 LLOD (μg/mL): (b) Calibration range(s): Linearity range (μg/mL), correlation coefficient ≥ 0.997: IxS: 0.2–80 pCS: 0.25–80 Precision and accuracy met the acceptance criteria (d). (N = 24) Intra-day accuracy and precision: N = 12 Inter-day accuracy and precision: N = 6 IxS QC concentrations: 0.2, 0.6, 15.0, and 60.0 (μg/mL) pCS QC concentrations: 0.25, 0.75, 15.0, and 60.0 (μg/mL) Accuracy (% bias): Intra-day: IxS: −8.73, 10.9, 3.08, and 2.11 pCS: −19.3, −0.50, 3.30, and −3.70 Inter-day: IxS: −13.35, 9.50, 1.10, and 3.30 pCS: −17.4, 0.40, 2.80, and −5.30 Precision (% RSD): Intra-day: IxS: 9.27, 2.11, 5.46, and 6.05 pCS: 7.54, 3.10, 1.57, and 1.99 Inter-day: IxS: 10.9, 5.29, 5.29, and 5.51 pCS: 6.71, 3.46, 1.77, and 2.74 Dilution integrity: Highest concentrations were diluted 1:1, 1:2, and 1:4 Bias = 11.04% and RSD = 6.19% Stability (N = 3) at LQC and HQC: Criteria: Long-term stability: 2 months at −80 °C Benchtop stability: 6 h at room temperature. Autosampler stability: 24 h and 72 h at 10 °C Freeze–thaw stability: 3 cycles of 24 h freeze–thaw IxS RSD% at 0.6 and 60.0 μg/mL: Benchtop stability: 4.5 and 4.1 Autosampler stability: 2.9 and 3.3 Freeze–thaw stability: 3.6 and 5.4 Long-term Storage: 3.6 and 1.7 IxS %target at 0.6 and 60.0 μg/mL: Benchtop stability: 96.5 and 98.2 Autosampler stability: 98.4 and 108.9 Freeze–thaw stability: 98.8 and 106.3 Long-term Storage: 98.8 and 99.9 pCS RSD% at 0.75 and 60.0 μg/mL: Benchtop stability: 2.9 and 0.9 Autosampler stability: 4.1 and 1.0 Freeze–thaw stability: 1.7 and 5.8 Long-term Storage: 1.7 and 2.0 pCS %target at 0.75 and 60.0 μg/mL: Benchtop stability: 102.3 and 97.6 Autosampler stability: 104.6 and 100.9 Freeze–thaw stability: 97.3 and 103.2 Long-term Storage: 97.5 and 101.1 Recovery/Matrix effect: Recovery: By comparing samples spiked into the matrix and then extracted to samples spiked into the post-extracted matrix. IxS at 0.6, 15.0, and 60.0 μg/mL: 106, 99.3, 97.4% pCS at 0.75, 15.0, and 60.0: 92.8, 87.7, 89.1% Matrix effect (Nn = 3) at 3 QCs: By comparing samples spiked into the post-extracted matrix to samples spiked into the water without extraction. IxS at 0.6, 15.0, and 60.0 μg/mL: 103, 94.7, and 98.4% pCS at 0.75, 15.0, and 60.0: 96.2, 100, and 93.1% Storage conditions: −80 °C | Prokopienko et al. 2019 [44] |
| IxS pCS In addition to other analytes: CMPF, HA, IAA, pCG, TMAO | Matrix: Human serum Internal standard(s): Isotope-labeled indoxyl sulfate-13C6 ([13C6-IxS) and p-cresol sulfate-d4 (pCS-d4), 500 ng/mL for all internal standards. Column: Ultra PFP Propyl column, (5 μm, 50 × 2.1 mm; Restek, Lisses, France). Pre-column: ultra PFP propyl precolumn (5 μm, Restek) Temperature(s): 40 °C Mobile phase: A: 0.1% (v/v) formic acid in water B: 0.1% (v/v) formic acid in ACN Gradient: In the negative ionization mode: 0.0–1.0 min: 40% → 80% B 1.0–2.0 min: 80% B 2.0–2.2 min: 80% → 40% B 2.2–2.5 min: 40% B A different gradient was applied in the positive ionization mode (not applicable to IxS and PCS). Injection volume: 15 µL for each mode Flow rate: 0.8 mL/min Retention time: IxS: ~0.50 min extracted from the provided chromatograms pCS: ~0.54 min extracted from the provided chromatograms Total run time: Negative mode: 2.5 min Positive mode: 2 min Study authors’ sample extraction procedure: 1. Mix a 50 µL sample with 200 µL of an iced ACN solution containing the internal standards; 2. Vortex, then centrifuge at 16,500× g for 15 min; 3. Dilute 50 µL of the supernatant with 20-fold water. | Mass spectrometry: QTRAP tandem mass (Sciex) Mode of ionization: negative and positive mode; negative for IxS and pCS Ion source conditions: ESI Voltage: −4500 V (negative mode) and 4500 (positive mode) Ion source temperature: 350 °C Heater gas: 70 psi Nebulizer gas: 40 psi Curtain gas: 30 psi Scanning mode: MRM m/z transitions: IxS: 211.9 → 79.9, 132 Declustering potential: −55 V Entrance potential: −2.5 V Cell entrance potential: −10 V Collision energy: −34 and −24 eV Collision cell exit potential: 0 V [13C6]-IxS: 217.7 → 79.7, 138 Declustering potential: −65 V Entrance potential: −9.5 V Cell entrance potential: −12 V Collision energy: −34 and −24 eV Collision cell exit potential: 0 V pCS: 186.8 → 106.8, 79.9 Declustering potential: −40 V Entrance potential: −2.5 V Cell entrance potential: −12 V Collision energy: −30 eV Collision cell exit potential: 0 V d4- pCS: 190.8 → 111, 79.9 Declustering potential: −30 V Entrance potential: −2.5 V Cell entrance potential: −14 V Collision energy: −30 eV Collision cell exit potential: 0 V | Validation criteria guideline(s): EMA (f) and SWGTOX (g) LLOQ (μg/mL): IxS: 0.1 pCS: 0.1 LLOD (μg/mL): IxS: 0.04 pCS: 0.006 IxS and pCS calibration range (μg/mL): 0.1–100 for all toxins except indole-3-acetic acid IxS R2 = 0.9996 ± 0.0004 pCS R2 = 0.9999 ± 0.00007 Inter-sample carryover: < 1% Precision and accuracy: both within-run and between-run met the acceptance criteria. IxS and pCS QCs: 0.5, 2.5, 25, and 75 IxS CV% and bias%: Within run: At 0.5 μg/mL: 3.85 and 3.80 (CV% and bias%) At 2.5 μg/mL: 6.82 and −9.84 At 25 μg/mL: 10.73 and −8.16 At 75 μg/mL: 7.74 and −10.29 Between run: At 0.5 μg/mL: 8.47 and 6.10 (CV% and bias%) At 2.5 μg/mL: 14.23 and −9.84 At 25 μg/mL: 10.62 and −14.49 At 75 μg/mL: 14.54 and −14.79 pCS CV% and bias%: Within-run: At 0.5 μg/mL: 10.66 and 2.67 (CV% and bias%) At 2.5 μg/mL: 3.03 and 14.48 At 25 μg/mL: 2.98 and 9.07 At 75 μg/mL: 3.02 and 10.33 Between-run: At 0.5 μg/mL: 12.92 and −4.48 (CV% and bias%) At 2.5 μg/mL: 5.51 and 9.73 At 25 μg/mL: 6.10 and 2.98 At 75 μg/mL: 6.23 and 12.62 Stability as the concentration loss%: IxS (6 h at 4 °C, 24 h at 4 °C, 1 month at −20 °C, and 3 freeze–thaw cycles): At 2.5 μg/mL: 4.08, 9.48, 2.64, and 25.57% At 25 μg/mL: 6.32, 3.23, 2.73, and 20.86 At 75 μg/mL: 2.83, 0.80, 2.49, and 26.13 pCS (6 h at 4 °C, 24 h at 4, 1 month at −20 °C, 3 freeze–thaw cycles): At 2.5 μg/mL: 9.97, 2.62, 4.41, and 4.80% At 25 μg/mL: 5.65, 5.99, 8.48, and 3.33% At 75 μg/mL: 7.65, 4.60, 10.37, and 8.05% Selectivity: No interference reported Recovery/Matrix effect: Matrix effect at 25 and 75 µg/mL: By comparing samples spiked into extracted blank matrix cleaned with activated charcoal to samples spiked into a neat solution. IxS: 87.33, 74.40% pCS: 76.87, 67.02% Recovery: not provided Storage conditions: Stock: −20 °C | André et al. 2020 [45] |
| IxS pCS In addition to other analytes: CMPF, HA, KA, Kn, IAA, PAG, pCG, Phe, TMAO, Trp, Tyr. | Matrix: Human serum Internal standard(s): isotope-labeled IxS-d4 (0.1 μg/mL) and pCS-d7 (0.01 μg/mL) Column: Accucore PFP column, 100 × 2.1 mm, 2.6 μm (Thermo, Les Ulis, France) Temperature(s): Column: 40 °C Mobile phase: A: 0.1% v/v formic acid in water B: ACN Gradient: 0.0–1.0 min: 1% B 1.0–7.5 min: 1 → 65% B 7.5–7.6 min: 65 → 90% B 7.6–9.0 min: 90% B 9.0–10.9 min: 1% B Injection volume: 4 µL Flow rate: 0.5 mL/min Retention time: IxS: 5.75 min pCS: 6.18 min Total run time: (b) Study authors’ sample extraction procedure: Collecting blood samples: 1. Collection samples in a vacutainer tube; 2. Centrifuge 3000× g at 4 °C for 10 min Total concentration: 1. Mix 50 μL of serum sample with 25 μL of internal standard solution (deuterated internal standards in methanol, IxS-d4 (0.1 μg/mL) and pCS-d7 (0.01 μg/mL), in addition to the other internal standards; 2. Add 340 μL of methanol for precipitation; 3. Vortex and centrifuge at 9000× g and 4 °C for 10 min; 4. Evaporate the supernatant using an N2 stream; 5. Reconstitute the dry residue with 80 µL water. Free-form concentration: Ultrafiltration: 1. Pass a 150 µL serum sample into the ultra-centrifugal filter (30 KDa, 0.5 mL, Amicon, Germany); 2. Centrifuge at 13,300× g for 20 min; 3. Obtain the filtrate for the free form of uremic toxin | Mass spectrometry: triple-quadrupole (Thermo) Mode of ionization: alternating negative and positive; negative for IxS and pCS Ion source conditions: ESI Nebulization gas: N2 Collision gas: Ar Source temperature: 350 °C Vaporization temperature: 100 °C Capillary voltage: 5000 V (positive mode) and 4000 V (negative mode) Scanning mode: MRM m/z transitions IxS: 212.1 → 80.0, 81.0 Collision energy: 23 V (80.0 fragments), 17 V (81.0 fragments) pCS: 187.1 → 107.1, 105.1 Collision energy: 21 V (107.1 fragments), 34 V (105.1 fragments) | Validation criteria guideline(s): EMA (f) LLOQ (μg/mL): IxS: 0.001 pCS: 0.001 LLOD (μg/mL): (b) Calibration range(s), N = 6: (μg/mL): IxS: 0.001–50, R2 = 0.9993 ± 0.0006 pCS: 0.001–50, R2 = 0.9995 ± 0.0004 QC concentrations: 0.030, 0.150, 8.000, and 40.000 µg/mL. Precision and accuracy met the acceptance criteria (g), for all the analytes. Intra-day, N = 6: CV% per QCs: IxS: 8.8, 4.3, 10.1, 7.6% pCS: 7.8, 4.9, 7.0, 8.1% Bias% per QCs: IxS: 3.3, 6.7, −1.7, 6.7% pCS: 10.0, 0.0, 2.4, 1.9% Inter-day, N = 6: CV% per QCs: IxS: 3.3, 5.9, 7.0, 10.9% pCS: 4.4, 6.6, 8.0, 6.4% Bias% per QCs: IxS: 1.3, 3.3, −5.1, −2.2% pCS: 10.0, −1.3, −2.2, −1.8% Stability: Criteria: 1 week at 4 °C 1 week, 2 weeks, and 2 months at −80 °C 1, 2, 3, 4, and 5 freeze–thaw cycles. (numerical data not provided) Recovery/Matrix effect: Matrix effect at 0.1 and 1 μg/mL (N = 6): By comparing samples spiked in a matrix to samples spiked in water. IxS-d4: Serum: 113.0, 103.9% Buffer: 86.1, 99.2% ultrafiltrate: 113.6, 106.9% pCS-d7: Serum: 85.2, 97.6% Buffer: 96.0, 106.4% Ultrafiltrate: 100.0, 97.7% Recovery: not provided Storage conditions: Blood samples: −80 °C Stock: −20 °C | Fabresse et al. 2020 [31] |
| IxS pCS In addition to other analytes: N-acetyl-l-arginine, CMPF, Creatinine, 3-deoxyglucosone, 3-(3,4-dihydroxyphenyl)-L-alanine, N2,N2-dimethyl guanosine, DL-Homocysteine, 4-ethylphenyl sulfate, HA, IAA, 3-indolyl- -d-glucopyranoside, KA, Kn, 1-methyl-inosine, N6-(carboxymethyl)-l-lysine N-acetylcytidine, Orotic acid, PAG, pCG, PG, Pseudo uridine, S-adenosyl-l-homocysteine, symmetric dimethylarginine, Uridine. | Matrix: Human serum Internal standard(s): isotope-labeled hippuric acid-d5 (HA-d5), stock solution concentration (22.230 μg/mL) Column: Agilent Poroshell 120 HILIC column (4.6 × 100 mm, 2.7 µm) Temperature(s): Column: 30 °C Mobile phase: A: 0.1% acetic acid in water B: ACN Gradient: isocratic elution A: B (60:40, v/v). Injection volume: 10 µL Flow rate: 0.6 mL/min Retention time: IxS: 1.47 min pCS: 1.39 min Total run time: 8 min/each ion mode (total = 16 min) Study authors’ sample extraction procedure: Blank serum preparation: Mix healthy volunteer serum and activated charcoal. Preparation of clinical samples: 1. Centrifuge blood samples at 940× g for 12 min to obtain serum 2. Store the serum at −80 °C. Total toxin concentration: 1. Mix 50 µL of the sample with 50 µL of the internal standard mixture; 2. Add 100 µL ACN and vortex for 40 s; 3. Centrifuge at 18,000× g for 10 min. Free-form concentration: 1. Add 400 µL serum to an ultrafiltration device (Centrifree membrane, 30 kDa); 2. Centrifuge at 3500× g at 37 °C for half an hour; 3. Follow the same procedure as for the total concentration above. | Mass spectrometry: triple-quadrupole (Agilent) Mode of ionization: negative and positive; negative for IxS and pCS Ion source conditions: Drying gas temperature: 350 °C Drying gas flow rate: 9 L/min Nebulizer gas pressure: 0.35 MPa Capillary voltage—positive: 4000 V Capillary voltage—negative: 3500 V Scanning mode: MRM m/z transitions: IxS: 212.4 → 80.1 (collision energy 14 eV) pCS: 187.4 → 80.1 (collision energy 30 eV) HA-d5: 183.4 → 139.4 (collision energy 6 eV) | Validation criteria guideline(s): Not specified LLOQ (μg/mL): IxS: 0.02014 pCS: 0.01954 LLOD (μg/mL): (b) Calibration range (μg/mL): IxS: 0.08057–165.000 pCS: 0.07817–160.000 QC concentrations for LLOQ, LQC, MQC, and HQC (μg/mL): IxS: 0.02014, 0.100, 10.000, and 80.000 pCS: 0.01954, 0.100, 20.000, and 80.000 Selectivity and specificity: Comparing the response in LLOQ between blank samples and clinical samples (based on < 20% interference). No numerical data were provided but passed validation per the authors. Accuracy for LQC, MQC, and HQC: Intra-day: IxS: 106.4, 95.3, and 100.2% pCS: 103.5, 90.4, and 93.8% Inter-day: IxS: 104.1, 99.7, and 95.0% pCS: 110.7, 99.3, and 99.0% Precision for LQC, MQC, and HQC: Intra-day: IxS: 7.64, 10.49, and 4.29% pCS: 7.22, 14.43, and 3.95% Inter-day: IxS: 2.01, 14.08, and 12.73% pCS: 6.99, 10.03, and 5.08% Carryover and dilution integrity (10 and 100X) met the acceptance criteria for pCS and IxS Stability (accuracy%; precision RSD%) at 1 h at 4 °C 24 h at room (temperature inconsistent between text and table) Two weeks at −80 °C Three freeze–thaw cycles (−80 °C) Results: LQC: IxS: (102.36%; 3.45%), (88.74%; 6.27%), (97.68%; 4.92%), and (108.94%, 2.36%) pCS: (98.56; 2.16%), (98.78; 1.37%), (102.79%; 3.21%), and (108.36%; 10.62%) MQC: IxS: (101.97%; 2.79%), (87.62%; 3.49%), (89.02%; 8.33%), and (103.26%; 7.99%) pCS: (97.89%; 2.67%), (97.65%; 0.83%), (97.65%; 2.98%), and (103.67%; 11.39%) HQC: IxS: (97.68%; 3.95%), (93.45%; 5.91%), (102.38%; 1.72%), and (106.53%; 1.03%) pCS: (101.54%; 0.96%), (102.34%; 1.96%), (100.46%; 3.86%) and (108.94%; 8.91%) Recovery/Matrix (%) effect for LQC, MQC, and HQC:
IxS: 85.24 ±1.09; 87.87 ±0.76; 95.99 ±9.62 pCS: 92.37 ±2.31; 98.46 ±3.89; 102.34 ±3.89 Matrix effect (%), (c:b): IxS: 102.25 ±2.06; 104.46 ±1.98; 96.14 ±3.29 pCS: 103.41 ±5.74; 107.98 ±6.89; 98.74 ±0.96 Dilution integrity for 10 and 100 folds (accuracy%; precision, RSD%): IxS: (98.8; 6.09) and (95.5; 12.67) pCS: (103.2; 0.41) and (103.0; 5.98) Storage conditions: Stock storage: −20 °C Separated serum storage: −80 °C | Ma et al. 2020 [46] |
| IxS In addition to other analytes: CMPF, HA, 4-hydroxyhippuric acid, IAA, KA, Kn, Melatonin. | Matrix: Human serum Internal standard(s): Hydrochlorothiazide (DHCT), 30 ng/mL Column: Waters Atlantis T3 column 2.1 mm × 100 mm, 3 µm (Milford, MA, USA) Temperature(s): Column: 35 °C Mobile phase: A: Water with 0.1% (v/v) formic acid and 10 mM ammonium acetate. B: ACN Gradient: 0.0–5.0 min: 15 → 85% B 5.0–7.0 min: post-run Injection volume: 5 µL Flow rate: 0.3 mL/min Retention time: between 2–2.5 min (extracted from the provided chromatograms) Total run time: 5 min Study authors’ sample extraction procedure: 1. Mix 100 µL sample with 300 µL ACN with the internal standard; 2. Vortex 1 min; 3. Centrifuge at 13,400× g and at room temperature for 10 min. | Mass spectrometry: triple-quadrupole (Agilent) Mode of ionization: negative and positive mode; negative for IxS Ion source conditions: ESI Spray voltage: ±4000 V Nebulizer pressure: 50 psi Drying gas temperature: 350 °C, Drying gas flow rate: 10 L/min, Temperature of sheath gas: 350 °C, Sheath gas flow rate: 12 L/min. Collision gas: N2 Scanning mode: MRM m/z transitions: IxS: 212.0 → 132.1 Collision energy: 18 DHCT: 295.8 → 205 Collision energy: 21 | Validation criteria guideline(s): Not specified LLOQ (μg/mL): 0.156250 LLOD (μg/mL): (b) Calibration range(s): Linearity range (μg/mL): IxS: 0.156250–20.000 Specificity: Criteria: Chromatograms from blank PBS, spiked PBS, and clinical samples were compared (Nn = 6) No interference reported Carryover: Criteria: Injecting a blank sample after the highest concentration sample (N = 3) No carryover was reported. Intra- and inter-day accuracy and precision met the acceptance criteria for all analytes. LLOQ, low-, medium-, and high-quality control concentrations (N = 5) were used for inter- and intra-day precision (RSD%) and accuracy as relative error % (RE%). Concentrations (μg/mL): 0.15625, 0.3125, 1.250, and 10.000. Intra-day (N = 5): RE%: 8.40, 4.23, 1.64, and −4.40% RSD%: 8.20, 10.85, 5.25, and 7.32% Inter-day (N = 5): RE%: 2.03, 2.47, −0.92, and −4.72% RSD%: 13.76, 9.94, 9.30, and 2.44% Stability, (N = 5): QC samples (μg/mL): 0.3125, 1.250, 10.000 Criteria: Autosampler at 4 °C for 24 h Freeze–thaw (3 cycles) −20 °C Long-term 3 months at −80 °C Autosampler stability: 24 h at 4 °C RE%: 3.43, 1.28, 7.47% 3 cycles of freeze–thaw at–20 °C RE%: 1.98, −0.85, 4.92% long term stability: 3 months at −80 °C RE%: 1.96, 2.07, 4.37% Recovery, 3 QC samples, N = 3: Response in samples spiked with analytes before extraction procedure to samples spiked with analytes after extraction procedure. QC samples (μg/mL): 0.3125, 1.250, and 10.000 IxS: 74.69 ± 4.87; 69.27 ± 1.85; 70.31 ± 9.86% Matrix effect, 3 QC samples, N = 3: Response in samples spiked with analytes in the blank matrix after extraction compared to samples spiked with analytes at the same concentrations in the neat solvent. QC samples (μg/mL): 0.3125, 1.250, and 10.000 IxS: 119.57 ± 13.61; 125.30 ± 12.53; 112.01 ± 11.98% Storage conditions: −80 °C | Wang et al. 2020 [47] |
| IxS, pCS, In addition to dihydroepiandrosterone sulphate, ethyl-β-D-glucuronide, ethyl sulfate, estrone sulfate resveratrol, L-tartaric acid. | Matrix: serum, plasma, and urine Internal standards: indoxyl sulphate-d4 potassium salt (IxS-d4) and p-cresol sulphate potassium salt-d7 (pCS-d7) Column: Waters Acquity™ UPLC HSS T3 1.8 μm 2.1 × 100 mm Pre-column: Waters Acquity™ UPLC HSS T3 1.8 μm VanGuard 2.1 × 5 mm Column temperature: 40 °C Mobile phase: A: 0.075% (v/v) formic acid in mQwater. B: methanol. Composition gradient: 0.00–1.00 min: 2% B 1.00–1.50 min: 2–25%B 1.50–1.90 min: 25–50%B 1.90–4.10 min: 50–80%B 4.10–4.50 min: 80–100%B 4.50–4.90 min: 100%B 4.90–5.10 min: 100–2%B 5.10–6.00 min: 2%B Injection volume: 7.5 μL Flow rate (mL/min): 0.0–1.50 min: 0.55 1.50–4.10 min: 0.43 4.10–5.10 min: 0.60 5.10–6.00 min: 0.55 Retention time: IxS: 2.54 min IxS-d4: 2.53 min pCS: 2.68 min pCS-d7: 2.80 Total run time: (b) Study authors’ sample extraction procedure: Urine samples: 1. Collected and stored at −80 °C (up to 36 months); 2. Thawed samples were centrifuged at 10,000 crf for 3 min; 3. Dilute supernatant by 15-fold using mobile phase A containing the internal standards. Blood samples (plasma and serum): 1. Serum isolated from blood; 2. Stored at −20 °C (for up to 1–14 weeks). The following steps are according to the authors’ previous publication [48]: 3. Thaw plasma samples on ice; 4. Mix 40 µL of the sample with 180 µL of 90% methanol 0.1% formic acid in a 96-well Sirocco™ plasma protein filtering plate; 5. Vortex for 5 min; 6. Keep at 4 °C for 10 min, then 5 min re-equilibration at room temperature; 7. Place an ultra-performance liquid chromatography (UPLC) autosampler 96-well plate underneath the protein filtering plate; 8. Apply a vacuum to collect the filtrate; 9. Once the filtering plate is dry, re-extract with 180 µL of a 20:80 acetone: ACN mixture with 0.1% formic acid; 10. Repeat Step 8; 11. Evaporate the solvent/filtrates in the UPLC plates using a cooled vacuum centrifuge; 12. Reconstitute with 200 µL mQ acidic water. | Mass spectrometry: tandem mass (Waters). Mode of ionization: negative Ion source conditions: ESI Scanning mode: MRM collision gas: Argon capillary voltage: 3.50 kV source temperature: 150 °C desolvation temperature: 350 °C desolvation gas flow: 900 L/h cone gas flow: 50 L/h m/z transitions: IxS: 212→80, 132 IxS-d4: 216→80, 136 pCS: 186.7→107, 80 pCS-d7: 194.1→114.1, 80 Cone voltage and collision energy: IxS: 30 and 20 IxS-d4: 30 and 20 pCS: 30 and 20 pCS-d7: 30 and 20 | Validation criteria guideline(s): ICH (h), EMA (f), and FDA (d) LLOD (μg/mL): IxS: 0.0002 μg/mL pCS: 0.003 μg/mL LLOQ (μg/mL): IxS: 0.019 μg/mL pCS: 0.024 μg/mL Linearity range (μg/mL): IxS: 0.019–9.86, R2 = 0.9992 pCS: 0.024–12.47, R2 = 0.9960 Accuracy/Bias: data not provided Repeatability/Precision (CV%), (N = 6): IxS: 2.5 μg/mL pCS: 0.88 μg/mL in urine and plasma. CV% for urine and plasma: IxS: 2.1 and 2.7% pCS: 2.1 and 3.8% Intermediate precision (inter-day): The same QC concentrations as the “repeatability” experiment Triplicates on 3 separate days, total N = 9. CV% urine and plasma: IxS: 1.8 and 1.9% pCS: 2.3 and 19% Recovery: By comparing the spiked samples in the matrix to nominal values at several concentrations. In urine for the highest concentration tested: IxS: 114% pCS: 90% In plasma for the highest concentration tested: IxS: between 82% and 114% (exact value not provided) pCS: 82% Matrix effect: By comparing the slope of the calibrators set prepared in the matrix to the same set prepared in solvent. The following equation was used: (slope in matrix/slope in solvent) × 100%) − 100% In urine: IxS: 10.0% pCS: 23.1% In plasma: IxS: 15.6% pCS: 26.9% In serum: IxS: 10.0% pCS: 9.6% Stability: Criteria: 4 weeks storage at −20 °C Freeze thaw: 3 cycles 5 °C for 15–20 h autosampler No decrease in sample integrity was reported Storage: −20 °C (validated criteria) | Monosık, R. et. al. 2016 [49] |
| IxS In addition to other analytes: AnA, 3-hydroxykynurenine, 3-hydroxy anthranilic acid, 5-hydroxy-indole-3-acetic acid, IAA, indole-3-acetyl-glycine, indole-3-lactic acid, indole-3-propionic acid, KA, Kn, melatonin, nicotinamide, nicotinic acid, quinolinic acid, serotonin, tryptamine, Trp, XA | Matrix: Human serum, human urine, cell culture (monocytes and dendritic cells) Internal standard: Isatin for IxS (1 μM) Column: Atlantis T3 (2.1 × 150-mm i.d., 3 μm) reversed-phase column (Waters, Eschborn, Germany) Temperature(s): Column: 25 °C. Mobile phase: A: Water with 0.1% formic acid B: ACN with 0.1% formic acid Gradient: 0.0–1.0 min: 0.0 → 50% B 1.0–6.0 min: 50% B 6.0–6.1 min: 50 → 0.0% B 6.1–10.1 min: 0.0% B A different gradient was used for the positive mode. Injection volume: 10 μL Flow rate: 0.4 mL/min. Retention time: Isatin: 4.86 min IxS: 5.47 min Total run time: 10.1 min based on gradient conditions Study authors’ sample extraction procedure: Preparation of serum and cell culture supernatant: 1. Thaw samples at room temperature; 2. Within 30 min of thawing, add 10 µL of the internal standard mixture to a 50 µL sample; 3. Dilute with water with 0.1% formic acid up to 100 µL; 4. Vortex; 5. Add 400 μL of cold methanol; 6. Vortex; 7. Incubate at −20 °C for 1 h; 8. Centrifuge at 10,000× g and 4 °C for 10 min; 9. Centrifuge the supernatant again; 10. Dry the supernatant with a vacuum evaporator; 11. Dissolve the residue in 100 µL of 0.1% formic acid in water; 12. Centrifuge at 5000× g and 4 °C for 5 min; Preparation of urine samples: 1. Mix 10 µL of urine sample with 10 µL of the internal standard mixture. 2. Dilute the sample up to 100 µL with water containing 0.1% formic acid. 3. Centrifuge at 10,000× g and 4 °C for 10 min. | Mass spectrometry: QTrap (Applied Biosystems) Mode of ionization: negative mode and positive mode, negative for IxS and Isatin Ion source conditions: ESI Ion spray voltage: −4500 V (negative mode), 5500 V (positive more) Curtain gas: 10 psig Ion source temperature: 500 °C Ion source gas 1 and 2: 50 psig Collision gas: medium. (not specified) Scanning mode: MRM m/z transitions: isatin: 145.9 → 118.0 Declustering potential: −60 Collision energy: −30 Cell exit potential: −11 IxS: 212.0 → 80.0 Declustering potential: −45 Collision energy: −16 Cell exit potential: −21 | Validation criteria guideline(s): FDA (d) LLOQ (μg/mL): 0.001 LLOD (μg/mL): 0.0002 Linearity range (μg/mL): 0.001–8.528, R2 = 0.9991 Stability: (b) Recovery concentrations (based on the “slope” method according to the original manuscript): In serum and cell culture, QCs (μg/mL): Low: 1 μM = 0.21321 μg/mL Medium: 2 μM = 0.42642 μg/mL High: 4 μM = 0.85284 μg/mL In urine: not performed Slope 0.79–1.23 (1 indicating 100% recovery based on authors’ definition) Matrix effect defined in “recovery” (according to the original manuscript): In urine, QC: Low: 0.1 μM = 0.0213 μg/mL Medium: 0.2 μM = 0.0426 μg/mL High: 0.4 μM = 0.0852 μg/mL Recovery for IxS between 99–115% In Serum: 2 μM = 0.42642 μg/mL Relative recovery: recovery (%) based on analyte/internal standard area ratio: 90.43% Absolute recovery (%) based on analyte area: 64.22% Storage: Stock solutions storage: −80 °C | Zhu et al. 2011 [32] |
| IxS pCS In addition to other analytes: Creatinine, 4-ethylphenyl sulfate, 1-methyladenosine, PS, TMAO | Matrix: Human plasma/serum Internal standards: isotope-labeled IxS-d4 (100 ng/30 µL) and pCS-d4 (50 ng/30 µL) Column: Scherzo SS-C18 (2 mm i.d. × 50 mm, 3 μm, Imtakt) Also tested: XSELECT CSH C18 (2.1 mm i.d. × 150 mm, 3.5 μm; Waters) Luna Phenyl-Hexyl (2.0 mm i.d. × 100 mm, 3 μm; Phenomenex) SeQuant ZIC-HILIC (2.1 mm i.d. × 50 mm, 3.5 μm; Merck) Scherzo SM-C18 (2 mm i.d. × 50 mm, 3 μm; Imtakt) Scherzo SW-C18 (2 mm i.d. × 50 mm, 3 μm; Imtakt) Pre-column: (2 mm i.d. × 5 mm, 3 μm) Temperature: Column: 55 °C Mobile phase: A: 0.1% acetic acid/20% ACN in water B: 10 mM ammonium acetate/80% ACN in water Gradient: 0.0–1.0 min: 25% B 1.0–4.0 min: 25 → 34% B 4.0–4.1 min: 34 → 60% B 4.1–16.0 min: 60% B 16.0–17.5 min: 100% B 17.5–20.0 min: 100 → 25% B Injection volume: 1 µL Flow rate: 0.2 mL/min; increased to 0.6 mL/min between 16.1 and 18.5 min Retention time: For XSELECT CSH C18, Luna Phenyl-Hexyl, SeQuant ZIC-HILIC, Scherzo SM-C18, Scherzo SW-C18, and Scherzo SS-C18, respectively IxS: 9.66, 8.12, 1.67, 6.60, 6.17, 12.66 min pCS: 10.42, 8.86, 1.19, 6.87, 6.65, 11.51 min Total run time: 20 min Study authors’ sample extraction procedure: 1. Mix 10 µL of plasma/serum with 30 μL of internal standard mixture and 100 µL of ACN containing 0.1% formic acid; 2. Sonicate the mixture for 10 min; 3. Centrifuge at 16,400× g and 4 °C for 15 min; 4. Aliquot 100 µL of supernatant and evaporate to dryness under N2 (15 min, 60 °C); 5. Reconstitute the dry sample with 20 µL of 30% ACN in water. | Note: To enhance ionization, post-column addition of ACN with flow rate 0.1 mL/min, 0.4 mL/min between 1 and 16 min Mass spectrometry: triple-quadrupole (Thermo Fisher Scientific) Mode of ionization: positive mode [0.0–6.5 min] and negative mode [6.5–20 min]. Ion source conditions: ESI Nebulizing and de-solvation gas: N2 Collision gas: Ar Capillary voltage: 4000 V in positive mode and 2500 V in negative mode Sheath gas pressure: 60 psi Auxiliary gas pressure: 60 psi Vaporizer temperature: 500 °C Capillary temperature: 350 °C Collision gas pressure: 2.0 mTorr Scanning mode: MRM m/z transitions, collision energy (CE), and tube lens (TL): IxS: 212.1 → 131.9 CE:24 TL: 95 IxS-d4: 216.0 → 136.0 CE: 24 TL: 95 pCS: 186.8 → 106.9 CE: 26 TL: 73 pCS-d4: 191.0 → 111.1 CE: 26 TL: 73 | Validation criteria guideline(s): Not specified LLOQ (μg/mL): IxS: 1.9 μM = 0.405 μg/mL pCS: 2.7 μM = 0.508 μg/mL LLOD (μg/mL): (b) Linear range (μg/mL): IxS: 0.405–41.490, R = 0.998 pCS: 0.508–24.993, R = 0.999 Intra- and inter-day accuracy and precision: intra-day precision (%) and accuracy (%) (N = 5): IxS (1.95, 7.79, 19.5, and 195 μM = 0.416, 1.661, 4.158, and 41.576 μg/mL): LLOQ: −8.3 and 5.5% Low QC: −8.2 and 2.4% Medium QC: −8.8 and 1.4% High QC: 0.6 and 0.6% pCS (6.64, 13.3, 26.6, 66.4 μM = 1.250, 2.503, 5.006, and 12.496 μg/mL): LLOQ: −8.4 and 2.5% Low QC: −3.0 and 1.9% Medium QC: 1.0 and 2.2% High QC: −3.6 and 2.1% Inter-day precision (%) and accuracy (%) (N = 15): IxS: LLOQ: −7.2 and 9.4% Low QC: −10.0 and 3.8% Medium QC: −8.6 and 2.9% High QC: −1.7 and 3.5% pCS: LLOQ: −4.8 and 6.7% Low QC: −7.4 and 4.4% Medium QC: −1.5 and 5.7% High QC: −1.7 and 6.6% Stability (“mid-range” concentration): Benchtop stability (60 °C, room temperature, and on ice) for 0.5, 1, 3, and 24 h before sample extraction (N = 4). On ice (0.5, 1, 3, and 24 h): IxS: 108.9 ± 2.1%, 103.7 ± 2.6%, 103.3 ± 4.5%, and 92.2 ± 2.5% pCS: 100.6 ± 1.3%, 102.5 ± 1.9%, 107.6 ± 1.9%, and 100.7 ± 1.5% At room temperature: IxS: 109.7 ± 2.7%, 103.8 ± 2.5%, 100.2 ± 5.5%, and 100.9 ± 6.8% pCS: 101.5 ± 0.9%, 103.5 ± 1.4%, 108.0 ± 2.3%, and 100.0 ± 1.8% At 60 °C: IxS: 102.1 ± 3.1%, 97.9 ± 5.7%, 93.5 ± 4.0%, and 102.7 ± 1.7% pCS: 99.0 ± 2.3%, 104.2 ± 3.1%, 104.5 ± 0.7%, and 103.7 ± 2.9% Processed sample stability (60 °C) for (1 and 3 h) after deproteinization. IxS: 102.3 ± 3.6% and 106.3 ± 2.8% pCS: 98.9 ± 3.6% and 95.3 ± 1.3% Matrix effect: Based on a numerical factor calculated as the ratio of the slope between spiked sample matrix to spiked water. IxS: 1.00 pCS: 0.99 Storage: Stock solution storage: −20 °C | Kanemitsu et al. 2017 [50] |
| PLASMA | ||||
| pCS | Matrix: Human plasma Internal standards: p-toluene sulfonic acid sodium salt (pTS) Column: Zorbax SB-C18 column 210 × 30 mm I.D., 3.5 μm, (Agilent Technologies, Waldbronn, Germany). Temperature(s): Column: 40 °C Autosampler: 4 °C Mobile phase: A: 99.9% water/0.1% formic acid B: 99.9% ACN/0.1% formic acid Gradient: 0.0–2.0 min: 20% B 2.0–3.0 min: 20 → 95% B 3.0–7.0 min: 95% B 7.0–7.5 min: 95 → 20% B Injection volume: 1 µL Flow rate: 0.2 mL/min Retention time: pCS: 1.4–1.9 min pTS: 0.8–1.2 min Total run time: 7 min Study authors’ sample extraction procedure: 1. Centrifuge blood at 3000× g at 4 °C for 10 min to obtain plasma; 2. Internal standard was added to the sample (10 µL); 3. Mix 30 µL of sample with 90 µL methanol; 4. Incubate for 20 min at room temperature; 5. Centrifuge at 4000× g and 4 °C for 10 min; 6. Collect and dry supernatant; 7. Reconstitute in the mobile phase. | Mass spectrometry: triple quadrupole (Agilent) Mode of ionization: negative mode Ion source conditions: ESI Gas temperature +300 °C Gas flow: 9 L/min, Nebulizer gas pressure: 35 psi Capillary voltage: 1500 V. Scanning mode: MRM m/z transitions: pTS: 171 → 80, 107.1 CE: 28 and 16 V Fragmentor: 106 V pCS: 187 → 80, 107 CE: 20 and 16 V Fragmentor: 94 V | Validation criteria guideline(s): Not specified LLOQ (μg/mL): (b) LLOD (μg/mL): (b) Calibration range(s): Linearity range (μg/mL): pCS: 0–320 μg/mL R2 = 0.997 ± 0.002 Intra- and inter-day precision (N = 4 preparations): Mean ± 1 standard deviation, C.V.% n1: 0.352 ± 0.006, 1.83 (intra) and 0.342 ± 0.015, 4.28 (inter) n2: 0.435 ± 0.001, 0.21 and 0.441 ± 0.007, 1.63 n3: 0.486 ± 0.022, 4.57 and 0.501 ± 0.033, 6.67 n4: 0.521 ± 0.002, 0.32 and 0.606 ± 0.025, 4.16 Stability: Criteria: Plasma samples: −80 °C for more than 3 months (data not provided) Processed samples: room temperature for 24 h (CV = 9%; accuracy data not provided) Recovery %: Concentrations tested: 20, 40, 80, 160, 320 μg/mL “The theoretical concentrations were compared with the measured concentration values, and the percentage recoveries were calculated for each spiked concentration”. 20: 100.2% 40: 102.0% 80: 100.4% 160: 107.1% 320: 104.0% Storage conditions: Samples solutions storage: −80 °C Stock storage: −20 °C | Cuoghi et al. 2012 [38] |
| IxS | Matrix: Human plasma In addition to the following: 1. other plasma sources: goat, pig, rat, and diabetic nephropathy mouse model; 2. ciPTEC-OAT1 lysate. Internal standard: isotope-labeled IxS potassium salt [13C6]-IxS, 0.5 μg/mL. Column: Polaris 3 C18-A column, 50 × 2 mm, dp = 3 μm, average pore diameter = 10 nm (Varian, Middelburg, The Netherlands). pre-column: 10 × 2 mm Temperature: Column: 40 °C Sample rack: 4 °C Mobile phase: A: 0.1% (v/v) formic acid in water B: ACN Gradient: 0.0–1.5 min: 15 → 35%B 1.5–2.0 min: 100% B 2.0–3.0 min: 15% B Injection volume: 10 µL Flow rate: 0.5 mL/min Total run time: 3 min Retention time: 1.3–1.38 min (In all matrices) Study authors’ sample extraction procedure: 1. Mix 20 µL of plasma with 80 μL of ACN containing 0.5 μg/mL of internal standard; 2. Vortex 2 min; 3. Centrifuge at 2 min at 10,000× g; 4. 64 μL of supernatant mixed with 200 µL of water in a polypropylene 96-deep well plate. | Mass spectrometry: triple quadrupole (Thermo electron) Mode of ionization: negative mode Ion source conditions: ESI Spray voltage: 5000 V Capillary temperature: 320 °C Skimmer voltage: off Collision gas: Ar at 1.4 mTorr Scanning mode: MRM m/z transitions: IxS: 212.0 → 80.0 and 132.0 CE: −24 V, −21 V [13C6]-IxS: 218.0 → 80.0 and 138.0 CE: −27 V, −21 V | Validation criteria: FDA (d) and EMA (f) LLOQ (μg/mL): 0.1 LLOD (μg/mL): 0.03 Precision and accuracy met the acceptance criteria (d, g) for all matrices. Human plasma: 10 and 50 μg/mL. Accuracy: 104.8% and 99.0% Within-day precision: 2.6% and 2% Between day precision: 4% and 3.3% Data for other matrices are available in the original manuscript. Calibration range prepared in 4.2% BSA in water (μg/mL): 0.1–100 R2 = 0.994 ± 0.002 Stability: Criteria (N = 4): Benchtop: 24 h at room temperature Freeze–thaw (3 cycles) Long-term stability: 2 months at −30 °C Human plasma at 2.5 and 75 μg/mL: Benchtop: 99.1 ± 2.3 and 99.8 ± 1.9% Freeze–thaw: 97.9 ± 3.4 and 99.1 ± 0.8% Long-term stability: 96.5 ± 0.6 and 97.5 ± 0.7% Recovery and matrix effect (N = 6):
Human plasma: Recovery: 90% ± 3 (a:b ratio) Matrix effect (IxS): 110% ± 2 (b:c ratio) Matrix effect ([13C6]-IxS): 100% ± 3 (b:c ratio) Storage: −30 °C | Ahmed et al. 2022 [39] |
| IxS In addition to other analytes: CMPF | Matrix: Human plasma Internal standards: isotope-labeled IxS-d4, 5000 ng/mL Column: Waters Acquity BEH Shield RP18 column, dp = 1.7 μm, 2.1 × 50 mm. Pre-column: Waters Acquity BEHShield RP18 VanGuard (1.7 μm, 2.1 × 5 mm). Temperature: Column: 40 °C Mobile phase: A: 0.1% formic acid, 5% ACN, and 2 mM ammonium formate in water, B: 0.1% formic acid, 5% water, and 2 mM ammonium formate in ACN. Gradient: 0.50–4.50 min: 5 → 85% B 4.50–4.51 min: 85 → 95% B 4.51–6.50 min: 95% B 6.50–6.51 min: 95 → 5% B 6.51–8.50 min: 5% B Injection volume: 10 µL Flow rate: 0.3 mL/min Retention time: IxS: 2.3 min Total run time: 8.5 min Study authors’ sample extraction procedure: 1. Mix 20 µL sample with 280 µL phosphoric acid (4%), 50 µL internal standard, and 100 µL methanol (50%v/v); 2. Vortex; 3. Solid-phase extraction (SPE) with Oasis WAX μElution plate [pre-conditioned with 200 μL of methanol and water]: load 400 μL sample, wash with 200 μL water (2% formic acid), and elute using 50 μL of aqueous solution of 0.25% ammonia in methanol; 5. Dilute the extract with 50 μL water. | Mass spectrometry: triple quadrupole (Shimadzu) Mode of ionization: negative mode Ion source conditions: ESI Nebulizer flow rate: 3 L/min Drying flow rate 15 L/min Collision-induced dissociation gas pressure: 230 kPa De-solvation line temperature: 250 °C Heat block temperature: 400 °C. Collision gas: Ar. Scanning mode: MRM m/z transitions: IxS: 212.0 → 132.1 Dwell time: 0.10 s CE:21 V IxS-d4: 216.1 → 136.1 Dwell time: 0.10 s CE: 20 V | Validation criteria guideline(s): FDA (d) LLOQ (μg/mL):0.05 (units in the original manuscript seem to be inconsistent) LLOD (μg/mL): (b) Linearity range (μg/mL): 0.05–200 μg/mL, R2 ≥ 0.9997 Precision and accuracy met the acceptance criteria (d). QC (concentrations + endogenous), concentrations: 0.05, 0.15, 4.5, 150 μg/mL Within batch (endogenous, LLOQ, LQC, MQC, HQC): Sample 1: Accuracy (%): –, 93.3, 92.5, 107.3, and 103.5 Precision (%CV): 8.1, 8.2, 4.4, 1.1, and 2.5 Sample 2: Accuracy (%): –, 97.9, 98.2, 101.0, and 96.2 Precision (%CV): 5.2, 6.4, 5.2, 3.9, and 3.5 Sample 3: Accuracy (%): –, 100.8, 102.9, 106.2, and 99.7 Precision (%CV): 3.9, 8.7, 2.9, 2.5, and 3.4 Batch-to-batch (endogenous, LLOQ, LQC, MQC, HQC): Accuracy (%): –, 97.3, 97.9, 104.9, and 99.8 Precision (%CV): 9.7, 9.3, 6.0, 4.1, and 4.3 Specificity: Tested at LLOQ: no interference was reported. Stability: Autosampler stability at MQC and HQC: 24 h at 20 °C. Accuracy: 91.2–103.4% Freeze–thaw cycles at MQC and HQC: 3 cycles. Accuracy: 97.0–104.7% Carryover: IxS: less than 0.04% Recovery at LQC, MQC, and HQC: mean (range) Processed QCs vs. extracted plasma spiked with QCs (as a percentage) IxS recovery rate: 80.6 (68.6–90.5), 62.5 (46.4–102.6), and 84.7 (47.8–102.8) % IxS mean recovery rate corrected by the internal standard: 100.7 (95.9–107.8), 101.9 (98.8–107.2), and 101.6 (99.7–108.8) Matrix effect at LQC, MQC, and HQC: Extracted plasma spiked with QCs vs. liquid chromatography diluents spiked with QCs (as a percentage) IxS mean (range) matrix effect: 103.8 (96.9–110.6), 100.0 (93.6–104.3), and 103.5 (99.1–107.5) % IxS mean (range) matrix effect corrected by the internal standard: 101.9 (94.6–108.5), 105.5 (104.1–107.4), and 101.1 (97.2–104.5)% Storage: −80 °C | Oda et al. 2022 [51] |
| IxS pCS In addition to other analytes: catechol sulfate, guaiacol sulfate, phenyl sulfate. | Matrix: Human plasma Internal standards: p- p-toluene sulfonic acid (PTSA), 10 μg/mL Column: Agilent eclipse plus C18 column (150 × 4.6 mm; 5 μm particle size), Agilent Technologies (Santa Clara, California, USA) Pre-column: Agilent ZORBAX HILIC PLUS column (100 × 4.6 mm; 3.5 μm particle size), Agilent Technologies (Santa Clara, California, USA) Temperature: column: 25 °C, autosampler: 10 °C Mobile phase: A: water with 5 mM ammonium acetate. B: methanol Gradient: 0.00–2.00 min: 20% → 60%B 2.00–5.00 min: 60% → 90%B 5.00–11.00 min: 90%B 11.00–12.00 min: 90% → 20%B 12.00–15.00 min: 20%B Injection volume: 5 µL Flow rate: 0.6 mL/min Retention time: IxS: 6.26 min pCS: 6.84 min Total run time: 15 min Study authors’ sample extraction procedure: 1. Thaw samples on ice and vortex (1 min); 2. Mix 200 µL plasma sample with 170 µL of ice-cold ACN/0.1% formic acid; 3. Add 30 µL of internal standard (10 µg/mL in ACN); 4. Vortex (5 min); 5. Centrifuge at 8000 rpm for 30 min; 6. Evaporate to dryness (4–6) h under speed vac; 8. Reconstitute with 200 µL ACN in water (1:1 v/v). | Mass spectrometry: triple-quadrupole (Agilent) Mode of ionization: Negative ion mode Ion source conditions: ESI capillary voltage: 4000 V Gas temperature: 2800 C Drying gas flow: 45 L/min Nebulizer gas flow: 8 L/min Capillary current: 4400 nA. Scanning mode: MRM m/z transitions: IxS: 212 → 132, CE: 15 eV, Fragmentor: 100, Dwell time: 200 (unit not provided) pCS: 187 → 107, CE: 22 eV, Fragmentor: 100, Dwell time: 200 PTSA: 171 → 80, CE: 25 eV, Fragmentor: 75, Dwell time: 200 | Validation criteria guideline(s): ICH M10 bioanalytical method validation guideline (h). LLOQ (μg/mL): IxS: 0.05 pCS: 0.05 LLOD (μg/mL): IxS: 0.02 pCS 0.02 Linearity range (μg/mL): 0.05–10, R2 ≥ 0.997 QCs concentrations (μg/mL): LQC: 0.05 μg/mL MQC: 0.2 μg/mL HQC: 1 μg/mL ULOQ: 10 μg/mL Precision and accuracy: Tested with LQC, MQC, and HQC concentrations (N = 6). Accuracy (mean ± SD), Precision (%CV): IxS intra-day: LQC: 0.049 ± 0.004 μg/mL, 8.470% MQC: 0.232 ± 0.0061 μg/mL, 5.534% HQC: 1.175 ± 0.014 μg/mL, 3.706% pCS intra-day: LQC: 0.047 ± 0.008 μg/mL, 0.183% MQC: 0.228 ± 0.0038 μg/mL, 3.601% HQC: 1.093 ± 0.031 μg/mL, 7.821% IxS inter-day: LQC: 0.042 ± 0.0036 μg/mL, 6.864% MQC: 0.204 ± 0.0077 μg/mL, 7.505% HQC: 1.188 ± 0.013 μg/mL, 3.466% pCS inter-day: LQC: 0.049 ± 0.0017 μg/mL, 3.638% MQC: 0.195 ± 0.001 μg/mL, 1.631% HQC: 1.095 ± 0.041 μg/mL, 10.632% Recovery: Processed QCs vs. solvents spiked with QCs (as a percentage) Tested with LQC, MQC, and HQC concentrations. IxS intra-day: LQC: 97.7% MQC: 116.3% HQC: 117.2% pCS intra-day: LQC: 94.1% MQC: 114.2% HQC: 109.3% IxS inter-day: LQC: 85.7% MQC: 101.9% HQC: 118.7% pCS inter-day: LQC: 99.3% MQC: 97.8% HQC: 109.5% Selectivity: By testing the appearance of peaks at the retention times of the analytes when the blank matrix is injected. No peaks appeared. Specificity: tested for analytes at 1 μg/mL with an internal standard of 10 μg/mL. “Chromatograms obtained in the specificity experiment showed clear separation of all the uremic toxins with good resolution”. Carryover: tested with blank sample after LQC, MQC, HQC, and ULOQ. No carryover was reported. Storage: −80 °C | Ragi, N. et al. 2023 [52] |
| IxS In addition to other analytes in plasma: AnA, KA, Kn, IAA, nicotinic acid, serotonin, Trp. In addition to other analytes in gastric juices: AnA, KA, Kn IAA, Nicotinic acid, Trp. | Matrix: IxS only in plasma (serum also mentioned in the original text) Internal standards: Tryptophan-d3 (Trp-d3; negative 20 μM) Column: Atlantis T3 2.1 × 150 mm, 3 μm (Waters, Milford, MA, USA). Temperature(s): Column: 35 °C Autosampler: 4 °C Mobile phase: A: 0.1% formic acid in 95% water B: 0.1% formic acid in 95% methanol Gradient: 0.0–0.5 min: 5% B 0.5–5.0 min: 5 → 15% B 5.0–8.0 min: 15 → 50% B 8.0–14.0 min: 50 → 90% B 14.0–15.0: 90% B 15.0–22.0: 5% B Injection volume: 5 µL Flow rate: 0.2 mL/min Retention time: IxS: 13.5 min Trp-d3: 11.3 min Total run time: 22 min Study authors’ sample extraction procedure: Plasma samples: 1. Mix 50 µL plasma with 10 µL of internal standard; 2. Add 400 μL of ACN and 20 μL of 0.1% formic acid in water; 3. Vortex 30 s and centrifuge at 20,817× g for 10 min (4 °C); 4. Collect 400 µL of the supernatant and evaporate under N2; 5. Reconstitute in 100 μL of 0.1% formic acid in water. | Mass spectrometry: triple quadrupole (AB Sciex) Mode of ionization: negative ionization mode Ion source conditions: Ion Spray Polarity-switch pause time: 700 ms Curtain gas pressure: 35 psi Source temperature: 550 °C Gas source 1: 55 psi Gas source 2: 45 psi Ion spray voltage: +5500 V and −4500 V Scanning mode: MRM m/z transitions: IxS: 211.8 → 79.9 Dwell time: 85 ms “DP” (not defined): −35 V “EP” (not defined): −7 V “CEP” (not defined): −12 V “CE” (not defined): −32 V “CXP” (not defined): 0 V Trp-d3: 205.9 → 115.9 Dwell time: 85 ms “DP”: −40 V “EP”: −10 V “CEP”: −10 V “CE”: −24 V “CXP”: 0 V | Validation criteria guideline(s): FDA (d) LLOQ (μg/mL): 0.021 LLOD (μg/mL): (b) Linearity range (μg/mL): IxS: 0.021–4.264, R2 = 0.9979 QCs [LLOQ (μM) Low (μM) Medium (μM) High (μM)]: IxS: 0.1, 0.25, 2.5, 15 In μg/mL: 0.0213, 0.053, 0.533, and 3.198 Precision and accuracy met the acceptance criteria (d). Accuracy (%): LLOQ, low, medium, and high QC Inter-day (N = 5): 104, 101, 103, and 103 Intra-day (N = 8): 98.1, 95.1, 104, and 97.0 Precision (CV, %): LLOQ, low, medium, and high QC Inter-day (N = 5): 8.59, 6.19, 7.15, and 4.84 Intra-day (N = 8): 6.20, 8.80, 3.40, and 3.00 Stability Freeze–thaw stability: 3 cycles Benchtop stability: 3 h at room temperature Long-term stability: 2, 4, 6 weeks at–80 °C Post-operative stability: 12 and 24 h at 4 °C in the autosampler Processed stability (before reconstitution): 24 h at 4 °C In plasma (IxS) (LQC, MQC, and HQC): Freeze–thaw stability %: Cycle 1: 115%, 102%, and 103% Cycle 2: 108%, 104%, and 98.4% Cycle 3: 117%, 114%, and 109% Benchtop stability (%): 97.3%, 94.1%, and 102% Long-term stability (%): 2 weeks: 106%, 91.3%, and 100% 4 weeks: 102%, 102%, and 103% 6 weeks: 115%, 134%, and 133% Autosampler stability (%): Post-operative stability: 12 h: 103%, 103%, and 99.1% 24 h: 102%, 113%, and 112% Processed stability: 24 h: 97%, 106%, and 101% Recovery/Matrix effect: Recovery: the ratios of analyte peak areas when spiked into a matrix and extracted to analytes spiked into the extracted matrix. IxS: 82.1%, 85.2%, and 83.6% for the low, medium, and high QCs, respectively. Matrix effect: the ratios of analyte peak areas when spiked into the extracted matrix to analytes spiked to neat solution. IxS: 92.6%, 95.8%, and 93.3% for the low, medium, and high QCs, respectively. Storage: stock solutions: −20 °C stability: −80 °C | Choi et al. 2016 [53] |
| IxS, pCS, In addition to: dihydroepiandrosterone sulphate, ethyl-β-D-glucuronide, ethyl sulfate, estrone sulfate resveratrol, L-tartaric acid. | Matrix: serum, plasma, and urine Details are mentioned in the serum section. | Details are mentioned in the serum section. | Details are mentioned in the serum section. | Monosık, R. et. al. 2016 [49] |
| IxS pCS In addition to other analytes: Creatinine, 4-ES, 1-methyladenosine, PS, TMAO. | Matrix: Human plasma/serum Details are mentioned in the serum section. | Details are mentioned in the serum section. | Details are mentioned in the serum section. | Kanemitsu et al. 2017 [50] |
| OTHER MATRICES | ||||
| pCS In addition to other analytes: HA, PAG | Matrix: Human urine Internal standards: 2H3-4-cresol sulfate (30 ng/mL) Column: Waters Acquity UPLC BEH C18 column (1.7 μm, 2.1 × 100 mm) Temperature: Column: 60 °C Mobile phase: A: 0.1% formic acid in water B: 0.1% formic acid in ACN Gradient: 0:00–1:30 min: 5% B 1:30–2:20 min: 5 → 95% B 95%--> 5% B (duration is not clear) Injection volume: 1 µL Flow rate: 0.6 mL/min Retention time: pCS: 1.63–1.64 min Total run time: 5 min [to include both positive mode and negative mode runs, 2 injections] Study authors’ sample extraction procedure: Sample extraction: 1. Collect urine into standard 1-L plastic jars with boric acid; 2. Store aliquots at –20 °C; 3. Specimens were thawed; 4. Dilute the sample 1:1000 in an analytical well plates; 4. 10 µL of each internal standard was added to each well. | Mass spectrometry: triple quadrupole (Waters) Mode of ionization: pCS: negative mode. Ion source conditions: ESI Capillary voltage: 3000 V Extractor voltage: 3 V Source temperature: 150 °C De-solvation temperature: 600 °C Cone gas flow: off De-solvation gas flow: 800 L/hour Collision gas flow: 0.15 mL/min Scanning mode: MRM m/z transitions: pCS: 187 → 106 Cone voltage (CV) = 34 V Collision energy (CE): 22 eV 2H3-4-cresol sulfate: 190 → 110 Cone voltage (CV): 34 Collision energy (CE): 22 eV | Validation criteria guideline(s): FDA (d) LLOQ (μg/mL): 0.001 LLOD (μg/mL): (b) Linearity range (μg/mL): pCS: 0.001–1 [prepared in water and not in urine] R2 > 0.997 Quality control (QCs) concentrations (μg/mL): Low: 0.003, medium: 0.030, high: 0.300 Precision and accuracy: 6 replicates of QCs. Intra-assay: 3.3 (0.1), 28.8 (2.2), and 316.4 (11.1) Precision (CV) for low, medium, and high QC, %: 3.0, 7.6, and 3.5 Accuracy for low, medium, and high QC, %: 110.0, 96.0, and 105.5 Inter-assay: N = 18. Precision for low, medium, and high QC, %: 16.7, 8.6, and 5.5 Accuracy for low, medium, and high QC, %: 100.0, 104.0, and 105.3 Stability: (b) Matrix effect: By serial dilution of real human urine samples and comparing for back-calculated concentrations with the dilution factors (no difference concentrations noted). Assay recovery: not provided Carryover: No significant interfering peaks were observed in blank samples (after each batch run: not clear in the original paper if conducted per standard protocol of following a high QC). | Wijeyesekera et al. 2012 [54] |
| IxS In addition to other analytes Inosine, IAA, Methyl guanidine, N-acetyl arginine, XA. | Matrix: Urine. Internal standards: C6-indoxyl sulfate Column: reverse phase column 1.6 μm Polar C18 (100 × 1.0 mm) (Phenomenex, Luna® Omega) Temperature: Column: 40 °C Mobile phase: A: 0.1% formic acid in water B: ACN Gradient: 0.0–1.0 min: 5% B 1.0–3.5 min: 55% B 3.5–5.0 min: 95% B 5.0–7.5 min: 5% B and re-equilibration Injection volume: 5 µL Flow rate: 0.15 mL/min Retention time: IxS: 2.79 min Total run time: 8.5 min Study authors’ sample extraction procedure: 1. Centrifuge urine samples at 30,000× g for 10 min; 2. Internal standard added to 50 μL of supernatant; 3. Mixture diluted to 150 μL with water. | Mass spectrometry: triple-quadrupole (Waters) Mode of ionization: negative for IxS Ion source conditions: ESI Capillary voltage: 2000 V De-solvation gas flow: 650 L/h De-solvation temperature: 350 °C Source temperature: 150 °C Scanning mode: MRM m/z transitions: IxS: 212.00 → 132.02, CV: 30 V, CE: 20 eV. IxS-C6: 217.85 → 137.99, CV: 30 V, CE: 25 eV. | Validation criteria guideline(s): LLOQ (μg/mL): 0.480 LLOD (μg/mL): 0.0158 Linearity range (μg/mL): IxS: 0.480 to 48 R2 = 0.99977 QC concentrations (μg/mL): Low: 0.1, medium: 1, and high: 5 Intra-day precision (RSD%) and accuracy (%) (N = 5): 5 Replicates in one day for low, medium, and high QCs. RSD = 9.3%; accuracy = 91.8% RSD = 2.8%; accuracy = 97.8% RSD = 0.8%; accuracy = 99.1% Inter-day precision (RSD%) and accuracy (%) (N = 12): 3 replicates in 4 days for low, medium, and high QCs. RSD = 13.2%; accuracy = 90.3% RSD = 5.1%; accuracy = 98.0% RSD = 6.1%; accuracy = 94.0% Stability, 4 QCs (0, low, medium, and high): Autosampler stability (change %): 24 h at 10 °C −0.15%, −0.74%, 1.41%, and −0.36%. Freeze–thaw stability (change %): 3 cycles at −20 °C at 24 h storage 20.10%, 19.47%, 17.08%, and 18.68% Recovery (%): The preparation methods tested are as follows: SPE: OASIS PRIME HLB 30 mg and Oasis MCX 30 mg. Dilution: 1:2 Comparing the concentrations of the analytes in urine QCs (low, medium, and high) to the concentrations obtained from samples prepared in the initial mobile phase solution. SPE (OASIS HLB): 81.8% SPE (Oasis MCX): 7.9% Dilution (1:2): 108.7% Dilution provided better recoveries and was used for later analysis. Matrix effect: Comparing the internal standard intensity in urine to the same concentrations prepared in standard solutions. IxS: 17% Storage: −20 °C | Olesova et al. 2020 [55] |
| IxS In addition to other analytes: AnA, 3-hydroxykynurenine, hydroxy anthranilic acid, 5-hydroxy-indole-3-acetic acid, IAA, indole-3-acetyl-glycine indole-3-lactic acid, indole-3-propionic acid, KA, Kn, melatonin nicotinamide, nicotinic acid, quinolinic acid, serotonin, tryptamine, Trp, XA. | Matrix: Human serum, human urine, cell culture Details are mentioned in the serum section. | Details are mentioned in the serum section. | Details are mentioned in the serum section. | Zhu et al. 2011 [32] |
| IS, pCS, In addition to: dihydroepiandrosterone sulphate, ethyl-β-D-glucuronide, ethyl sulfate, estrone sulfate resveratrol, L-tartaric acid. | Matrix: serum, plasma, and urine Details are mentioned in the serum section. | Details are mentioned in the serum section. | Details are mentioned in the serum section. | Monosık, R. et. al. 2016 [49] |
| IxS pCS | Matrix: Human saliva Internal standards: isotope-labeled IxS-d4, pCS-d7 (stock 1 mg/mL) Column: Kinetex C-18 column (100 mm, 4.6 mm, particle size 2.6 mm) (Phenomenex, Torrance, CA, USA). Temperature(s): Column: 40 °C Mobile phase: A: formic acid 0.1% in water B: formic acid 0.1% in methanol Gradient: 0.00–0.50 min: 10% B 0.50–4.50 min: 10 → 95% B 4.50–8.50 min: 95% B Injection volume: 10 µL Flow rate: 0.5 mL/min Retention time: IxS: 6.29 min pCS: 6.98 min Total run time: (b) Study authors’ sample extraction procedure: Blank samples were obtained by incubating saliva with activated charcoal for 30 min. Samples were collected using cotton swabs. 1. Centrifuge the cotton swabs at 945× g at 20 °C for 3 min; 2. Store the saliva at–80 °C before analysis; 3. Add ACN 1:4, v/v; 4. Incubate at −20 °C for 20 min; 5. Centrifuge at 9300× g and 4 °C for 10 min; 6. Use the supernatant for the assay. | Mass spectrometry: hybrid triple quadrupole/linear ion trap (AB Sciex) Mode of ionization: Ion source conditions: ESI Curtain gas: N2, 241 kPa Ion source gas 1: N2, 413 kPa Ion source gas 2: N2, 275 kPa Ion spray voltage: 4500 V Ion source temperature: 600 °C Scanning mode: MRM m/z transitions: IxS: 211.9 → 79.8 Declustering potential: −60 V CE: −38 V Entrance potential: −10 V Collision exit potential: −5 V IxS-d4: 216.0 → 79.9 Declustering potential: −65 V CE: −28 V Entrance potential: −10 V Collision exit potential: −7 V pCS: 186.9 → 106.9 Declustering potential: −65 V CE: −28 V Entrance potential: −10 V Collision exit potential: −7 V pCS-d7: 194.0 → 114.0 Declustering potential (DP): −60 V CE: −30 V Entrance potential: −10 V Collision exit potential: −7 V | Validation criteria guideline(s): EMA (f) and FDA (d) LLOQ (μg/mL): IxS: 0.0015 pCS: 0.0015 LLOD (μg/mL): (b) Linearity range (μg/mL): IxS: 0.0015–0.2, R2 = 0.999 pCS: 0.0015–0.5, R2 = 0.999 QCs concentrations: IxS: 1.5, 2, 80, and 150 ng/mL pCS: 1.5, 4.5, 250, and 500 ng/mL Within-run (N = 5) and between run (N = 20) precision and accuracy IxS: Within-run precision (%): 3.2–6.4, 2.6–6.5, 2.2–5.5, and 2.2–5.8 Within-run accuracy (%): 110–114, 87–92, 98–103, and 101–105 Between-run precision (%): 4.8, 4.7, 4.2, and 4.3 Between-run accuracy (%):113, 90, 102, and 103 pCS: Within-run precision (%):1.7–2.7, 0.9–4.7, 0.5–4.1, and 2.2–6.9 Within-run accuracy (%):103–118, 85–88, 91–102, and 97–105 Between-run precision (%):3.4, 3.5, 3.3, and 4.7 Between-run accuracy (%):108, 85, 92, and 103 Stability Performed for low and high QCs. Expressed as stability% (calculation method not defined in the manuscript) and accuracy% - freeze–thaw stability (3 cycles, N = 10). IxS: low QC (109 and 99)%, high QC (103 and 108)% pCS: low QC (114 and 99)%, high QC (105 and 109)% - short-term stability (4 h at room temperature, N = 10). IxS: low QC (95 and 86)%, high QC (110 and 98)% pCS: low QC (110 and 96)%, high QC (100 and 104)% - long-term stability (30 days at −20 °C, N = 30). IxS: low QC (99–103 and 90–103)%, high QC (92–115 and 96–114)% pCS: low QC (111 and 96–97)%, high QC (85–102 and 88–106)% - autosampler stability (24 h, N = 10): IxS: low QC (98 and 89)%, high QC (99 and 104)% pCS: low QC (98 and 85)%, high (96 and 99)% - autosampler stability (48 h, N = 10): IxS: low QC (98 and 89)%, high QC (101 and 106) pCS: low QC (99 and 86)%, high QC (101 and 105) - dilution integrity, n = 5 (dilution factor not provided). IxS: RSD 4.6% and accuracy 105% pCS: RSD 1.7% and accuracy 90% Matrix effect: The difference between standard solution and post-extraction spiked samples. Absolute matrix effect for IxS and the internal standard: Low concentration: 99% and 99% Medium concentration: 93% and 92% High concentration: 95% and 95% Absolute matrix effect for pCS and the internal standard: Low concentration: 100% and 99% Medium concentration: 103% and 101% High concentration: 99% and 96% Storage: Storage (long-term stability): −20 °C stock solutions, QCs samples, and calibration standards: −26 °C | Giebułtowicz et al. 2016 [56] |
| IxS pCS In addition to: CMPF, HA, 3-IAA, KA, Kn, pCG, PAG, TMAO, Tyr, Phenylalanine, Trp. | Matrix: saliva According to the original manuscript, the analytical method was similar to their previously published assay [31]. It was discussed earlier in the serum section. The following details were provided. Column: AccucoreTM PFP column (100 × 2.1 mm, 2.6 μm, Thermo Fisher Scientific). Temperature: 40 °C Mobile phase: A: 0.1% formic acid in water. B: ACN. Gradient: 0.0–1.0 min: 1% B 1.0–6.5 min: 65% B 6.6–8.0 min: 90% B 8.1 min: 1% B Flow rate: 0.5 mL/min Retention time: IxS: 5.75 min pCS: 6.18 min Study authors’ sample extraction procedure: Unstimulated saliva was collected (1 mL) into a plastic tube and frozen at −80 °C. 1. Mix 50 µL of saliva with 25 µL of the internal standard mixture and methanol (340 µL); 2. Homogenize and centrifuge at 9000× g and 4 °C for 10 min; 3. completely dry the supernatant; 4. Reconstitute the residue with water (80 µL). | According to the original manuscript, the analytical method was similar to their previously published assay [31]. It was discussed earlier in the serum section. The following details were mentioned. Mass spectrometry: triple-quadrupole (Thermo) Mode of ionization: Negative mode for IxS and pCS. Ion source conditions: ESI Scanning mode: MRM m/z transitions: IxS: 212.1 → 80.0 and 81.0 Collision energy: 23 V and 17 V pCS: 187.1 → 107.1 V and 105.1 V Collision energy: 21 V and 34 V | Validation criteria guideline(s): LLOQ (μg/mL): IxS: 0.001 μg/mL pCS: 0.001 μg/mL LLOD (μg/mL): IxS: 0.0003 μg/mL pCS: 0.0003 μg/mL Linearity range (μg/mL): IxS: 0.001–50 μg/mL, R2= 0.9993 ± 0.0006 pCS: 0.001–50 μg/mL, R2= 0.9995 ± 0.0004 QCs concentrations: 30, 150, 8000, 40,000 ng/mL Accuracy and precision (N = 6) on 3 different days: Intra-day for 30, 150, 8000, and 40,000 ng/mL, respectively: Accuracy (Bias %): IxS: 3.3%, 6.7%, −1.7%, and 6.7%, respectively pCS: 10.0%, 0.0%, 2.4%, and 1.9%, respectively Precision (CV%): IxS: 8.8%, 4.3%, 10.1%, and 7.6%, respectively pCS: 7.8%, 4.9%, 7.0%, and 8.1%, respectively Inter-day for 30, 150, 8000, and 40,000 ng/mL, respectively: Accuracy IxS: 1.3%, 3.3%, −5.1%, and −2.2%, respectively pCS: 10.0%, −1.3%, −2.2%, and −1.8%, respectively Precision IxS: 3.3%, 5.9%, 7.0%, and 10.9%, respectively pCS: 4.4%, 6.6%, 8.0%, and 6.4%, respectively Carryover: Chromatography of blank injection after 3 injections of high concentration (not determined) had no peaks (no carryover) Stability (numerical data not provided in the original manuscript): 20 °C: not stable for 5 h 4 °C: stable up to 24 h −20 °C: stable for up to three months Freeze–thaw: stable up to 3 cycles Matrix effect% with (CV%), N = 6, for 100 and 1000 ng/mL, respectively: By comparing the peak area of internal standards prepared in saliva to the peak area of the same concentrations prepared in water. IxS: +4 (11%) and −7 (13%), respectively pCS: +4 (13%) and −2 (11%), respectively Storage: Saliva (not processed): −80 °C Stability storage: −20 or −80 °C (not specified) | Fabresse N, et al. 2023 [57] |
| pCS In addition to other 50 salivary metabolites | Matrix: saliva Internal standards: L-phenylalanine-13C6 or L-leucine-13C6 Column: Hypersil GOLD™ VANQUISH™ C18 UHPLC column (2.1 mm × 150 mm, 1.9 µm; Thermo scientific) Temperature(s): 45 °C Mobile phase: A: 0.1% formic acid in water B: 0.1% formic acid in methanol Gradient: 0.0–1.0 min: 0.0%B 1.0–8.0 min: 0.0–50.0%B 8.0–10.0 min: 50.0–100.0%B 10.0–12.0 min: 100.0%B 12.0–12.1 min: 100.0–0.0%B 12.1–16.0 min: 0.0%B Injection volume: 5 μL Flow rate: 0.3 mL/min Retention time: 7.85 min Total run time: 16 min Study authors’ sample extraction procedure: Unstimulated saliva: 1. Collected in a 50 mL Falcon® polypropylene tube; 2. Collect at least 3 mL of saliva; 3. Centrifuge at 12,000 rpm and 4 °C for 5 min. Stimulated saliva: 1. Collect the sample by chewing salivettes (Sarstedt Co. Ltd., Nu¨mbrecht, Germany) for 2 min; 2. Centrifuged at 12,000 rpm and 4 °C for 5 min; Supernatants are extracted or stored at –80 °C. Sample preparation/extraction: 1. Mix 100 µL of the sample with 400 µL of ACN (1:4); 2. Vortex (2 min); 3. Centrifuge at 12,000 rpm and 4 °C for 15 min; 4. Supernatant is completely evaporated using N2; 5. reconstitute with water (volume not specified). | Mass spectrometry: QTOF (AB Sciex) Mode of ionization: negative Ion source conditions: ESI Scanning mode: MRM Ion spray voltage: −4500 V Temperature: 500 °C, Curtain gas: 30 psi, De-clustering potential: ±90 V, Collision energy: −20 V. Drying gas: N2 Nebulizing gas: N2 Collision gas: N2 m/z transitions: pCS: 187.01 → 79.9665 CE: −20 | Validation criteria guideline(s): The following tests were applied using artificial saliva. LLOQ (μg/mL): pCS: 0.02 μM = 0.003764 μg/mL LLOD (μg/mL): pCS: 0.01 μM = 0.001882 μg/mL Linearity range (μg/mL): pCS: 0.1–5 μM = 0.0188–0.9410 μg/mL, R2 = 0.9988 QCs concentrations: Low QC: 0.5 μM = 0.0941 μg/mL Middle QC: 2 μM = 0.3764 μg/mL High QC: 4 μM = 0.7528 μg/mL Accuracy (error, %) and precision (RSD, %): Intra-day (N = 5) for low-, middle-, and high-quality control concentration: Accuracy: 4.88%, 1.90%, and 0.16% Precision: 5.75%, 3.78%, and 3.62% Inter-day (N = 5) for low-, middle-, and high-quality control concentration: Accuracy: 0.32%, 3.42%, and −3.83% Precision: 2.72%, 3.50%, and 6.64% Extraction solvent: Saliva/ACN (1:4): lowest intensity for large molecules Saliva/Methanol (1:4): highest intensity for large molecules ACN: the best in protein precipitation and cleaning the sample (more suitable for salivary extraction) | Nam M, et al. 2023 [58] |
| SERUM | |
|---|---|
OBJECTIVE:
SAMPLE POPULATION (N = 78):
ADDITIONAL PUBLISHED BIOLOGICAL APPLICATIONS:
| Boelaert et al. 2013 [40] |
OBJECTIVE:
SAMPLE POPULATION (N = 488):
ADDITIONAL PUBLISHED BIOLOGICAL APPLICATIONS CITING THIS ASSAY: Hobson S, et al., 2022 [75]: OBJECTIVE:
SAMPLE POPULATION (N = 611):
te Linde E, et al., 2020 [76]: OBJECTIVE:
SAMPLE POPULATION (N = 28):
Cognitive Assessments:
- Serum concentrations of 16 uremic toxins were obtained within 24 h of NPAs. In kidney transplant subjects, samples were also obtained from 1–2 days before and 2–3 days after transplantation. - Uremic toxins concentrations were lower in group 3 compared to groups 1 and 2. - Group 1: IxS: 97.94, 115.66, 4.03, 5.05, and 5.57 µM equivalent to 20.88, 24.66, 0.86, 1.08, and 1.19 µg/mL (visit 1, pre-transplantation, post-transplantation, visit 2, and visit 3). pCS: 153.65, 203.59, 28.98, 11.66, and 13.38 µM equivalent to 28.92, 38.32, 5.45, 2.19, and 2.52 µg/mL (visit 1, pre-transplantation, post-transplantation, visit 2, and visit 3). - Groups 2 and 3 did not show significant changes in uremic toxin concentrations over time. Biruete A, et al., 2020 [77]: OBJECTIVE:
SAMPLE POPULATION (N = 12):
- Inulin had an impact on the gut microbiota composition. - Inulin was not able to reduce the fecal concentrations of p-cresol or indoles or plasma concentrations of pCS or IxS (compared to maltodextrin, which also has an effect on gut microbiota). Vandenbosch I, et al., 2021 [78]: OBJECTIVE:
SAMPLE POPULATION (N = 20):
Nazzal L, et al., 2021 [79]: OBJECTIVE:
SAMPLE POPULATION (N = 10):
Dai L, et al., 2020 [80]: OBJECTIVE:
SAMPLE POPULATION (N = 423):
Etinger A, et al., 2018 [81]: OBJECTIVE:
SAMPLE POPULATION (N = 8):
Deltombe O, et al., 2017 [82]: OBJECTIVE:
SAMPLE POPULATION (N =79):
Keddar M, et al., 2020 [83]: OBJECTIVE:
SAMPLE POPULATION (N = 101):
| de Loor et al. 2016 [42] |
OBJECTIVE:
SAMPLE POPULATION (N = 230):
Spearman’s correlations in CKD subjects: IxS-free with:
ADDITIONAL PUBLISHED BIOLOGICAL APPLICATIONS CITING THIS ASSAY: Chen X, et al., 2018 [84]: OBJECTIVE:
SAMPLE POPULATION (N = 60):
Wang SC, et al., 2021 [85]: OBJECTIVE:
SAMPLE POPULATION (N = 155):
| Shu et al. 2016 [37] |
OBJECTIVE:
SAMPLE POPULATION (N = 10):
ADDITIONAL PUBLISHED BIOLOGICAL APPLICATIONS CITING THIS ASSAY: Kolachalama VB, et al., 2018 [86]: OBJECTIVE:
SAMPLE POPULATION (N = 470):
| Zhang et al. 2017 [43] |
OBJECTIVE:
SAMPLE POPULATION:
ADDITIONAL PUBLISHED BIOLOGICAL APPLICATIONS CITING THIS ASSAY: Lai YR, et al., 2022 [87]: OBJECTIVE:
SAMPLE POPULATION (N = 54):
Wu IW, et al. 2020, a [88]: Assay: cited Lin 2019, but used an apparently different ultra-centrifugal filter OBJECTIVE:
SAMPLE POPULATION (N = 77):
Wu IW, et al. 2020, b [89]: Assay: cited Lin 2019, but used an apparently different ultra centrifugal filter and a slightly different mobile phase (addition of 1 mM ammonium acetate to organic phase) OBJECTIVE:
SAMPLE POPULATION (N = 130):
AUTHORS’ KEY FINDINGS:
Cheng BC, et al. 2020 [90]: Assay: cited Lin 2019 but with different sample/acetonitrile volume, centrifugation duration, and vortex duration. OBJECTIVE:
SAMPLE POPULATION (N = 75):
CAF in Group 1 (one day before PD), Group 2 (disease group), and Group 3 (control group), respectively:
Hsu CK, et al., 2022 [91]: Assay: cited Lin 2019 but used a different ultra centrifugal filter. OBJECTIVE:
SAMPLE POPULATION (N = 56):
| Lin et al. 2019 [29] |
OBJECTIVE:
AUTHORS’ KEY FINDINGS:
| Prokopienko et al. 2019 [44] |
OBJECTIVE:
SAMPLE POPULATION (N = 8):
ADDITIONAL PUBLISHED BIOLOGICAL APPLICATIONS CITING THIS ASSAY: André C, et al., 2021 [92]: OBJECTIVE:
SAMPLE POPULATION (N = 403):
Group 1 and Group 2 uremic toxins concentrations and biochemistry data:
Univariate logistic regression of pCS and concurrent OAT1/OAT3 inhibitor (p = 0.001); Multi-variate logistic regression (incorporating age, eGFR, albumin) of pCS and concurrent OAT1/OAT3 (p = 0.007). André C, et al., 2022 [93]: OBJECTIVE:
SAMPLE POPULATION (N = 403):
Batteux B, et al., 2021 [94]: OBJECTIVE:
SAMPLE POPULATION (310):
| André et al. 2020 [45] |
OBJECTIVE:
SAMPLE POPULATION (N = NA):
ADDITIONAL PUBLISHED BIOLOGICAL APPLICATIONS CITING THIS ASSAY: El Chamieh C, et al., 2023 [95]: OBJECTIVE:
SAMPLE POPULATION (N = 680):
Fabresse N, et al., 2023 [57]: OBJECTIVE:
SAMPLE POPULATION (N = 18):
Massy ZA, et al., 2021 [96]: OBJECTIVE:
SAMPLE POPULATION (795):
| Fabresse et al. 2020 [31] |
OBJECTIVE:
SAMPLE POPULATION (66):
pCS: Patients with ESRD in vivo (%) (N = 10): 93 ± 3
| Ma et al., 2020 [46] |
OBJECTIVE:
SAMPLE POPULATION (N = 81):
| Wang et al. 2020 [47] |
| No uremic toxin concentrations or biological findings were reported in Monosik 2016 [49]. | Monosık, R. et. al, 2016 [49] |
| No uremic toxin concentrations or biological findings were reported by Zhu et al., 2011 [32] ADDITIONAL PUBLISHED BIOLOGICAL APPLICATIONS CITING THIS ASSAY: Kuo SZ, et al., 2021 [97]: OBJECTIVE:
SAMPLE POPULATION (N = 78):
| Zhu et al. 2011 [32] |
OBJECTIVE(S):
SAMPLE POPULATION (N = 19):
| Kanemitsu et al. 2017 [50] |
| PLASMA | |
OBJECTIVE(S):
SAMPLE POPULATION (N = 25):
| Cuoghi et al. 2012 [38] |
OBJECTIVE:
SAMPLE POPULATION (N = 6):
| Ahmed et al. 2022 [39] |
OBJECTIVE:
SAMPLE POPULATION (N = 40):
| Oda et al. 2022 [51] |
OBJECTIVE:
SAMPLE POPULATION (N = 164):
| Ragi, N. et al. 2023 [52] |
OBJECTIVE:
SAMPLE POPULATION (N = 52):
| Choi et al. 2016 [53] |
| Details are mentioned in the serum section. | Monosık, R. et al. 2016 |
| Details are mentioned in the serum section. | Kanemitsu et al. 2017 [50] |
| OTHER MATRICES | |
OBJECTIVE:
SAMPLE POPULATION (N = 2000):
AUTHORS’ KEY FINDINGS: pCS concentrations, mean ±SD: Group 1: 63.0 ±47.4 μmol/mmol creatinine and 1002.5 ± 737.1 μmol/24-h. Group 2: 103.1 ±71.2 μmol/mmol creatinine and 1031.8 ± 687.9 μmol/24-h. pCS concentration in each group, mean ± SD (median) µg/mL:
| Wijeyesekera et al. 2012 [54] |
OBJECTIVE:
SAMPLE POPULATION (N = 90):
| Olesova et al. 2020 [55] |
| Details are mentioned in the serum section. | Monosık, R. et al. 2016 |
| Details are mentioned in the serum section. | Zhu et al. 2011 [32] |
OBJECTIVE:
SAMPLE POPULATION (N = 70):
Group 1: < 30 years, 30–60 years, and > 60 years old
ADDITIONAL PUBLISHED BIOLOGICAL APPLICATIONS CITING THIS ASSAY: Korytowska, N.; et al., 2021 [66] Assay: cited Giebultowicz [56] but analyzed both saliva and serum (not originally validated). OBJECTIVE:
SAMPLE POPULATION (N = 92):
Korytowska N, et al., 2018 [98]: Assay: cited Giebultowicz [56] with slight changes to ion source gas parameter but analyzed both saliva and serum (not originally validated). OBJECTIVE:
SAMPLE POPULATION (N = 119):
| Giebułtowicz et al. 2016 [56] |
Disclaimer/Publisher’s Note: The statements, opinions and data contained in all publications are solely those of the individual author(s) and contributor(s) and not of MDPI and/or the editor(s). MDPI and/or the editor(s) disclaim responsibility for any injury to people or property resulting from any ideas, methods, instructions or products referred to in the content. |
© 2024 by the authors. Licensee MDPI, Basel, Switzerland. This article is an open access article distributed under the terms and conditions of the Creative Commons Attribution (CC BY) license (https://creativecommons.org/licenses/by/4.0/).
Share and Cite
Al-Dajani, A.R.; Hou, Q.K.; Kiang, T.K.L. Liquid Chromatography-Mass Spectrometry Analytical Methods for the Quantitation of p-Cresol Sulfate and Indoxyl Sulfate in Human Matrices: Biological Applications and Diagnostic Potentials. Pharmaceutics 2024, 16, 743. https://doi.org/10.3390/pharmaceutics16060743
Al-Dajani AR, Hou QK, Kiang TKL. Liquid Chromatography-Mass Spectrometry Analytical Methods for the Quantitation of p-Cresol Sulfate and Indoxyl Sulfate in Human Matrices: Biological Applications and Diagnostic Potentials. Pharmaceutics. 2024; 16(6):743. https://doi.org/10.3390/pharmaceutics16060743
Chicago/Turabian StyleAl-Dajani, Ala’a R., Qi Kun Hou, and Tony K. L. Kiang. 2024. "Liquid Chromatography-Mass Spectrometry Analytical Methods for the Quantitation of p-Cresol Sulfate and Indoxyl Sulfate in Human Matrices: Biological Applications and Diagnostic Potentials" Pharmaceutics 16, no. 6: 743. https://doi.org/10.3390/pharmaceutics16060743
APA StyleAl-Dajani, A. R., Hou, Q. K., & Kiang, T. K. L. (2024). Liquid Chromatography-Mass Spectrometry Analytical Methods for the Quantitation of p-Cresol Sulfate and Indoxyl Sulfate in Human Matrices: Biological Applications and Diagnostic Potentials. Pharmaceutics, 16(6), 743. https://doi.org/10.3390/pharmaceutics16060743