
Integrated QSAR Models for Prediction of Serotonergic Activity: Machine Learning Unveiling Activity and Selectivity Patterns of Molecular Descriptors


Abstract

1. Introduction
2. Materials and Methods
2.1. Databases
2.2. Molecular Descriptors
2.3. Metrics
2.4. Binary Classification for Serotonergic Activity
2.5. Multiclass Classification for Compounds with Selective Affinity to Serotonin Receptors
2.6. Seeking Differentiating Descriptors
2.6.1. SHAP Analysis
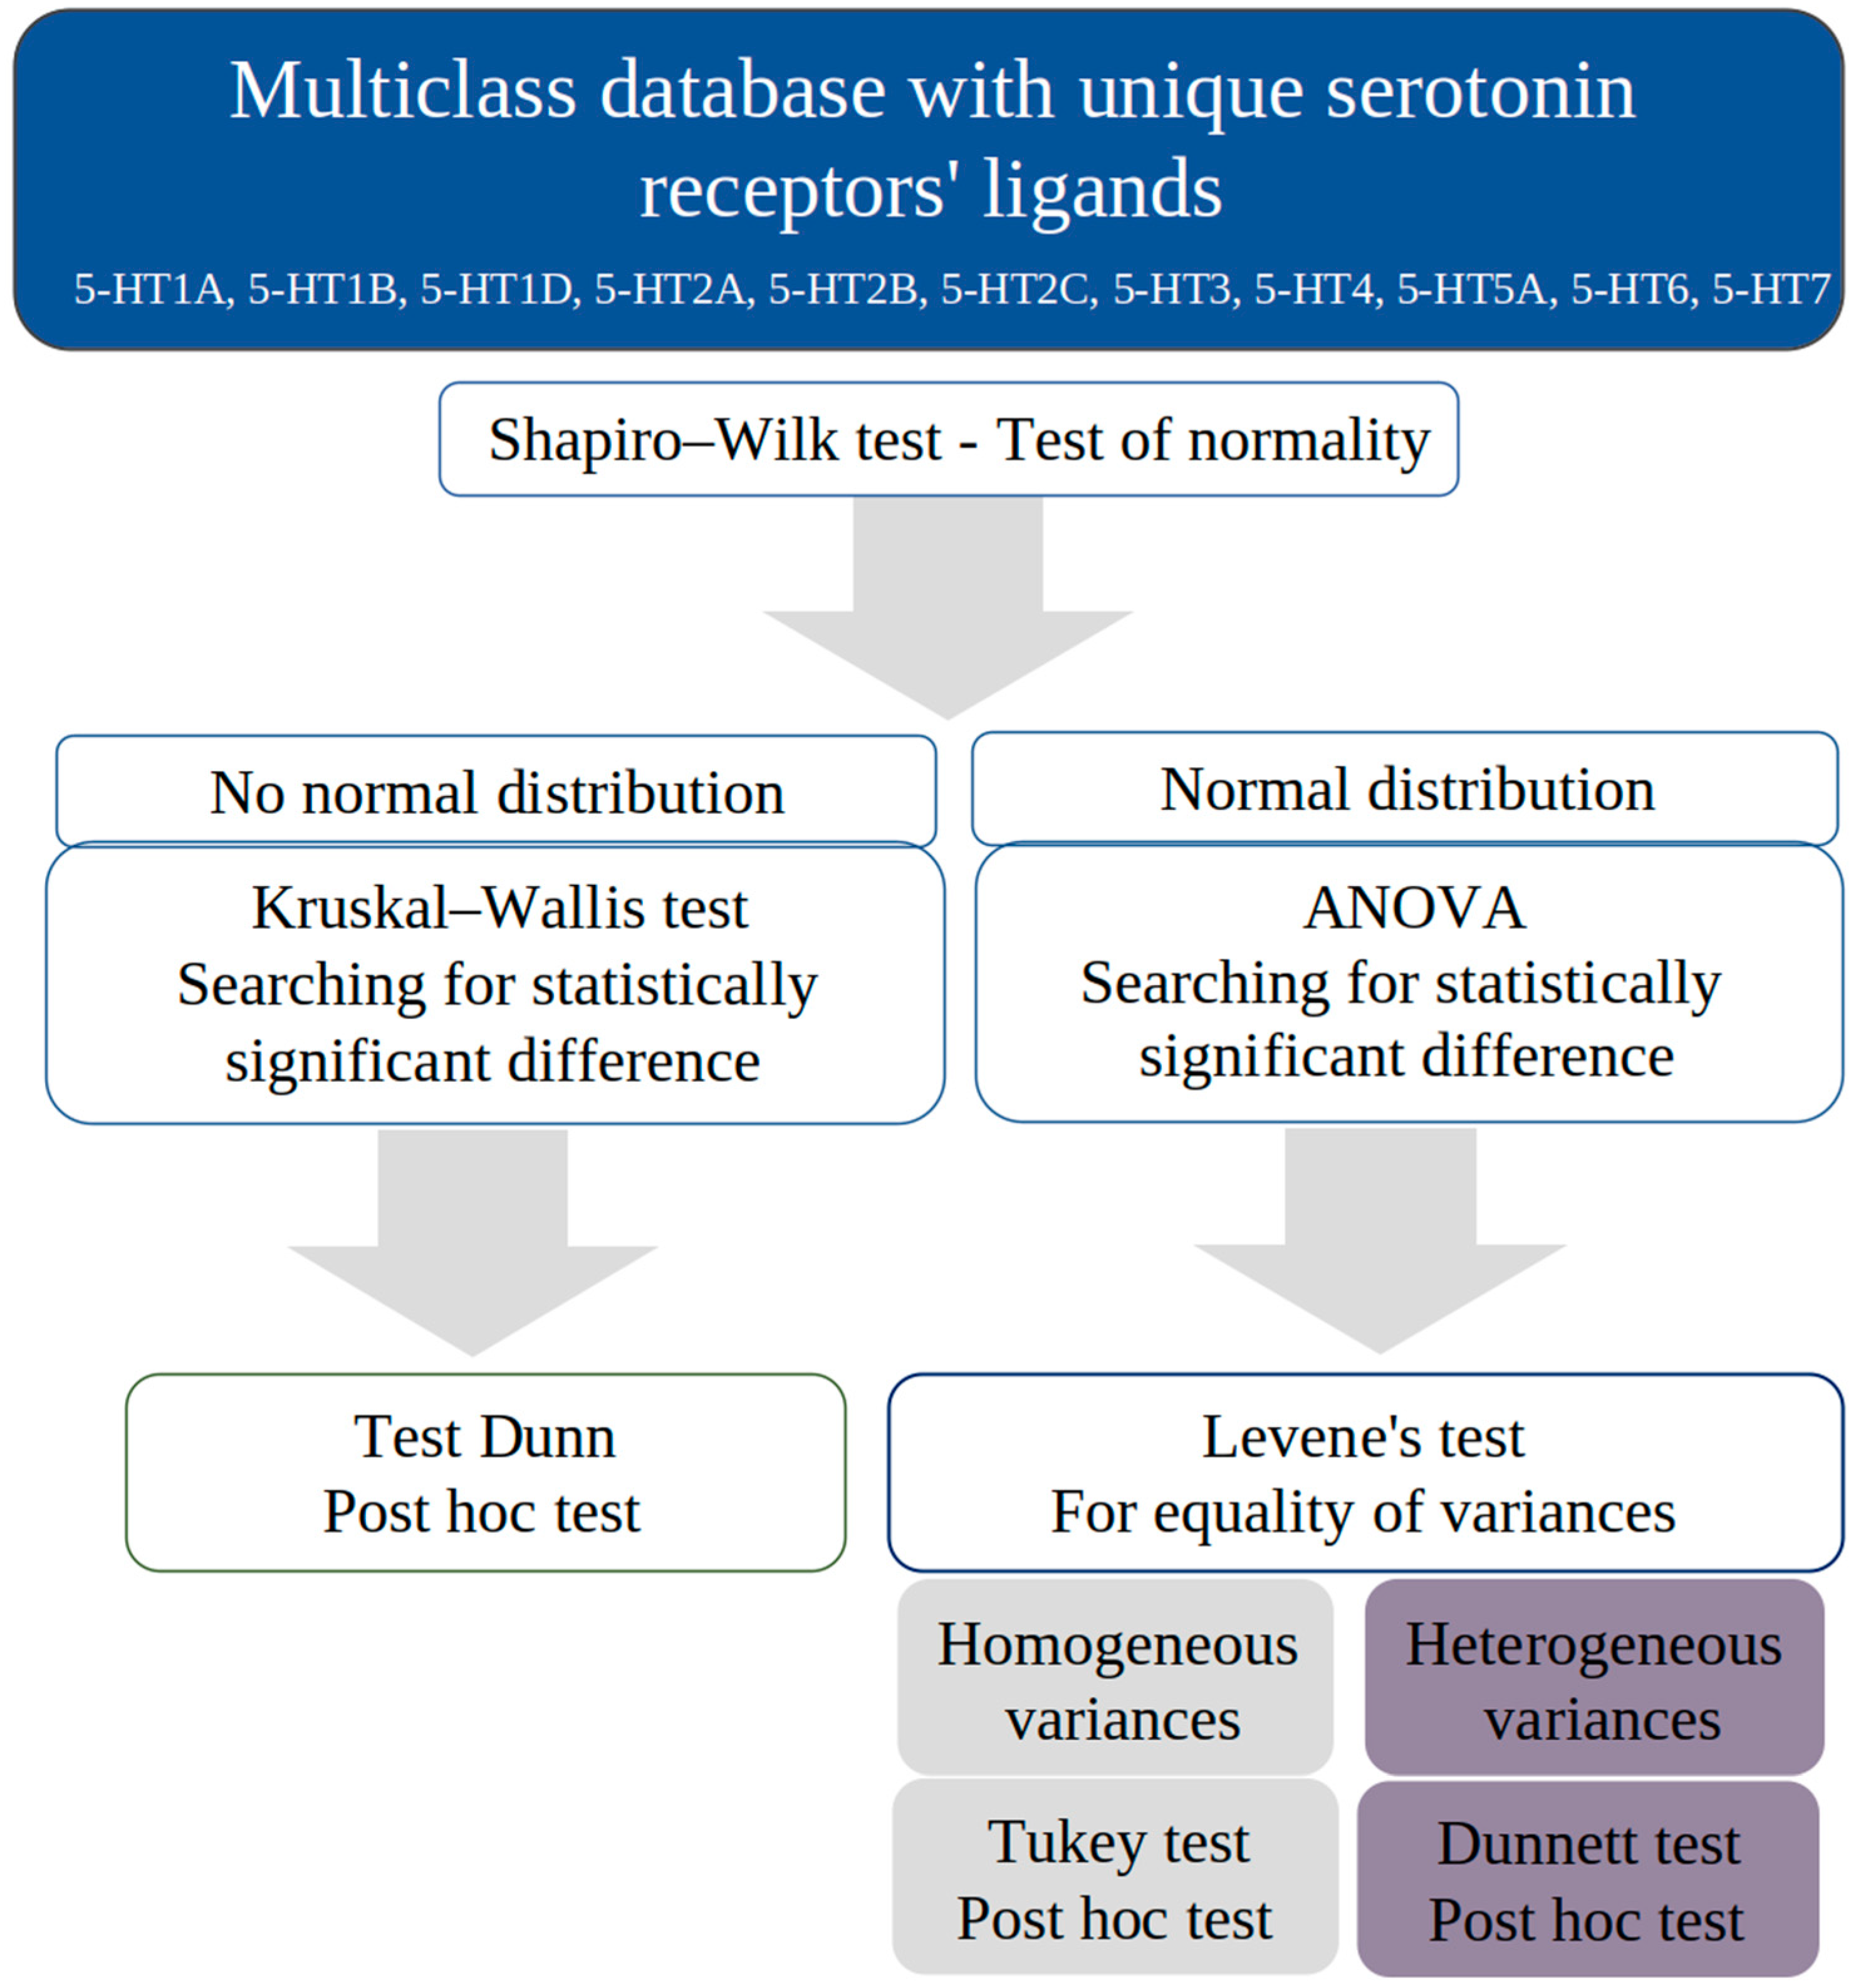
2.6.2. Statistical Methods
3. Results
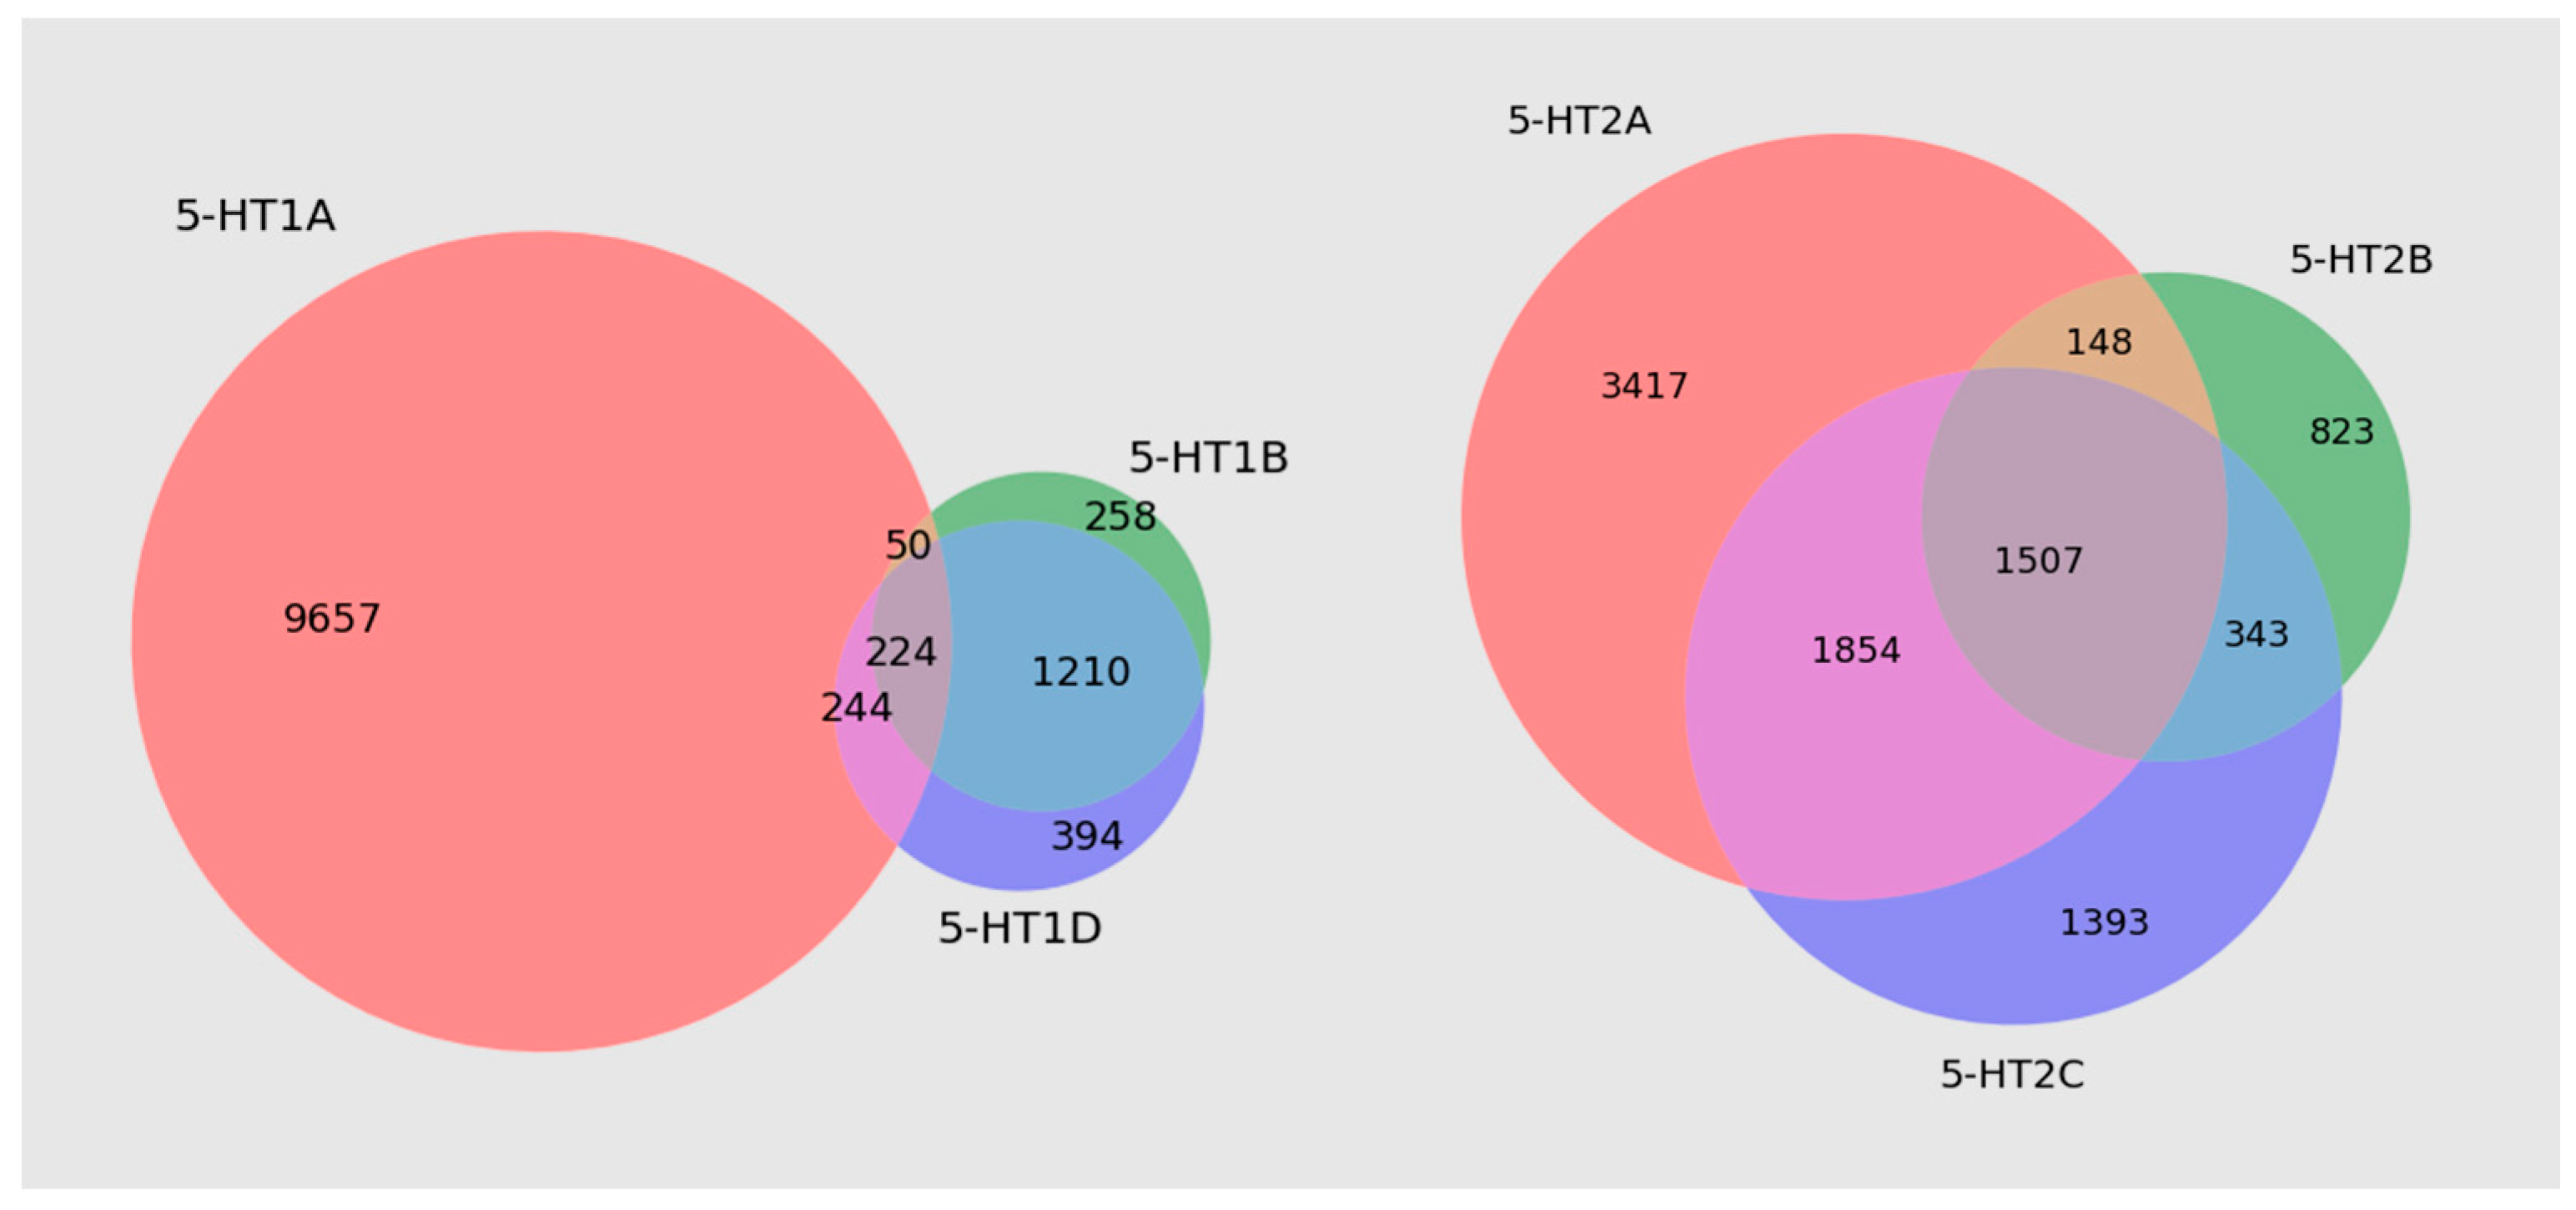
3.1. Databases
3.2. Statistical Approach
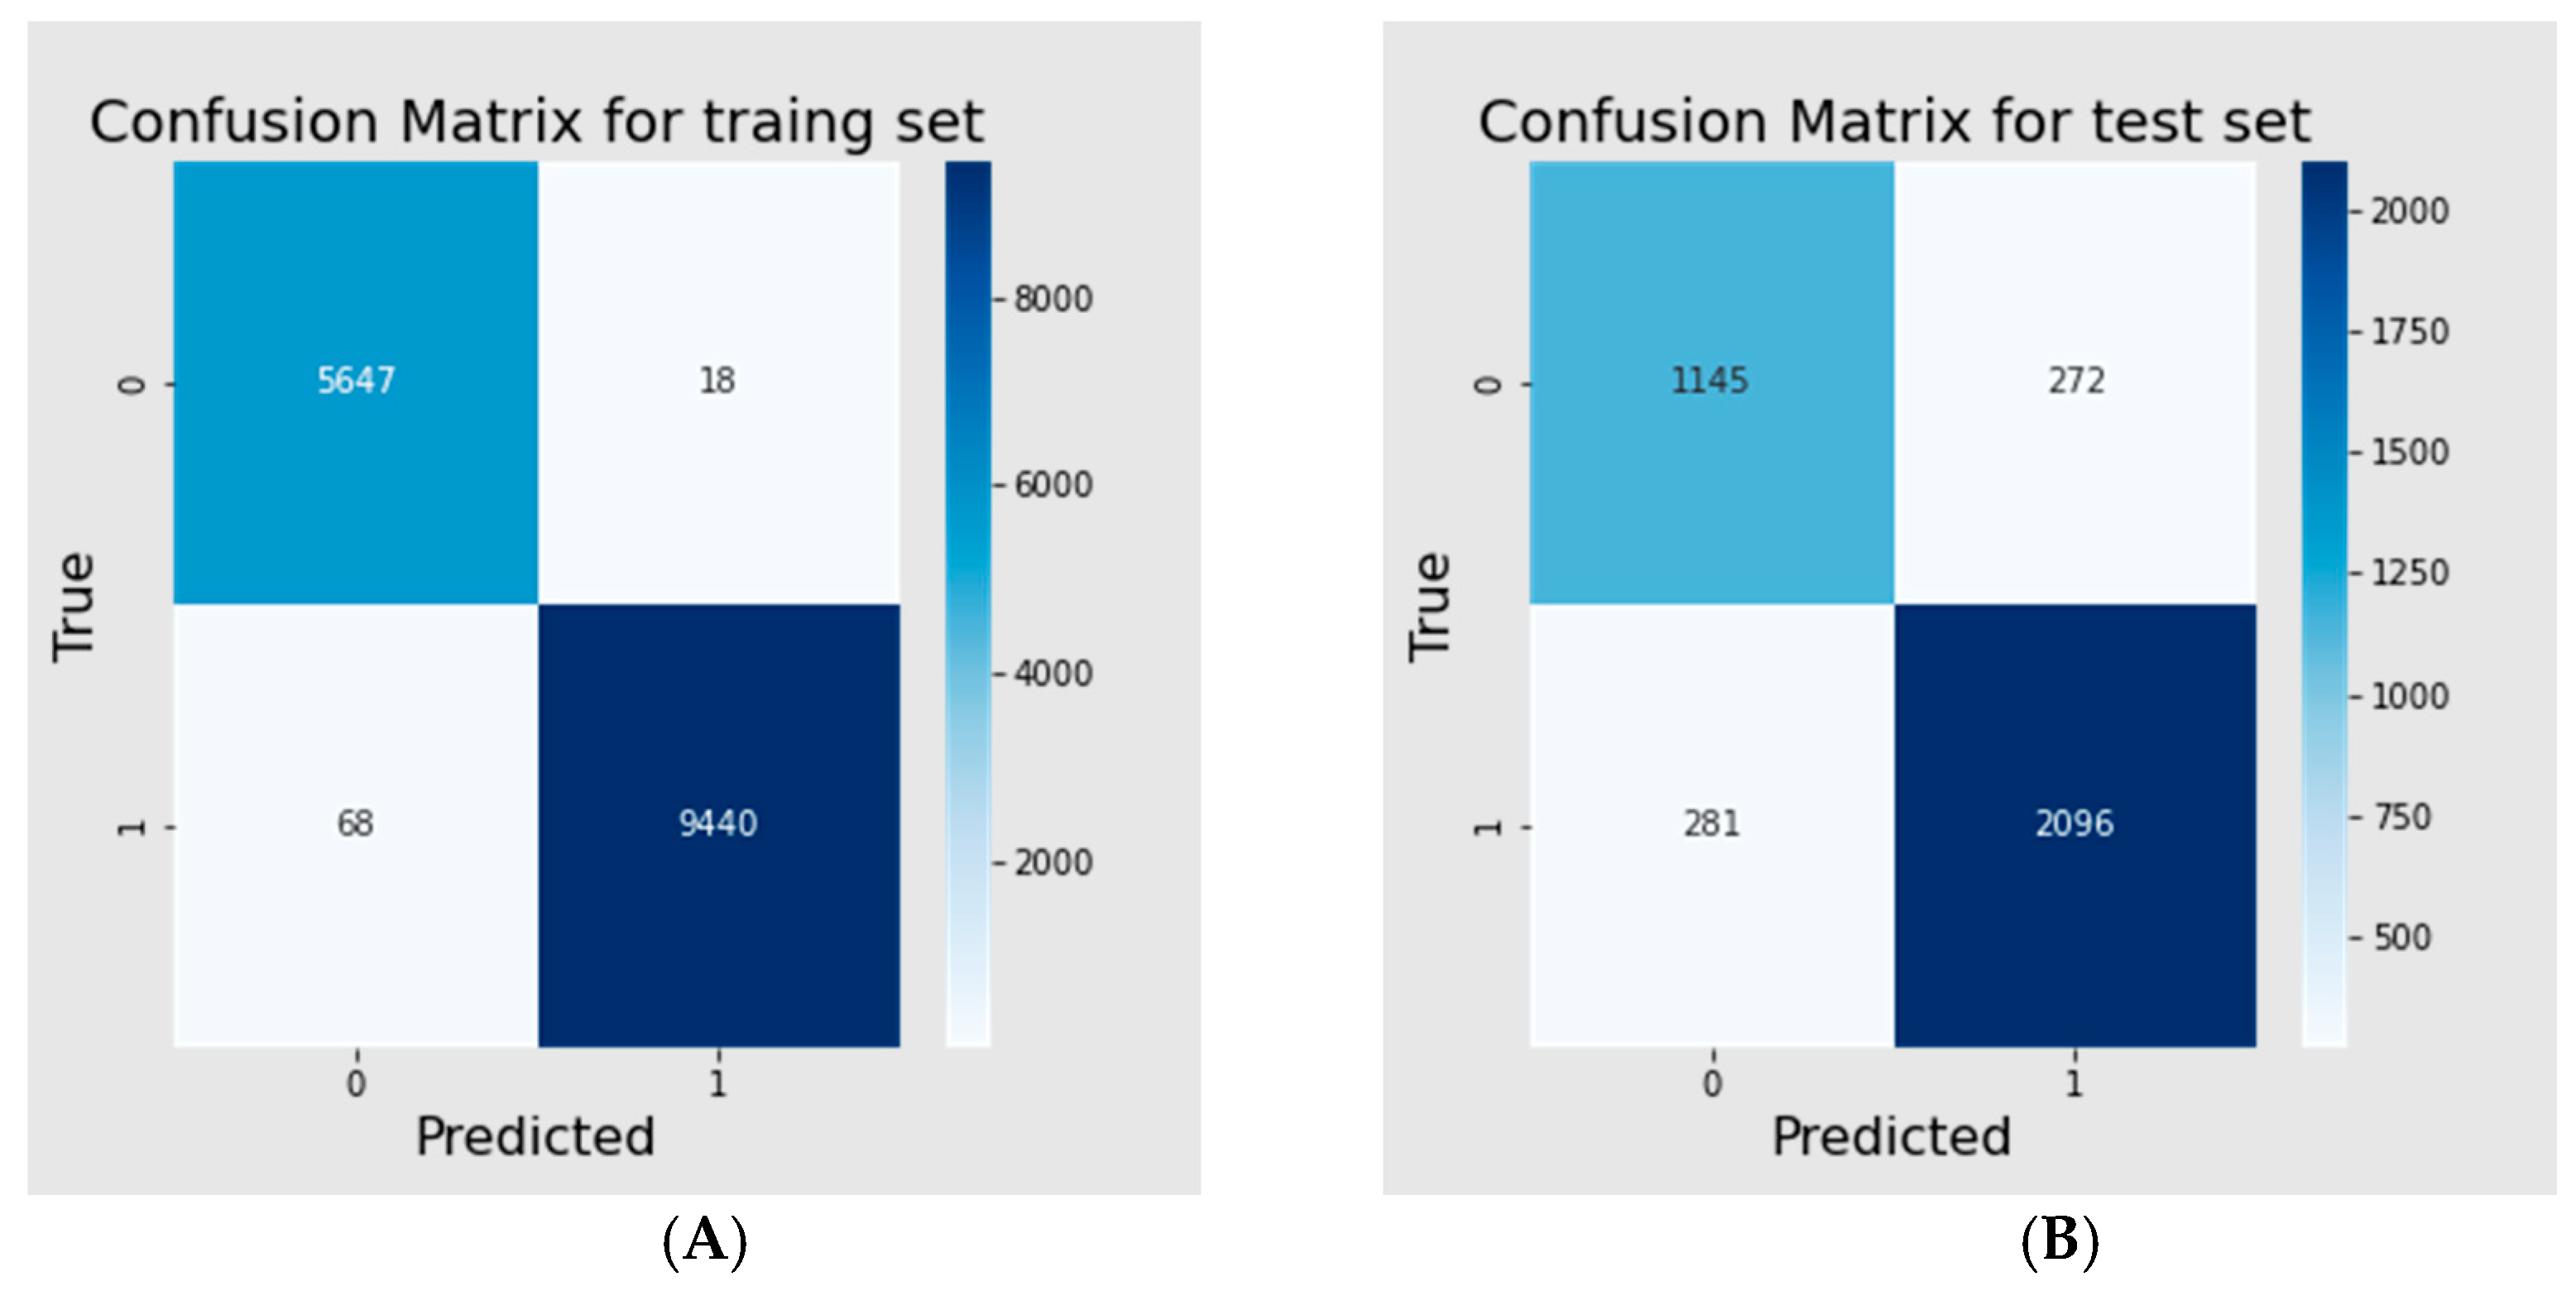
3.3. Binary Classification Model
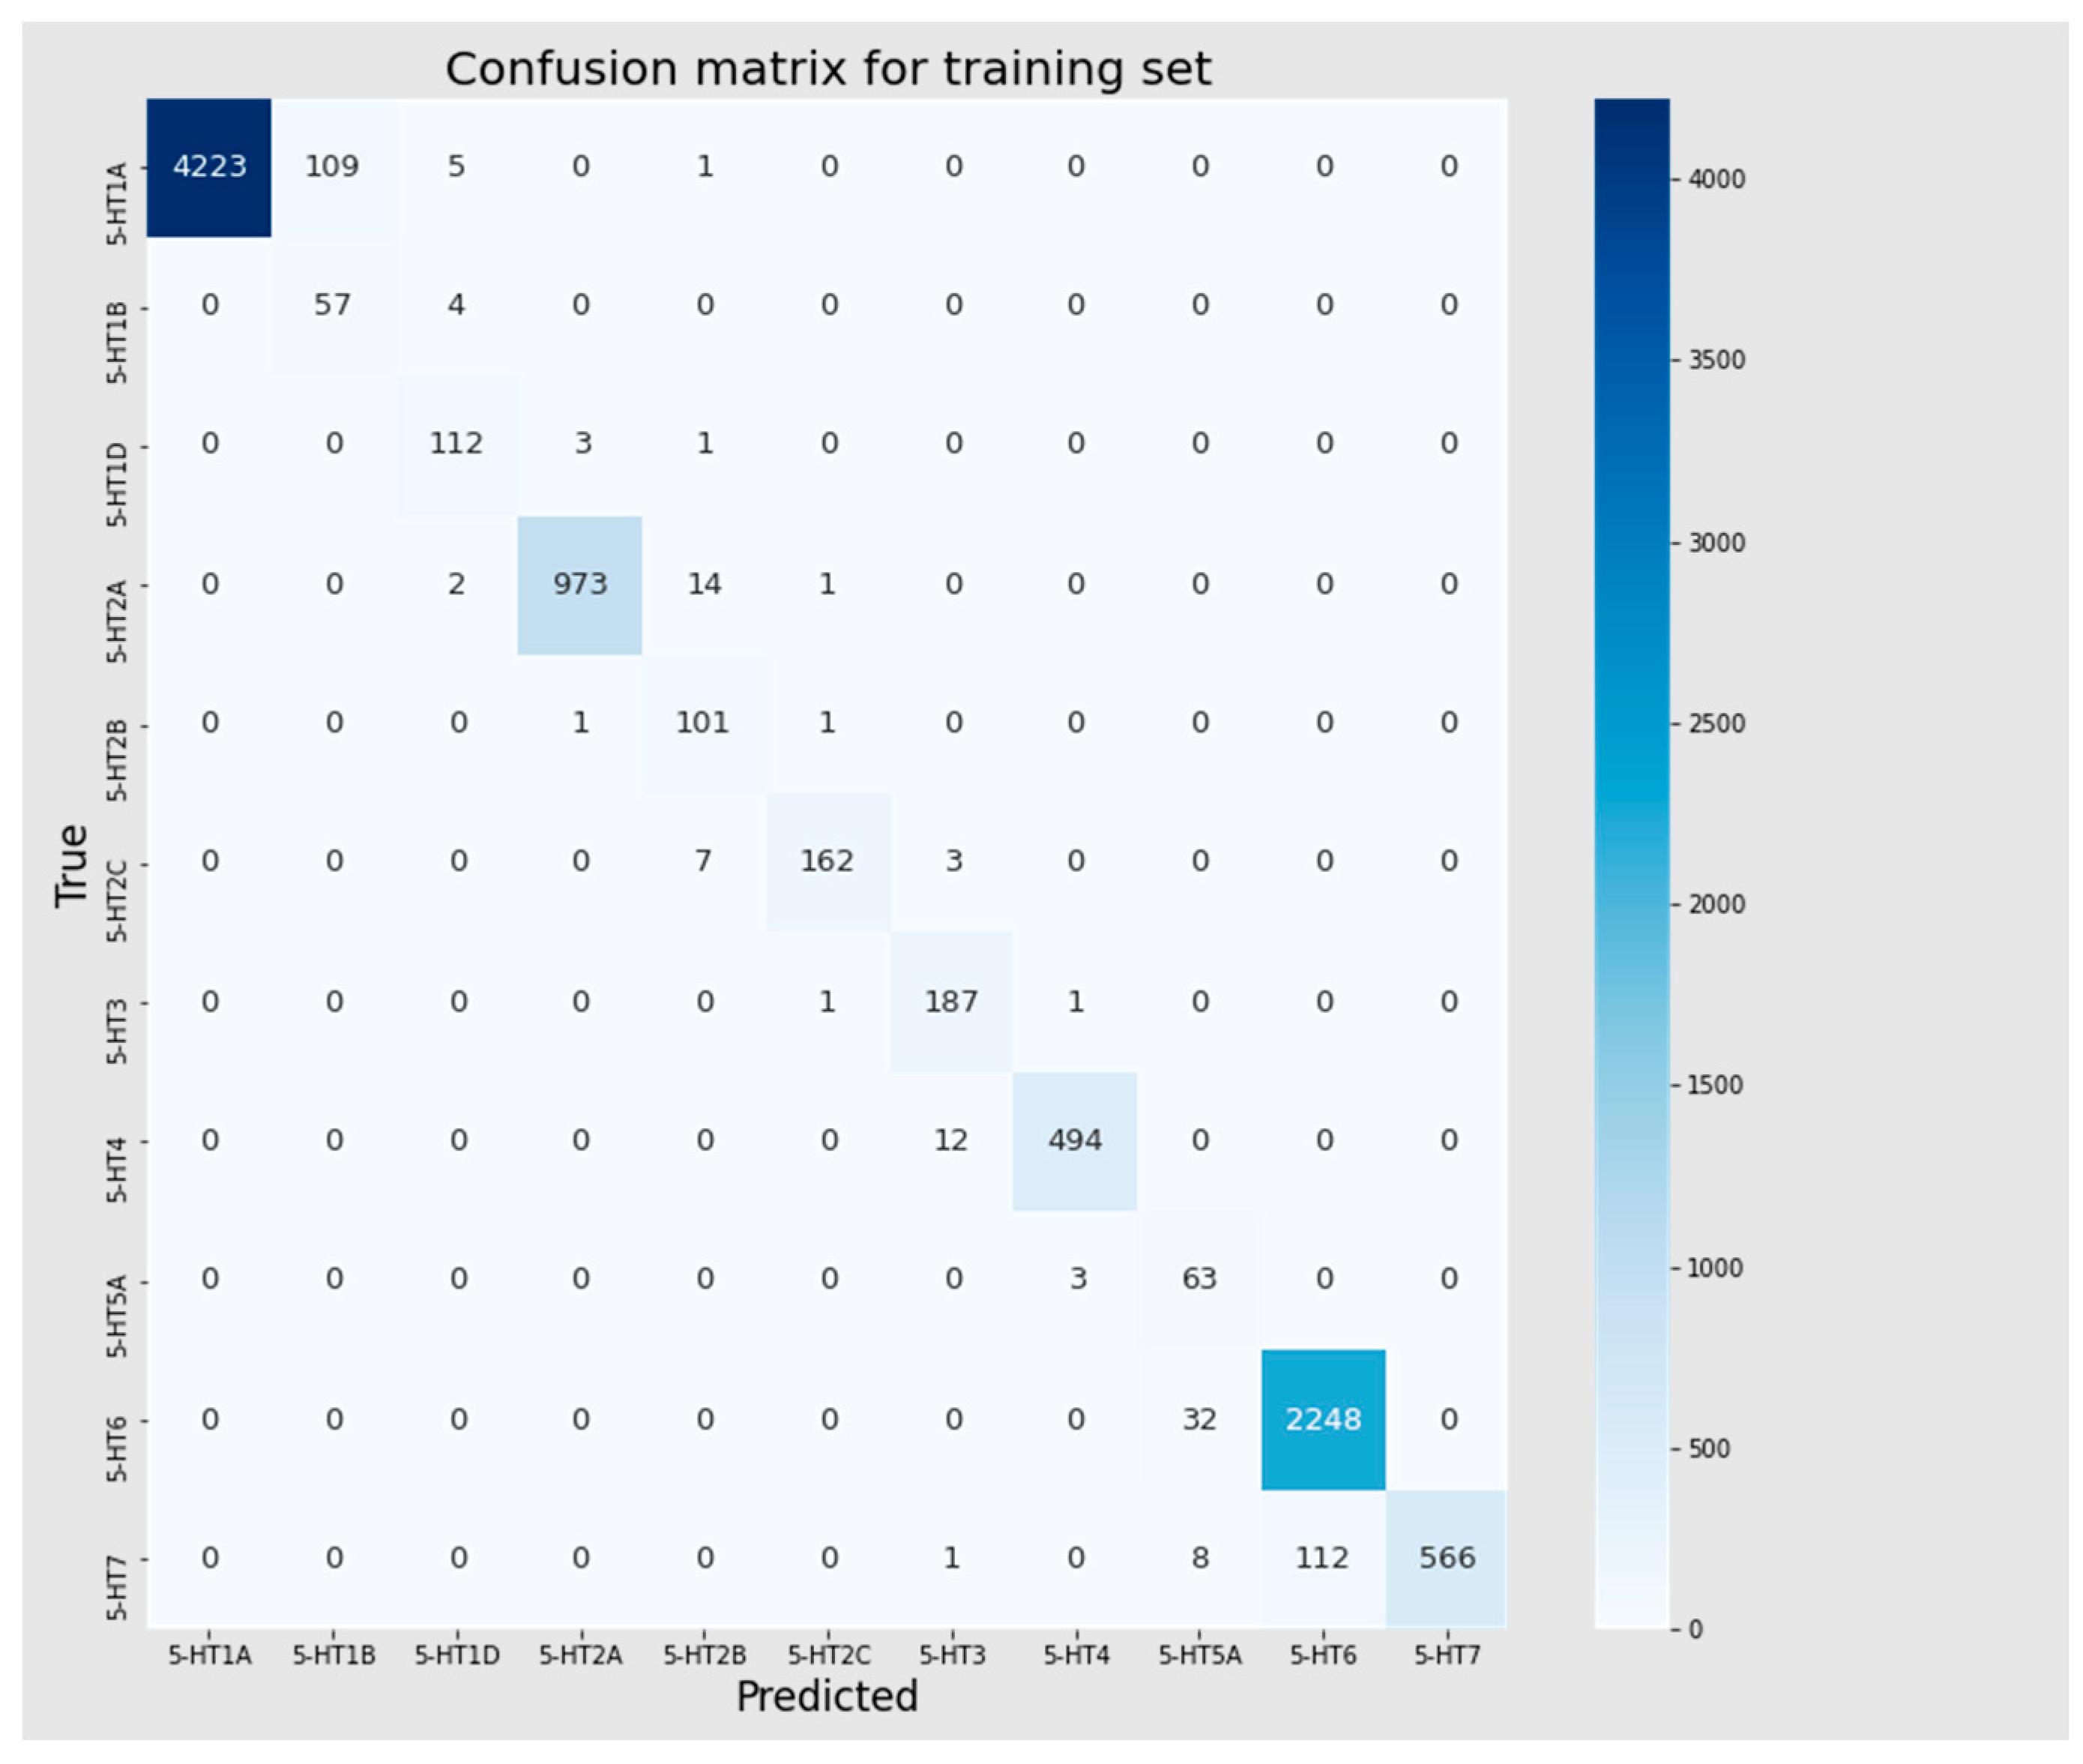
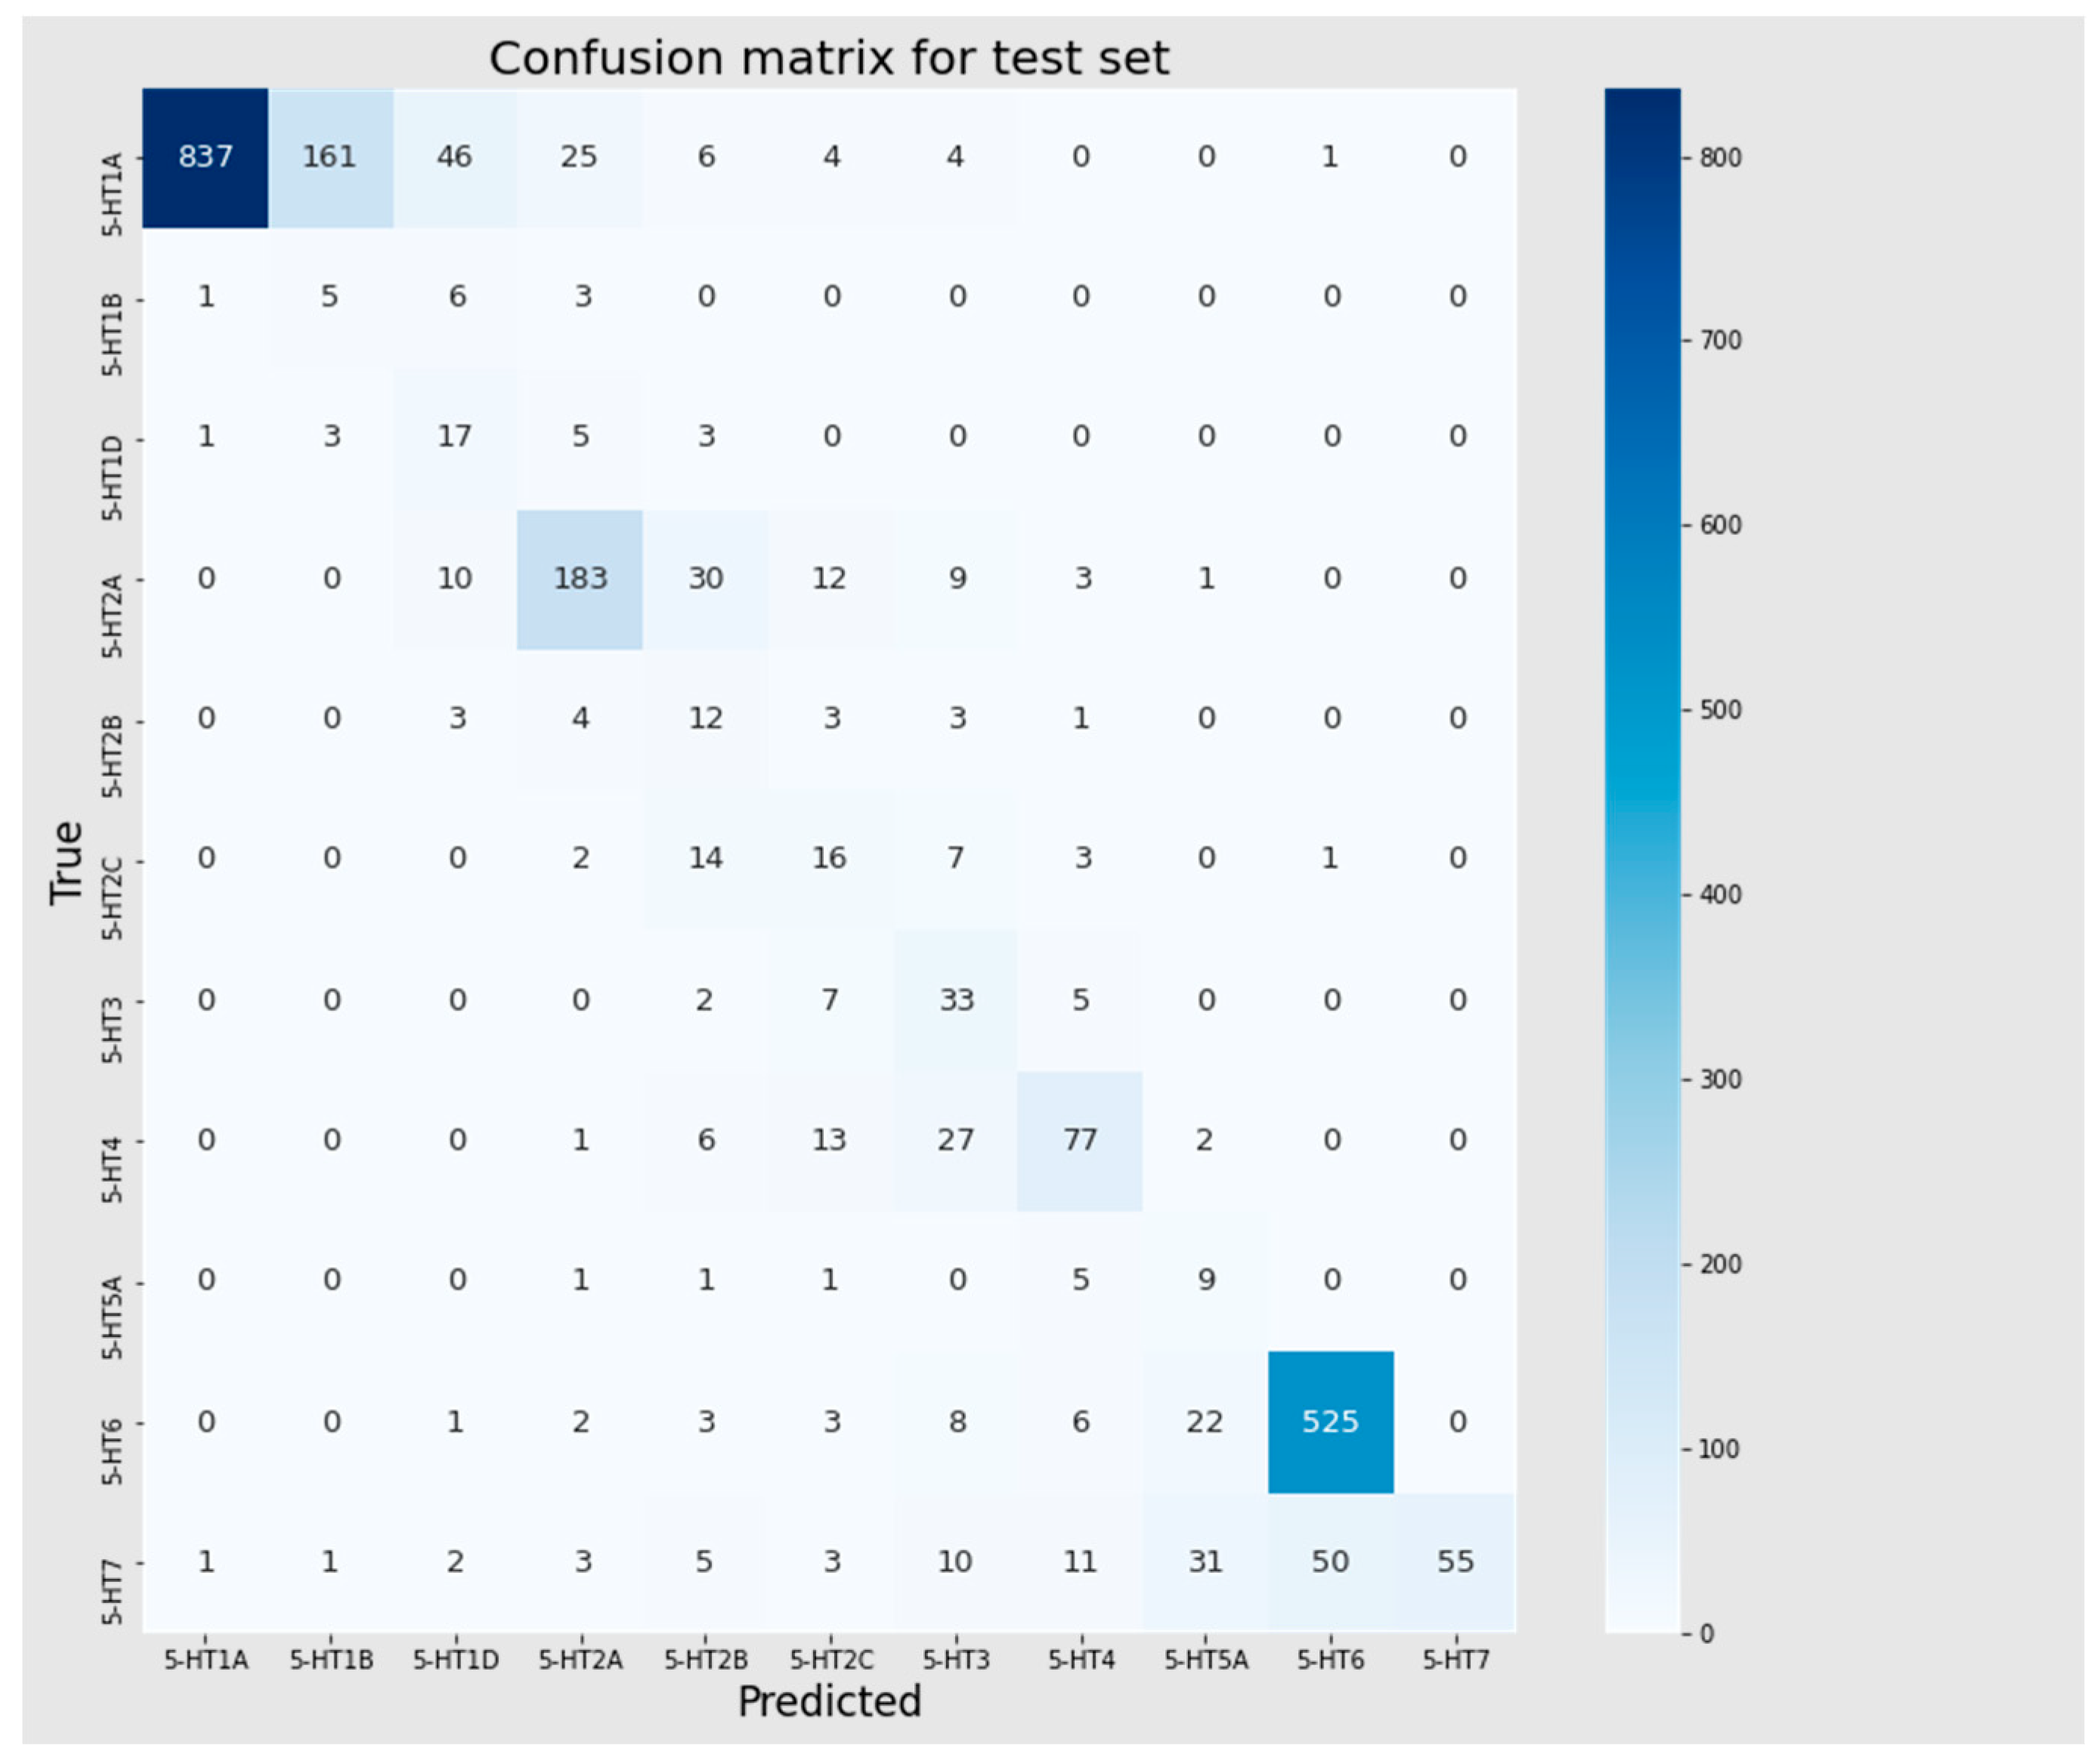
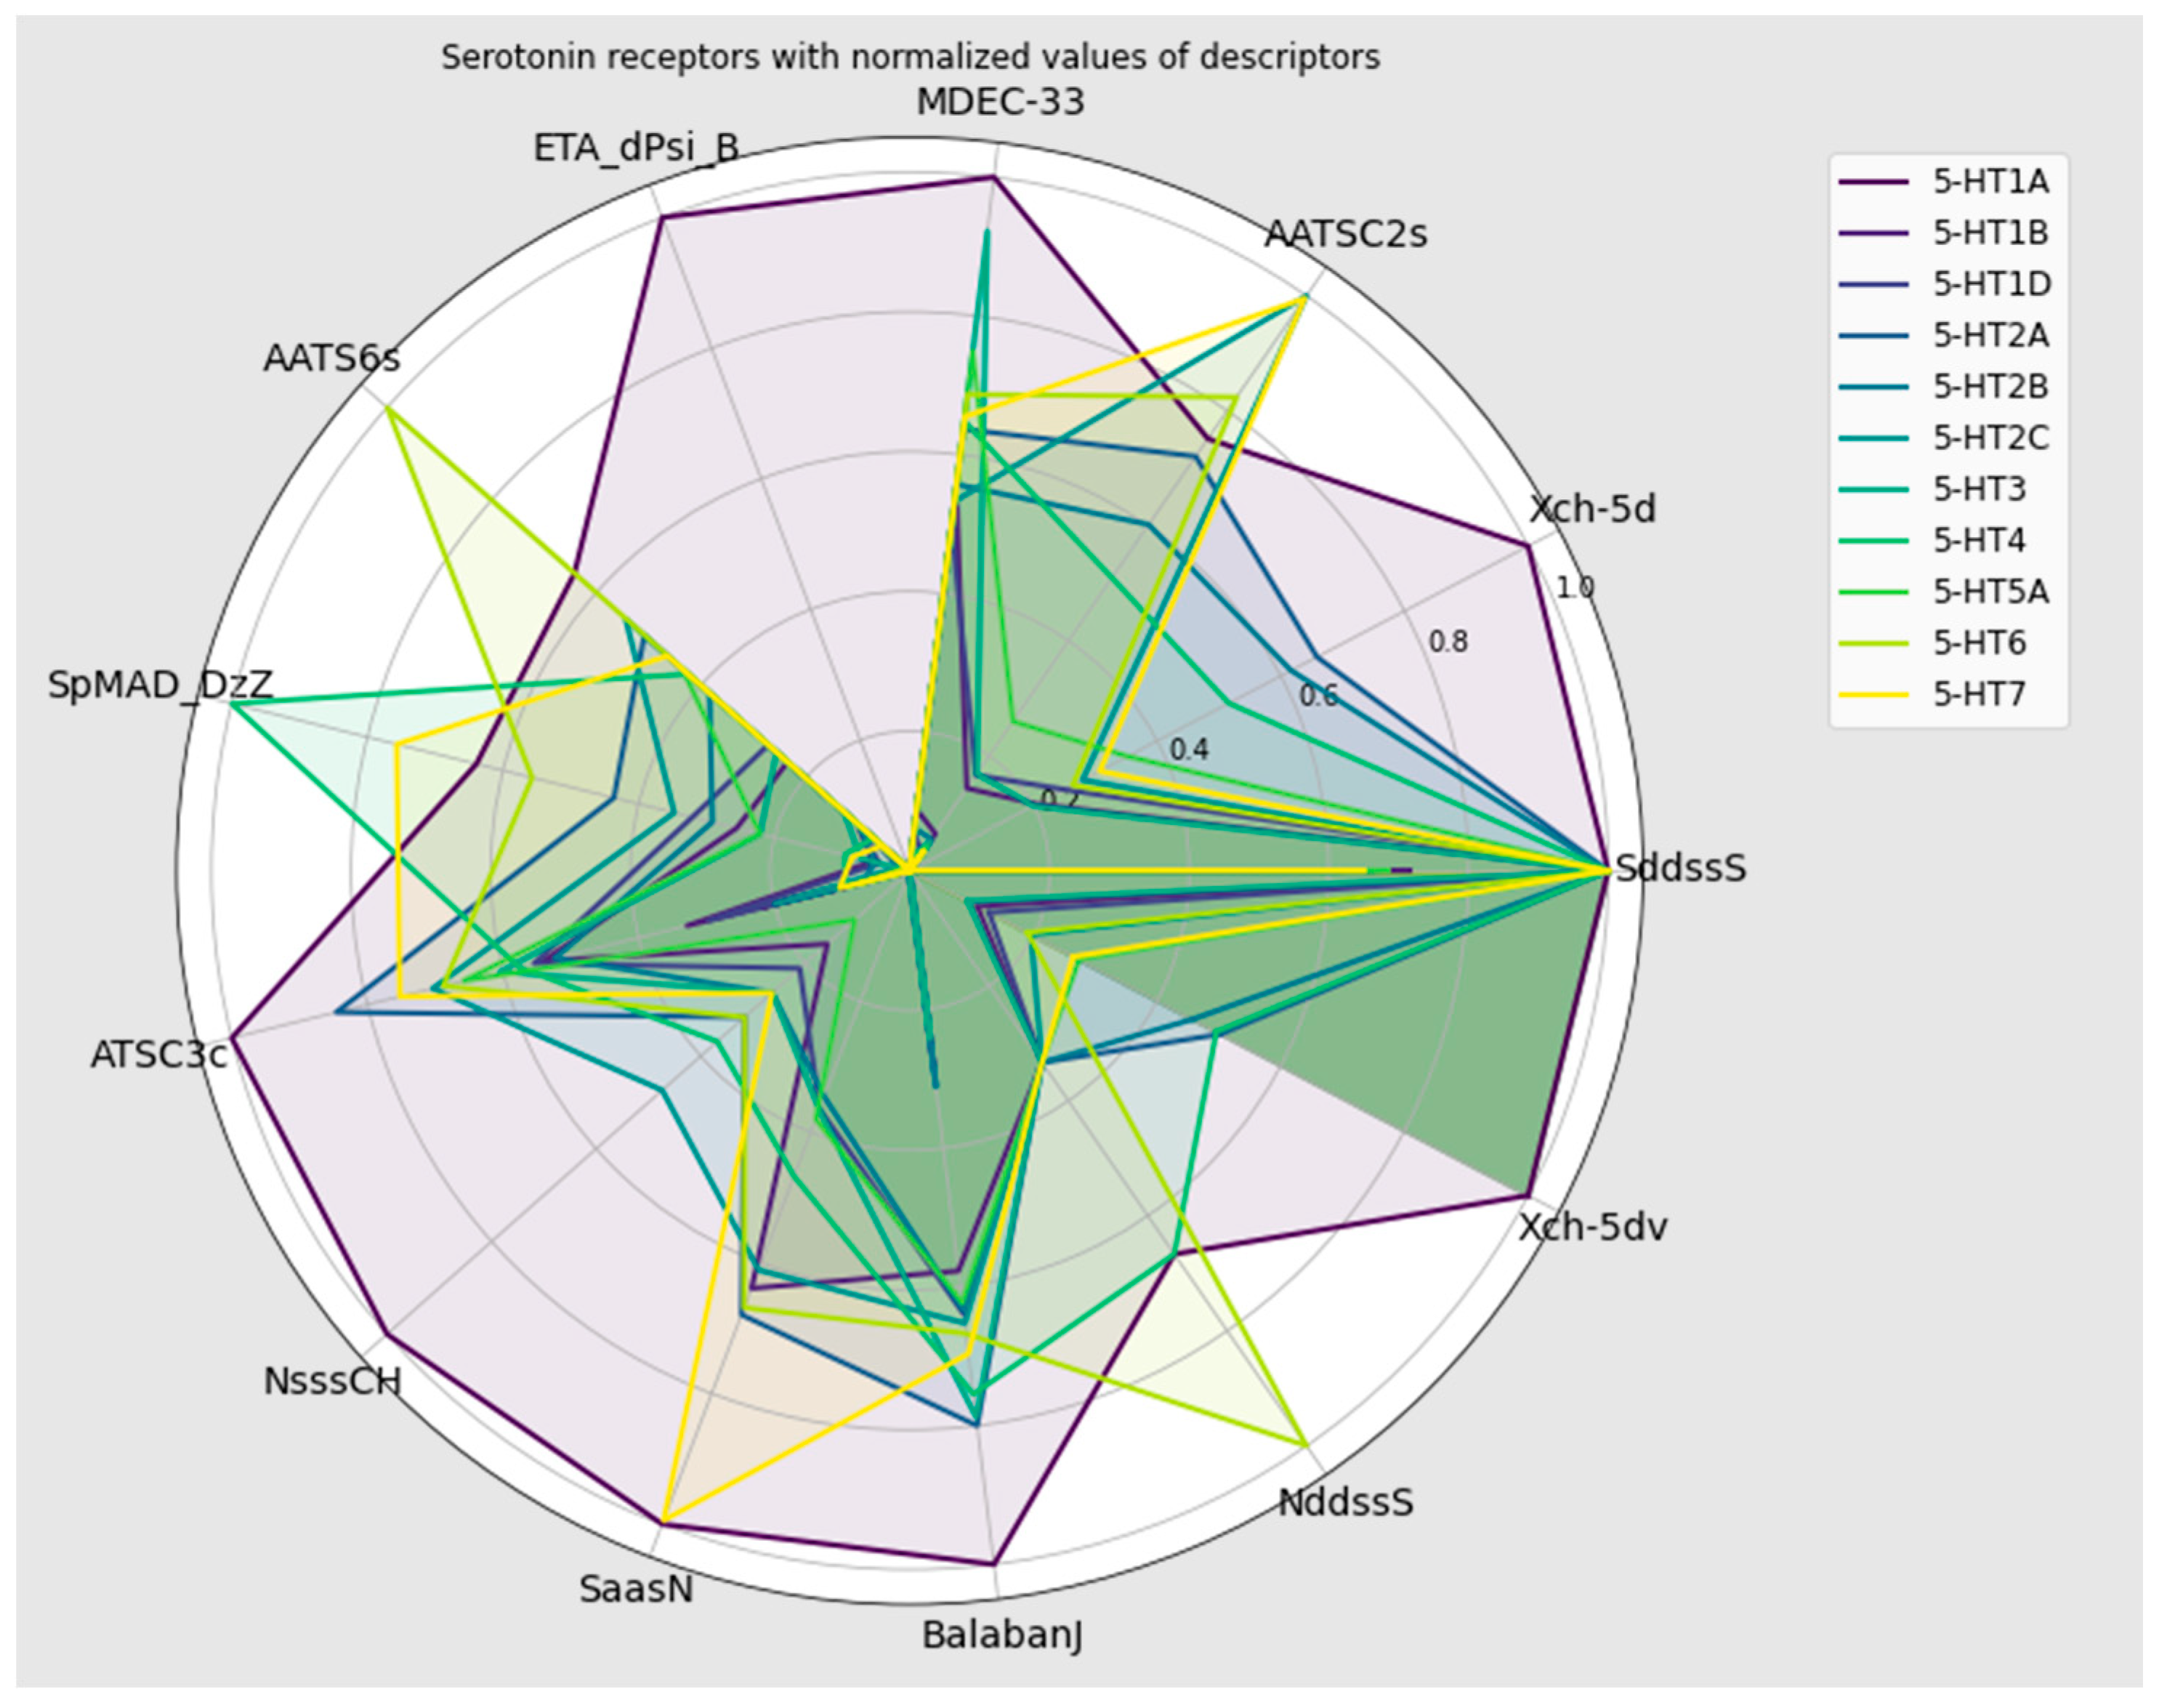
3.4. Multiclass Classification Models
4. Discussion
Supplementary Materials
Author Contributions
Funding
Institutional Review Board Statement
Informed Consent Statement
Data Availability Statement
Conflicts of Interest
References
- McCorvy, J.D.; Roth, B.L. Structure and function of serotonin G protein-coupled receptors. Pharmacol. Ther. 2015, 150, 129–142. [Google Scholar] [CrossRef] [PubMed]
- UniProt. Available online: https://www.uniprot.org/ (accessed on 15 November 2023).
- Huang, S.; Xu, P.; Shen, D.D.; Simon, I.A.; Mao, C.; Tan, Y.; Zhang, H.; Harpsøe, K.; Li, H.; Zhang, Y.; et al. GPCRs steer Gi and Gs selectivity via TM5-TM6 switches as revealed by structures of serotonin receptors. Mol. Cell 2022, 82, 2681–2695.e6. [Google Scholar] [CrossRef] [PubMed]
- Wirth, A.; Holst, K.; Ponimaskin, E. How serotonin receptors regulate morphogenic signalling in neurons. Prog. Neurobiol. 2017, 151, 35–56. [Google Scholar] [CrossRef] [PubMed]
- Kitson, S.L. 5-hydroxytryptamine (5-HT) receptor ligands. Curr. Pharm. Des. 2007, 13, 2621–2637. [Google Scholar] [CrossRef] [PubMed]
- Thirumaran, S.L.; Lepailleur, A.; Rochais, C. Structure-activity relationships of serotonin 5-HT7 receptors ligands: A review. Eur. J. Med. Chem. 2019, 183, 111705. [Google Scholar] [CrossRef]
- Sodhi, M.S.; Sanders-Bush, E. Serotonin and brain development. Int. Rev. Neurobiol. 2004, 59, 111–174. [Google Scholar] [CrossRef] [PubMed]
- Bukhari, S.N.A.; Elsherif, M.A.; Junaid, K.; Ejaz, H.; Alam, P.; Samad, A.; Jawarkar, R.D.; Masand, V.H. Perceiving the Concealed and Unreported Pharmacophoric Features of the 5-Hydroxytryptamine Receptor Using Balanced QSAR Analysis. Pharmaceuticals 2022, 15, 834. [Google Scholar] [CrossRef] [PubMed]
- Petković, M.; Đorđević, V.; Rančić, S.; Stevanović, M.; Gugleta, U.; Veselinovic, A.M. QSAR Modelling, Molecular Docking Studies and ADMET Predictions of Serotonin Transporter Inhibitors. Available online: https://ssrn.com/abstract=4270253 (accessed on 10 January 2024).
- Sadri, A. Is Target-Based Drug Discovery Efficient? Discovery and “Off-Target” Mechanisms of All Drugs. J. Med. Chem. 2023, 66, 12651–12677. [Google Scholar] [CrossRef] [PubMed]
- Lipinski, C.A. Lead- and drug-like compounds: The rule-of-five revolution. Drug Discov. Today Technol. 2004, 1, 337–341. [Google Scholar] [CrossRef] [PubMed]
- Irwin, J.J.; Shoichet, B.K. ZINC—A free database of commercially available compounds for virtual screening. J. Chem. Inf. Model. 2005, 45, 177–182. [Google Scholar] [CrossRef] [PubMed]
- Mendez, D.; Gaulton, A.; Bento, A.P.; Chambers, J.; de Veij, M.; Félix, E.; Magariños, M.P.; Mosquera, J.F.; Mutowo, P.; Nowotka, M.; et al. ChEMBL: Towards direct deposition of bioassay data. Nucleic Acids Res. 2019, 47, D930–D940. [Google Scholar] [CrossRef] [PubMed]
- Czub, N.; Pacławski, A.; Szlęk, J.; Mendyk, A. Curated Database and Preliminary AutoML QSAR Model for 5-HT1A Receptor. Pharmaceutics 2021, 13, 1711. [Google Scholar] [CrossRef] [PubMed]
- Sklearn.model_selection.train_test_split. Available online: https://scikit-learn.org/stable/modules/generated/sklearn.model_selection.train_test_split.html (accessed on 12 November 2023).
- Moriwaki, H.; Tian, Y.S.; Kawashita, N.; Takagi, T. Mordred: A molecular descriptor calculator. J. Cheminform. 2018, 10, 4. [Google Scholar] [CrossRef] [PubMed]
- Mordred—GitHub Repo. Available online: https://github.com/mordred-descriptor/mordred (accessed on 30 September 2023).
- MLJAR: State-of-the-Art Automated Machine Learning Framework for Tabular Data, Version 0.10.3. Available online: https://github.com/mljar/mljar-supervised (accessed on 30 October 2023).
- Shapley, L.S. A Value for N-Person Games; RAND Corporation: Santa Monica, CA, USA, 1952; p. 402. Available online: https://www.rand.org/pubs/papers/P295.html (accessed on 12 September 2023).
- Lundberg, S.; Lee, S.I. A Unified Approach to Interpreting Model Predictions. arXiv 2017, arXiv:1705.07874. [Google Scholar]
- Szlęk, J. Model Interpretation. Available online: https://github.com/jszlek/MODEL_INTERPRETATION (accessed on 15 July 2023).
- SciPy Fundamental Algorithms for Scientific Computing in Python. Available online: https://scipy.org/ (accessed on 13 November 2023).
- Statsmodels. Available online: https://www.statsmodels.org/stable/index.html (accessed on 13 November 2023).
- Scikit-Posthocs. Available online: https://scikit-posthocs.readthedocs.io/en/latest/ (accessed on 13 November 2023).
- Descriptor List, Mordred 0.3.0 Documentation. Available online: https://mordred-descriptor.github.io/documentation/v0.3.0/descriptors.html (accessed on 5 January 2024).
- Hall, L.H.; Kier, L.B. Electrotopological State Indices for Atom Types: A Novel Combination of Electronic, Topological, and Valence State Information. J. Chem. Inf. Comput. 1995, 35, 1039–1045. [Google Scholar] [CrossRef]
- QuaSAR-Descriptor, MOE 2008.10. Available online: https://cadaster.eu/sites/cadaster.eu/files/challenge/descr.htm (accessed on 10 January 2024).
- Balaban Index. Available online: https://mathworld.wolfram.com/BalabanIndex.html (accessed on 10 January 2024).
- Bender, A.; Glen, R.C. A discussion of measures of enrichment in virtual screening: Comparing the information content of descriptors with increasing levels of sophistication. J. Chem. Inf. Model. 2005, 45, 1369–1375. [Google Scholar] [CrossRef] [PubMed]
- SerotoninAI. Available online: https://serotoninai.streamlit.app/ (accessed on 30 January 2024).
- Łapińska, N.; Pacławski, A.; Szlęk, J.; Mendyk, A. SerotoninAI: Serotonergic System Focused, Artificial Intelligence-Based Application for Drug Discovery. J. Chem. Inf. Model. 2024. [Google Scholar] [CrossRef] [PubMed]


| Receptor | Number | Range of Predicted Values |
|---|---|---|
| 5-HT1A | 1 | ≤1.5 |
| 5-HT1B | 2 | 1.5–2.5 |
| 5-HT1D | 3 | 2.5–3.5 |
| 5-HT2A | 4 | 3.5–4.5 |
| 5-HT2B | 5 | 4.5–5.5 |
| 5-HT2C | 6 | 5.5–6.5 |
| 5-HT3 | 7 | 6.5–7.5 |
| 5-HT4 | 8 | 7.5–8.5 |
| 5-HT5A | 9 | 8.5–9.5 |
| 5-HT6 | 10 | 9.5–10.5 |
| 5-HT7 | 11 | ≥10.5 |
| Receptor | Quantity |
|---|---|
| 5-HT1A | 5422 |
| 5-HT1B | 76 |
| 5-HT1D | 145 |
| 5-HT2A | 1238 |
| 5-HT2B | 129 |
| 5-HT2C | 215 |
| 5-HT3 | 236 |
| 5-HT4 | 632 |
| 5-HT5A | 83 |
| 5-HT6 | 2850 |
| 5-HT7 | 859 |
| Dataset | Accuracy | Precision | Recall | F1 | MCC |
|---|---|---|---|---|---|
| Training set | 0.994 | 0.998 | 0.993 | 0.995 | 0.988 |
| Test | 0.854 | 0.885 | 0.882 | 0.883 | 0.689 |
| No. | Descriptor | Description | av|SHAP Value| |
|---|---|---|---|
| 1 | nBase | basic group count | 0.017 |
| 2 | MATS1v | Moran coefficient of lag 1 weighted by vdw volume (van der Waals volume) | 0.016 |
| 3 | PEOE_VSA7 | MOE Charge VSA Descriptor 7 | 0.016 |
| 4 | SlogP_VSA1 | MOE logP VSA Descriptor 1 | 0.014 |
| 5 | AXp-7dv | Seven-ordered averaged Chi path weighted by valence electrons | 0.014 |
| 6 | PEOE_VSA9 | MOE Charge VSA Descriptor 9 | 0.013 |
| 7 | Xch-7dv | Seven-ordered Chi chain weighted by valence electrons | 0.013 |
| 8 | AATSC2dv | averaged and centered Moreau–Broto autocorrelation of lag 2 weighted by valence electrons | 0.011 |
| 9 | VSA_EState2 | VSA EState Descriptor 2 | 0.011 |
| 10 | ATSC6v | centered Moreau–Broto autocorrelation of lag 6 weighted by vdw volume | 0.011 |
| 11 | SLogP | Wildman–Crippen LogP | 0.011 |
| 12 | Kier2 | kappa shape index 2 | 0.010 |
| 13 | ATSC5d | centered Moreau–Broto autocorrelation of lag 5 weighted by sigma electrons | 0.009 |
| 14 | PEOE_VSA1 | MOE Charge VSA Descriptor 1 | 0.009 |
| 15 | JGI2 | Two-ordered mean topological charge | 0.009 |
| 16 | SpMAD_Dzare | spectral mean absolute deviation from Barysz matrix weighted by Allred-Rochow EN | 0.009 |
| 17 | SaasC | sum of aasC | 0.009 |
| 18 | MATS1se | Moran coefficient of lag 1 weighted by sanderson EN | 0.009 |
| 19 | IC3 | Three-ordered neighborhood information content | 0.008 |
| 20 | SaaaC | sum of aaaC | 0.008 |
| 21 | VSA_EState7 | VSA EState Descriptor 7 | 0.008 |
| 22 | ATSC7Z | centered Moreau–Broto autocorrelation of lag 7 weighted by atomic number | 0.008 |
| 23 | ZMIC3 | Three-ordered Z-modified information content | 0.007 |
| 24 | JGI9 | Nine-ordered mean topological charge | 0.007 |
| 25 | nFRing | fused ring count | 0.007 |
| 26 | Kier3 | kappa shape index 3 | 0.007 |
| 27 | SsssN | sum of sssN (>N-) | 0.007 |
| 28 | GATS4i | Geary coefficient of lag 4 weighted by ionization potential | 0.007 |
| 29 | PEOE_VSA6 | MOE Charge VSA Descriptor 6 | 0.006 |
| 30 | MAXaasC | max of aasC | 0.006 |
| 31 | GGI9 | Nine-ordered raw topological charge | 0.006 |
| 32 | GATS6v | Geary coefficient of lag 6 weighted by vdw volume | 0.006 |
| 33 | GATS3i | Geary coefficient of lag 3 weighted by ionization potential | 0.005 |
| 34 | TopoShapeIndex | topological shape index | 0.005 |
| 35 | SssO | sum of ssO (-O-) | 0.005 |
| 36 | PEOE_VSA10 | MOE Charge VSA Descriptor 10 | 0.005 |
| 37 | GATS3v | Geary coefficient of lag 3 weighted by vdw volume | 0.005 |
| Dataset | Accuracy | Precision | Recall | F1 | MCC |
|---|---|---|---|---|---|
| Training set | 0.966 | 0.976 | 0.966 | 0.969 | 0.953 |
| Test | 0.744 | 0.881 | 0.744 | 0.788 | 0.675 |
| No. | Descriptor | Description | av|SHAP Value| |
|---|---|---|---|
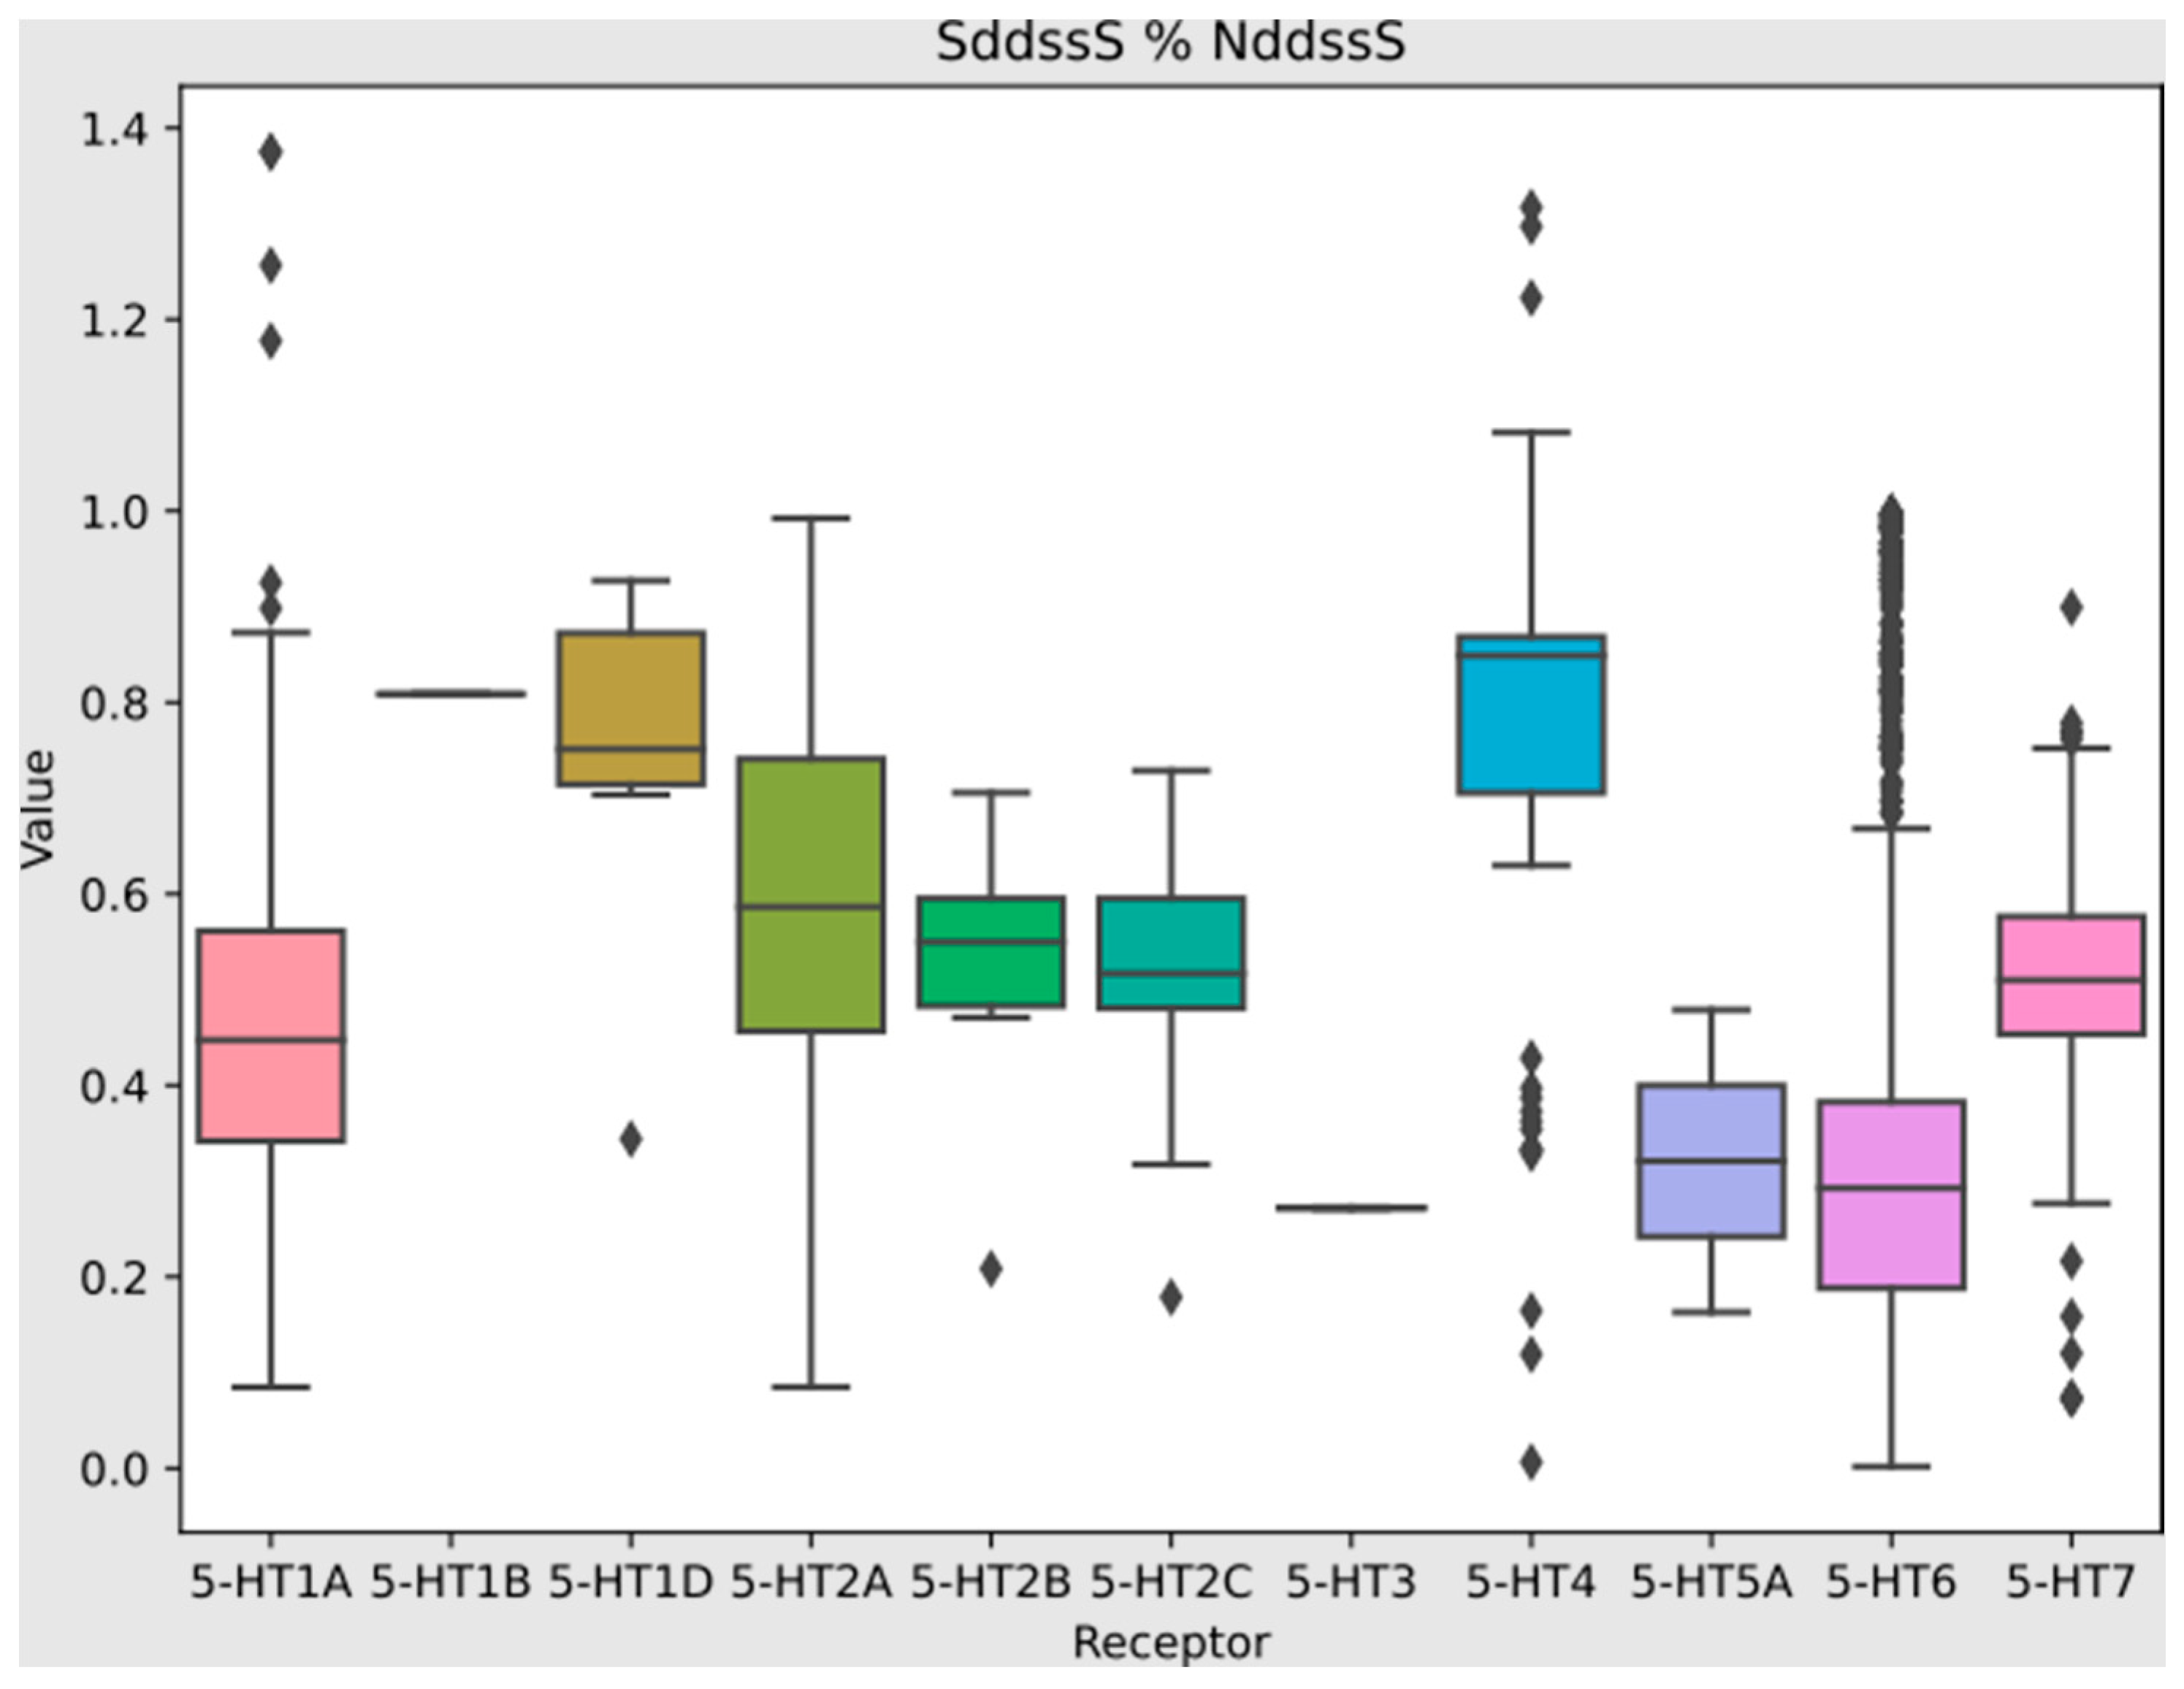
| 1 | SddssS | sum of ddssS (≥S≤) | 0.731 |
| 2 | Xch-5d | five-ordered Chi chain weighted by sigma electrons | 0.341 |
| 3 | AATSC2s | averaged and centered Moreau–Broto autocorrelation of lag 2 weighted by intrinsic state | 0.272 |
| 4 | MDEC-33 | molecular distance edge between tertiary C and tertiary C | 0.239 |
| 5 | ETA_dPsi_B | ETA delta psi (type: B) | 0.165 |
| 6 | AATS6s | averaged Moreau–Broto autocorrelation of lag 6 weighted by intrinsic state | 0.138 |
| 7 | SpMAD_DzZ | spectral mean absolute deviation from Barysz matrix weighted by atomic number | 0.132 |
| 8 | ATSC3c | centered Moreau–Broto autocorrelation of lag 3 weighted by Gasteiger charge | 0.095 |
| 9 | NsssCH | number of sssCH (>CH-) | 0.084 |
| 10 | SaasN | sum of aasN | 0.083 |
| 11 | BalabanJ | Balaban’s J index | 0.083 |
| 12 | NddssS | number of ddssS (≥S≤) | 0.081 |
| 13 | Xch-5dv | five-ordered Chi chain weighted by valence electrons | 0.077 |
Disclaimer/Publisher’s Note: The statements, opinions and data contained in all publications are solely those of the individual author(s) and contributor(s) and not of MDPI and/or the editor(s). MDPI and/or the editor(s) disclaim responsibility for any injury to people or property resulting from any ideas, methods, instructions or products referred to in the content. |
© 2024 by the authors. Licensee MDPI, Basel, Switzerland. This article is an open access article distributed under the terms and conditions of the Creative Commons Attribution (CC BY) license (https://creativecommons.org/licenses/by/4.0/).
Share and Cite
Łapińska, N.; Pacławski, A.; Szlęk, J.; Mendyk, A. Integrated QSAR Models for Prediction of Serotonergic Activity: Machine Learning Unveiling Activity and Selectivity Patterns of Molecular Descriptors. Pharmaceutics 2024, 16, 349. https://doi.org/10.3390/pharmaceutics16030349
Łapińska N, Pacławski A, Szlęk J, Mendyk A. Integrated QSAR Models for Prediction of Serotonergic Activity: Machine Learning Unveiling Activity and Selectivity Patterns of Molecular Descriptors. Pharmaceutics. 2024; 16(3):349. https://doi.org/10.3390/pharmaceutics16030349
Chicago/Turabian StyleŁapińska, Natalia, Adam Pacławski, Jakub Szlęk, and Aleksander Mendyk. 2024. "Integrated QSAR Models for Prediction of Serotonergic Activity: Machine Learning Unveiling Activity and Selectivity Patterns of Molecular Descriptors" Pharmaceutics 16, no. 3: 349. https://doi.org/10.3390/pharmaceutics16030349
APA StyleŁapińska, N., Pacławski, A., Szlęk, J., & Mendyk, A. (2024). Integrated QSAR Models for Prediction of Serotonergic Activity: Machine Learning Unveiling Activity and Selectivity Patterns of Molecular Descriptors. Pharmaceutics, 16(3), 349. https://doi.org/10.3390/pharmaceutics16030349