Abstract
Background: Ganciclovir and valganciclovir are used for prophylaxis and treatment of cytomegalovirus infection. However, there is great interindividual variability in ganciclovir’s pharmacokinetics (PK), highlighting the importance of individualized dosing. To facilitate model-informed precision dosing (MIPD), this study aimed to establish a parametric model repository of ganciclovir and valganciclovir by summarizing existing population pharmacokinetic information and analyzing the sources of variability. (2) Methods: A total of four databases were searched for published population PK models. We replicated these models, evaluated the impact of covariates on clearance, calculated the probability of target attainment for each model based on a predetermined dosing regimen, and developed an area under the concentration–time curve (AUC) calculator using maximum a posteriori Bayesian estimation. (3) Results: A total of 16 models, one- or two-compartment models, were included. The most significant covariates were body size (weight and body surface area) and renal function. The results show that 5 mg/kg/12 h of ganciclovir could make the AUC0–24h within 40–80 mg·h/L for 50.03% pediatrics but cause AUC0–24h exceeding the exposure thresholds for toxicity (120 mg·h/L) in 51.24% adults. (4) Conclusions: Dosing regimens of ganciclovir and valganciclovir should be adjusted according to body size and renal function. This model repository has a broad range of potential applications in MIPD.
1. Introduction
Ganciclovir (GCV) is often used for, but not limited to, the treatment or prophylaxis of cytomegalovirus (CMV) disease in immunocompromised patients, such as those with acquired immunodeficiency syndrome and iatrogenic immunosuppression associated with organ transplantation or chemotherapy of neoplastic disease [1]. GCV’s antiviral activity is mediated through its triphosphate, which inhibits viral DNA polymerase and slows DNA elongation [2]. Valganciclovir (VGCV) is an L-valine ester prodrug of GCV formulated as an oral solution or tablet to overcome the low bioavailability of oral GCV (~5%) [3]. VGCV has a higher oral bioavailability of approximately 60% [4]. Plasma protein binding of GCV is minimal, accounting for approximately 1 to 2% over the concentration range of 0.5–51 mg/L [5]. GCV clearance correlates well with renal function as over 90% is eliminated unchanged in urine [6].
Currently, there is no consensus on the pharmacokinetic–pharmacodynamic (PK–PD) endpoints for GCV due to a paucity of clinical studies examining efficacy targets in adults or pediatric populations. Both the trough concentration (Ctrough) and the area under the concentration–time curve (AUC) have been used for therapeutic drug monitoring (TDM). Recently, a 24 h AUC (AUC0–24h) above 50 mg·h/L has been suggested by Märtson et al. [7] for prophylaxis and 80–120 mg·h/L for treatment of CMV infection.
Several studies have shown that GCV exhibited high interindividual variability (IIV) in different populations [8,9,10,11]. As a result, the use of a one-size-fits-all dose for all patients could result in treatment failure. Individualized dosing and TDM play crucial roles in optimizing GCV efficacy and safety. Population pharmacokinetics (PPK) analyses can identify covariates that influence PK parameters and produce estimates of individual PK parameters through Bayesian forecasting to develop individualized therapy for GCV.
To achieve individualized dosing, a comprehensive understanding of the PK parameters and PPK models of GCV is necessary. However, to our knowledge, there are no published PPK model repositories. Therefore, the overarching aim of our work was to establish a parametric PPK model repository of GCV and VGCV. We would like to highlight that the goal of this study is not to prove that these models are comparable with each other, but rather to showcase the heterogeneity. Specifically, we attempted to (1) identify all published PPK models to the best of our capability through a comprehensive literature search, and to reorganize these models using standardized R codes; (2) assess the performance of different PPK models in this repository by comparing the concentration–time profiles and covariates effects; and (3) illustrate the utility of the model repository with two examples (i.e., Monte Carlo simulation for the probability of target attainment (PTA) and AUC calculator based on maximum a posteriori Bayesian estimation (MAP-BE)). By building this model repository and demonstrating the sources of variability, we aim to facilitate subsequent utilization of these models to improve precision dosing of GCV and VCGV.
2. Methods
2.1. Search Strategy
In an attempt to identify all parametric PPK models, a literature search was performed on the PubMed, Embase, Scopus and Web of Science databases from inception to 28 May 2023, according to the Preferred Reporting Items for Systematic Reviews and Meta-analyses (PRISMA) reporting guideline [12]. Search terms included those related to the drug of interest (ganciclovir, BW-759, valganciclovir, Cytovene, and Valcyte) and terms specific to PPK models included population pharmacokinetic, NONMEM, MONOLIX, and nlmixr. The latter terms were derived from a publication by Li et al. [13]. Two authors (W.Y. and M.G.) conducted the literature search and study selection independently using EndNote (version 20.0.0; Thomson Scientific, Box Hill, Victoria, Australia). A third senior investigator (Q.H.) was consulted to resolve any discrepancies between the two authors. The complete search strategies for each database, and inclusion and exclusion criteria are available in Supplementary Materials.
2.2. Information Extraction
We extracted the following information from the included studies: (1) study characteristics including subject demographics, sampling strategies, dosage regimens, and quantitative methods; (2) PPK modeling characteristics, including software and algorithms used, PK parameters and related formulas, between-subject variability (BSV, which was recorded as the coefficient of variation (CV), and %CV=), residual unexplained variability (RUV), validation methods; and (3) covariate information, including the list of all covariates that were tested, selection criteria and the subset of covariates that had significant effects on the PK parameters.
2.3. Quality Control of the PPK Model Repository
Quality control (QC) procedures were undertaken to screen and rectify any issues related to the establishment of the model repository. We created 4 age-stratified cohorts of virtual patients (neonates, infants, children and adults), these typical virtual patients were designed to reflect the target population of each model as accurately as possible (See Table 1 for details). Although the age covariate had been converted into a categorical variable, this should not impede the validity of the virtual patient cohort as the representative values of each cohort were derived from the median of observed data. The corresponding steady-state concentration–time curves for each virtual patients were obtained by simulations (each simulation was performed on 1000 typical virtual patients) with rxode2 package (version 2.0.12) of R (version 4.2.2). The principle that guided the QC procedures was that, given the models were appropriate to describe the corresponding PPK characteristics, the simulated concentration–time curves of the same typical virtual patients generated by different models should be comparable. This was defined as the 95% confidential interval (CI) of the geometric mean of time to maximum concentration (Tmax), maximum concentration (Cmax) and other PK parameters of 1000 virtual patients in a study should fall within the range of 50–200% of the geometric mean of PK parameters of all the same virtual patients. When significant differences in the simulated concentration–time curves were detected (i.e., the Cmax was outside of this range), potential model reproduction errors were first examined and excluded, and then the covariates included in the models were compared to identify possible causes that affected the PK behaviors.

Table 1.
Details of typical virtual patients for simulation.
The PK parameters used for similarity comparison, including Cmax, Tmax, and the half-life time (t1/2) were derived from non-compartment analysis (NCA) analysis of drug concentrations in virtual patients by using IQnca (Version 1.3.0) and Rmisc (Version 1.5.1) package.
All virtual patients received 5 mg/kg GCV by intravenous infusion over 1 h every 12 h (q12h). For VGCV, neonates, infants, and children received 10 mg/kg q12h while adult received 900 mg q12h. For pediatrics, their dosing regimens followed the commonly used dosing regimens of the included studies; for adults, the dosing regimen was based on the third international consensus guidelines on the management of cytomegalovirus in solid-organ transplantation [14]. The R codes of model repository establishment were provided in Supplementary Materials.
2.4. Effect of Covariates on Clearance Variation
Clearance (CL) is a crucial parameter for AUC, and AUC plays a central role in the individualized dosing of GCV. Thus, the comparison of the effects of different covariates on CL was necessary. To explore whether the covariate effect on CL was clinically meaningful and to understand between-study differences in covariate impacts on CL, we used a forest plot to comprehensively compare covariate effects across studies. Weight, estimated glomerular filtration rate (eGFR) and creatinine clearance (CLcr) were scaled to the same range and a uniform covariate value was set as the reference (refer to Table S1 for details). For other continuous covariates (serum creatinine, SCR and body surface area, BSA) that were only identified in one study, the minimum and maximum values of that covariate were used to calculate CL and the reference CL value was calculated using the median covariate value of each study.
For binary covariates, such as the presence of critical illness (defined as “1” for critically ill patients and “0” for others), the common condition would be treated as the reference (COVi = 0). The uncommon condition would be treated as the test (COVi = 1). CLi = CLcommon + CLdiff * COVi. The range of CLi would be [CLcommon, CLcommpn + CLdiff] (if CLdiff > 0), or [CLcommon + CLdiff, CLcommon] (if CLdiff < 0).
Then, the effect range of identified covariate on CL was calculated by the following formula:
We considered covariates effects outside of the 80–125% boundary as clinically significant, based on the standard used in bioequivalence studies [13,15]. Detailed R codes can be found in the Supplementary Materials.
2.5. Application of the PPK Model Repository
In order to demonstrate the practical application of the model repository in MIPD, we will provide two illustrative examples.
2.5.1. Monte Carlo Simulation for the Probability of Target Attainment
We calculated the PTA of simulated concentration–time curves to evaluate the commonly used dosing regimens of GCV and VGCV. The trapezoidal method was used to calculate the steady-state AUC0–24h for 1000 virtual patients. The prophylaxis target used was 40–80 mg·h/L [16], while AUC0–24h of 80–120 mg·h/L was considered treatment target [7]. AUC exceeding 120 mg·h/L posed toxic risk.
2.5.2. AUC Calculator Based on Maximum a Posteriori Method
When using GCV and VGCV in a real-world setting, clinicians often need to calculate the AUC to determine whether the patient has achieved the appropriate level of exposure. To highlight the model repository’s convenience in MIPD, we developed an AUC0–24h calculator based on the maximum a posteriori-Bayesian Estimation (MAP-BE) using R shiny (version 1.7.4). Four main components made up the core function of the calculator: (1) PPK model parameter information; (2) model defined by rxode2 package; (3) the objective function; (4) function used for MAP estimation [17].
3. Results
3.1. Identification of the Included Studies
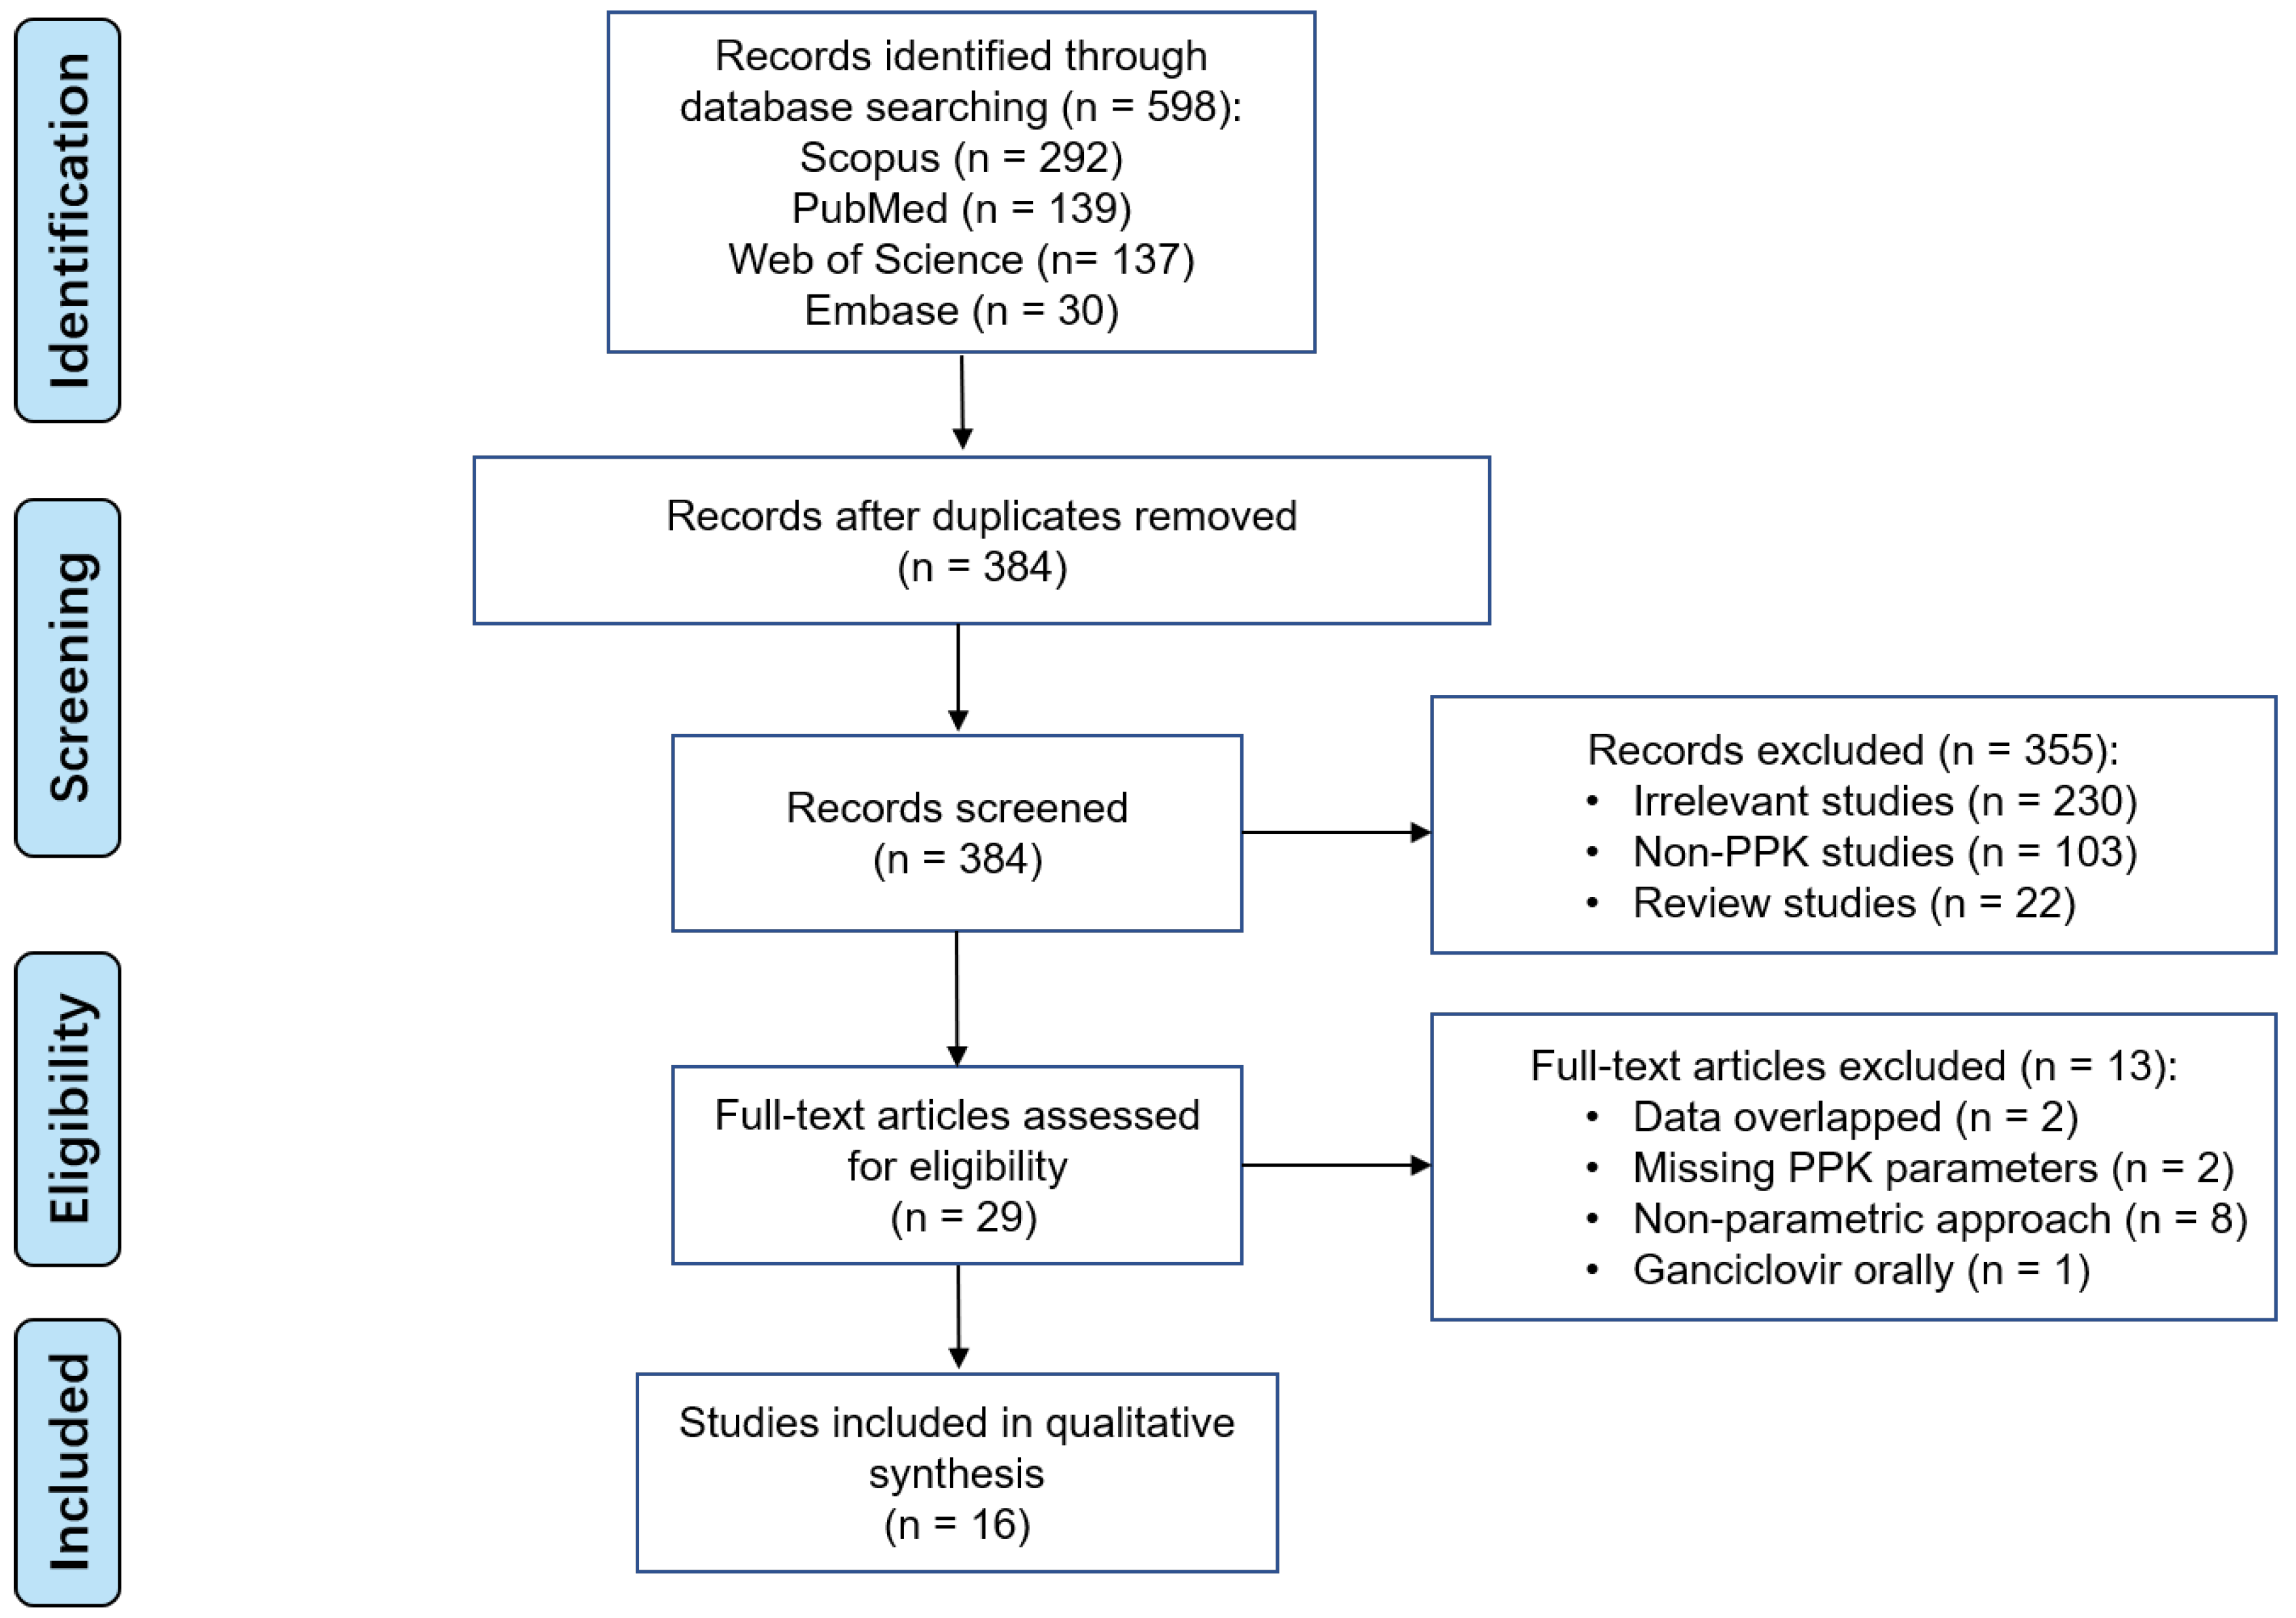
598 studies were found in the initial search across various databases. A total of 16 studies were included in the final analysis, as shown in Figure 1. No additional records were identified from other sources.
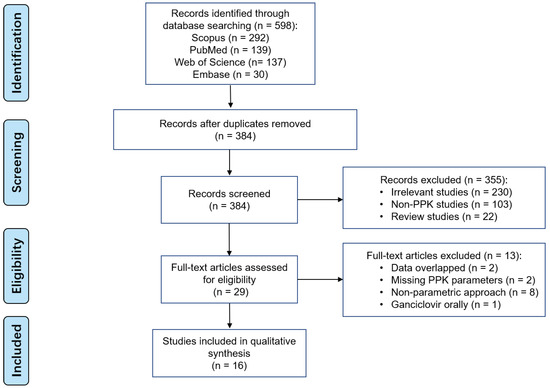
Figure 1.
PRISMA flow diagram for the identification of ganciclovir parametric PPK studies.
3.2. Overview of Included PPK Models for GCV and VGCV
3.2.1. Study and PPK Model Characteristics
All the included studies were published between 1995 and 2023. The characteristics of each study are summarized in Table 2. Twelve of the sixteen studies were prospective [8,11,18,19,20,21,22,23,24,25,26,27] and four studies were retrospective [9,10,28,29]. The number of subjects ranged from 8 to 105, with only two studies with less than 10 subjects [8,24]. Five studies utilized both intensive and sparse sampling strategies [8,18,20,22,27], six studies took samples by intensive sampling strategies only [9,21,23,24,26,28], one study used a sparse sampling strategy [25] and the remaining four studies did not report this information [10,11,19,29]. Seven studies were conducted only in pediatrics [8,9,11,19,20,23,29], two studies included both children and adults [25,28], and seven studies only enrolled adults [10,18,21,22,24,26,27]. Seven papers studied both GCV and VGCV [9,11,20,21,22,23,27], four were of VGCV alone [8,25,26,28], and five were of GCV [10,18,19,24,29]. The most common GCV dosing regimen was 5 mg/kg q12h [9,11,21,22,23,24,29]. For VGCV, a dose of 10 mg/kg q12h was used in children for pre-emptive therapy [8,9,23], while a dose of 900 mg q12h was prescribed in adults for treatment [21,22,25].

Table 2.
Characteristics of included population pharmacokinetic studies.
Modeling strategies and final pharmacokinetic parameters of the included studies are summarized in Table 3. Most PPK models were analyzed with NONMEM, with only two that used Monolix or Phoenix NLME [11,29]. First-order conditional estimation with interaction (FOCE-I) was the most commonly used algorithm. Eleven studies described GCV PPK as a two-compartment model [9,11,18,21,22,23,24,25,26,27,28] while another five studies concluded with a one-compartment model [8,10,19,20,29], four of which were conducted in the pediatric populations with sparse sampling [8,19,20,29]. Interestingly, our results suggested that the one-compartment model was more likely to be chosen when the sampling was sparse. In addition, studies that were conducted on critically ill patients were more likely to use the one-compartment model. Absorption of VGCV in all related studies was described as a first-order absorption process. It is important to note that the pharmacokinetics parameters reported in this study were given in terms of GCV alone. Two studies (Lalagkas et al. [27] and Caldés et al. [21], Table 3) had converted VGCV dose based on the conversion equation to arrive at the appropriate GCV dosage for inclusion in the model building process. The ratio of 0.72 was based on the difference in molecular weight for GCV and VGCV. The remaining VGCV studies that reported bioavailability did not perform such a conversion.
BSV was described by an exponential model in all the included studies. RUV was described by a proportional model in ten studies [8,10,11,18,19,22,24,25,28,29], exponential model in three studies [20,23,26], additive model in one study [9], and combined proportional and additive model in two study. Two studies reported interoccasion variability (IOV). Facchin et al. [28] found an IOV in CL of 14.4%, 77.2% in peripheral volume of distribution (Vp), and 111.4% in absorption rate constant (ka). Perrottet et al. [22] reported an IOV in CL of 12%. Two studies published before 2000 did not report model evaluation results [18,19], but after careful inspection, the performance of these two models was comparable to others. Other studies were evaluated by internal validation; three of them also underwent external validation [11,26,27]. GOF, VPC, normalized prediction distribution error (NPDE) and bootstraps were often used as internal validation methods.

Table 3.
Model strategies and final pharmacokinetic parameters of the included studies.
Table 3.
Model strategies and final pharmacokinetic parameters of the included studies.
| Study (Publication Year) | Software/ Algorithm | Fixed Effect Parameters | Between-Subject Variability (%) | Residual Unexplained Variability | Internal Validation | External Validation (N = No. of Subjects) | Model Application | Simulation Target | |
|---|---|---|---|---|---|---|---|---|---|
| Lalagkas et al. (2023) * [27] | NONMEM / FOCE-I | CL (L/h) Vc (L) Q (L/h) Vp (L) Ka (1/h) F Tlag (h) | =6.93 × (CKD-EPI/55)0.817 × (BW/70)0.75 = 43.1 × (BW/70) = 9.23 × (BW/70)0.75 = 219 × (BW/70) = 0.766 = 0.699 = 0.331 | 29.9 36.1 / 103.4 45.7 16.6 / | 28.2% (proportional error) 0.237 mg/L (additive error) | GOF pcVPC NPDE Bootstrap | N = 22 | evaluate and design dosing regime | AUC0–24h: 40–50 mg/L·h |
| Nguyen et al. (2021) [11] | Monolix / SAEM | CL (L/h) Vc (L) Q (L/h) Vp (L) Ka (1/h) F | =2.55 × (BW/11.7)0.75 × (eGFR/167)0.763× 0.806critically ill = 5.96 × (BW/11.7) = 0.222 × (BW/11.7)0.75 = 1.29 × (BW/11.7) = 0.506 = 0.438 | 48.6 46.9 / / / / | 47.7% (proportional error) | GOF NPDE pcVPC | N = 35 | design dosing regime | preventive AUC0–24h: 40–80 mg·h/L curative AUC0–24h: 80–120 mg·h/L |
| Franck et al. (2021) [9] | NONMEM / NR | CL (L/h) Vc (L) Q (L/h) Vp (L) Tlag (h) Ka (1/h) F | =6.9 × (BW/26.7)0.75 × (CrCL/149.8)0.88 = 9.7 × (BW/26.7) = 10.9 = 7.6 × (BW/26.7) = 0.33 = 0.73 = 0.43 | 66.3 76.8 / / / 83.7 55.7 | 0.98 mg/L (additive error) | GOF pcVPC NPDE Bootstrap | NR | design dosing regime | AUC0–24h: 40–60 mg·h/L |
| Chen et al. (2021) [26] | NONMEM / FOCE | CL/F (L/h) Vc/F (L) Q/F (L/h) Vp/F (L) Ka (1/h) Tlag (h) | =7.09 × (1 + CLcr/68.3 × 1.08) = 10.8 = 3.96 = 174 = 0.23 = 0.93 | 27.2 153 63.1 107 / / | 42.9% (exponential error) | GOF VPC Bootstrap | N = 30 | LSS design dosing regime | AUC0–24h: 40–50 mg·h/L |
| Li et al. (2021) [29] | Phoenix NLME / FOCE-LB | CL (L/h) Vc (L) | =5.23 × KF0.92 × (BW/12.0)1.02 = 11.35 × (BW/12.0)0.80 | 12.9 65.8 | 8.23% (proportional error) | GOF VPC Bootstrap NPDE | NR | design dosing regime | AUC0–24h: 40–50 mg·h/L |
| Krens et al. (2020) [10] | NONMEM / FOCE-I | CL (L/h) Vc (L) | =2.3 × (CKD-EPI/65)0.71 = 42 | 47.0 80.0 | 43% (proportional error) | GOF VPC Bootstrap | NR | evaluate dosing regime | Ctrough > 1.5 mg/L |
| Facchin et al. (2019) [28] | NONMEM / FOCE-I | CL/F (L/h) Vc/F (L) Q/F (L/h) Vp/F (L) Ka (1/h) Tlag (h) | =9.07 × (SCR/72.5)-0.768 × BSA1.31 × 1.15GENDER = 45 × BSA1.28 × 1.14GENDER = 1.46 = 18.5 = 6.96 = 0.86 | 16.0 9.3 / 54.6 59.2 / | 23.5% (proportional error) | GOF pcVPC NPDE Bootstrap | NR | design dosing regime | AUCss-12h AUCss-24h |
| Horvatits et al. (2014) [24] | NONMEM / FOCE | CL (L/h) Vc (L) Q (L/h) Vp (L) | =2.2 = 32.4 = 16.8 = 33.5 | 61.5 33.6 34.7 60.6 | 7.22% (proportional error) | GOF VPC | NR | design dosing regime | AUC0–24h: 50 mg·h/L Ctrough > 2 mg/L |
| Vezina et al. (2014) [25] | NONMEM / FOCE-I | CL/F (L/h) Vc/F (L) Q/F (L/h) Vp/F (L) Ka (1/h) Tlag (h) | =14.5 × ((CLcr/60) × (70/BW))0.492 × (BW/70)0.75 = 87.5 × (BW/70) = 4.80 × (BW/70)0.75 = 42.6 × (BW/70) = 3 = 0.5 | 33.5 / / / / / | 32.7% (proportional error) | GOF VPC NPDE Bootstrap | NR | evaluate dosing regime | AUC0-ꝏ: 40–50 mg·h/L |
| Vezina et al. (2010) [8] | NONMEM / FOCE-I | CL/F (L/h) Vc/F (L) Ka (1/h) | =7.33 = 35.1 = 0.85 | 36.3 41.4 74.3 | 33.5% (proportional error) | GOF | NR | analysis of efficacy | AUC0–ꝏ |
| Caldés et al. (2009) * [21] | NONMEM / FOCE-I | CL (L/h) Vc (L) Q (L/h) Vp (L) Ka (1/h) F Tlag (h) | =7.49 × (CLcr/57) = 31.90 = 10.2 = 32.0 = 0.895 = 0.825 = 0.382 | 32.7 47.6 / / 68.1 22.1 / | 14.3% (proportional error) 0.465 μg/mL (additive error) | GOF Bootstrap | NR | evaluate and design dosing regime | AUC0–24h: 45 mg·h/L |
| Perrottet et al. (2009) [22] | NONMEM / FOCE | CL (L/h) Vc (L) Q (L/h) Vp (L) F Ka (1/h) | =θGraftType × GFRMDRD × 1.21sex = 24 × (BW/70) × 0.78sex = 4.1 = 22 = 0.6 = 0.56 | 26 20 / / / / | 21% (proportional error) | GOF | NR | analysis of prophylactic efficacy and tolerability | AUC Ctrough |
| Zhao et al. (2009) [23] | NONMEM / FOCE | CL/F (L/h) Vc/F (L) Vp/F (L) Q/F (L/h) Ka (1/h) Tlag (h) | =8.04 × (CLcr/89)2.93 + 3.62 × (BW/28) = 5.2 = 30.7 = 3.97 = 0.369 = 0.743 | 23.83 58.22 / / 32.25 / | 20.93% (exponential error) | GOF VPC Bootstrap | NR | design dosing regime | AUC0–24h: 45 mg·h/L Ctrough: 0.5 mg/L, 1 mg/L |
| Acosta et al. (2007) [20] | NONMEM / FOCE-I | CL (L/h) V (L) Ka (1/h) F | =0.146 × BW1.68 = 1.15 × BW = 0.591 = 0.536 | 28.4 / / 12.4 | 45.4% (exponential error) | GOF | NR | evaluate dosing regime | AUC0–12h: 27 mg·h/L |
| Zhou et al. (1996) [19] | NONMEM / NR | CL (L/h) Vc (L) | =0.262 + (0.00271 × ASCC) = 0.627 + (0.437 × BW) | 35.4 COV = 28.5 30.1 | 8.46% (proportional error) | NR | NR | evaluate effect of covariates | concentration–time profiles |
| Yuen et al. (1995) [18] | NONMEM / NR | CL (L/h) Vc (L) Vp (L) Q (L/h) | =0.382 + 0.168 × BW × CLcr/100 × (1-T) × (1-CMV) = 0.381 × BW = 0.511 × BW = 13.4 | 47.5 27.5 / / | 36.1% (proportional error) | NR | NR | evaluate effect of HIV | concentration–time profiles |
*: These two models converted the VGCV doses to their equivalent GCV content multiplying the VGCV dose by 0.72 (the ratio between the molecular weights of GCV and VGCV). ASCC: approximated creatinine clearance from serum (mL/min/1.73 m2); BSA: body surface area (m2); BW: body weight (kg); CKD-EPI: the estimated glomerular filtration rate calculated by the Chronic Kidney Disease Epidemiology Collaboration (CKD-EPI) equation; CL: clearance; CLcr: creatinine clearance (mL/min); critically ill: 1 for critically ill patients and 0 for others; CMV: CMV = 0 for CMV-shedding patients and 0.41 for patients with CMV retinitis; COV: covariance between CL and Vc; CrCL: creatinine clearance (mL/min/1.73 m2); Ctrough: trough concentration; eGFR: the estimated glomerular filtration rate (mL/min/1.73 m2); F: bioavailability; FOCE: first-order conditional estimation; FOCE-I: first-order conditional estimation with the interaction; FOCE-LB: first-order conditional estimation method with the η-ε interaction option; GENDER: gender, 1 for male and 0 for female; GFRMDRD: four-variable modification of diet in renal disease estimated GFR (L/h); GOF: goodness-of-fit plot; Ka: absorption rate constant; KF: kidney function, KF = eGFR/(120 mL/min/ 1.73 m2); LSS: limited sampling strategy; NPDE: normalized prediction distribution errors; pcVPC: prediction-corrected visual predictive check; Q: intercompartment clearance; SAEM: stochastic approximation expectation maximization; SCR: serum creatinine concentration (μmol/L); Sex: for male, sex = 0 and for female, sex = 1; T: T = 0 for non-transplant patients and 0.76 for transplant patients; Tlag: lag time; Vc: central volume of distribution; Vp: peripheral volume of distribution; VPC: visual predictive check; θGraftType: θkidney = 1.68, θheart = 0.86, θlung/liver = 1.17.
3.2.2. Application of Model-Based Simulation
All studies performed model-based simulations. A variety of PK endpoints were utilized in simulations. AUC was used in 13 studies, while AUC0–24h was most commonly used in 8 studies. AUC0–12h and AUC0-inf were also used. Four studies utilized Ctrough as their PK endpoint. Nine studies proposed new dosing regimens to achieve targets [9,11,21,23,24,26,27,28,29]. Five studies evaluated existing dosing regimens [10,20,21,25,27]. Two studies performed efficacy and safety analyses [8,22], and two of the earliest studies evaluated the covariate effect on PK behaviors [18,19].
3.3. Overview of PPK Model Repository
3.3.1. QC result
Similarity comparison was used to ensure accuracy of model repository construction. After excluding construction errors, the 95%CI of the PK parameters’ geometric mean was mainly distributed within 70–150% of the geometric means of same virtual patients.
PK behaviors of GCV in the same pediatric typical virtual patients from different PPK models were comparable (Supplementary Material Figure S1). However, t1/2 of Horvatits et al. [24] was larger than others because its original data came from critically ill patients receiving continuous venovenous hemodiafiltration (CVVHDF). It should be noted that the final PPK model had controlled for the extracorporeal therapy given to the patients. After oral administration of VGCV, the PK behaviors of GCV in the same typical virtual patients from most PPK models were also comparable (Supplementary Material Figure S2) except that virtual infants of Vezina et al. [25] showed lower t1/2 values, and this could be attributed to a limited 3 out of 95 subjects between 0 and 24 months, thus this model could not describe the process of GCV in typical virtual infants very well.
After QC and subsequent verification, the model repository quality was deemed satisfactory.
3.3.2. Comparison of GCV and VGCV PK Profiles
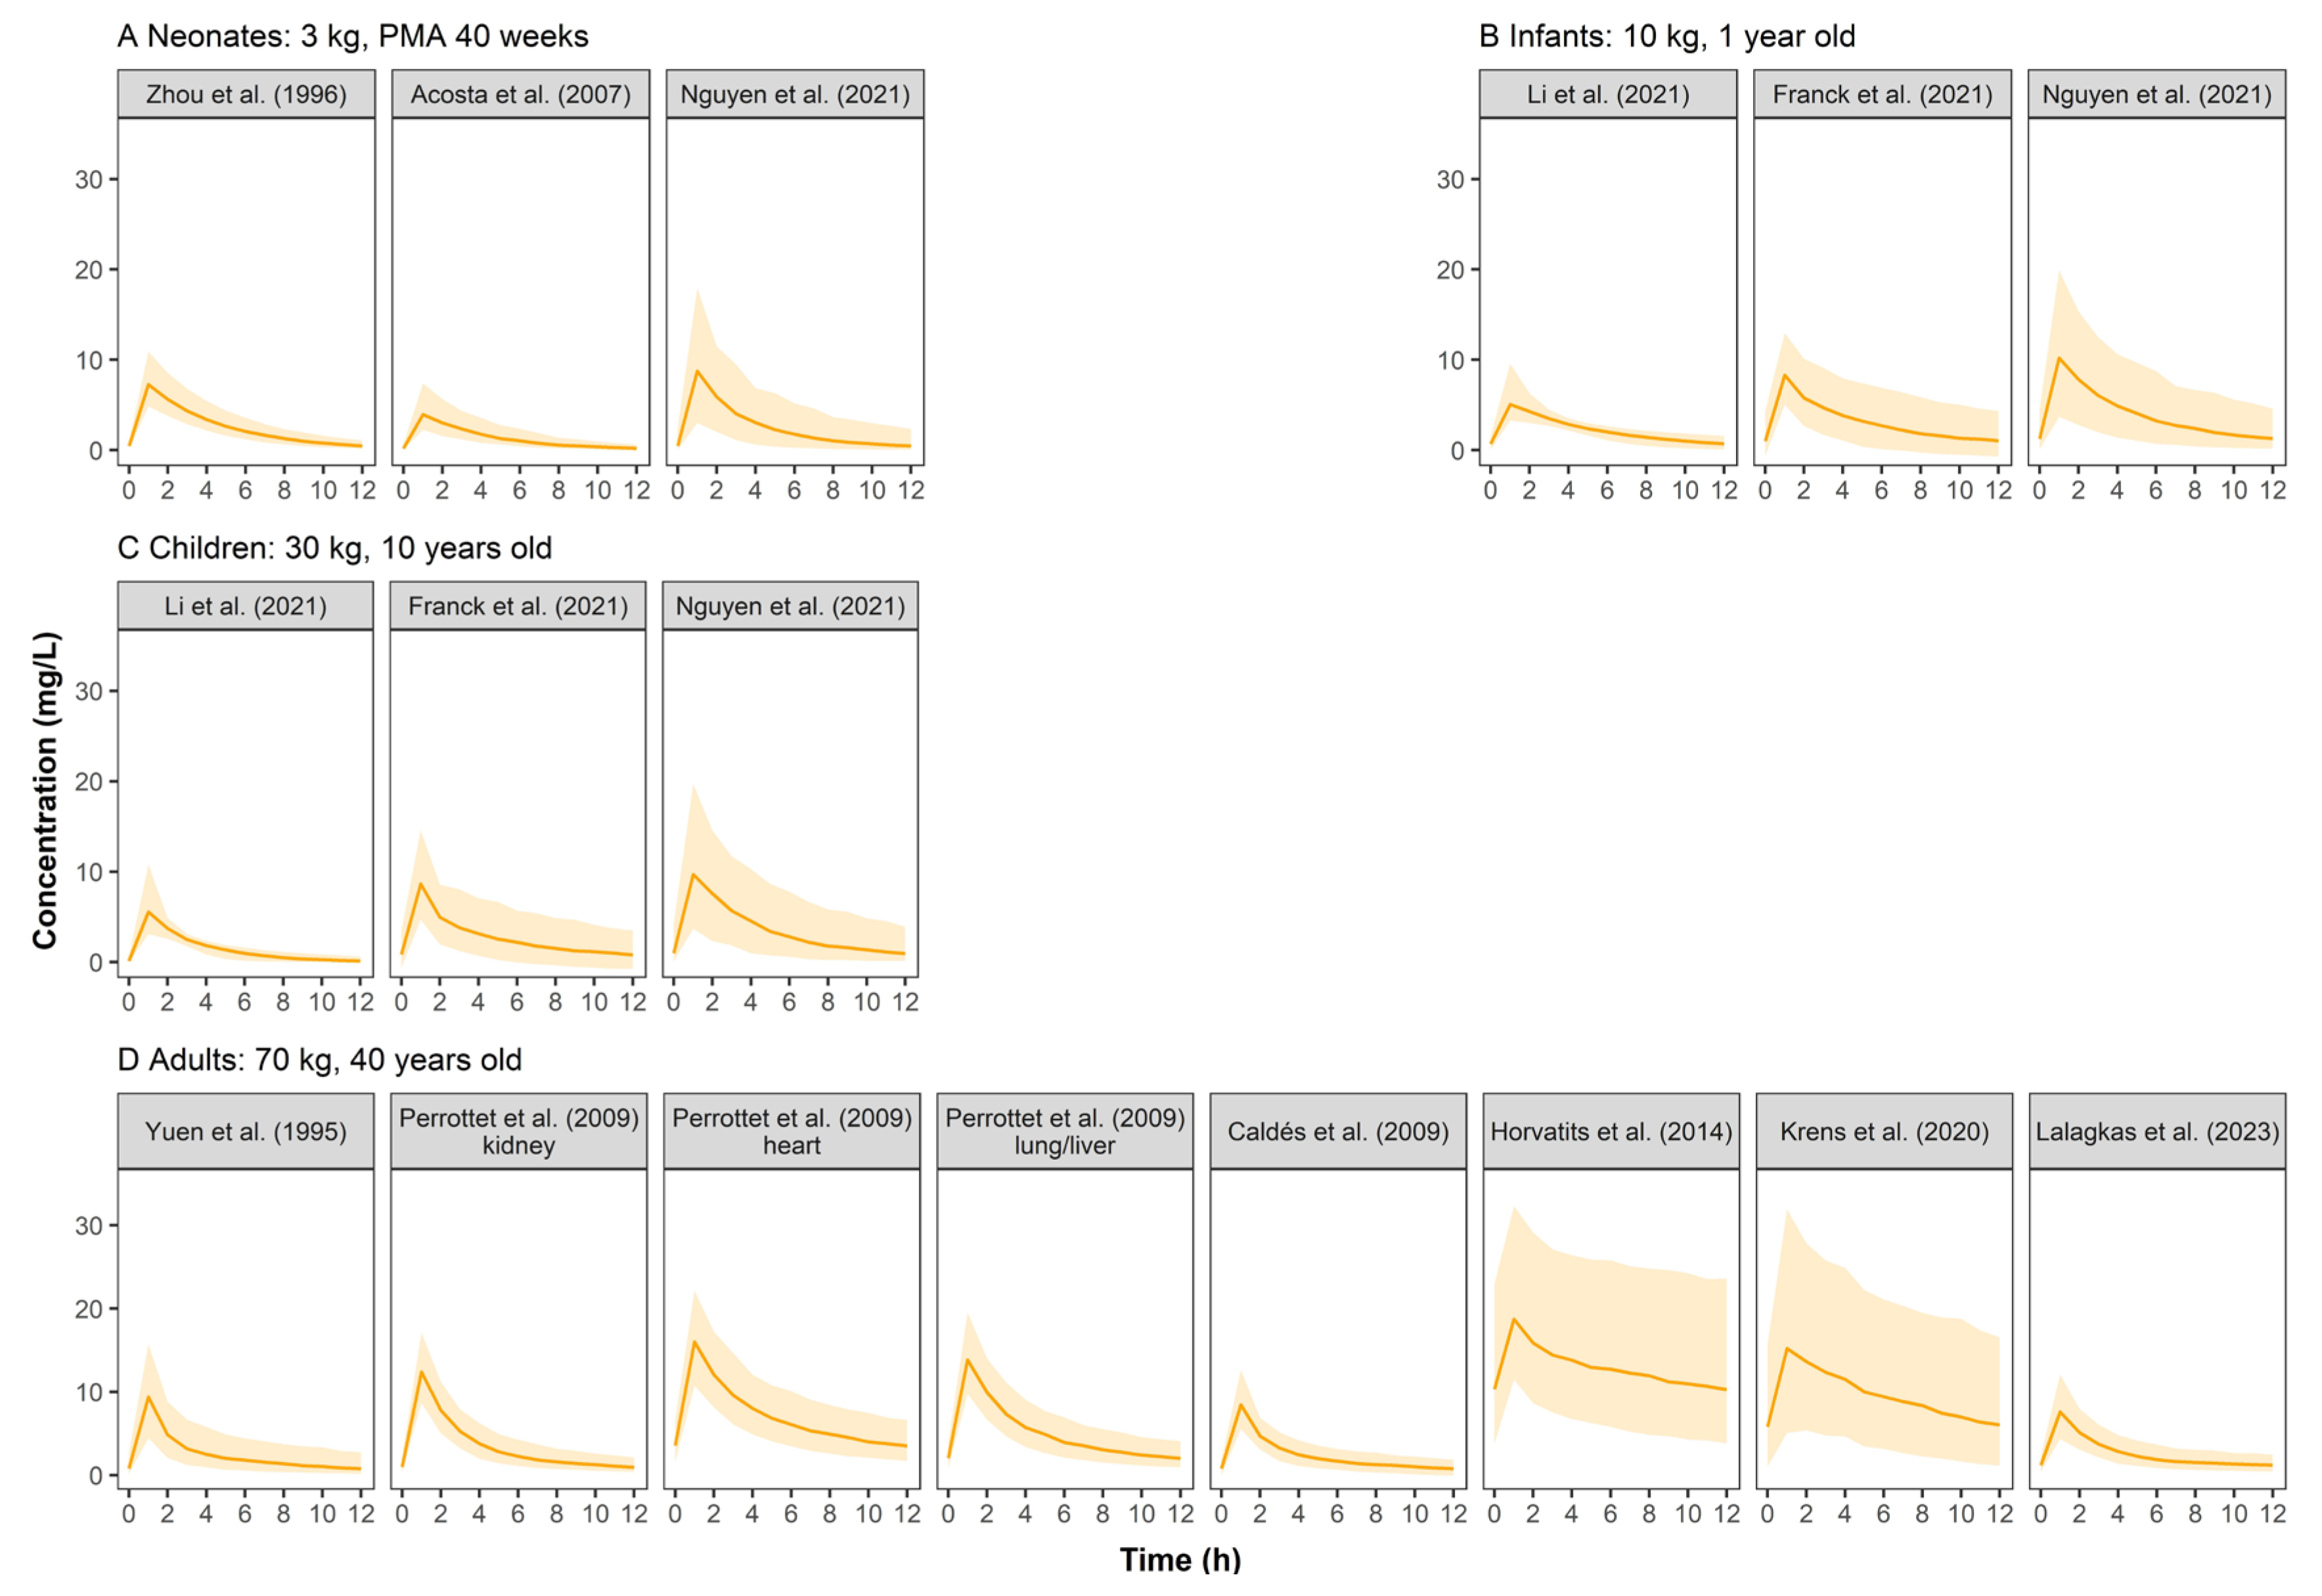
Simulated GCV concentration–time profiles were displayed in Figure 2. The PK profiles across pediatrics were comparable because the weight-based dosing regimen had largely resolved PK differences between pediatrics, indicating that body weight could significantly influence GCV’s PK. Adults showed higher serum concentrations than pediatrics at a similar dose of 5 mg/kg. Furthermore, simulated concentrations based on the models established by Krens et al. [10] and Horvatits et al. [24] showed high variability when the dosing regimen of 5 mg/kg q12h was used.
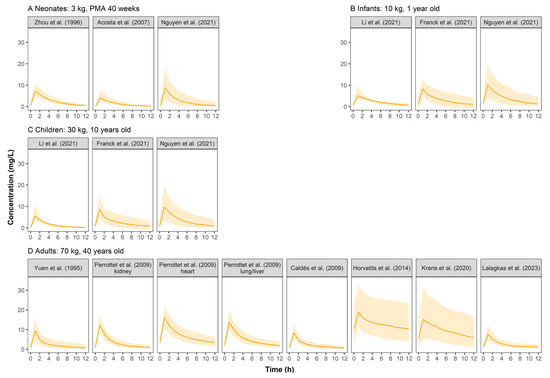
Figure 2.
Simulated ganciclovir concentration–time profiles at steady state for neonates (A), infants (B), children (C), and adults (D) after intravenous infusion of ganciclovir in retrieved studies. The solid line represents the median of the simulated concentration–time profile. The light shadows represent the 10th–90th percentiles of the simulated concentration–time profiles. All patients were assumed to be males receiving GCV monotherapy at 5 mg/kg q12h.
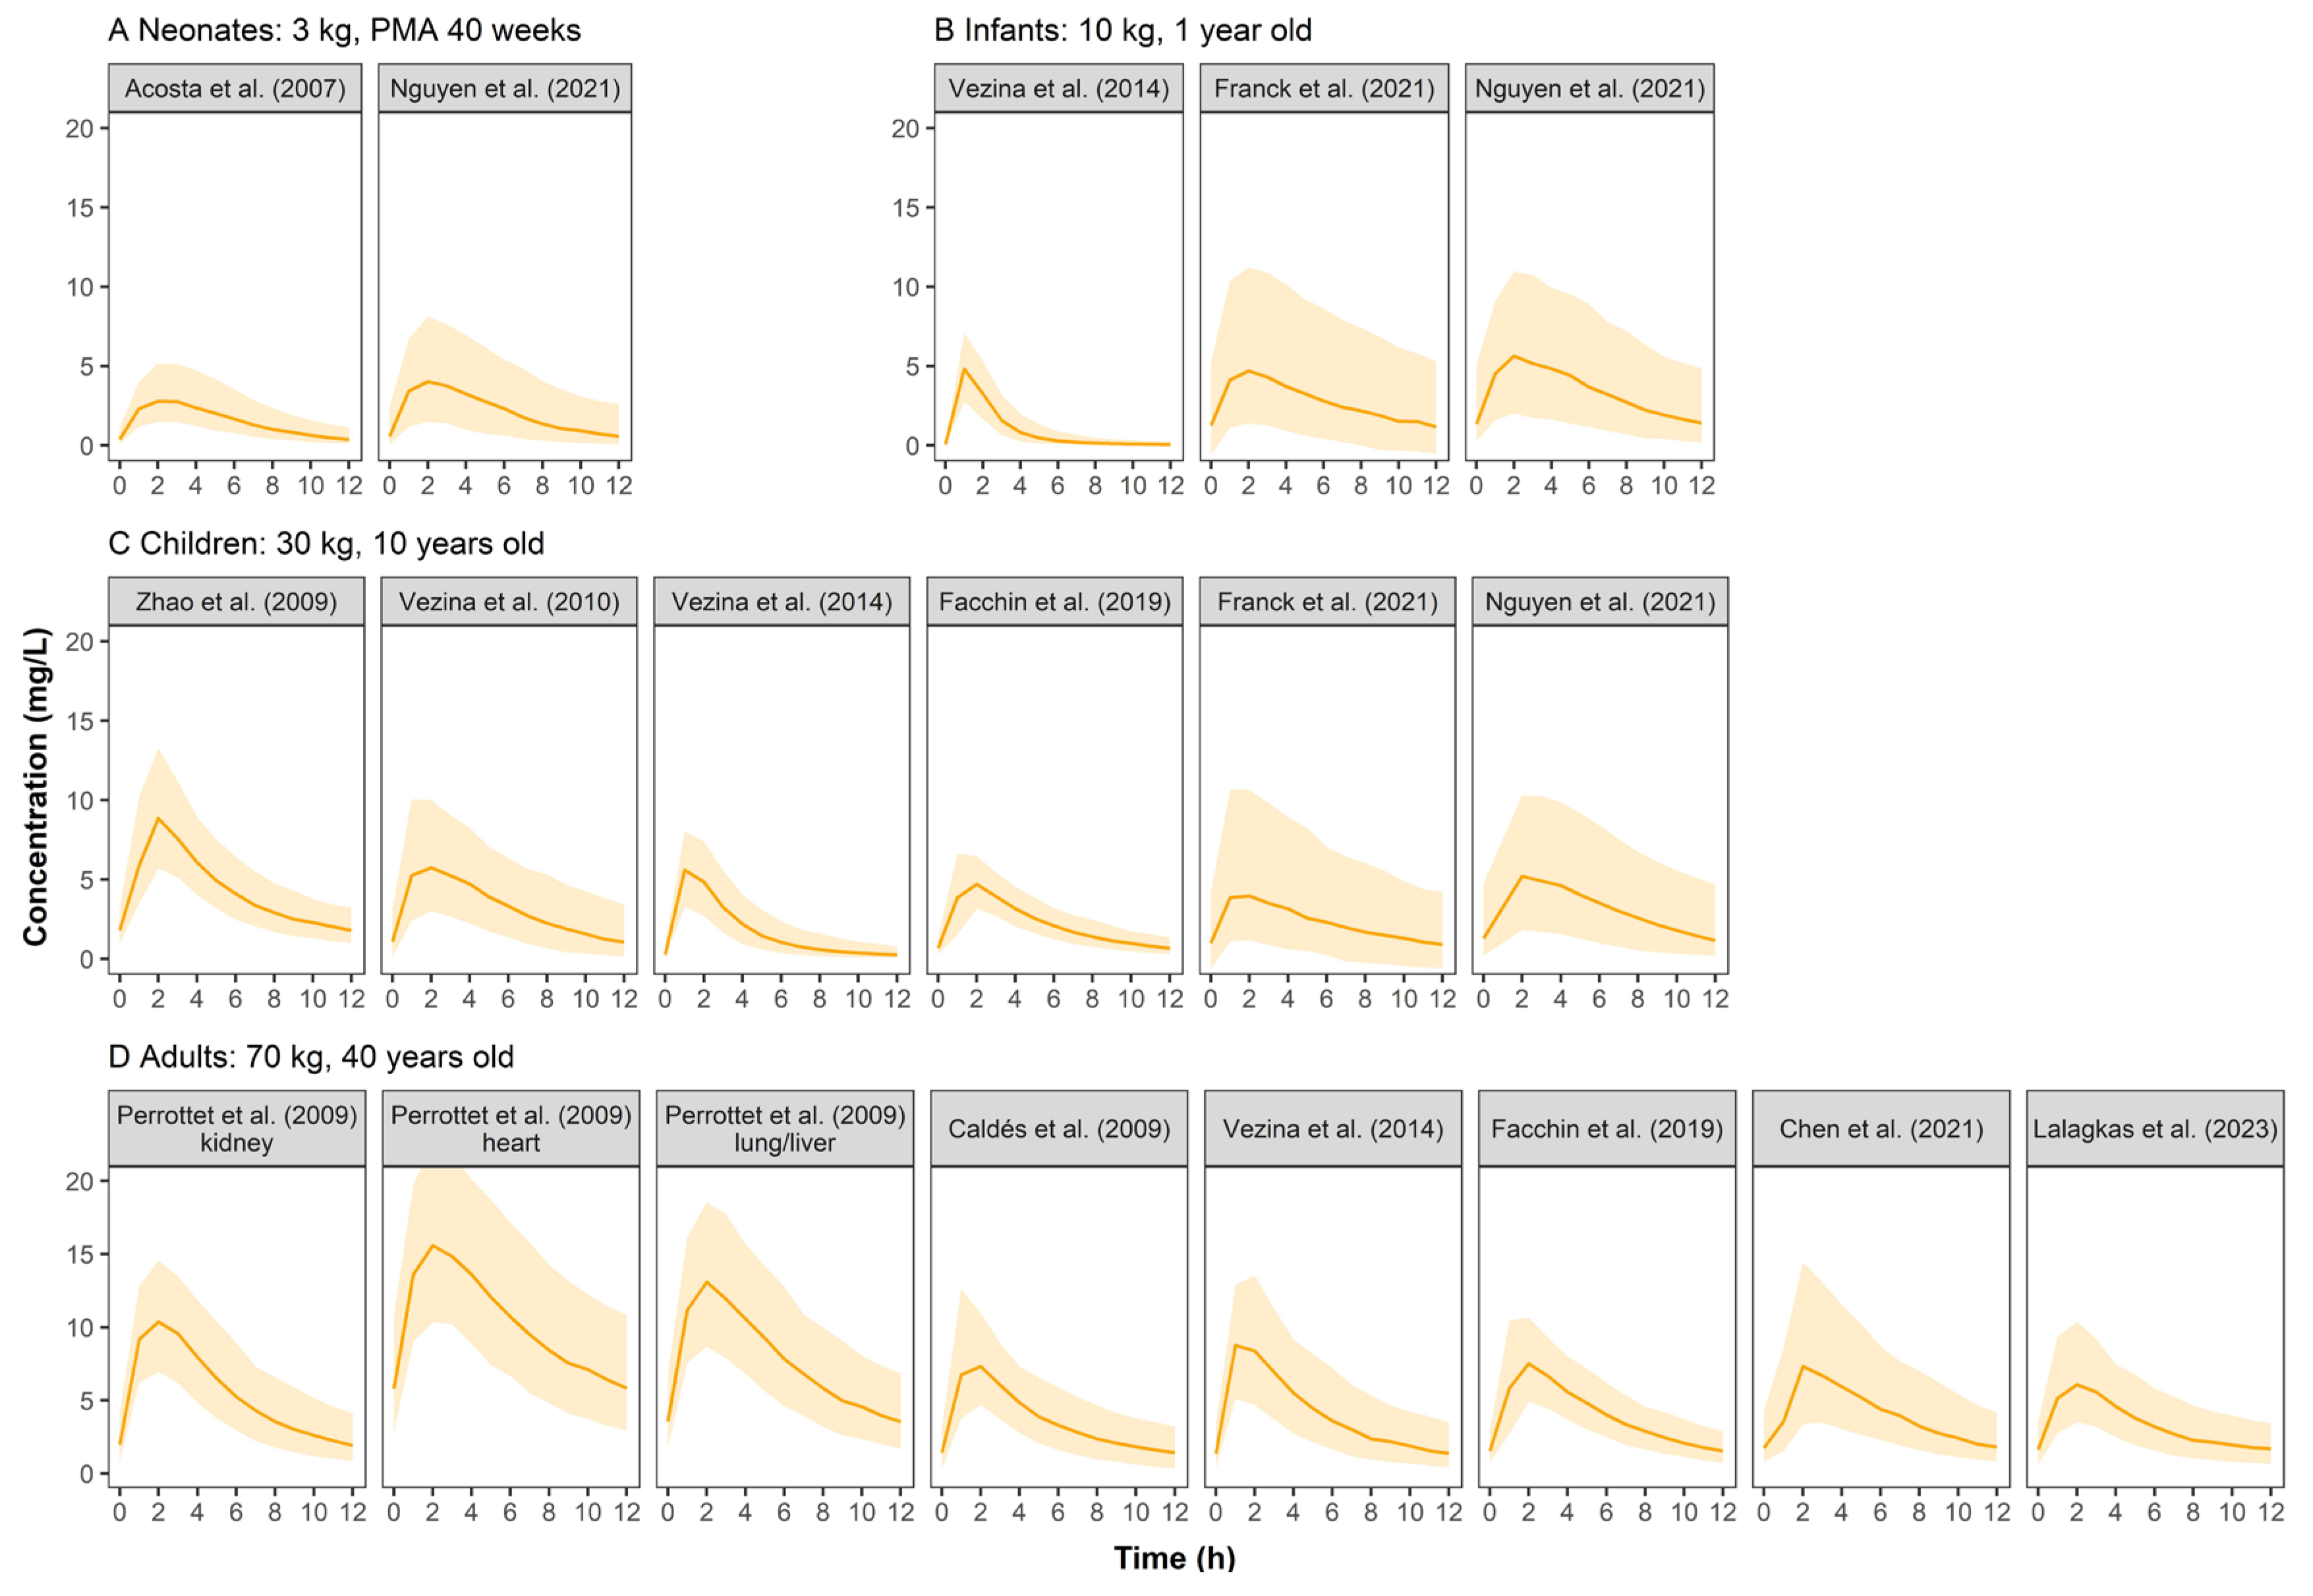
Figure 3 shows the concentration–time profiles of VGCV. In pediatric groups, the simulated profiles were comparable between published models. Adults had higher concentrations than pediatrics.
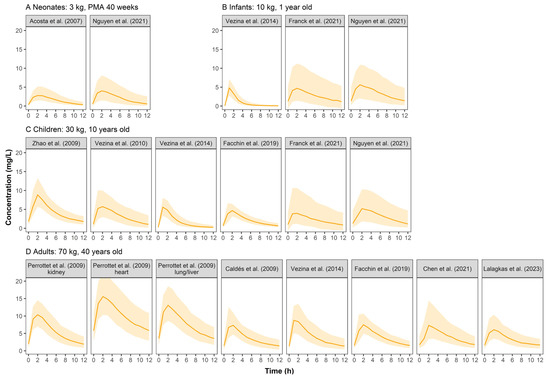
Figure 3.
Simulated ganciclovir concentration–time profiles at steady state for neonates (A), infants (B), children (C), and adults (D) after oral administration of valganciclovir in retrieved studies. The solid line represents the median of the simulated concentration–time profile. The light shadows represent the 10th–90th percentiles of the simulated concentration–time profiles. All patients were assumed to be males. For neonates, infants and children, VGCV monotherapy was given at a dose of 10 mg/kg q12h, while 900 mg q12h was for adults.
3.3.3. Covariate Screening and Covariate Effect
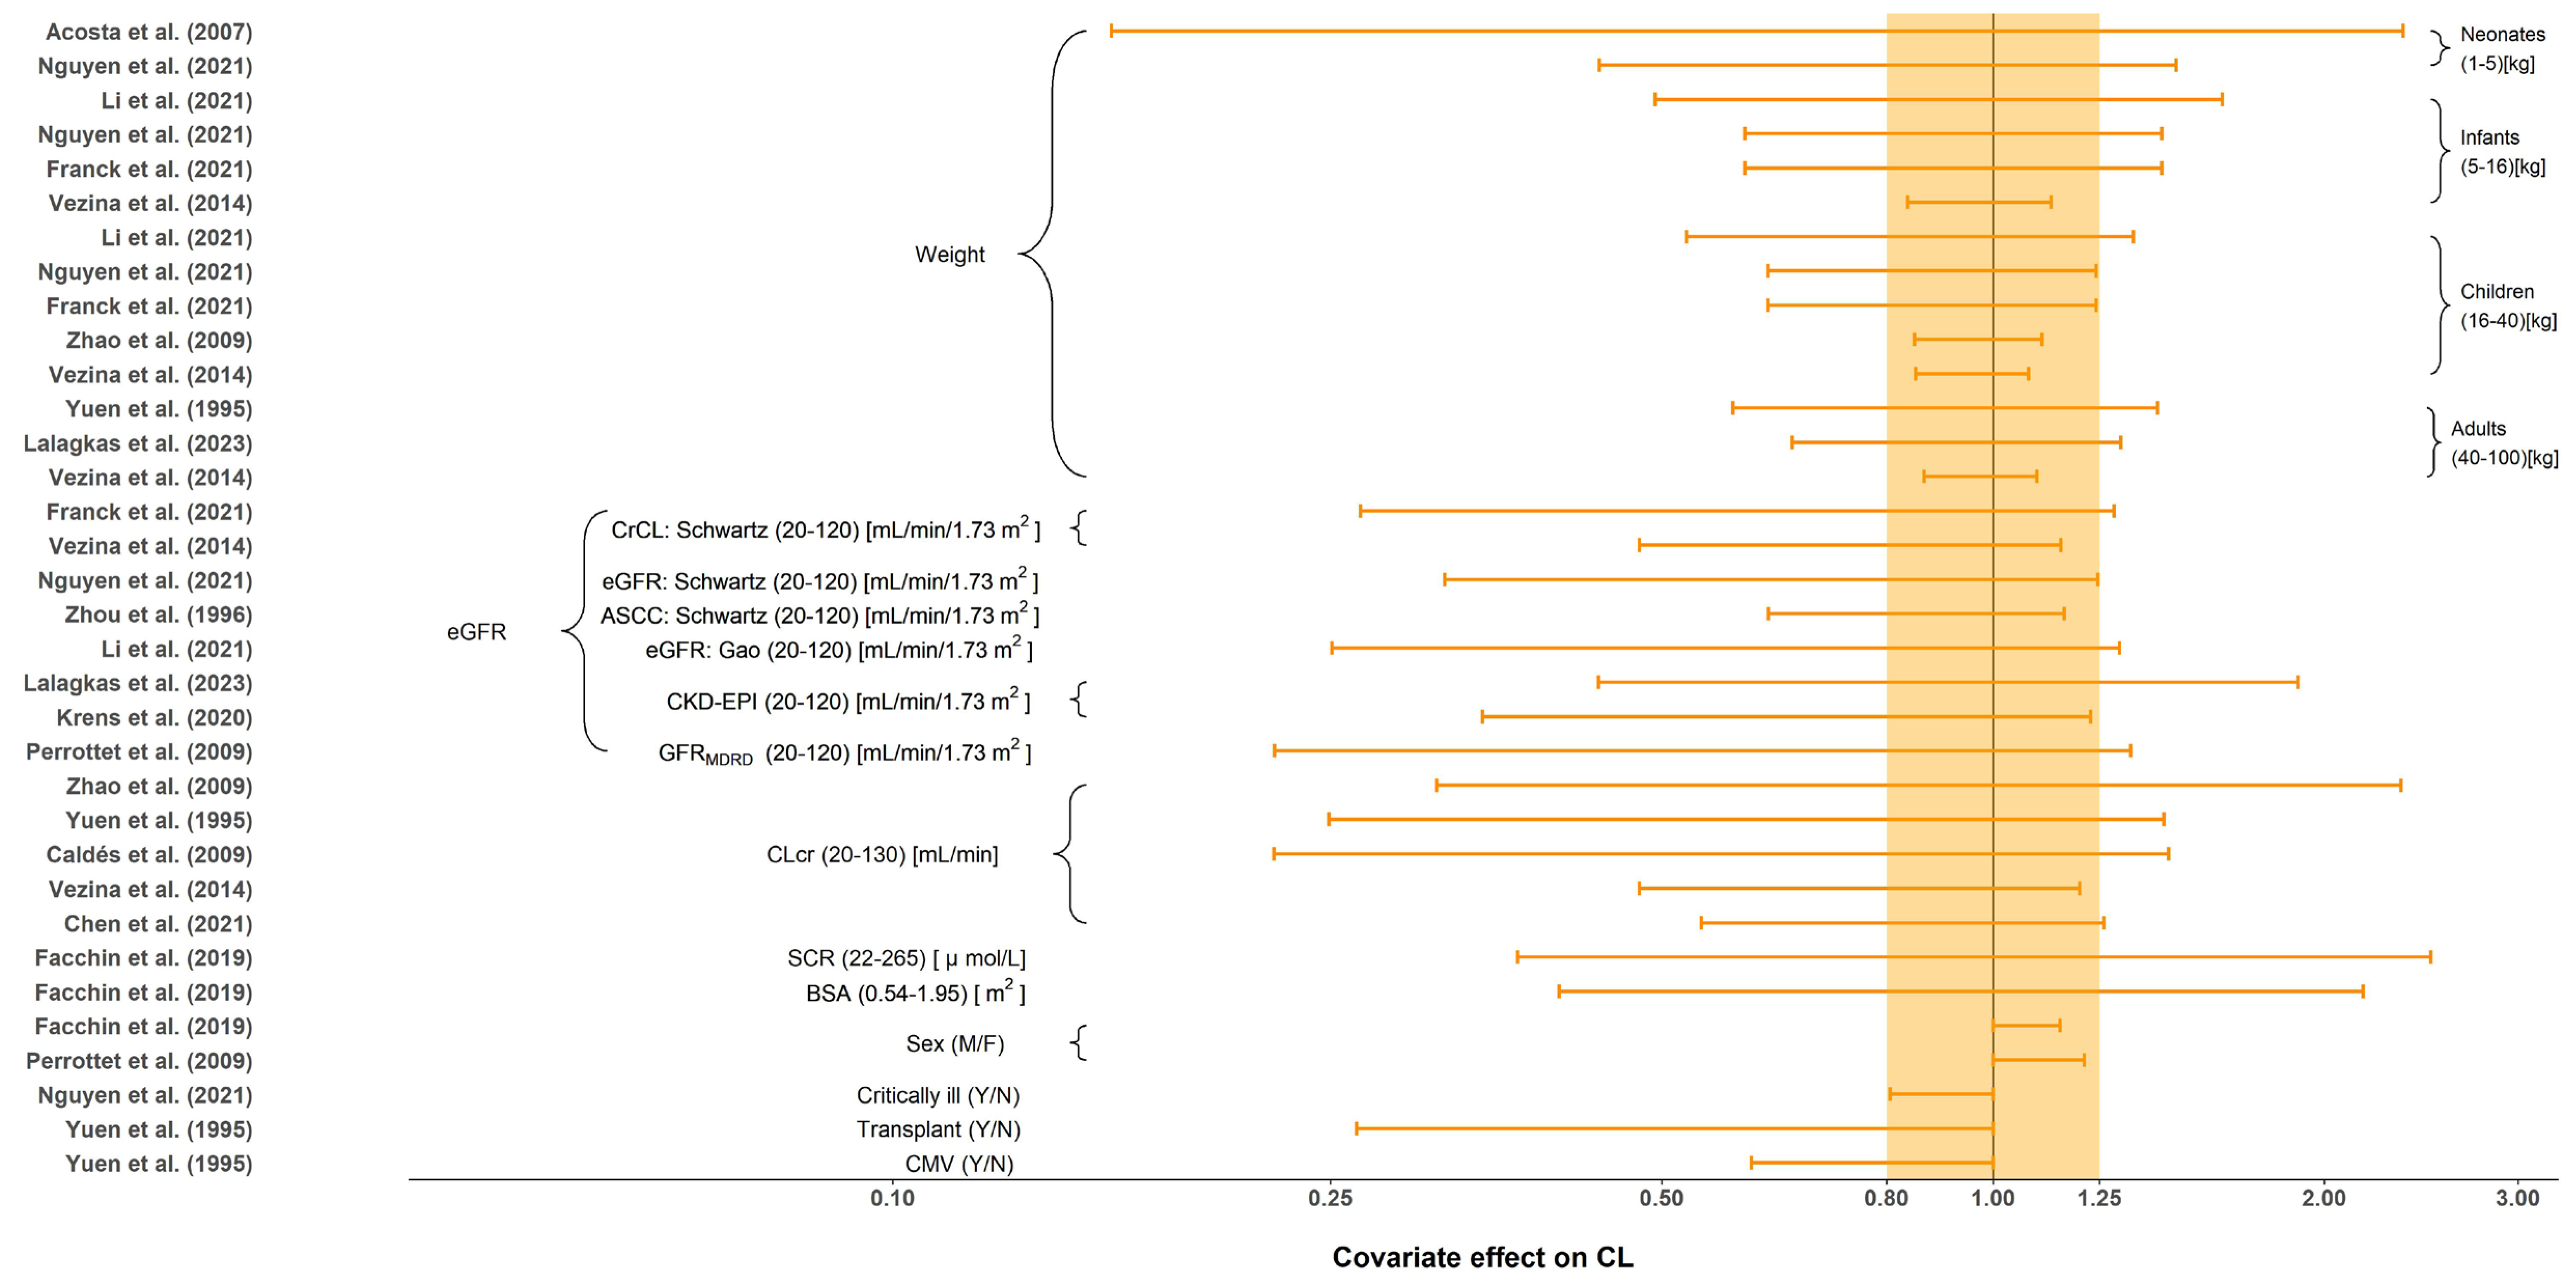
All tested covariates that had an effect on CL, distribution volume of central compartment (Vc), intercompartment clearance (Q) and distribution volume of the peripheral compartment (Vp) are summarized in Table 4. The stepwise method typically employed for covariate screening included forward inclusion and backward elimination. No covariates were investigated in Horvatits et al. [24] due to the limited number of included subjects (n = 9). The most influential covariates were body weight and renal function indicators, such as eGFR and CLcr. The impact of each covariate on CL is shown in Figure 4. Body size, including weight and BSA, were evaluated and included as significant covariates in 9 (56.3%) studies. Compared to the reference value, seven out of nine demonstrated significant impact of body size on CL with greater than 20% change under the normal range of body size [9,11,18,20,25,27,29]. Furthermore, the effect of renal function, such as CLcr, eGFR or SCR, was reported in 13 (81.3%) studies. Given the normal range of renal function, all of them demonstrated greater than 20% change in CL when compared to the reference value. Renal function affects renal clearance of GCV, which is the primary eliminate pathway of GCV. Only two studies investigated the influence of sex on CL (limited impact with less than a 20% difference) [22,28]. Yuen et al. [18] and Nguyen et al. [11] also investigated the effect of transplants, CMV-shedding, and critical illness on CL, where only transplant and CMV-shedding showed a significant influence. Body size and sex were reported to be the significant covariates on Vc. The only covariate identified on Q and Vp was weight.

Table 4.
List of tested and significant covariates in included models.
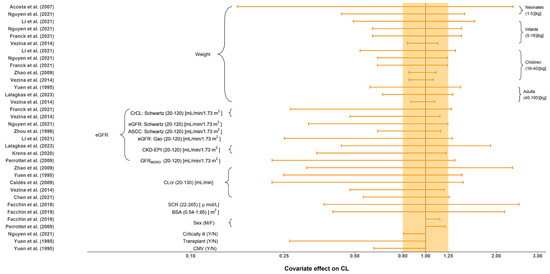
Figure 4.
Covariate effect on the clearance of ganciclovir. The horizontal bars represent the covariate effect on clearance in each study. The typical value of clearance in each study was considered to be 1. The effect of each covariate for clearance is displayed by the ratio of clearance in the range of each covariate to the typical clearance value. The shaded area ranges from 0.8 to 1.25. ASCC: approximated creatinine clearance from serum; BSA: body surface area; CKD-EPI: the estimated glomerular filtration rate calculated by the Chronic Kidney Disease Epidemiology Collaboration (CKD-EPI) equation; CLcr: creatinine clearance (mL/min); CMV: cytomegalovirus; CrCL: creatinine clearance (mL/min/1.73 m2); eGFR: the estimated glomerular filtration rate; SCR: serum creatinine; Y: yes; N: no; M: male; F: female [9,10,11,18,19,20,21,22,23,25,26,27,28,29].
3.4. Model Repository Applications
3.4.1. Probability of Target Attainment
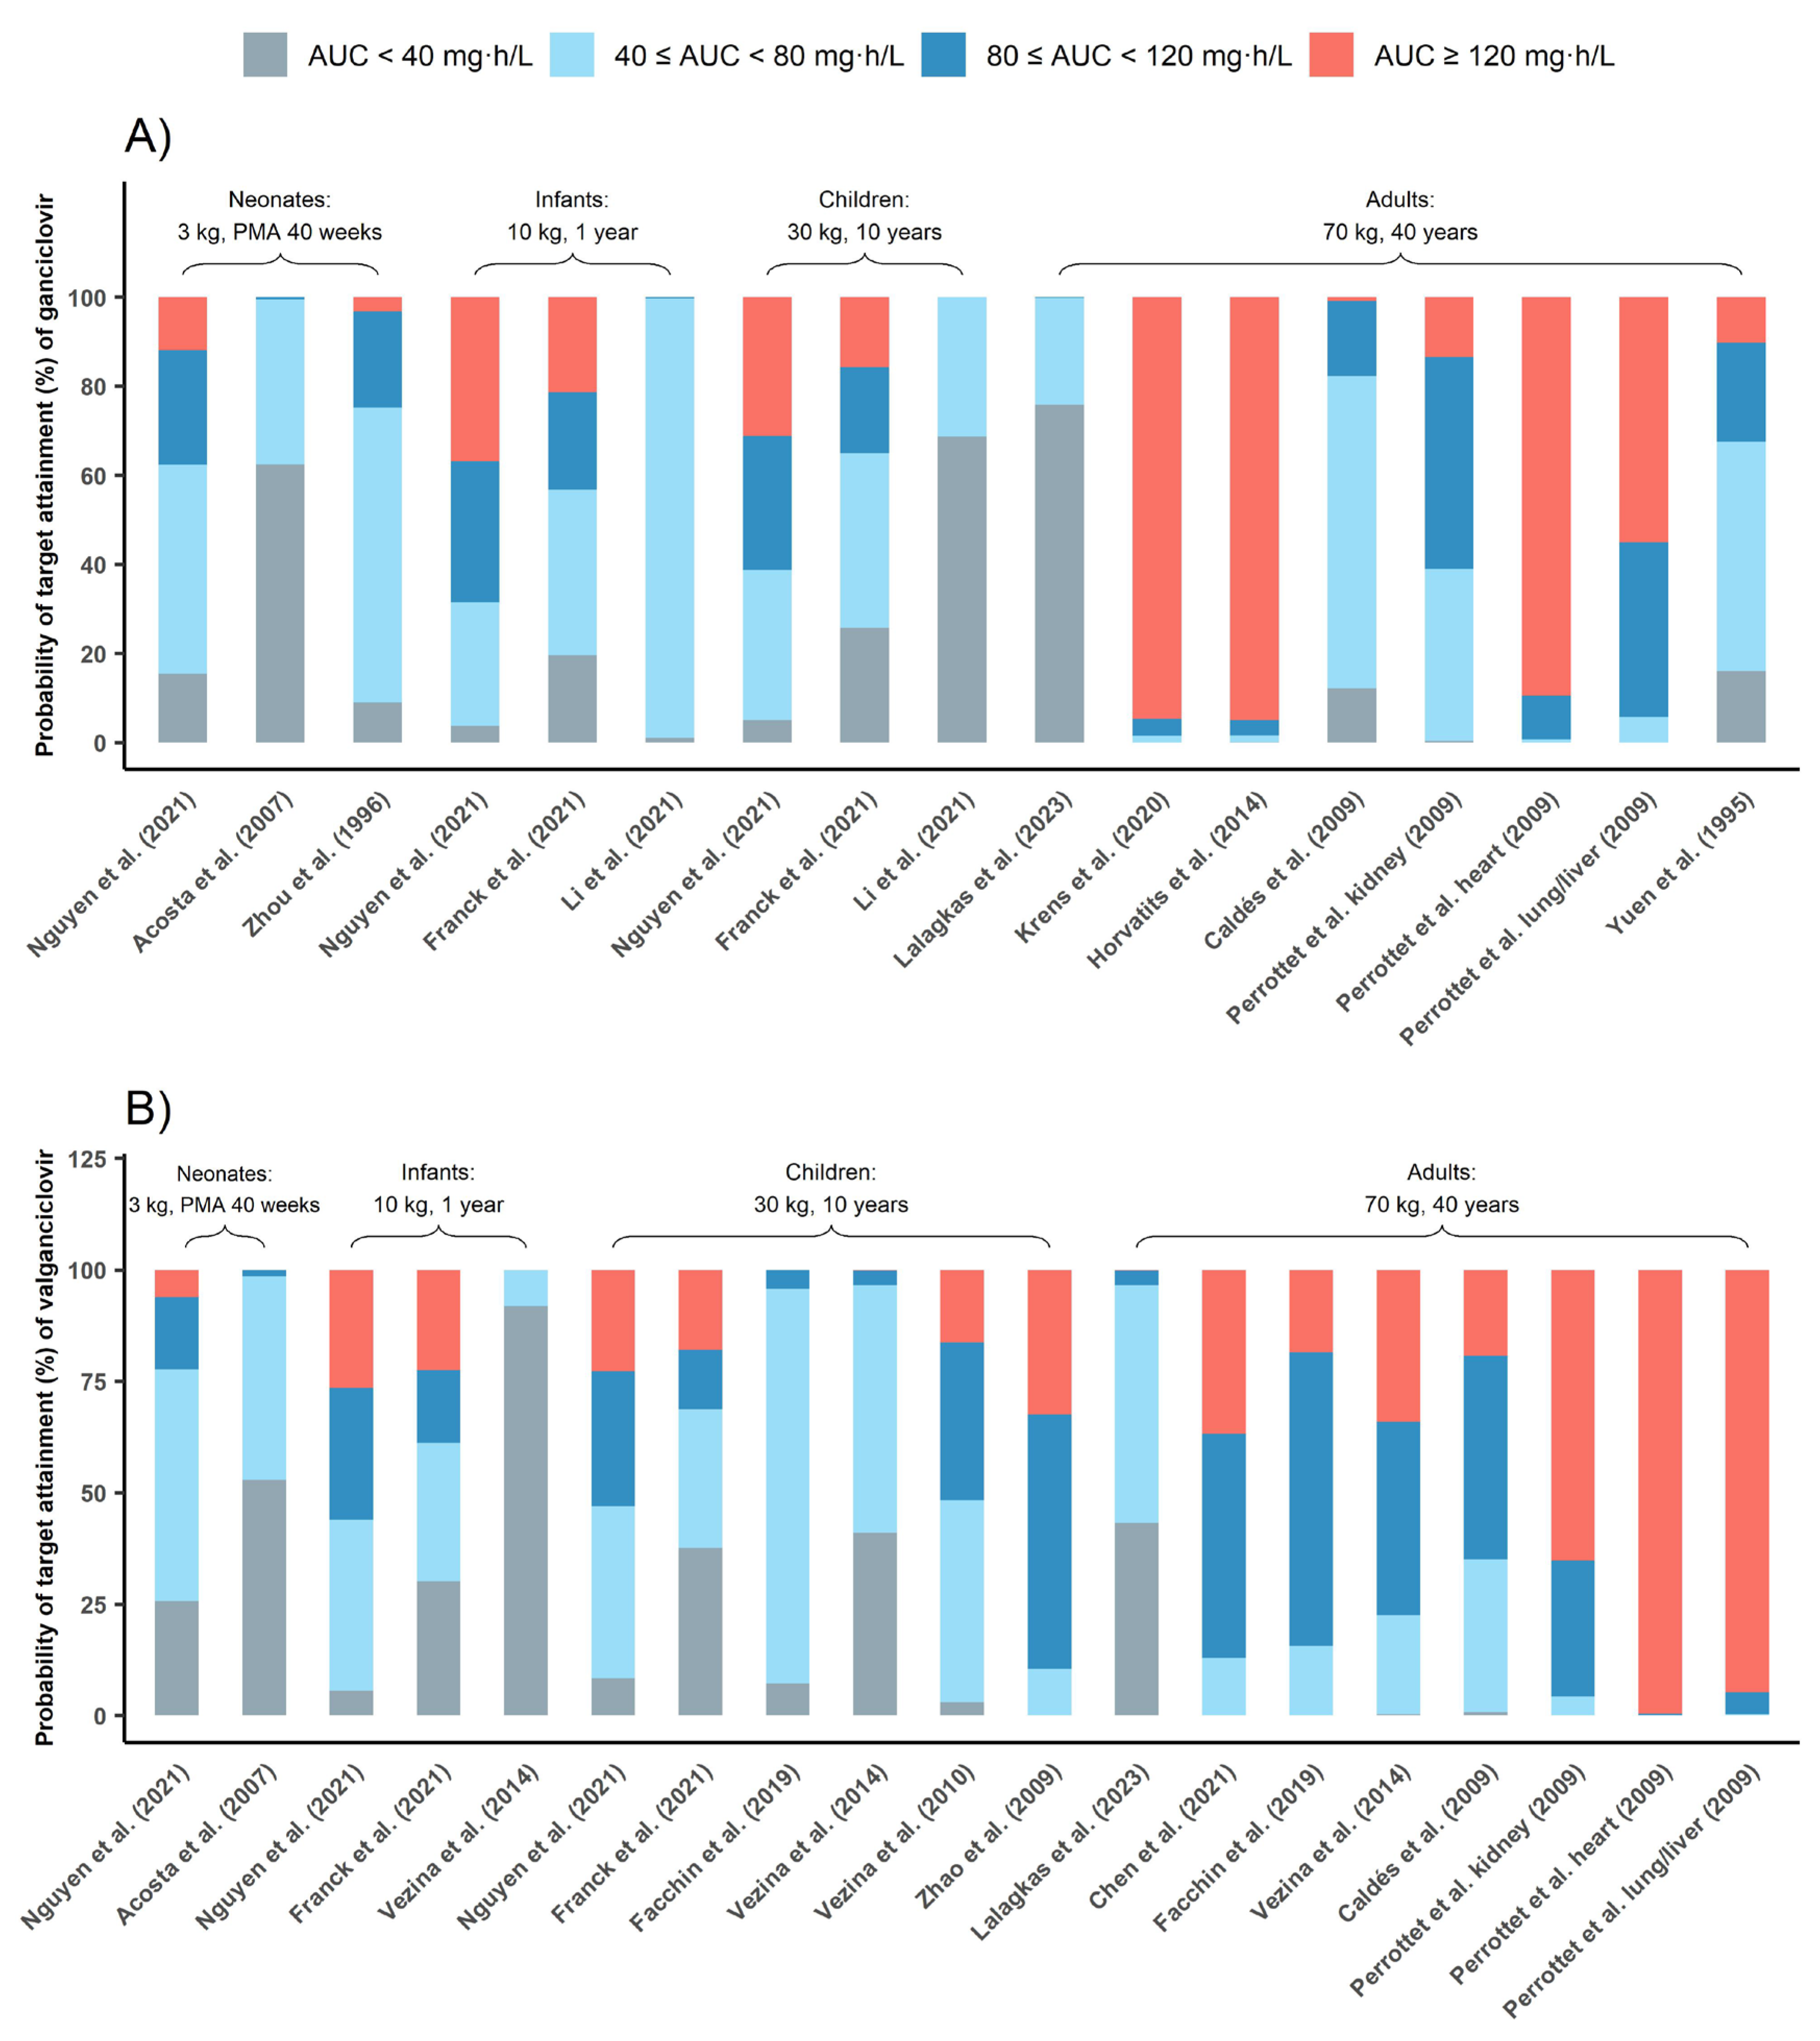
Figure 5 depicts PTA for commonly used dosing regimens based on published PPK models, with each model characterizing a specific population. Results indicated that 5 mg/kg q12h GCV dosing in adults carried a risk of overexposure (AUC0–24h above 120 mg·h/L) with three out of six models suggesting that half of the subjects were overexposed [10,22,24]. According to the PTA of all PPK models involving adults (Table S2), 51.24% adults’ AUC0–24h could exceed 120 mg·h/L with 5 mg/kg/12 h GCV dose regimen. In contrast, this dosing regimen showed good prophylaxis in most pediatric studies, 46.44% pediatrics could reach the prophylaxis target.
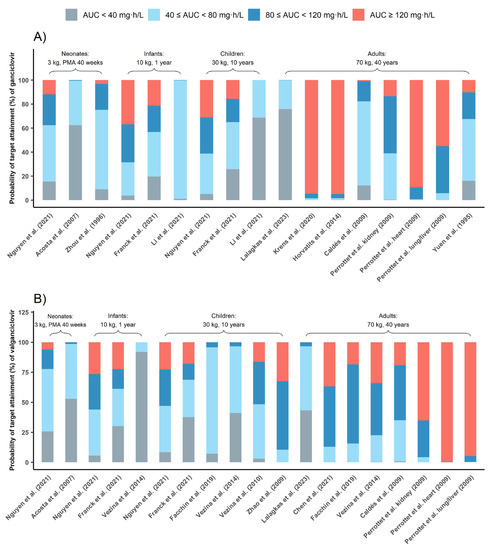
Figure 5.
Probability of target attainment (%) of ganciclovir (A) and valganciclovir (B). The grey bar represents PTAs of AUC0–24h below 40 mg·h/L, the red bar represents PTAs of AUC0–24h above 120 mg·h/L, the blue bar represents PTAs of AUC0–24h between 40 and 80 mg·h/L and the light blue bar represents PTAs of AUC0–24h between 80 and 120 mg·h/L [9,10,11,18,19,20,21,22,23,25,26,27,28,29].
Further, 10 mg/kg/12 h VGCV was also effective in achieving prophylaxis in pediatrics, while 900 mg/12 h VGCV could lead to overexposure in adults.
3.4.2. AUC calculator based on MAP-BE
As an example, we used the model established by Franck et al. [9] to develop a MAP-BE-based calculator for calculating the AUC0–24h post-administration of GCV and VGCV. It requires the patient’s dosing and sampling information, weight, and creatinine clearance (CrCL, mL/min/1.73 m2) to calculate AUC0–24h after the first dose. Its results were consistent with NONMEM (see the Supplementary Materials). This AUC calculator demo is available online. (https://ganciclovir.shinyapps.io/Example_GCVAUCCalculator/). Researchers can create similar calculators by modifying the model code (Supplementary Materials).
4. Discussion
To our best knowledge, this study was the first to build and share a parametric PPK model repository of GCV and VGCV. The repository is characterized by simulations of concentration–time profiles and covariate effect evaluation, where we demonstrated the potential of the constituent models in estimating the AUC and PTA of GCV and VGCV. The work provides evidence for individualized dosing based on the patient’s weight and renal function, as the commonly used dosing regimens tend to miss treatment targets in pediatrics.
4.1. Simulated Concentration–Time Profiles of Ganciclovir
The simulated concentration–time profiles (Figure 2) of most studies demonstrated a comparable curve in pediatrics when a dose of 5 mg/kg GCV was administered, suggesting that weight-based dosing is critical. Three studies’ (Horvatits et al. [24], Krens et al. [10], and Li et al. [29]) simulated profiles that were different from the others. We found that all three studies included critically ill patients in whom PK can be complicated by hemodynamic instability with varied volumes of distribution and fluctuating renal function. For the study of Horvatits et al., the model was also limited by the small number of patients (9 patients), with no covariates successfully included, and the IIV not clearly explained.
There were three other possible reasons why Li et al.’s PK profiles were different from others: (1) only 11.5% of the patients were children over six years old, so the 10-year-old virtual children did not match with the studied population; (2) the very sparse sampling strategy (138 samples from 104 subjects) might also limit the model performance; (3) the Gao formula [30] used in this study is more applicable to calculate eGFR of children with moderate renal failure.
4.2. Simulated Concentration–Time Profiles of Valganciclovir
The simulated concentration–time profiles of VGCV (Figure 3) were similar across pediatric studies except for Zhao et al. [23]. The patient population in Zhao et al. was unique as they were children who received a kidney transplant and mycophenolate mofetil as the immunosuppressant. It is known that mycophenolate mofetil could reduce the renal clearance of GCV, thus resulting in higher plasma concentrations in the simulation [31]. In Perrottet et al. [22], patients were stratified into three subgroups according to the type of organ transplant received. Patients who received a heart transplant had significantly higher exposure to GCV than the other two subgroups (liver and lung). The use of tacrolimus (heart subgroup) could have reduced renal blood flow to a greater extent than cyclosporine (liver and lung subgroups), resulting in the reduced renal elimination of GCV and the subsequent larger exposure to the drug [32]. Under the commonly used dosing regimen, the exposure level of VGCV in adults was similar to that of GCV at different ages. However, the exposure in pediatrics was significantly lower than GCV, indicating that dose optimization of VGCV for pediatrics is urgently needed.
4.3. Covariates Effects on Estimated PK Parameters
Eight of the 16 included studies identified body weight as a covariate on CL. Our results suggested that as age increased, the influence of weight on CL decreased. In neonates, the effect of weight on CL was marked with the clearance of those at the highest weight (5 kg) being at least 3.34 fold the CL in neonates weighing 1 kg. In contrast, the difference in clearance between the heaviest adult patient weighing 100 kg and the lightest patient weighing 40 kg was at most only 2.43 fold. This phenomenon may occur because pediatric patients are in a state of continuous growth and development, so the fluctuations are larger than in adults (the percentage of weight gain decreases with age). This is consistent with the notion that weight is often considered a significant covariate in pediatric population studies but is rarely included in adult studies.
Thirteen of the sixteen included studies identified renal function as a covariate on CL. GCV is mainly excreted in the urine through glomerular filtration and active tubular secretion. As such, the patient’s renal function would have a greater impact on the PK behavior of GCV. The forest plot suggested that regardless of the renal function indicator (i.e., eGFR, CLcr, SCR), the covariate effect on CL was clinically significant (outside the range of 80%–125%). This indicates that testing renal function’s influence is important when constructing the PPK model of GCV.
Two studies identified gender as a significant covariate, but the subsequent effect evaluation suggested that gender was not a clinically meaningful covariate on CL. The gender effect could manifest in other covariates, such as a discrepancy in body size.
4.4. Envisioning the Application of Model Repository
This study constructed a model repository of GCV and VGCV population pharmacokinetic models. Our research has the potential to significantly decrease the amount of time required for conducting literature searches. Leveraging our repository, other researchers can quickly perform external evaluations on their data to identify a suitable model or to explore the factors that influence the predictive ability of the model in different clinical settings. In addition, researchers can perform model averaging to reduce the impact of uncertainty in a single model and to identify the most appropriate predictions for individual patients, thus simplifying the process of precision dosing and reducing the burden of model validation.
New dosing regimens can be evaluated comprehensively using the models in the repository and the provided codes. Our work could significantly improve the efficiency of dosing regimens evaluation and the AUC calculator based on MAP-BE could be useful for determining AUC. The source code related to the PPK model could be modified to develop calculators that are based on new models. In addition, an AUC calculator can be built for each model in the repository, and medical staff can make decisions considering the AUC results calculated by multiple models.
The model repository can also be docked with the “PopED” package, and the published model in the repository can be selected as the prior information to optimize the experimental design. The package also supports the use of “rxode2” to build a preset model. The “nlmixr” package, as a free and open-source package, supports nonlinear mixed effects analysis in R, and can be seamlessly connected with the relevant code of the model repository, improving the efficiency of modeling.
4.5. Limitations
Our study has some limitations. Firstly, only the parametric PPK models were included in this study, and the non-parametric PPK models were excluded because the parameters of the non-parametric models were hard to bridge to parametric models. Secondly, in our simulation, we used several typical virtual patients in order to facilitate comparisons across studies. Hence, the simulation results may not be representative enough for the distribution of covariates in clinical practice. In other words, the typical patients may not represent the populations studied. Thirdly, the construction of the model repository was done manually in this study, and the next step could be to automatically generate a model repository using artificial intelligence technology [33].
5. Conclusions
The model repository of parametric population pharmacokinetic models for GCV and VGCV is useful for promoting MIPD. Optimization of the GCV and VGCV dosing regimen should consider the patient’s renal function. Our AUC calculator may provide a useful tool for clinicians to perform TDM during their routine work.
Supplementary Materials
The following supporting information can be downloaded at: https://www.mdpi.com/article/10.3390/pharmaceutics15071801/s1, Table S1: The uniform covariate range and reference covariate value; Table S2: Total probability of target attainment of pediatrics and adults; Figure S1: Similarity comparison (%) of simulated pharmacokinetic profiles after intravenous infusion of ganciclovir; Figure S2: Similarity comparison (%) of simulated pharmacokinetic profiles after oral administration of valganciclovir.
Author Contributions
Conceptualization, B.H. and X.Z.; data curation, W.Y. and W.M.; formal analysis, W.Y., W.M. and M.G.; methodology, A.G. and X.Z.; software, W.Y. and W.M.; supervision, B.H. and X.Z.; visualization, W.Y. and W.M.; writing—original draft, W.Y. and W.M.; writing—review and editing, A.G., Y.W., Y.S., Q.H. and X.X. All authors have read and agreed to the published version of the manuscript.
Funding
This research was funded by the Fudan University Scientific Research Foundation for Talented Scholars (grant number: JIF301052), the National Natural Science Foundation of China (grant number: 82204544) and the Shanghai Municipal Health Commission Clinical Research Youth Project (grant number: 20224Y0121).
Institutional Review Board Statement
Not applicable.
Informed Consent Statement
Not applicable.
Data Availability Statement
The data generated during and/or analyzed during the current study are available from the corresponding author on reasonable request.
Acknowledgments
The authors would like to thank MJVANESDONK’s website (https://www.pmxsolutions.com/2021/02/16/using-a-therapeutic-drug-monitoring-tdm-model-in-r-with-mrgsolve/, accessed on 10 February 2023) for providing ideas for implementing MAP-BE in R.
Conflicts of Interest
The authors declare that there are no conflicts of interest.
References
- Al-Badr, A.A.; Ajarim, T.D.S. Ganciclovir. Profiles Drug Subst. Excip. Relat. Methodol. 2018, 43, 1–208. [Google Scholar] [CrossRef] [PubMed]
- Littler, E.; Stuart, A.D.; Chee, M.S. Human cytomegalovirus UL97 open reading frame encodes a protein that phosphorylates the antiviral nucleoside analogue ganciclovir. Nature 1992, 358, 160–162. [Google Scholar] [CrossRef]
- Cocohoba, J.M.; McNicholl, I.R. Valganciclovir: An advance in cytomegalovirus therapeutics. Ann. Pharmacother. 2002, 36, 1075–1079. [Google Scholar] [CrossRef]
- Martin, D.F.; Sierra-Madero, J.; Walmsley, S.; Wolitz, R.A.; Macey, K.; Georgiou, P.; Robinson, C.A.; Stempien, M.J.; Valganciclovir Study Group. A controlled trial of valganciclovir as induction therapy for cytomegalovirus retinitis. N. Engl. J. Med. 2002, 346, 1119–1126. [Google Scholar] [CrossRef]
- Faulds, D.; Heel, R.C. Ganciclovir. A review of its antiviral activity, pharmacokinetic properties and therapeutic efficacy in cytomegalovirus infections. Drugs 1990, 39, 597–638. [Google Scholar] [CrossRef] [PubMed]
- Fletcher, C.; Sawchuk, R.; Chinnock, B.; de Miranda, P.; Balfour, H.H., Jr. Human pharmacokinetics of the antiviral drug DHPG. Clin. Pharmacol. Ther. 1986, 40, 281–286. [Google Scholar] [CrossRef]
- Märtson, A.G.; Edwina, A.E.; Burgerhof, J.G.M.; Berger, S.P.; de Joode, A.; Damman, K.; Verschuuren, E.A.M.; Blokzijl, H.; Bakker, M.; Span, L.F.; et al. Ganciclovir therapeutic drug monitoring in transplant recipients. J. Antimicrob. Chemother. 2021, 76, 2356–2363. [Google Scholar] [CrossRef]
- Vezina, H.E.; Brundage, R.C.; Hevins, T.E.; Balfour, H.H., Jr. The pharmacokinetics of valganciclovir prophylaxis in pediatric solid organ transplant patients at risk for Epstein-Barr virus disease. Clin. Pharmacol. Adv. Appl. 2010, 2, 1–7. [Google Scholar] [CrossRef]
- Franck, B.; Woillard, J.B.; Theoret, Y.; Bittencourt, H.; Demers, E.; Briand, A.; Marquet, P.; Lapeyraque, A.L.; Ovetchkine, P.; Autmizguine, J. Population pharmacokinetics of ganciclovir and valganciclovir in pediatric solid organ and stem cell transplant recipients. Br. J. Clin. Pharmacol. 2020, 29, 3105–3114. [Google Scholar]
- Krens, S.D.; Hodiamont, C.J.; Juffermans, N.P.; Mathôt, R.A.A.; van Hest, R.M. Population Pharmacokinetics of Ganciclovir in Critically Ill Patients. Ther. Drug Monit. 2020, 42, 295–301. [Google Scholar] [CrossRef] [PubMed]
- Nguyen, T.; Oualha, M.; Briand, C.; Bendavid, M.; Béranger, A.; Benaboud, S.; Tréluyer, J.M.; Zheng, Y.; Foissac, F.; Winter, S.; et al. Population pharmacokinetics of intravenous ganciclovir and oral valganciclovir in a pediatric population to optimize dosing regimens. Antimicrob. Agents Chemother. 2021, 65, e02254-20. [Google Scholar] [CrossRef] [PubMed]
- Page, M.J.; McKenzie, J.E.; Bossuyt, P.M.; Boutron, I.; Hoffmann, T.C.; Mulrow, C.D.; Shamseer, L.; Tetzlaff, J.M.; Akl, E.A.; Brennan, S.E.; et al. The PRISMA 2020 statement: An updated guideline for reporting systematic reviews. BMJ 2021, 372, n71. [Google Scholar] [CrossRef]
- Li, Z.R.; Wang, C.Y.; Zhu, X.; Jiao, Z. Population Pharmacokinetics of Levetiracetam: A Systematic Review. Clin. Pharmacokinet. 2021, 60, 305–318. [Google Scholar] [CrossRef]
- Kotton, C.N.; Kumar, D.; Caliendo, A.M.; Huprikar, S.; Chou, S.; Danziger-Isakov, L.; Humar, A. The Third International Consensus Guidelines on the Management of Cytomegalovirus in Solid-organ Transplantation. Transplantation 2018, 102, 900–931. [Google Scholar] [CrossRef]
- Chen, Y.T.; Wang, C.Y.; Yin, Y.W.; Li, Z.R.; Lin, W.W.; Zhu, M.; Jiao, Z. Population pharmacokinetics of oxcarbazepine: A systematic review. Expert Rev. Clin. Pharmacol. 2021, 14, 853–864. [Google Scholar] [CrossRef] [PubMed]
- Wiltshire, H.; Paya, C.V.; Pescovitz, M.D.; Humar, A.; Dominguez, E.; Washburn, K.; Blumberg, E.; Alexander, B.; Freeman, R.; Heaton, N.; et al. Pharmacodynamics of oral ganciclovir and valganciclovir in solid organ transplant recipients. Transplantation 2005, 79, 1477–1483. [Google Scholar] [CrossRef]
- Kang, D.; Bae, K.S.; Houk, B.E.; Savic, R.M.; Karlsson, M.O. Standard Error of Empirical Bayes Estimate in NONMEM® VI. Korean J. Physiol. Pharmacol. 2012, 16, 97–106. [Google Scholar] [CrossRef]
- Yuen, G.J.; Drusano, G.L.; Fletcher, C.; Capparelli, E.; Connor, J.D.; Lalezari, J.P.; Drew, L.; Follansbee, S.; Busch, D.; Jacobson, M.; et al. Population differences in ganciclovir clearance as determined by nonlinear mixed-effects modelling. Antimicrob. Agents Chemother. 1995, 39, 2350–2352. [Google Scholar] [CrossRef]
- Zhou, X.J.; Gruber, W.; Demmler, G.; Jacobs, R.; Reuman, P.; Adler, S.; Shelton, M.; Pass, R.; Britt, B.; Trang, J.M.; et al. Population pharmacokinetics of ganciclovir in newborns with congenital cytomegalovirus infections. NIAID Collaborative Antiviral Study Group. Antimicrob. Agents Chemother. 1996, 40, 2202–2205. [Google Scholar] [CrossRef]
- Acosta, E.P.; Brundage, R.C.; King, J.R.; Sánchez, P.J.; Sood, S.; Agrawal, V.; Homans, J.; Jacobs, R.F.; Lang, D.; Romero, J.R.; et al. Ganciclovir population pharmacokinetics in neonates following intravenous administration of ganciclovir and oral administration of a liquid valganciclovir formulation. Clin. Pharmacol. Ther. 2007, 81, 867–872. [Google Scholar] [CrossRef]
- Caldés, A.; Colom, H.; Armendariz, Y.; Garrido, M.J.; Troconiz, I.F.; Gil-Vernet, S.; Lloberas, N.; Pou, L.; Peraire, C.; Grinyó, J.M. Population pharmacokinetics of ganciclovir after intravenous ganciclovir and oral valganciclovir administration in solid organ transplant patients infected with cytomegalovirus. Antimicrob. Agents Chemother. 2009, 53, 4816–4824. [Google Scholar] [CrossRef]
- Perrottet, N.; Csajka, C.; Pascual, M.; Manuel, O.; Lamoth, F.; Meylan, P.; Aubert, J.D.; Venetz, J.P.; Soccal, P.; Decosterd, L.A.; et al. Population pharmacokinetics of ganciclovir in solid-organ transplant recipients receiving oral valganciclovir. Antimicrob. Agents Chemother. 2009, 53, 3017–3023. [Google Scholar] [CrossRef] [PubMed]
- Zhao, W.; Baudouin, V.; Zhang, D.; Deschenes, G.; Le Guellec, C.; Jacqz-Aigrain, E. Population pharmacokinetics of ganciclovir following administration of valganciclovir in paediatric renal transplant patients. Clin. Pharmacokinet. 2009, 48, 321–328. [Google Scholar] [CrossRef] [PubMed]
- Horvatits, T.; Kitzberger, R.; Drolz, A.; Zauner, C.; Jager, W.; Bohmdorfer, M.; Kraff, S.; Fritsch, A.; Thalhammer, F.; Fuhrmann, V.; et al. Pharmacokinetics of ganciclovir during continuous venovenous hemodiafiltration in critically Ill patients. Antimicrob. Agents Chemother. 2014, 58, 94–101. [Google Scholar] [CrossRef]
- Vezina, H.E.; Brundage, R.C.; Balfour, H.H., Jr. Population pharmacokinetics of valganciclovir prophylaxis in paediatric and adult solid organ transplant recipients. Br. J. Clin. Pharmacol. 2014, 78, 343–352. [Google Scholar] [CrossRef] [PubMed]
- Chen, B.; Hu, S.S.; Rui, W.B.; An, H.M.; Zhai, X.H.; Wang, X.H.; Lu, J.Q.; Shao, K.; Zhou, P.J. Population Pharmacokinetics and Bayesian Estimation of the Area Under the Concentration-Time Curve for Ganciclovir in Adult Chinese Renal Allograft Recipients After Valganciclovir Administration. J. Clin. Pharmacol. 2021, 61, 328–338. [Google Scholar] [CrossRef]
- Lalagkas, P.N.; Iliou, J.; Rigo, R.; Miarons, M.; Fernandez-Alarcon, B.; Bestard, O.; Cruzado, J.M.; Melilli, E.; Torras, J.; Grinyo, J.M.; et al. Comparison of Three Renal Function Formulas for Ganciclovir/Valganciclovir Dose Individualization in CMV-Infected Solid Organ Transplantation Patients Using a Population Approach. Clin. Pharmacokinet. 2023, 62, 861–880. [Google Scholar] [CrossRef]
- Facchin, A.; Elie, V.; Benyoub, N.; Magreault, S.; Maisin, A.; Storme, T.; Zhao, W.; Deschenes, G.; Jacqz-Aigrain, E. Population pharmacokinetics of ganciclovir after valganciclovir treatment in children with renal transplant. Antimicrob. Agents Chemother. 2019, 63, e01192-19. [Google Scholar] [CrossRef]
- Li, S.; Shu, C.; Wu, S.; Xu, H.; Wang, Y. Population Pharmacokinetics and Dose Optimization of Ganciclovir in Critically Ill Children. Front. Pharmacol. 2020, 11, 614164. [Google Scholar] [CrossRef]
- Gao, A.; Cachat, F.; Faouzi, M.; Bardy, D.; Mosig, D.; Meyrat, B.J.; Girardin, E.; Chehade, H. Comparison of the glomerular filtration rate in children by the new revised Schwartz formula and a new generalized formula. Kidney Int. 2013, 83, 524–530. [Google Scholar] [CrossRef]
- Wolfe, E.J.; Mathur, V.; Tomlanovich, S.; Jung, D.; Wong, R.; Griffy, K.; Aweeka, F.T. Pharmacokinetics of mycophenolate mofetil and intravenous ganciclovir alone and in combination in renal transplant recipients. Pharmacotherapy 1997, 17, 591–598. [Google Scholar] [CrossRef] [PubMed]
- Klein, I.H.; Abrahams, A.; van Ede, T.; Hené, R.J.; Koomans, H.A.; Ligtenberg, G. Different effects of tacrolimus and cyclosporine on renal hemodynamics and blood pressure in healthy subjects. Transplantation 2002, 73, 732–736. [Google Scholar] [CrossRef] [PubMed]
- Gonzalez Hernandez, F.; Carter, S.J.; Iso-Sipilä, J.; Goldsmith, P.; Almousa, A.A.; Gastine, S.; Lilaonitkul, W.; Kloprogge, F.; Standing, J.F. An automated approach to identify scientific publications reporting pharmacokinetic parameters. Wellcome Open Res. 2021, 6, 88. [Google Scholar] [CrossRef] [PubMed]
Disclaimer/Publisher’s Note: The statements, opinions and data contained in all publications are solely those of the individual author(s) and contributor(s) and not of MDPI and/or the editor(s). MDPI and/or the editor(s) disclaim responsibility for any injury to people or property resulting from any ideas, methods, instructions or products referred to in the content. |
© 2023 by the authors. Licensee MDPI, Basel, Switzerland. This article is an open access article distributed under the terms and conditions of the Creative Commons Attribution (CC BY) license (https://creativecommons.org/licenses/by/4.0/).

