Article

Rapid In Vitro Assessment of Antimicrobial Drug Effect Bridging Clinically Relevant Pharmacokinetics: A Comprehensive Methodology

by
Michael Nikolaou
1,* and
Vincent H. Tam
1,2
1
Chemical & Biomolecular Engineering Department, University of Houston, Houston, TX 77204, USA
2
Department of Pharmacy Practice & Translational Research, University of Houston, Houston, TX 77204, USA
*
Author to whom correspondence should be addressed.
Pharmaceutics 2023, 15(6), 1671; https://doi.org/10.3390/pharmaceutics15061671
Submission received: 13 April 2023 / Revised: 24 May 2023 / Accepted: 1 June 2023 / Published: 7 June 2023
(This article belongs to the Special Issue Role of Pharmacokinetics in Drug Development and Evaluation)

Abstract

:
Rapid in vitro assessment of antimicrobial drug efficacy under clinically relevant pharmacokinetic conditions is an essential element of both drug development and clinical use. Here, we present a comprehensive overview of a recently developed novel integrated methodology for rapid assessment of such efficacy, particularly against the emergence of resistant bacterial strains, as jointly researched by the authors in recent years. This methodology enables rapid in vitro assessment of the antimicrobial efficacy of single or multiple drugs in combination, following clinically relevant pharmacokinetics. The proposed methodology entails (a) the automated collection of longitudinal time–kill data in an optical-density instrument; (b) the processing of collected time–kill data with the aid of a mathematical model to determine optimal dosing regimens under clinically relevant pharmacokinetics for single or multiple drugs; and (c) in vitro validation of promising dosing regimens in a hollow fiber system. Proof-of-concept of this methodology through a number of in vitro studies is discussed. Future directions for the refinement of optimal data collection and processing are discussed.

1. Introduction

Rapid assessment of antimicrobial drug efficacy in clinically relevant pharmacokinetic conditions is fundamental for both new drug development and clinical drug use [1]. This need is particularly pressing for resistant strains, as they pose a serious threat to human health [2]. Assessing the effect of drugs on pathogenic bacteria can be typically measured in vitro through the exposure of a bacterial population to (one or more) drugs at various time-invariant concentrations over a period of time (time–kill experiments). The number of live cells in the bacterial population at distinct points in that time period can be typically assessed by quantitative culture (plating) methods [3]. As widely used as this simple approach is, it provides limited data because plating can realistically be performed only at a few time points during a corresponding experiment (see [4] and references therein). As a result, simple indicators of drug efficacy against bacterial strains, such as the minimum inhibitory concentration (MIC), the area under the curve (AUC), and others, are in widespread use [5,6,7]. Unfortunately, such indicators often fail at predicting therapeutic outcomes under realistic pharmacodynamic and pharmacokinetic conditions [1,8], particularly when a bacterial population comprises subpopulations of varying degrees of resistance [4,9,10,11,12]. More detailed pharmacodynamic models could provide a better picture of drug efficacy [13]. However, developing such models from scant measurements based on plating during short-term time–kill experiments is not practical, if at all feasible.
An obvious way to address this issue would be to collect more measurements of bacterial population size at densely spaced time points during drug exposure. Accomplishing this by plating would be practically infeasible, particularly in situations where time or resources are limited yet reliable results are needed quickly, e.g., in a clinical setting. Among a number of, in principle, feasible options (see Section 4), a long-known, potentially efficient alternative to plating would be to take measurements of sample turbidity (cloudiness) using optical density (OD) methods (spectrophotometry) [14,15,16]. While optical density measurements rely on well-established principles (of light propagation through a liquid) and can easily provide a virtually continuous real-time stream of data in a modern instrument, they have a serious limitation: they count both live and dead cells of a bacterial population in a suspension, as both kinds of cells block/absorb light, thus affecting the resulting optical signal. As a result, optical density measurements are routinely taken only in studies focusing on growing populations of cells (e.g., to study contamination) and, until recently, have not been applied to shrinking populations, the very focus of time–kill experiments with bacterial populations exposed to drugs.
This limitation was removed in a series of recent publications that established a novel methodology, which is the main focus of this paper. Specifically, we present here a distilled synthesis of the individual prior results, which collectively constitute the novel integrated methodology just mentioned. This methodology straddles the span from the automatic collection of in vitro longitudinal time–kill data (capturing the drug effect on a bacterial population) to the design and in vitro testing of therapeutic dosing regimens for drugs following clinically relevant pharmacokinetics. While this methodology is still undergoing refinements and enhancements, there is already a body of work at a stage mature enough for direct use, hence worth communicating.
In the rest of the paper, in Section 2, we summarize the basic elements of the proposed methodology referred to above, and in Section 3, we present a selection of basic proof-of-concept outcomes presented in the literature. Finally, we discuss potential improvements and extensions of this methodology.

2. Materials and Methods

The essence of the methodology referred to in Section 1 lies in the use of data-driven mathematical modeling tools which extract useful information from longitudinal time–kill data collected by an optical density instrument. Implementation of this methodology entails the following elements:
  • Automated collection of longitudinal optical density measurements of several bacterial cell suspensions by an optical density instrument, each suspension exposed to single or multiple drugs at a time-invariant concentration;
  • Feeding the data collected in the previous step into a mathematical model to estimate the kill rate of the bacterial subpopulation least susceptible to the drug as a function of drug concentration;
  • Use of the drug-concentration-dependent kill rate estimate from the previous step to design dosing regimens predicted to eradicate a bacterial population exposed to a drug following clinically relevant pharmacokinetics;
  • Validation test of promising dosing regimens from the previous step in an in vitro hollow fiber infection model mimicking clinically relevant pharmacokinetics in humans;
  • We elaborate on each of the above elements next.

2.1. Longitudinal Optical Density Measurements of Bacterial Cell Suspension under Drug Exposure

In a spectrophotometer, a cell population in suspension is placed in a transparent cuvette, and light is shone on it [17]. Because cells impart turbidity (cloudiness) to the suspension as they absorb and scatter light, the intensity of transmitted light is lower than the intensity of the incident light. Comparing the two intensities provides a quantitative assessment of the number of cells in suspension (optical density). Optical density is roughly proportional to the biomass in the cell suspension in a given range that is specific to the cell type. The simplicity and ability to generate abundant longitudinal data have made spectrophotometry the method of choice for measurements of bacterial growth in related applications. The inherent drawback of spectrophotometry, as already mentioned, is its inability to distinguish between live and dead cells, a limitation of utmost importance in time–kill experiments, where bacterial populations are expected to decline [18]. Indeed, whereas in bacterial growth experiments, live cells quickly far outnumber dead cells, time–kill experiments with substantial bacterial killing experience the reverse. In fact, bacterial populations with resistant subpopulations may exhibit interesting behavior, as depicted in Figure 1, adapted from [18]. This figure indicates that for successive multiples of drug concentrations, the number of live cells, N live , may qualitatively exhibit pure growth, delayed growth, decline followed by regrowth or delayed regrowth, and finally, continued decline (Figure 1a). However, what optical density measurements will indicate is a set of curves for the total number of cells (comprising both live and dead cells, N total ) that never decline, as shown in Figure 1b.
It is this inherent limitation of optical density instruments that is addressed by the integrated mathematical modeling methodology presented here, as detailed in subsequent sections. Of course, in addition to the above inherent limitation, secondary issues with optical density instruments may arise from multiple difficulties in the reliable translation of optical density to a number of bacterial cells. Nevertheless, such difficulties, which are expounded on in Section 4, proved surmountable in the work reported here, a fact that underscores the remarkable robustness of the proposed methodology [18,19] and raises expectations for improvements with the future availability of better optical density instruments.

2.2. Kill Rate Estimation of Least Susceptible Bacteria as a Function of Drug Concentration

The study of bacterial population dynamics has a long history [20], with a variety of mathematical models used for corresponding quantitative descriptions [13,21]. At the core of these models is the elementary differential equation d N live / d t = K g N live t or its counterpart for a saturating bacterial population d N live / d t = K g N live t 1 N live / N max , where N live is the number of live bacterial cells in a population, K g is the physiological growth rate, and N max is the upper bound of the growing bacterial population [22]. Exposure to bactericidal drugs adds a killing term, r N live , to the right-hand side of the preceding equations, where r is the specific kill rate, dependent on drug concentration C . A typical expression for the specific kill rate is
r = K C H C H + C 50 H
where H is the Hill exponent of sigmoidicity [9,23,24,25] as shown in Figure 2.
For typical time–kill experiments with time-invariant C , solution of the differential equation d N live / d t = K g r N live t is N live t = N live 0 exp K g r t , which corresponds to a straight line of slope K g r in a plot of log N live t vs. t .
As conceptually useful as such linear plots are, most practical situations of bacterial populations exposed to drugs involve subpopulations of varying susceptibility to the drug(s), corresponding to a distribution of values of r 0 over a bacterial population at any given drug concentration C [9,10]. The result is curved rather than straight lines for log N live t , as depicted, for example, in Figure 1a. For such cases, it was shown [11,12] that the size N live ( t ) of a heterogeneous bacterial population exposed to one or more drugs at time-invariant concentration C is well captured by the equation
ln N l i v e t N 0 = K g r m i n t + λ e a t 1 ln 1 + K g N l i v e 0 N m a x 0 t exp K g r m i n τ + λ e a τ 1 d τ
and the kill rate average and variance over time are well captured by the equations
μ t = r m i n + μ 0 r m i n exp μ 0 r m i n λ t = = r m i n + λ a e a t
σ ( t ) 2 = μ 0 r m i n 2 λ e x p μ ( 0 ) r m i n λ t = = λ a 2 e a t
where:
  • N l i v e t 
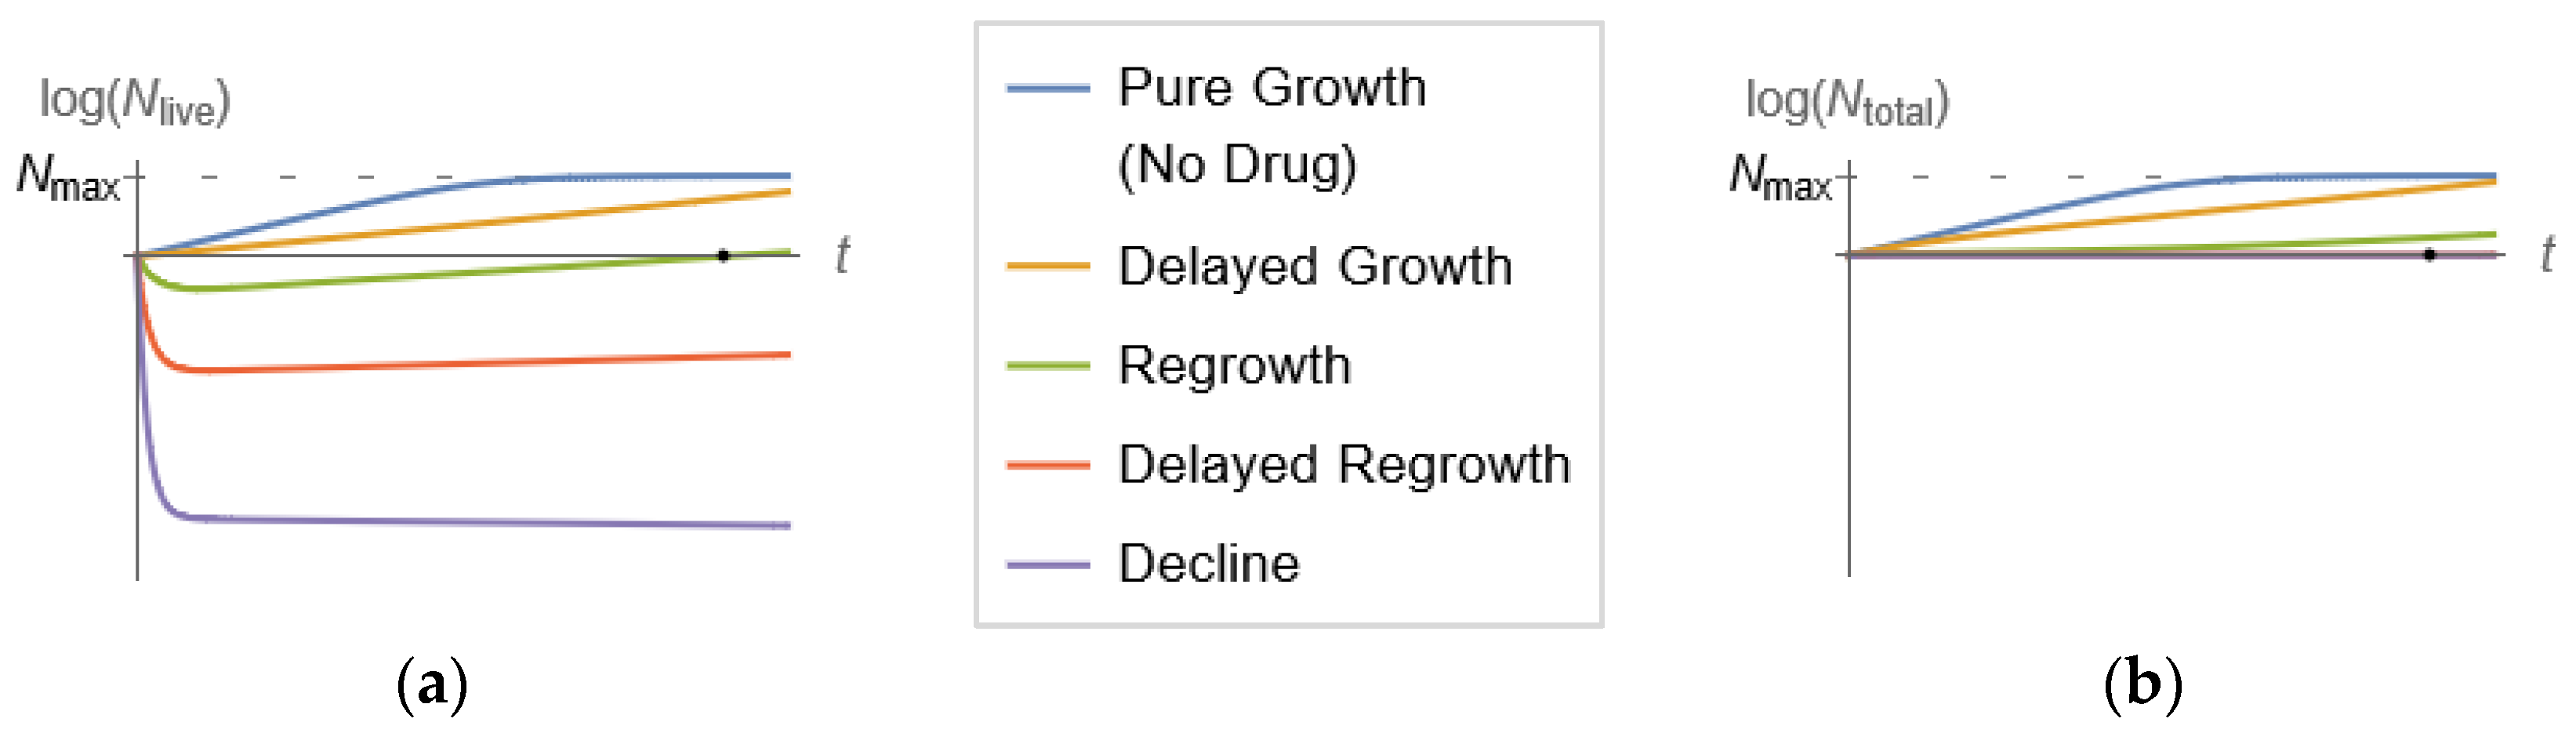
is the live bacterial population size with an initial value of N 0 ;
  • K g is the physiological net growth rate of the entire bacterial population, common for all subpopulations;
  • r m i n is the kill rate induced by the antibiotic on the most resistant (least susceptible) subpopulation;
  • N m a x is the maximum size of a bacterial population reaching saturation under growth conditions;
  • μ t is the kill rate average over the bacterial population at time t ;
  • σ t 2 is the kill rate variance over the bacterial population at time t .
λ > 0 , a > 0 are constants associated with the initial decline of the average kill rate of the population and correspond to the Poisson distributed variable ( r r m i n ) / a with average and variance equal to λ . Note that no assumptions about the mechanisms that confer bacterial resistance have been made to derive the above Equations (2)–(4).
The parameters K g , r m i n , λ , a , N m a x that appear in Equation (2) can be estimated by regression, assuming enough values of N live ( t ) are available. The preceding statement immediately justifies why plating methods for measurement of N live ( t ) are impractical for estimation of K g , r m i n , λ , a , N m a x : at least 10–20 data points would be needed for reasonable parameter estimates [9,10].
This limitation, posed by plating-based measurements, is overcome by the optical density-based methods discussed, which can routinely generate measurements every minute or so. However, as already mentioned, their measurements are of N total rather than of N live . To make measurements of N total usable in parameter estimation, the following equation was derived [18]:
N t o t a l t N 0 = e λ e a t 1 + K g r m i n t + + e λ λ K g r m i n a K d + r m i n a λ e a t λ z 1 + r m i n K g a e z d z + λ e a t λ z r m i n K g a e z d z
when N 0 N max , which is typical for time–kill experiments. (The full expression for N 0 not far from N max is also shown in [18]). In fact, it may be numerically simpler and conceptually insightful to use the following two differential equations (from which Equation (5) is derived for N 0 / N max 0 ) in parameter estimation based on measurements of N total t :
d N l i v e d t = K g N l i v e t N m a x + K g r m i n λ a e a t N l i v e t K g r m i n λ a e a t N l i v e t
d N t o t a l d t = K g 1 N l i v e t N m a x + K d N l i v e t K g + K d N l i v e t
where K d is the natural death rate of bacterial cells.
Equations (6) and (7) shed light on the nature of the parameter estimation problem:
First, estimates of K g , K d can be obtained from a simple time-growth experiment ( C = 0 ) for which there is no drug-induced kill rate, i.e., r min = 0 and λ = 0 , by default. Then, estimates of N live t are reasonably well obtained from Equation (7), provided that d N total / d t can be estimated with reasonable accuracy. It is for this purpose that optical density-based measurements of N total ( t )  at closely spaced points in time become crucial, as they allow a reasonably accurate estimation of d N total / d t , hence of N live t via Equation (7), and finally, the parameters r m i n , λ , a via standard regression using Equation (6).
Of the parameters estimated via the exercise just described, the one critical for dosing regimen design is r min , which is the kill rate of the least susceptible (most resistant) subpopulation. (Note that in long enough time–kill experiments, Equation (3) immediately suggests that the average kill rate, μ t , quickly tends to r min ). The importance of r min stems from the fact that complete eradication of a bacterial population exposed to a drug at concentration C occurs if and only if
r min > K g
i.e., the kill rate of the least susceptible bacterial subpopulation should be greater than the corresponding population growth rate (see Equation (5) and discussion in [18]). The dependence of r min on C is typically considered to follow the form of Equation (1), as shown qualitatively in Figure 3 (two instances of the general Figure 2), which qualitatively depicts a fit of Equation (1) to values of r min estimated from time–kill experiments at distinct drug concentrations C . It is noted that counterparts of Equation (1) can be fit to effective concentrations concerning multiple drugs, but this pharmacodynamics issue [26,27,28] is beyond the scope of this paper and will be explored elsewhere. The outcome of fitting r min to C is crucial for designing effective dosing regimens under clinically relevant pharmacokinetics, as will be discussed in the next section.

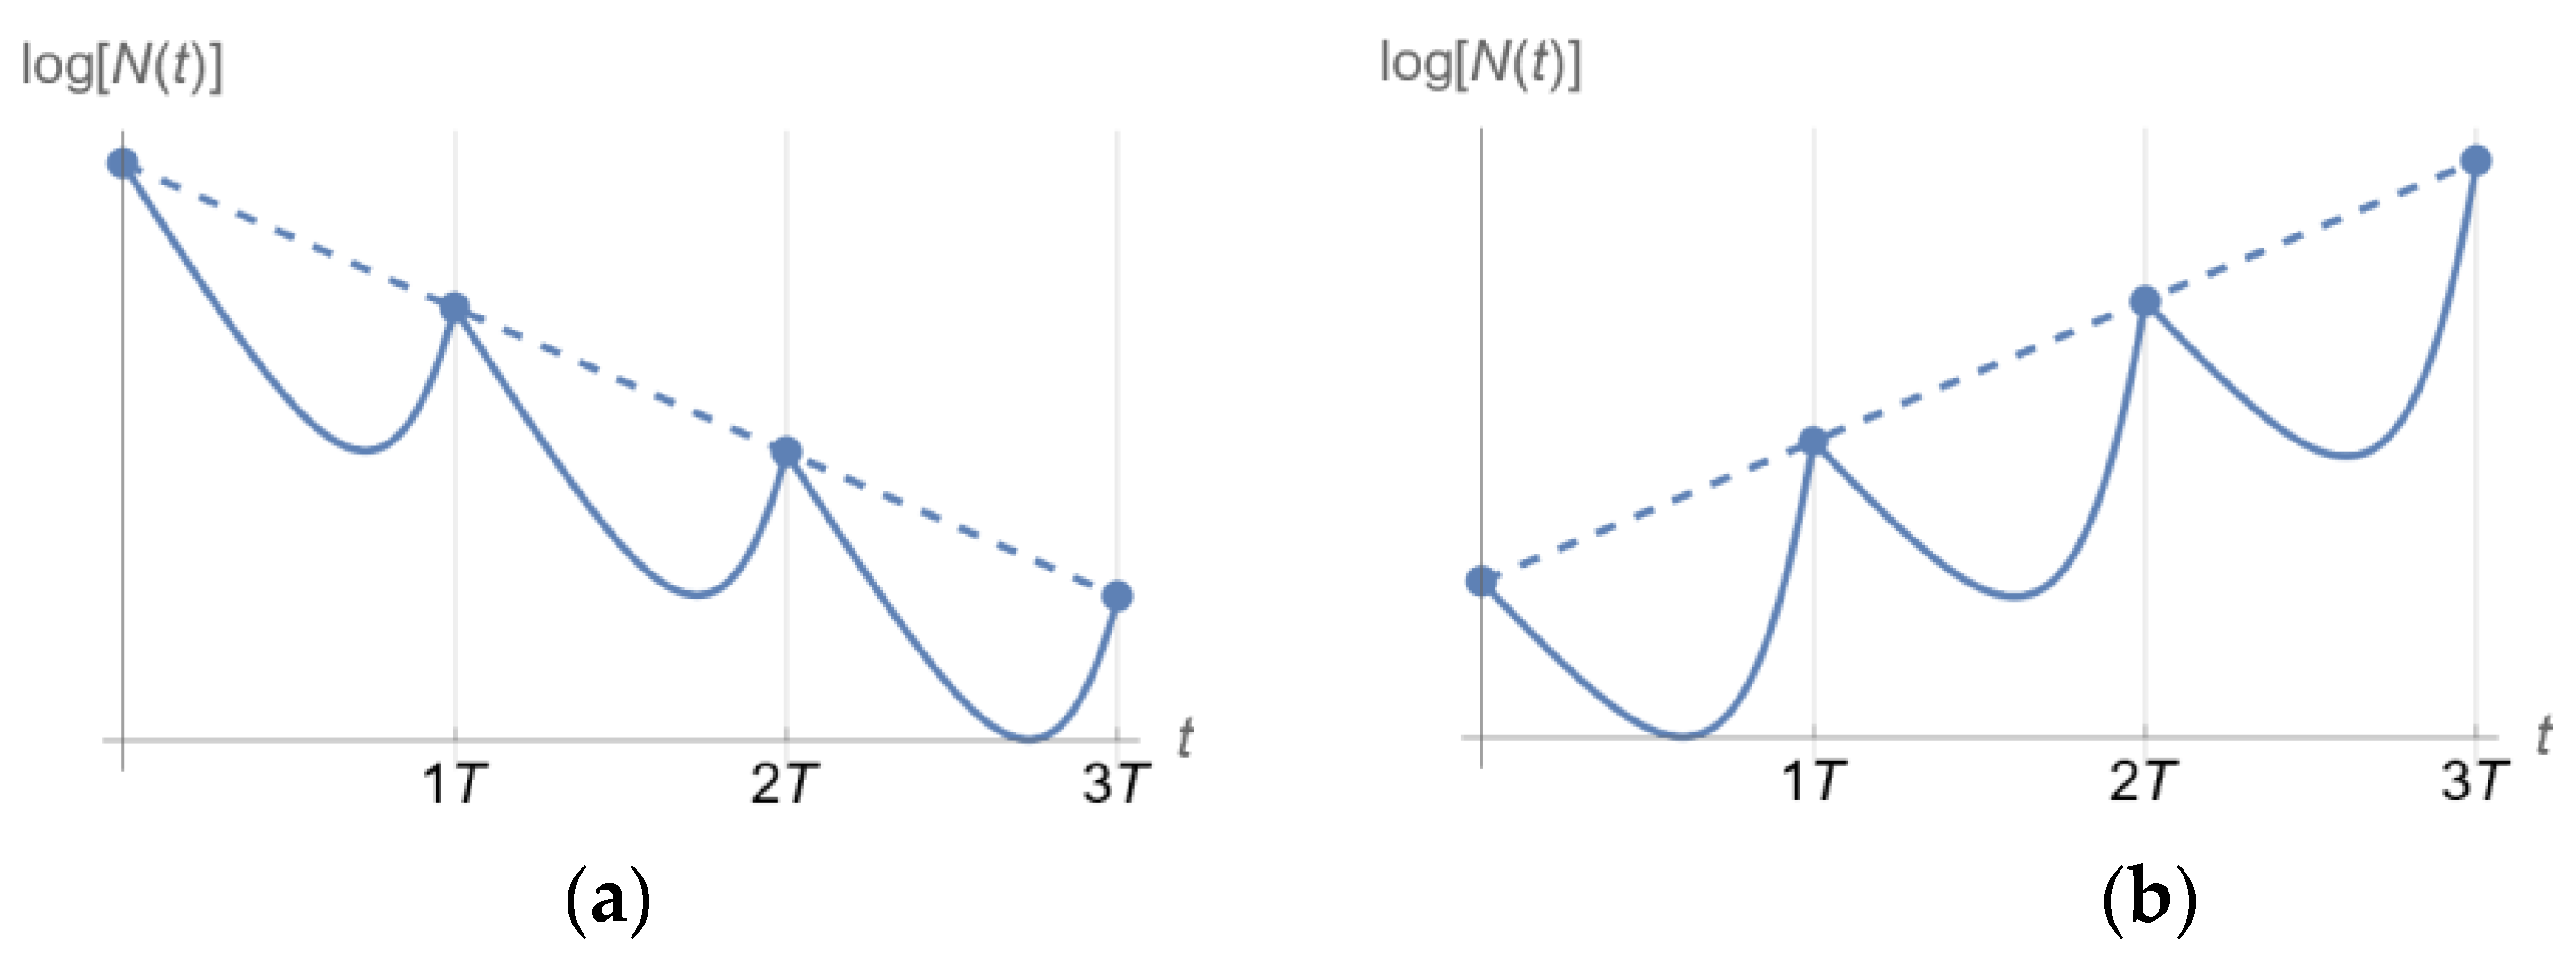
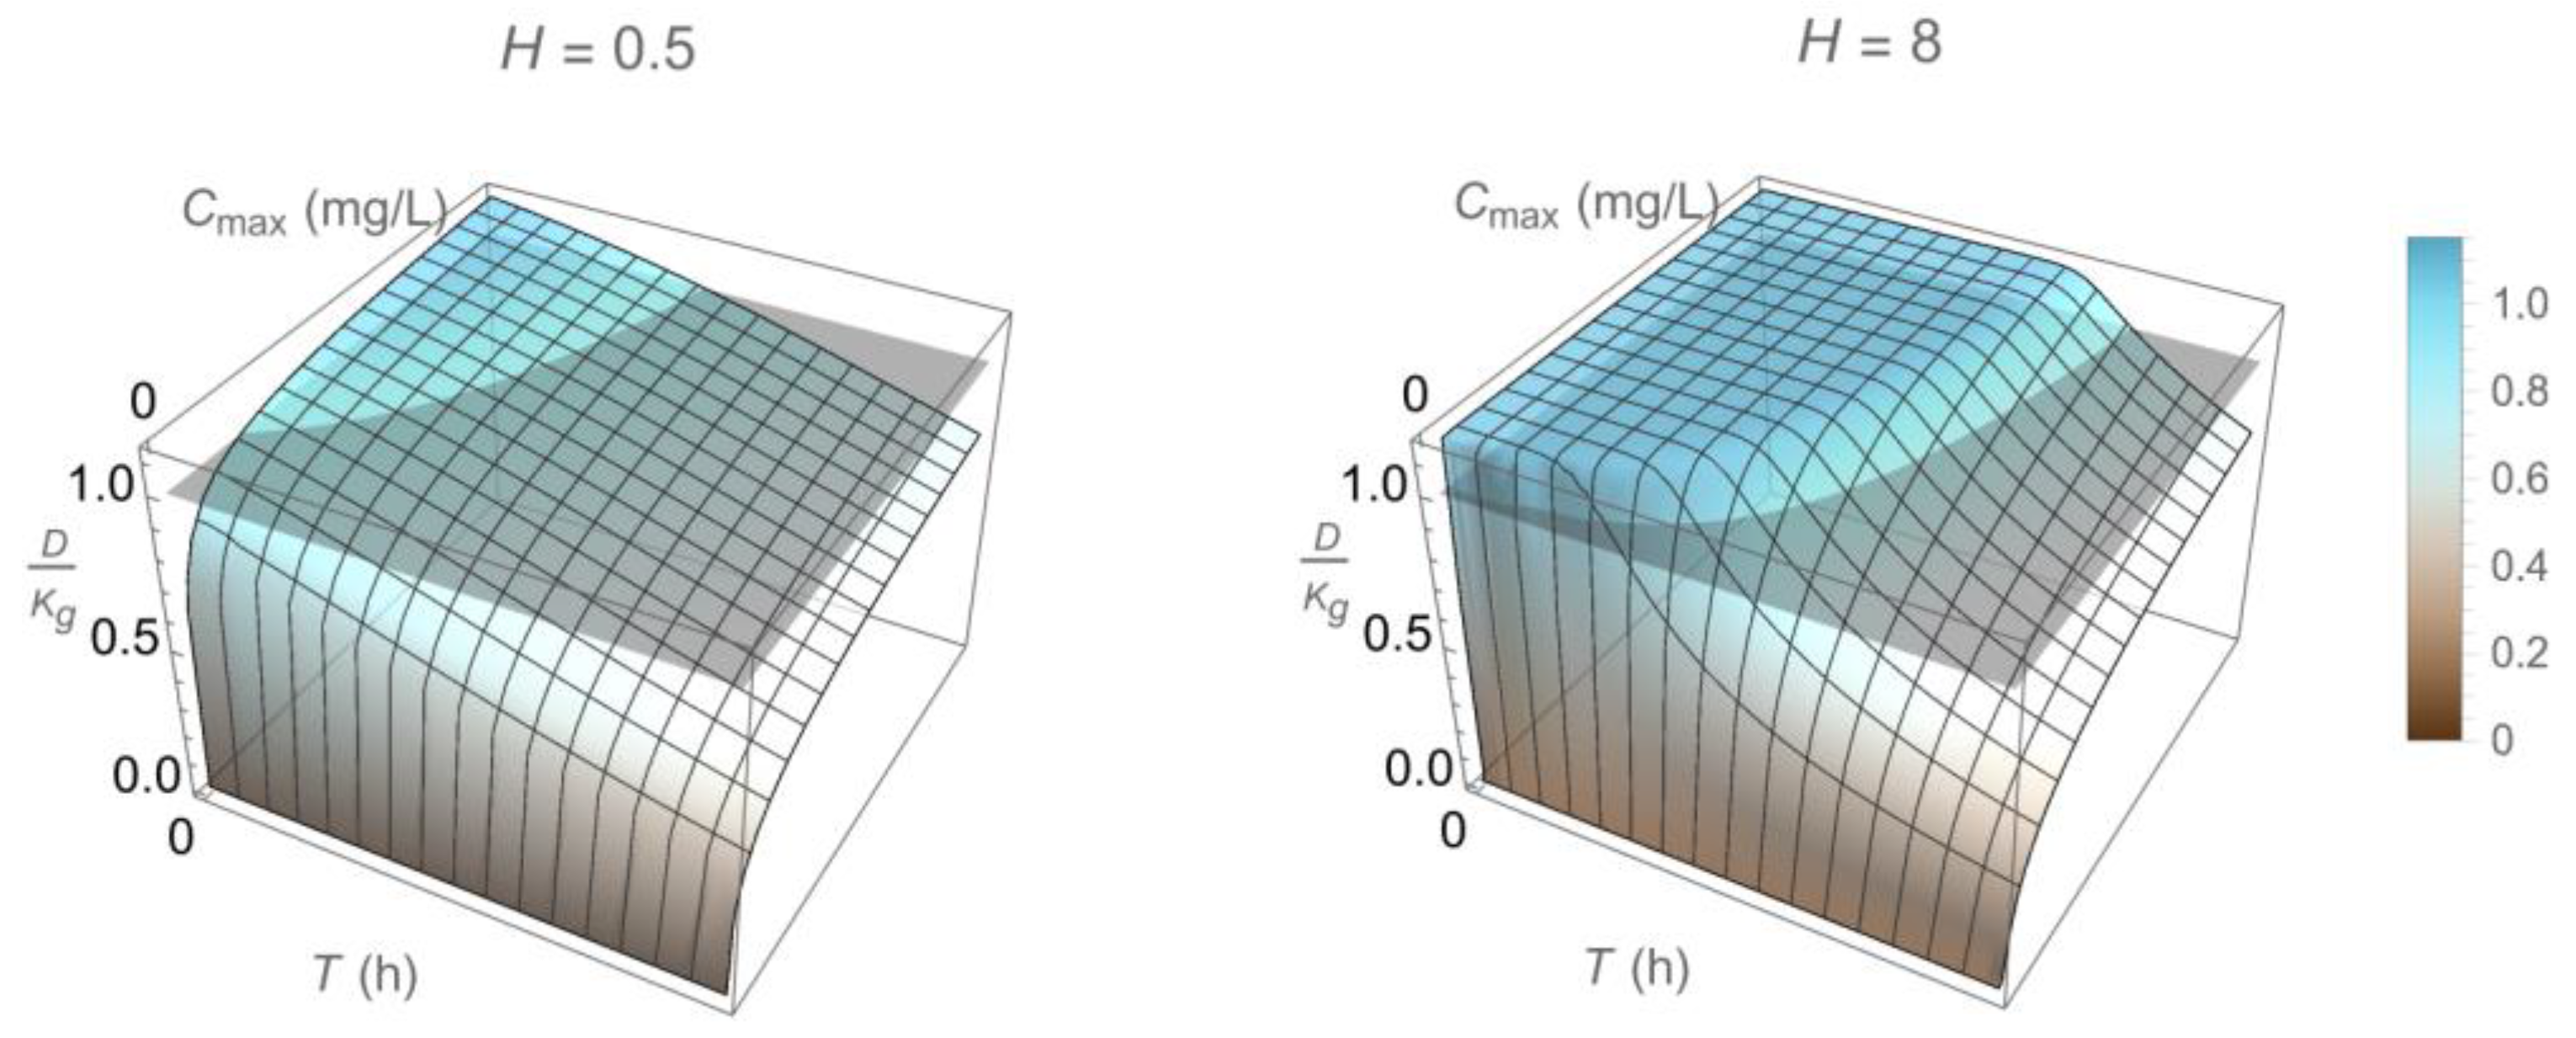
2.3. Dosing Regimen Design for Bacterial Eradication under Clinically Relevant Pharmacokinetics

The preceding discussion in Section 2.1 and Section 2.2 is concerned with pharmacodynamics (PD), i.e., the bactericidal effect of a drug at a certain concentration. This knowledge is one of the two fundamental components of pharmacology for antimicrobial therapy [1]. The second fundamental component is pharmacokinetics (PK), i.e., the absorption, distribution, and metabolism/elimination of drugs. In this section, we describe how pharmacodynamic information, as acquired by the approach described in the previous two sections, can be combined with related pharmacokinetics for design of effective drug dosing regimens.
A drug can certainly be clinically administered in a number of ways, each resulting in a corresponding drug concentration profile in a patient over time—from time-varying to time-invariant. In addition to variability over time, administered drug concentration in a patient typically exhibits topical variability as well, following corresponding pharmacokinetics. For example, different profiles typically arise between plasma (blood) and tissue concentration, as there are multiple compartments from an injection point to targeted tissues, and the corresponding dynamics for each compartment are different for different drugs [29]. A simple pharmacokinetic profile for periodic drug injection and subsequent first-order elimination of the drug is shown in Figure 4, where the drug concentration C t is plotted over time t . This choice lends itself to both simple theoretical analysis and experimental testing in an in vitro hollow-fiber infection model (Section 2.4 below). Alternatives are expounded on in Section 4.
The profile of Figure 4 may produce one of the two outcomes shown in Figure 5 for a homogeneous microbial population [30].
It can be shown [30] that outcome (a) of Figure 5, i.e., elimination of a bacterial population by drug administration following the PK profile of Figure 4, is predicted if and only if
D 1 T 0 T r min C η d η > K g
for the least susceptible bacterial subpopulation.
Equation (9) is the main outcome of this section and can be used to complete a dosing regimen design that ensures, with confidence, that D > K g . It provides a direct link between PK and PD, as drugs with the same PD but different PK or with the same PK and different PD will generally result in different D , hence will require different dosing regimens to achieve similar bactericidal outcomes. A detailed investigation of this aspect is provided in [30] and, in a broader context, in [4]. Qualitatively, what one can expect when selecting C max and T for a dosing regimen accommodating the PK of a drug with a half-life t 1 / 2 (Figure 4) depends on all three parameters K , C 50 , and H of r min (see Equation (1)). Of these parameters, H determines how sigmoidal r min is (Figure 2) and, ultimately, whether the drug exhibits time-dependent or concentration-dependent behavior [1]. The resulting D / K g qualitatively follows the patterns shown in Figure 6, which provides a link between PK and PD for corresponding drugs.

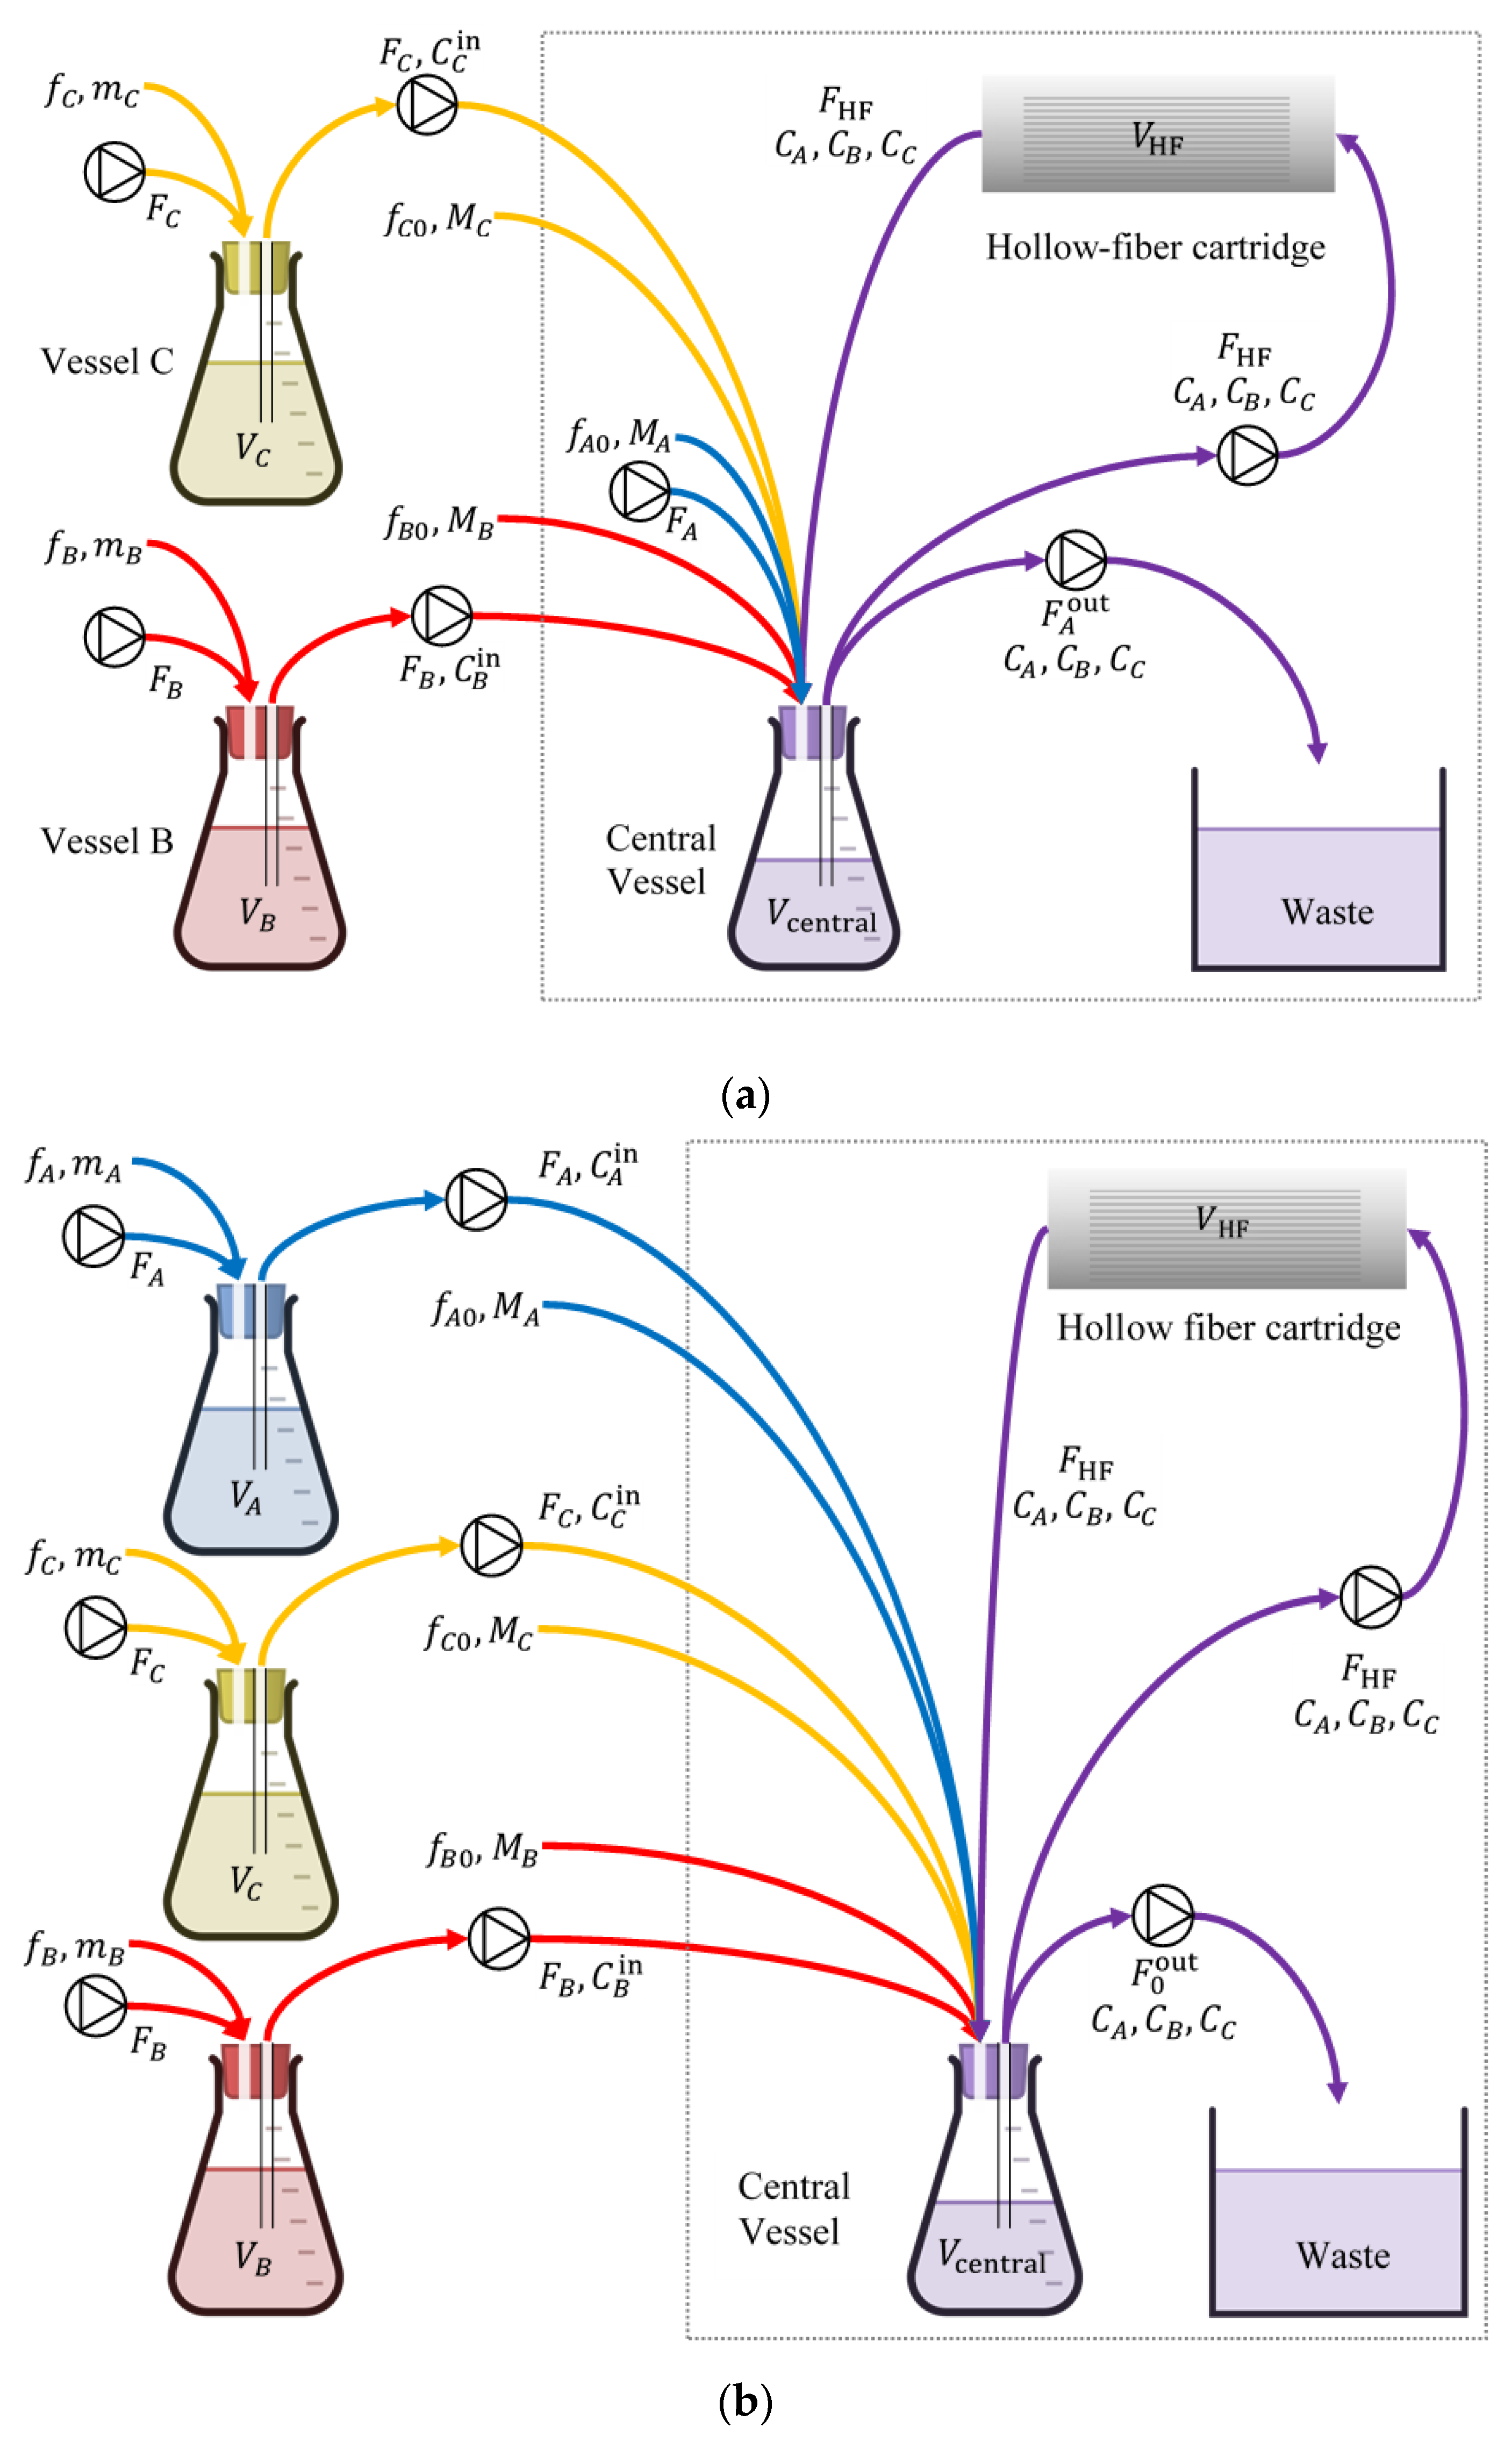
2.4. Validation Test of Promising Dosing Regimens in an In Vitro Hollow Fiber Infection Model

While the preceding methodology can use optical density measurements from time–kill experiments to rapidly design dosing regimens expected to be effective under realistic pharmacokinetics, there is inherent uncertainty in such expectations [26,27,28]. In vitro testing in a hollow-fiber infection model (HFIM, Figure 7) [31,32] can be used to test whether expected outcomes under realistic pharmacokinetics will indeed be achieved [33,34,35]. Simple HFIM designs for a single drug (in terms of both structure and design parameter values) were heuristically extended in the 1980s to the designs of two drugs with different pharmacokinetics [31,36]. However, recent developments in the treatment of multidrug-resistant bacterial infections [37,38,39,40,41] have made it necessary to test three or even more drugs in an HFIM before a corresponding combination is put to clinical use [26,42,43]. This made it necessary to advance the state of the art in HFIM design. A comprehensive new design method was developed in [44], where (a) new configurations beyond the standard in-series configuration of [31,36] were developed (Figure 7), (b) explicit formulas were derived for setting design parameters to values that result in desired pharmacokinetics for each drug in the hollow fiber cartridge, and (c) even for two drugs, an entire family of new designs beyond Blaser’s [36] was provided. In addition to making designs for three or more drugs feasible, these advancements substantially improved flexibility for the satisfaction of design objectives and constraints in an HFIM and paved the way for further extensions concerning various pharmacokinetic profiles (see Section 4).

3. Results

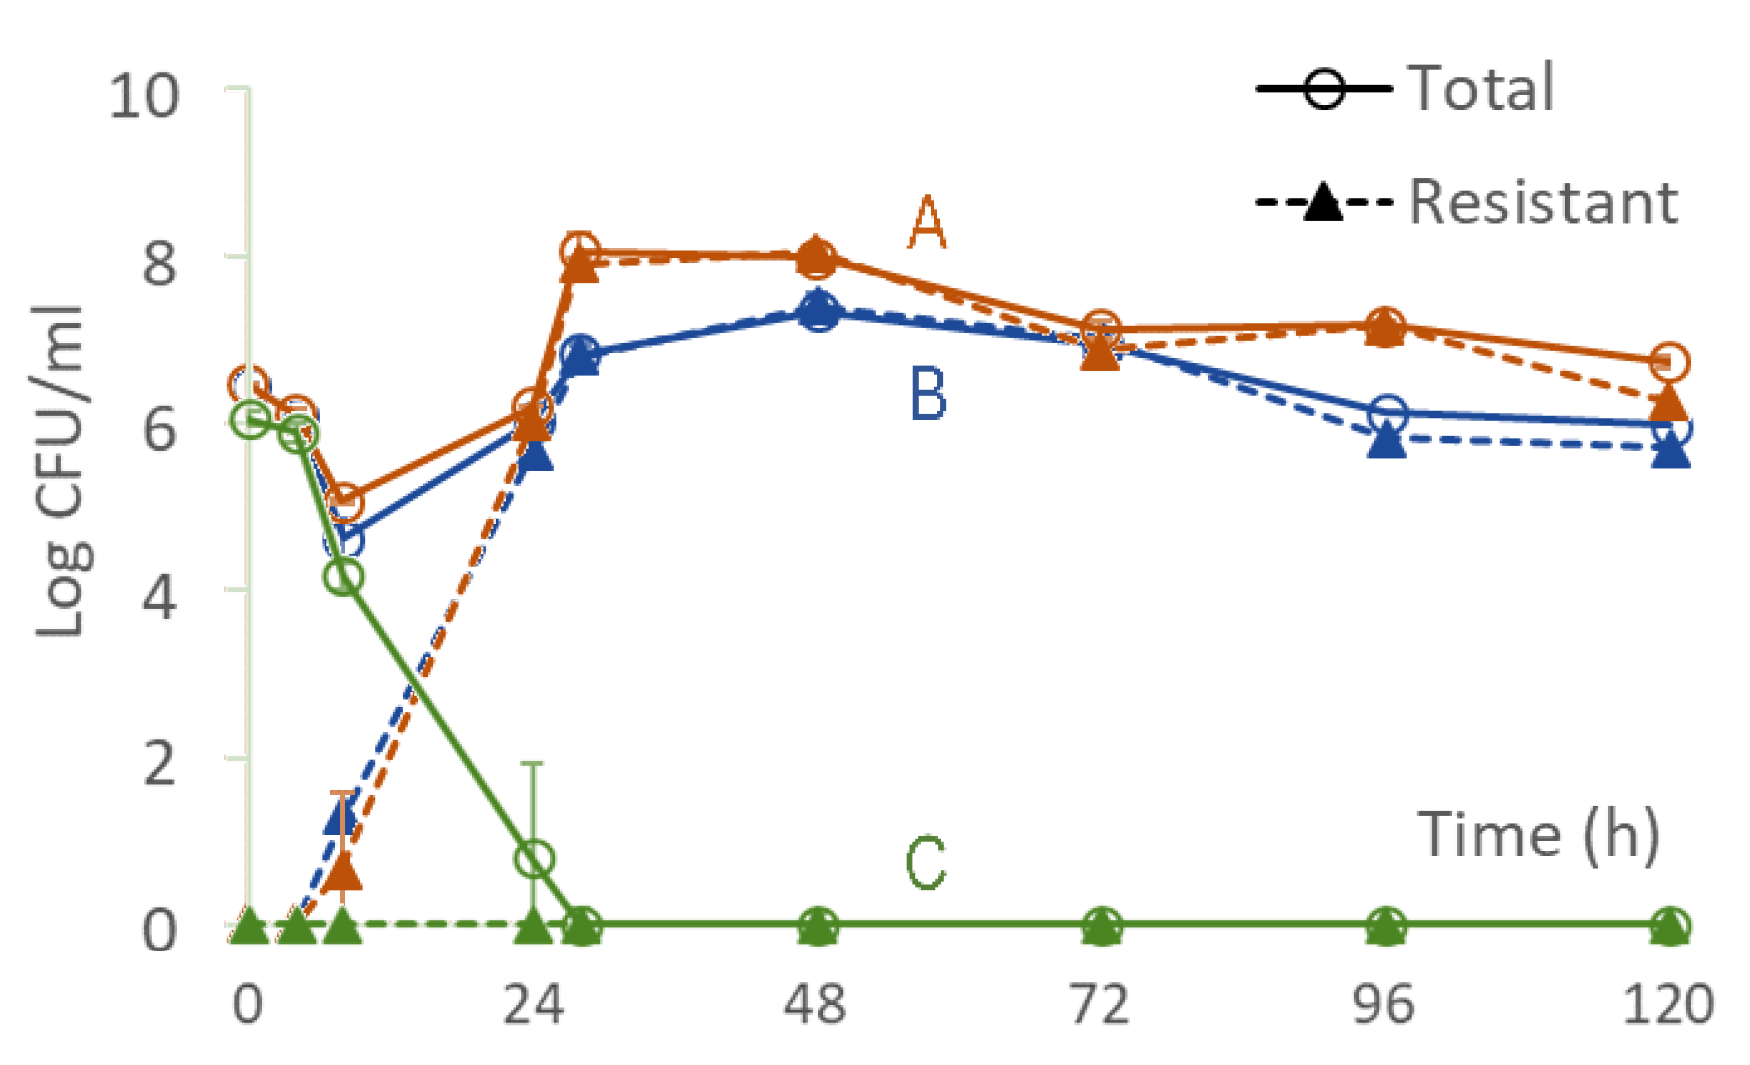
3.1. Longitudinal Optical Density Measurements of Bacterial Cell Suspension under Drug Exposure

Proof of concept was provided in [18] for the information extraction capabilities of model-based analysis of longitudinal optical density measurements from a bacterial suspension exposed to antibiotics in time–kill experiments, as outlined in Section 2.1. In [18], levofloxacin in fourfold dilutions was used against Acinetobacter baumannii, ATCC BAA747. In that study, longitudinal measurements of the bacterial population size (of the kind shown in Figure 1b) for both live and dead cells were collected by an optical density instrument (BacterioScan model 216Dx) at the early stages of its development at the time. Even though the instrument could not explicitly report declining population patterns for live cells, as explained in Section 2.1, the model-based analysis of optical density data for both live and dead cells could reconstruct the live cell population over time with remarkable fidelity, correctly estimating live population decline and subsequent long-term regrowth patterns from data of as little duration as six hours. These patterns were confirmed with separate, far more time-consuming, plating-based measurements in the same study, validating the credibility of the method and suggesting its potential use in dosing regimen design for clinically relevant pharmacokinetics, as discussed next.

3.2. From Optical Density Measurements to Dosing Regimen Design for Clinically Relevant Pharmacokinetics

The capability of the proposed model-based methodology to start from optical density time–kill measurements and eventually guide individualized dosing regimen design for clinically relevant pharmacokinetics was experimentally validated in vitro in [19]. In that study, longitudinal optical density measurements were collected using the same instrument as in Section 3.1. In corresponding time–kill experiments, Acinetobacter baumannii, ATCC BAA747, was exposed to fourfold dilutions of (a) ceftazidime and of (b) ceftazidime/amikacin in a concentrations ratio of 2:1. Model-based data analysis was performed for both cases, considering periodic injections every T = 8   h with subsequent exponential drug decline corresponding to a half-life of t 1 / 2 = 2.5   h . The design parameter left to choose from for both cases was C max , the peak concentration of ceftazidime (Figure 4). The outcome of the model-based analysis is summarized in Figure 8. In that figure, it is indicated that ceftazidime alone is not predicted with a high likelihood to suppress the entire bacterial population, even at high concentrations (Figure 8, CAZ). By contrast, the ceftazidime/amikacin 2:1 combination is predicted in the same figure (CAZ + AMK, 2:1) to have a very high likelihood of suppressing the bacterial population, even at relatively modest concentrations.
The predictions of Figure 8 were experimentally tested by implementing the antibiotic profile of Figure 4 in an in vitro hollow-fiber infection model, using C max = 60 or 150 mg / L for points A and B, respectively, and C max ,   ceftazidime / C max ,   amikacin = 40 / 20   ( mg / L ) / ( mg / L ) for point C of Figure 8. The outcomes are shown in Figure 9, where confirmation of predictions established in Figure 8 is evident.

4. Discussion

4.1. Optical Density Measurements and Alternatives

As already discussed in Section 1, a number of alternatives exist for measuring the number of cells in a population. These include quantitative polymerase chain reaction (PCR) [45,46], fluorescence microscopy [47,48], enzyme-linked immunosorbent assay (ELISA) [49], fluorescence-based microplate reader [50,51,52], flow cytometry [47,53,54], fiber-based fluorescence spectroscopy [55]), and microcalorimetry [56]. While they all have a significant role to play in corresponding applications, they also have disadvantages related to complexity or the current state of development, thus making optical density methods a viable option for the purposes of this study. A recent, informative review [57] summarizes such methods and their corresponding applications. For all methods, improvements in both instrument hardware and software are reasonable to anticipate in the future.
For optical density instruments, improvements would be welcome to address sources of systematic errors, such as the following: To extend their dynamic range, many optical density instruments change the measurement method from scattering to absorption based on a threshold value of bacterial concentration, thus possibly introducing calibration errors [19]. Dead cells decompose over time, thus changing the optical signature of the cell suspension and making corresponding adjustments necessary. The concentration of cells in suspension used in the instrument may not be uniform if mixing is not adequate, thus biasing measurements. A number of antibiotics, such as fluoroquinolones, can induce morphological changes in exposed bacteria (e.g., filaments at concentrations close to the MIC), thus inadvertently changing again the optical signature observed.
While the results presented here demonstrate the value of the proposed methodology, improvements in optical density instruments are anticipated to increase the methodology’s utility.

4.2. Clinically Relevant Pharmacokinetics and Design and In Vitro Testing of Dosing Regimens

A confident estimate of the effect of drug concentration, C , on the specific kill rate, r min , of the least susceptible bacterial subpopulation via Equation (1) (as discussed in Section 2.2) immediately allows for the use of Equation (9) to design of an effective dosing regimen that accommodates specified pharmacokinetics. Indeed, regardless of the particular form of C t in Equation (9), the effectiveness of a dosing regimen rests on whether D > K g . While the preceding analysis was carried out for the profile of C t shown in Figure 4, other profiles, such as profiles corresponding to multi-compartment models, may easily be considered [29].
It should also be noted that while the in vitro testing of dosing regimens in an HFIM outlined in Section 2.4 is specifically designed for pharmacokinetics, as shown in Figure 4, methods for experimental designs that address pharmacokinetics that correspond to multi-compartment models are directly feasible, using the Laplace-transforms-based method described in [44]. This is left for future investigation.

5. Conclusions and Future Work

The results presented here highlight the potential for clinicians to use the proposed method for individualized dosing regimen design. The utility of the proposed method can be further consolidated and expanded with additional future work. Potential items to study include the following:
  • Instrumentation improvements that may improve the quality of the data (reduction of systematic error);
  • A wider range of clonally diverse bacteria;
  • Bacteria with various resistance mechanisms;
  • Different antibiotics, particularly with pharmacodynamics and pharmacokinetic differences;
  • Combination therapy, particularly the interplay between pharmacodynamics and pharmacokinetics;
  • Automation of computations through software development;
  • Testing of in vivo relevance in animal infection models.

6. Patents

A US patent application has been filed for the method presented here [58].

Author Contributions

As this paper reviews prior results in a comprehensive way, both authors contributed equally to conceptualization, methodology, validation, formal analysis, investigation, resources, writing—original draft preparation, writing—review and editing, visualization, supervision, project administration, and funding acquisition. All authors have read and agreed to the published version of the manuscript.

Funding

The Institute of Allergy and Infectious Diseases of the National Institutes of Health, under award number R01AI140287-05, supported the research reported in this publication. One hundred percent of the project costs were financed with Federal money. The content is solely the responsibility of the authors and does not necessarily represent the official views of the National Institutes of Health. Funding sources had no involvement in the study design; in the collection, analysis, and interpretation of data; or in the writing of the report or the decision to submit the article for publication.

Institutional Review Board Statement

Not applicable.

Informed Consent Statement

Not applicable.

Data Availability Statement

Not applicable.

Conflicts of Interest

The authors declare no conflict of interest. The funders had no role in the design of the study; in the collection, analyses, or interpretation of data; in the writing of the manuscript; or in the decision to publish the results.

References

  1. Craig, W.A. Pharmacokinetic/Pharmacodynamic Parameters: Rationale for Antibacterial Dosing of Mice and Men. Clin. Infect. Dis. 1998, 26, 1–10. [Google Scholar] [CrossRef] [PubMed]
  2. Dadgostar, P. Antimicrobial Resistance: Implications and Costs. Infect. Drug Resist. 2019, 12, 3903–3910. [Google Scholar] [CrossRef] [PubMed] [Green Version]
  3. Sanders, E.R. Aseptic Laboratory Techniques: Plating Methods. J. Vis. Exp. 2012, 11, e3064. [Google Scholar] [CrossRef]
  4. Tam, V.H.; Nikolaou, M. A Novel Approach to Pharmacodynamic Assessment of Antimicrobial Agents: New Insights to Dosing Regimen Design. PLoS Comput. Biol. 2011, 7, e1001043. [Google Scholar] [CrossRef]
  5. Andrews, J.M. Determination of minimum inhibitory concentrations. J. Antimicrob. Chemother. 2001, 48, 5–16. [Google Scholar] [CrossRef] [PubMed] [Green Version]
  6. Mouton, J.W.; Dudley, M.N.; Cars, O.; Derendorf, H.; Drusano, G.L. Standardization of pharmacokinetic/pharmacodynamic (PK/PD) terminology for anti-infective drugs: An update. J. Antimicrob. Chemother. 2005, 55, 601–607. [Google Scholar] [CrossRef] [PubMed] [Green Version]
  7. Wiegand, I.; Hilpert, K.; Hancock, R.E.W. Agar and broth dilution methods to determine the minimal inhibitory concentration (MIC) of antimicrobial substances. Nat. Protoc. 2008, 3, 163–175. [Google Scholar] [CrossRef]
  8. Vogelman, B.; Craig, W.A. Kinetics of antimicrobial activity. J. Pediatr. 1986, 108, 835–840. [Google Scholar] [CrossRef]
  9. Giraldo, J.; Vivas, N.M.; Vila, E.; Badia, A. Assessing the (a)symmetry of concentration-effect curves: Empirical versus mechanistic models. Pharmacol. Ther. 2002, 95, 21–45. [Google Scholar] [CrossRef]
  10. Lipsitch, M.; Levin, B.R. The population dynamics of antimicrobial chemotherapy. Antimicrob. Agents Chemother. 1997, 41, 363–373. [Google Scholar] [CrossRef] [Green Version]
  11. Bhagunde, P.R.; Nikolaou, M.; Tam, V.H. Modeling heterogeneous bacterial populations exposed to antibiotics: The logistic-dynamics case. AIChE J. 2015, 61, 2385–2393. [Google Scholar] [CrossRef] [PubMed]
  12. Nikolaou, M.; Tam, V.H. A New Modeling Approach to the Effect of Antimicrobial Agents on Heterogeneous Microbial Populations. J. Math. Biol. 2005, 52, 154–182. [Google Scholar] [CrossRef] [PubMed]
  13. Mueller, M.; de la Pena, A.; Derendorf, H. Issues in Pharmacokinetics and Pharmacodynamics of Anti-Infective Agents: Kill Curves versus MIC. Antimicrob. Agents Chemother. 2004, 48, 369–377. [Google Scholar] [CrossRef] [PubMed] [Green Version]
  14. Mytilinaios, I.; Salih, M.; Schofield, H.K.; Lambert, R.J.W. Growth curve prediction from optical density data. Int. J. Food Microbiol. 2012, 154, 169–176. [Google Scholar] [CrossRef] [Green Version]
  15. López, S.; Prieto, M.; Dijkstra, J.; Dhanoa, M.; France, J. Statistical evaluation of mathematical models for microbial growth. Int. J. Food Microbiol. 2004, 96, 289–300. [Google Scholar] [CrossRef]
  16. McMeekin, T.A.; Olley, J.N.; Ross, T.; Ratkowsky, D.A. Predictive Microbiology: Theory and Application; Wiley: New York, NY, USA, 1993. [Google Scholar]
  17. Davaro, E.; Tomaras, A.P.; Chamberland, R.R.; Isbell, T.S. Evaluation of a Novel Light Scattering Methodology for the Detection of Pathogenic Bacteria in Urine. J. Appl. Lab. Med. 2020, 5, 370–376. [Google Scholar] [CrossRef]
  18. Kesisoglou, I.; Tam, V.H.; Tomaras, A.P.; Nikolaou, M. Discerning in vitro pharmacodynamics from OD measurements: A model-based approach. Comput. Chem. Eng. 2022, 158. [Google Scholar] [CrossRef]
  19. Kesisoglou, I.; Eales, B.M.; Merlau, P.R.; Tam, V.H.; Nikolaou, M. Deciphering longitudinal optical-density measurements to guide clinical dosing regimen design: A model-based approach. Comput. Methods Programs Biomed. 2022, 227, 107212. [Google Scholar] [CrossRef]
  20. Schaechter, M. A brief history of bacterial growth physiology. Front. Microbiol. 2015, 6, 289. [Google Scholar] [CrossRef] [Green Version]
  21. Baranyi, J.; Roberts, T.A.; McClure, P. A non-autonomous different equation to model bacterial growth. Food Microbiol. 1993, 10, 43–59. [Google Scholar] [CrossRef]
  22. Verhulst, P.F. Resherches mathematiques sur la loi d’accroissement de la population. Nouv. Mem. L’academie R. Sci. 1845, 18, 1–41. [Google Scholar]
  23. Jusko, W.J. Pharmacodynamics of Chemotherapeutic Effects: Dose-Time-Response Relationships for Phase-Nonspecific Agents. J. Pharm. Sci. 1971, 60, 892–895. [Google Scholar] [CrossRef] [PubMed]
  24. Wagner, J. Kinetics of pharmacologic response I. Proposed relationships between response and drug concentration in the intact animal and man. J. Theor. Biol. 1968, 20, 173–201. [Google Scholar] [CrossRef]
  25. Hill, A.V. The possible effects of the aggregation of the molecules of haemoglobin on its dissociation curves. J. Physiol. 1910, 40, iv–vii. [Google Scholar]
  26. Tamma, P.D.; Cosgrove, S.E.; Maragakis, L.L. Combination Therapy for Treatment of Infections with Gram-Negative Bacteria. Clin. Microbiol. Rev. 2012, 25, 450–470. [Google Scholar] [CrossRef] [PubMed] [Green Version]
  27. Gloede, J.; Scheerans, C.; Derendorf, H.; Kloft, C. In vitro pharmacodynamic models to determine the effect of antibacterial drugs. J. Antimicrob. Chemother. 2010, 65, 186–201. [Google Scholar] [CrossRef] [Green Version]
  28. Doern, C.D. When Does 2 Plus 2 Equal 5? A Review of Antimicrobial Synergy Testing. J. Clin. Microbiol. 2014, 52, 4124–4128. [Google Scholar] [CrossRef] [Green Version]
  29. Rosenbaum, S.E. (Ed.) Basic Pharmacokinetics and Pharmacodynamics: An Integrated Textbook and Computer Simulations, 2nd ed.; Wiley: Hoboken, NJ, USA, 2016. [Google Scholar]
  30. Nikolaou, M.; Schilling, A.N.; Vo, G.; Chang, K.-T.; Tam, V.H. Modeling of Microbial Population Responses to Time-Periodic Concentrations of Antimicrobial Agents. Ann. Biomed. Eng. 2007, 35, 1458–1470. [Google Scholar] [CrossRef]
  31. Blaser, J.; Stone, B.; Zinner, S. Two compartment kinetic model with multiple artificial capilary units. J. Antimicrob. Chemother. 1985, 15, 131–137. [Google Scholar] [CrossRef]
  32. Bulitta, J.B.; Hope, W.W.; Eakin, A.E.; Guina, T.; Tam, V.H.; Louie, A.; Drusano, G.L.; Hoover, J.L. Generating Robust and Informative Nonclinical In Vitro and In Vivo Bacterial Infection Model Efficacy Data to Support Translation to Humans. Antimicrob. Agents Chemother. 2019, 63, e02307-18. [Google Scholar] [CrossRef] [Green Version]
  33. Cadwell, J. The hollow fiber infection model: Principles and practice. Adv. Antibiot. Antibodies 2015, 1, 101. [Google Scholar]
  34. Bao, L.; Liu, B.; Lipscomb, G.G. Entry mass transfer in axial flows through randomly packed fiber bundles. AIChE J. 1999, 45, 2346–2356. [Google Scholar] [CrossRef]
  35. De Bartolo, L.; Salerno, S.; Curcio, E.; Piscioneri, A.; Rende, M.; Morelli, S.; Tasselli, F.; Bader, A.; Drioli, E. Human hepatocyte functions in a crossed hollow fiber membrane bioreactor. Biomaterials 2009, 30, 2531–2543. [Google Scholar] [CrossRef] [PubMed]
  36. Blaser, J. In-vitro model for simultaneous simulation of the serum kinetics of two drugs with different half-lives. J. Antimicrob. Chemother. 1985, 15, 125–130. [Google Scholar] [CrossRef] [PubMed]
  37. Siwakoti, S.; Subedi, A.; Sharma, A.; Baral, R.; Bhattarai, N.R.; Khanal, B. Incidence and outcomes of multidrug-resistant gram-negative bacteria infections in intensive care unit from Nepal–a prospective cohort study. Antimicrob. Resist. Infect. Control 2018, 7, 114. [Google Scholar] [CrossRef] [Green Version]
  38. Wang, M.; Wei, H.; Zhao, Y.; Shang, L.; Di, L.; Lyu, C.; Liu, J. Analysis of multidrug-resistant bacteria in 3223 patients with hospital-acquired infections (HAI) from a tertiary general hospital in China. Bosn. J. Basic Med. Sci. 2019, 19, 86–93. [Google Scholar] [CrossRef] [Green Version]
  39. Jain, A.; Roy, I.; Gupta, M.K.; Kumar, M.; Agarwal, S.K. Prevalence of extended-spectrum β-lactamase-producing Gram-negative bacteria in septicaemic neonates in a tertiary care hospital. J. Med. Microbiol. 2003, 52, 421–425. [Google Scholar] [CrossRef] [Green Version]
  40. Pop-Vicas, A.; Mitchell, S.L.; Kandel, R.; Schreiber, R.; D’Agata, E.M.C. Multidrug-Resistant Gram-Negative Bacteria in a Long-Term Care Facility: Prevalence and Risk Factors. J. Am. Geriatr. Soc. 2008, 56, 1276–1280. [Google Scholar] [CrossRef]
  41. Saeed, S.; Naim, A.; Tariq, P. A study on prevalance of multi-drug-resistant gram negative bacteria. Int. J. Biol. Biotech. 2007, 4, 71–74. [Google Scholar]
  42. Tängdén, T. Combination antibiotic therapy for multidrug-resistant Gram-negative bacteria. Upsala J. Med. Sci. 2014, 119, 149–153. [Google Scholar] [CrossRef]
  43. Karakonstantis, S.; Kritsotakis, E.I.; Gikas, A. Pandrug-resistant Gram-negative bacteria: A systematic review of current epidemiology, prognosis and treatment options. J. Antimicrob. Chemother. 2020, 75, 271–282. [Google Scholar] [CrossRef] [PubMed]
  44. Kesisoglou, I.; Eales, B.M.; Ledesma, K.R.; Merlau, P.R.; Tam, V.H.; Wang, W.; Nikolaou, M. Simultaneous in vitro simulation of multiple antimicrobial agents with different elimination half-lives in a pre-clinical infection model. Comput. Chem. Eng. 2021, 155, 107540. [Google Scholar] [CrossRef] [PubMed]
  45. Kralik, P.; Ricchi, M. A Basic Guide to Real Time PCR in Microbial Diagnostics: Definitions, Parameters, and Everything. Front. Microbiol. 2017, 8, 108. [Google Scholar] [CrossRef] [PubMed] [Green Version]
  46. Ricchi, M.; Bertasio, C.; Boniotti, M.B.; Vicari, N.; Russo, S.; Tilola, M.; Bellotti, M.A.; Bertasi, B. Comparison among the Quantification of Bacterial Pathogens by qPCR, dPCR, and Cultural Methods. Front. Microbiol. 2017, 8, 1174. [Google Scholar] [CrossRef] [PubMed] [Green Version]
  47. Wang, Y.; Hammes, F.; De Roy, K.; Verstraete, W.; Boon, N. Past, present and future applications of flow cytometry in aquatic microbiology. Trends Biotechnol. 2010, 28, 416–424. [Google Scholar] [CrossRef]
  48. Hasan, M.; Alam, M.W.; Wahid, K.A.; Miah, S.; Lukong, K.E. A Low-Cost Digital Microscope with Real-Time Fluorescent Imaging Capability. PLoS ONE 2016, 11, e0167863. [Google Scholar] [CrossRef]
  49. Gracias, K.S.; McKillip, J.L. A review of conventional detection and enumeration methods for pathogenic bacteria in food. Can. J. Microbiol. 2004, 50, 883–890. [Google Scholar] [CrossRef] [Green Version]
  50. Pascaud, A.; Amellal, S.; Soulas, M.-L.; Soulas, G. A fluorescence-based assay for measuring the viable cell concentration of mixed microbial communities in soil. J. Microbiol. Methods 2009, 76, 81–87. [Google Scholar] [CrossRef]
  51. Feng, J.; Wang, T.; Zhang, S.; Shi, W.; Zhang, Y. An Optimized SYBR Green I/PI Assay for Rapid Viability Assessment and Antibiotic Susceptibility Testing for Borrelia burgdorferi. PLoS ONE 2014, 9, e111809. [Google Scholar] [CrossRef]
  52. Alakomi, H.-L.; Mättö, J.; Virkajärvi, I.; Saarela, M. Application of a microplate scale fluorochrome staining assay for the assessment of viability of probiotic preparations. J. Microbiol. Methods 2005, 62, 25–35. [Google Scholar] [CrossRef]
  53. Ou, F.; McGoverin, C.; Swift, S.; Vanholsbeeck, F. Absolute bacterial cell enumeration using flow cytometry. J. Appl. Microbiol. 2017, 123, 464–477. [Google Scholar] [CrossRef] [Green Version]
  54. Imade, G.E.; Badung, B.; Pam, S.; Agbaji, O.; Egah, D.; Sagay, A.S.; Sankale, J.-L.; Kapiga, S.; Idoko, J.; Kanki, P. Comparison of a New, Affordable Flow Cytometric Method and the Manual Magnetic Bead Technique for CD4 T-Lymphocyte Counting in a Northern Nigerian Setting. Clin. Vaccine Immunol. 2005, 12, 224–227. [Google Scholar] [CrossRef] [PubMed] [Green Version]
  55. Guo, R.; McGoverin, C.; Swift, S.; Vanholsbeeck, F. A rapid and low-cost estimation of bacteria counts in solution using fluorescence spectroscopy. Anal. Bioanal. Chem. 2017, 409, 3959–3967. [Google Scholar] [CrossRef] [Green Version]
  56. Braissant, O.; Wirz, D.; GãPfert, B.; Daniels, A.U. Use of isothermal microcalorimetry to monitor microbial activities. FEMS Microbiol. Lett. 2010, 303, 1–8. [Google Scholar] [CrossRef] [PubMed]
  57. Al-Madani, H.; Du, H.; Yao, J.; Peng, H.; Yao, C.; Jiang, B.; Wu, A.; Yang, F. Living Sample Viability Measurement Methods from Traditional Assays to Nanomotion. Biosensors 2022, 12, 453. [Google Scholar] [CrossRef] [PubMed]
  58. Nikolaou, M.; Tam, V.H.; Kesisoglou, I. Optical Based Methods for Determining Antimicrobial Dosing Regimens. U.S. Patent App. 17/636,079, 17 February 2022. [Google Scholar]
Figure 1. Qualitative patterns of the number of live (a) and total (b) bacterial cells in suspension ( N live and N total , respectively) exposed to time-invariant antibiotic concentrations in multifold dilutions. The same scale is used for both N live and N total . Bacterial subpopulations of varying degrees of drug resistance are considered. As drug concentration is set at increasingly higher values, the bacterial population response over time exhibits the five patterns shown. Note that while the number of live cells may decline (a), the total number of cells (both live and dead) will never decline (b). An optical density instrument can only produce the curves in (b). In fact, for high concentrations of the antibiotic, the curves for N total are practically indistinguishable over time. A central focus of this paper is to summarize a mathematical model-based methodology for obtaining the curves of (a) from the curves in (b), a task that is arguably impossible based on inspection alone.
Pharmaceutics 15 01671 g001
Figure 2. Bactericidal rate of drugs following concentration-dependent ( H 1 ) or time-dependent ( H 1 ) activity [1], as captured by the Hill exponent H in Equation (1).
Pharmaceutics 15 01671 g002
Figure 3. Fit of Equation (1) to values of r min estimated from time–kill experiments with a bacterial population exposed to distinct drug concentrations C . (a) Eradication of the entire bacterial population is predicted for high enough drug concentrations C . (b) No drug concentration C can eliminate the entire bacterial population.
Pharmaceutics 15 01671 g003
Figure 4. Clinically relevant pharmacokinetics of drug injection every T time units at peak concentration C max for a drug with a corresponding half-life t 1 / 2 .
Pharmaceutics 15 01671 g004
Figure 5. Qualitatively distinct outcomes of a homogeneous bacterial population exposed to a drug following the PK in Figure 4, depending on D / K g (Equation (9)). (a) Bacterial population decline for D / K g > 1 . (b) Bacterial population growth for D / K g < 1 .
Pharmaceutics 15 01671 g005
Figure 6. Qualitative dependence of D / K g (compared to 1, gray plane) on design parameters T and C max (period of injection and peak drug concentration, respectively) associated with a dosing regimen following the pharmacokinetic pattern of Figure 4 for a drug of corresponding half-life and two different values of the Hill factor H   ( 0.5 vs. 8 , Figure 2).
Pharmaceutics 15 01671 g006
Figure 7. In vitro hollow fiber infection model (HFIM) for testing the effectiveness of three drugs that follow different pharmacokinetics. Design parameters shown take values according to the formulas developed in [44]. (a) In-series configuration: adds vessels B, C to the basic central vessel of the single-drug design. (b) In-parallel configuration: adds vessels A, B, C to the basic central vessel of the single-drug design, offering additional flexibility on the range of pharmacokinetics to be simulated in vitro. The framed areas in both (a,b) refer to the basic design for a single drug. Each framed area, along with vessel B and associated streams, corresponds to Blaser’s long-known configuration [31,36] for two drugs.
Pharmaceutics 15 01671 g007
Figure 8. Probability of satisfaction of Equation (9) for bacterial exposure to ceftazidime (CAZ) and combination of ceftazidime and amikacin at a mass ratio of 2:1 (CAZ + AMK, 2:1). In both cases, drugs were injected every T = 8   h with subsequent exponential decline of each concentration from its peak of C max , corresponding to half-life of t 1 / 2 = 2.5   h . C max = 60 or 150 mg / L for points A and B, respectively, and C max ,   ceftazidime / C max ,   amikacin = 40 / 20   ( mg / L ) / ( mg / L ) for point C were selected for testing in the in vitro HFIM with corresponding probabilities for D \ K g > 1 equal to 59%, 38%, and 98%, respectively.
Pharmaceutics 15 01671 g008
Figure 9. Bacterial response in the hollow fiber infection model corresponding to points A, B, and C of Figure 8. The responses associated with points A and B (orange and blue) correspond to injecting ceftazidime equivalent to 1   g ( C max = 60 mg / L ) and 2.5   g ( C max = 150 mg / L ) respectively, administered every 8   h , as shown in Figure 4. The response associated with point C (green) corresponds to injecting a combination of ceftazidime and amikacin ( 2 : 1 mass ratio) with ceftazidime equivalent to 0.67   g and amikacin equivalent to 5 mg / kg administered every 8   h , as shown in Figure 4. Data are shown as mean ± standard deviation.
Pharmaceutics 15 01671 g009
Disclaimer/Publisher’s Note: The statements, opinions and data contained in all publications are solely those of the individual author(s) and contributor(s) and not of MDPI and/or the editor(s). MDPI and/or the editor(s) disclaim responsibility for any injury to people or property resulting from any ideas, methods, instructions or products referred to in the content.

