

Influence of Molecular Structure and Physicochemical Properties of Immunosuppressive Drugs on Micelle Formulation Characteristics and Cutaneous Delivery


Abstract
1. Introduction

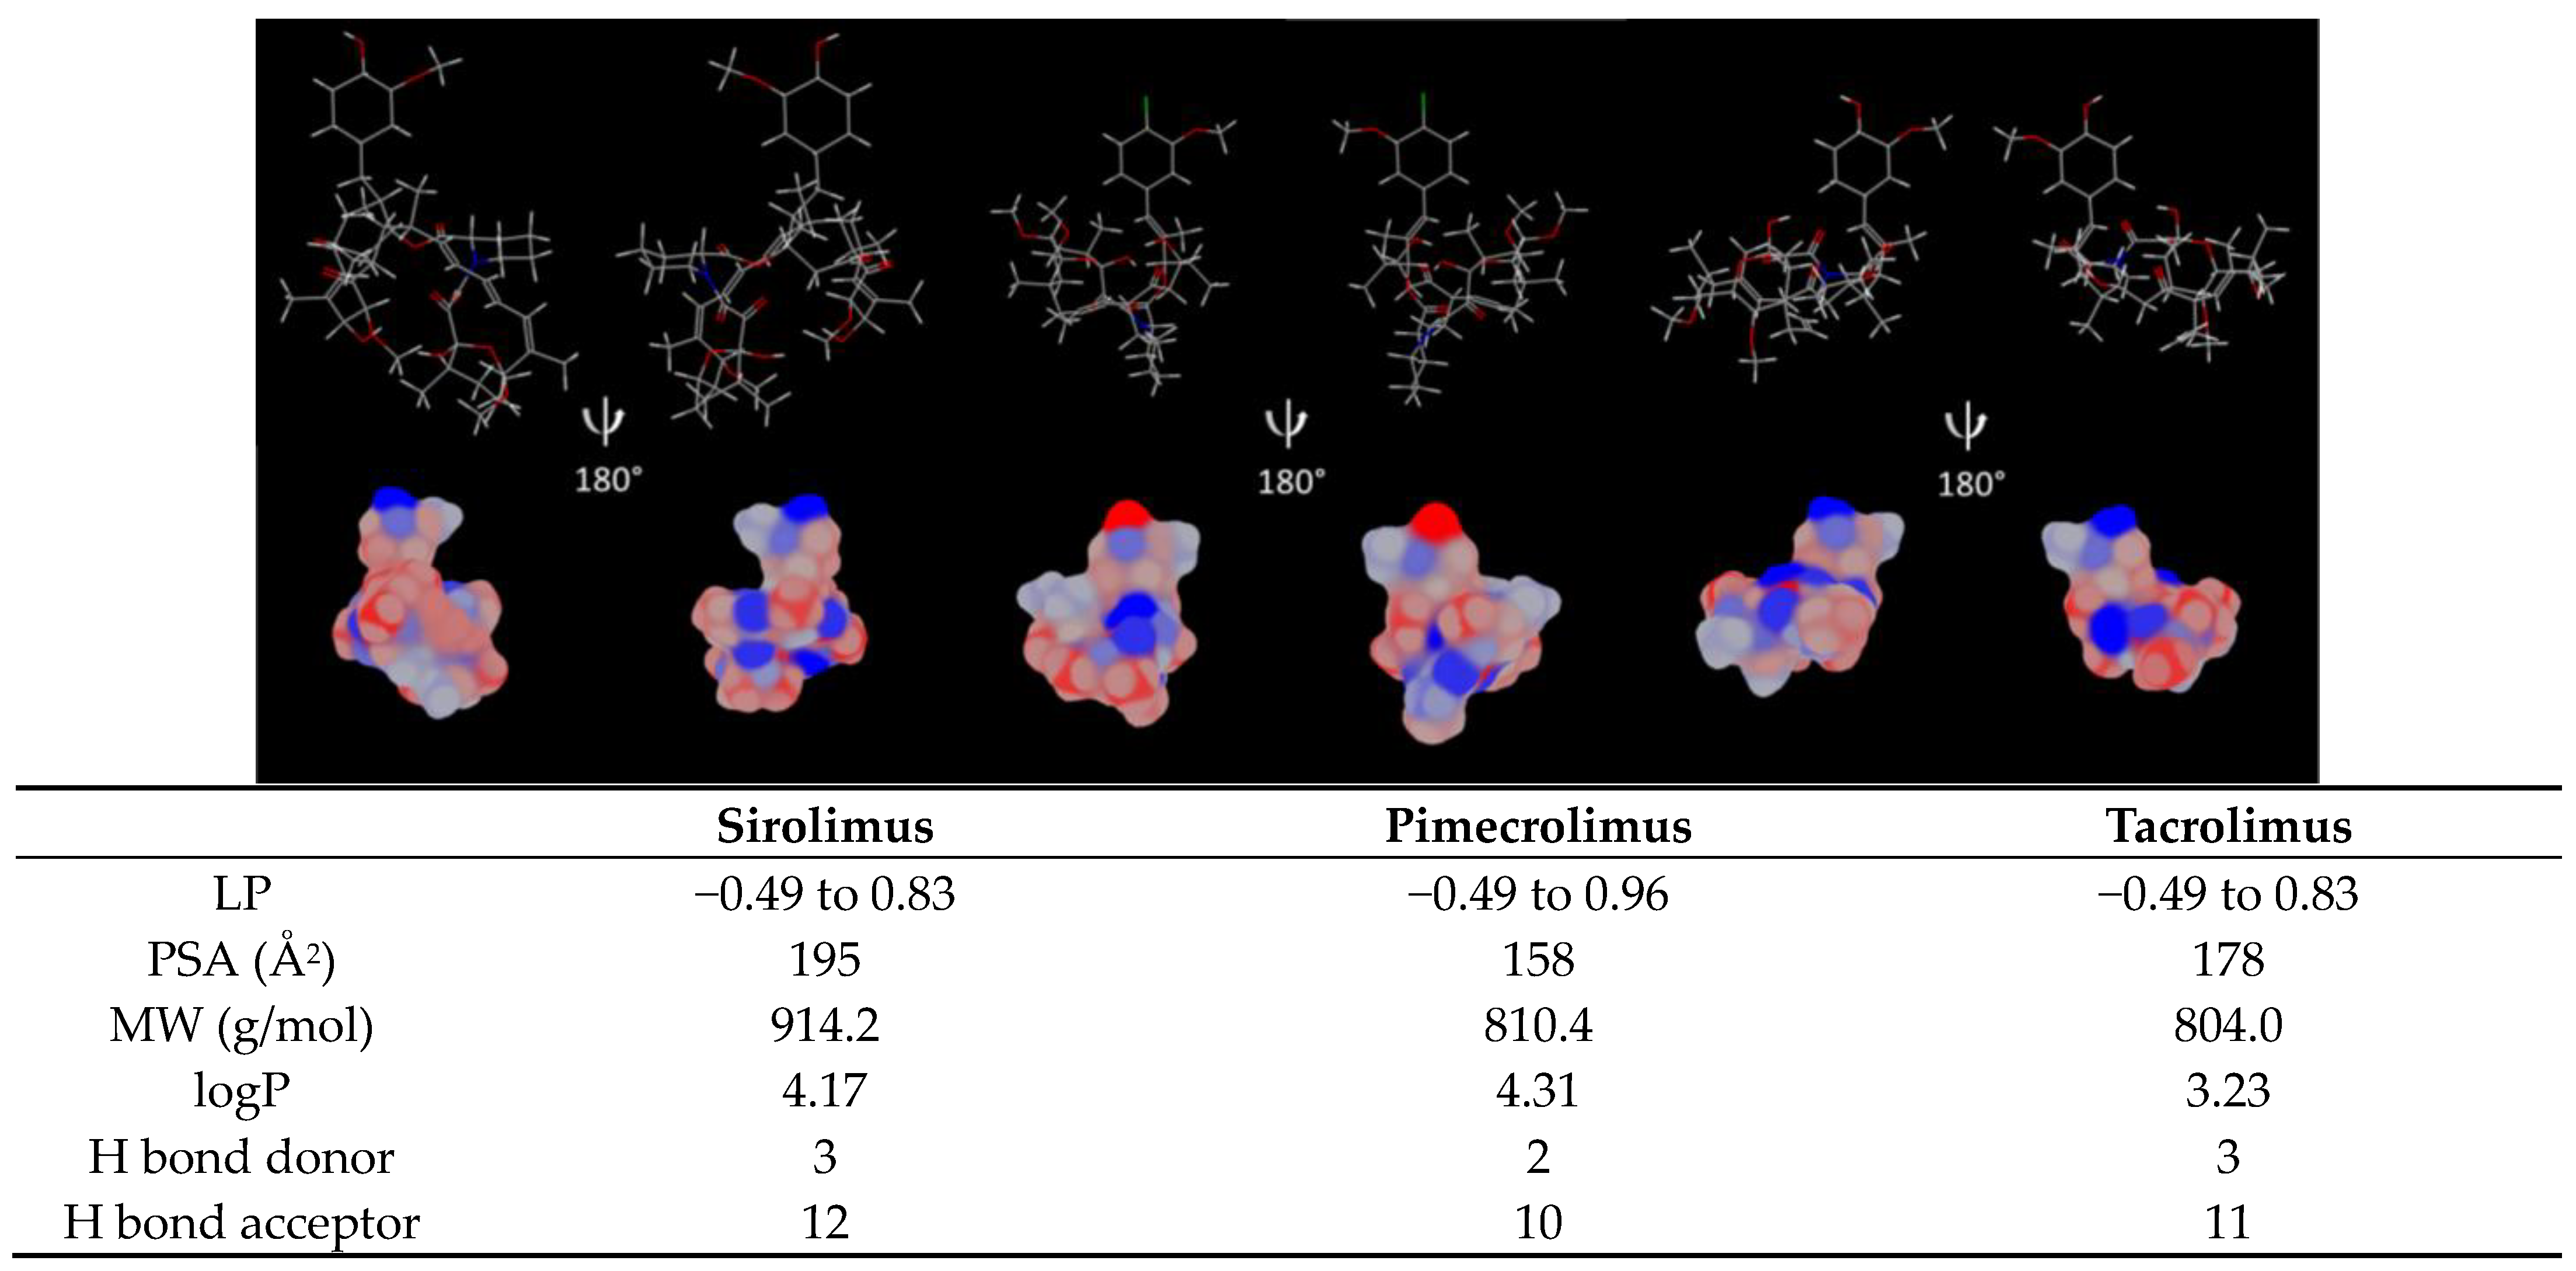
| Sirolimus | Pimecrolimus | Tacrolimus | |
|---|---|---|---|
| Physicochemical properties | |||
| Molecular weight (g/mol) * | 914.2 | 810.4 | 804.0 |
| logP * | 4.17 | 4.31 | 3.23 |
| Aqueous solubility ** | Poor | Poor | Poor |
| Ionizable | No | No | No |
| Mechanism of action | |||
| Inhibitor of mTOR target [13] | Inhibitor of calcineurin target [14] | Inhibitor of calcineurin target [14] | |
| Indications | |||
| Oral Topical | Graft rejection Facial angiofibromas (off-label) [15,16], Psoriasis (off-label) [17] | - Atopic dermatitis, Psoriasis (off-label) [18] | Graft rejection Atopic dermatitis, Psoriasis (off-label) [19] |
2. Materials and Methods
2.1. Materials
2.2. Analytical Methods
2.2.1. Quantification by UHPLC-UV
2.2.2. Quantification with UHPLC-MS/MS
2.3. Preparation of the Micelle Formulation
2.3.1. Thin-Film Hydration Method
2.3.2. Optimization of Drug and Polymer Content
2.4. Characterization of Micelle Formulations
2.4.1. Drug Solubility in Water and Aqueous Solutions of TPGS
2.4.2. Thermal Properties
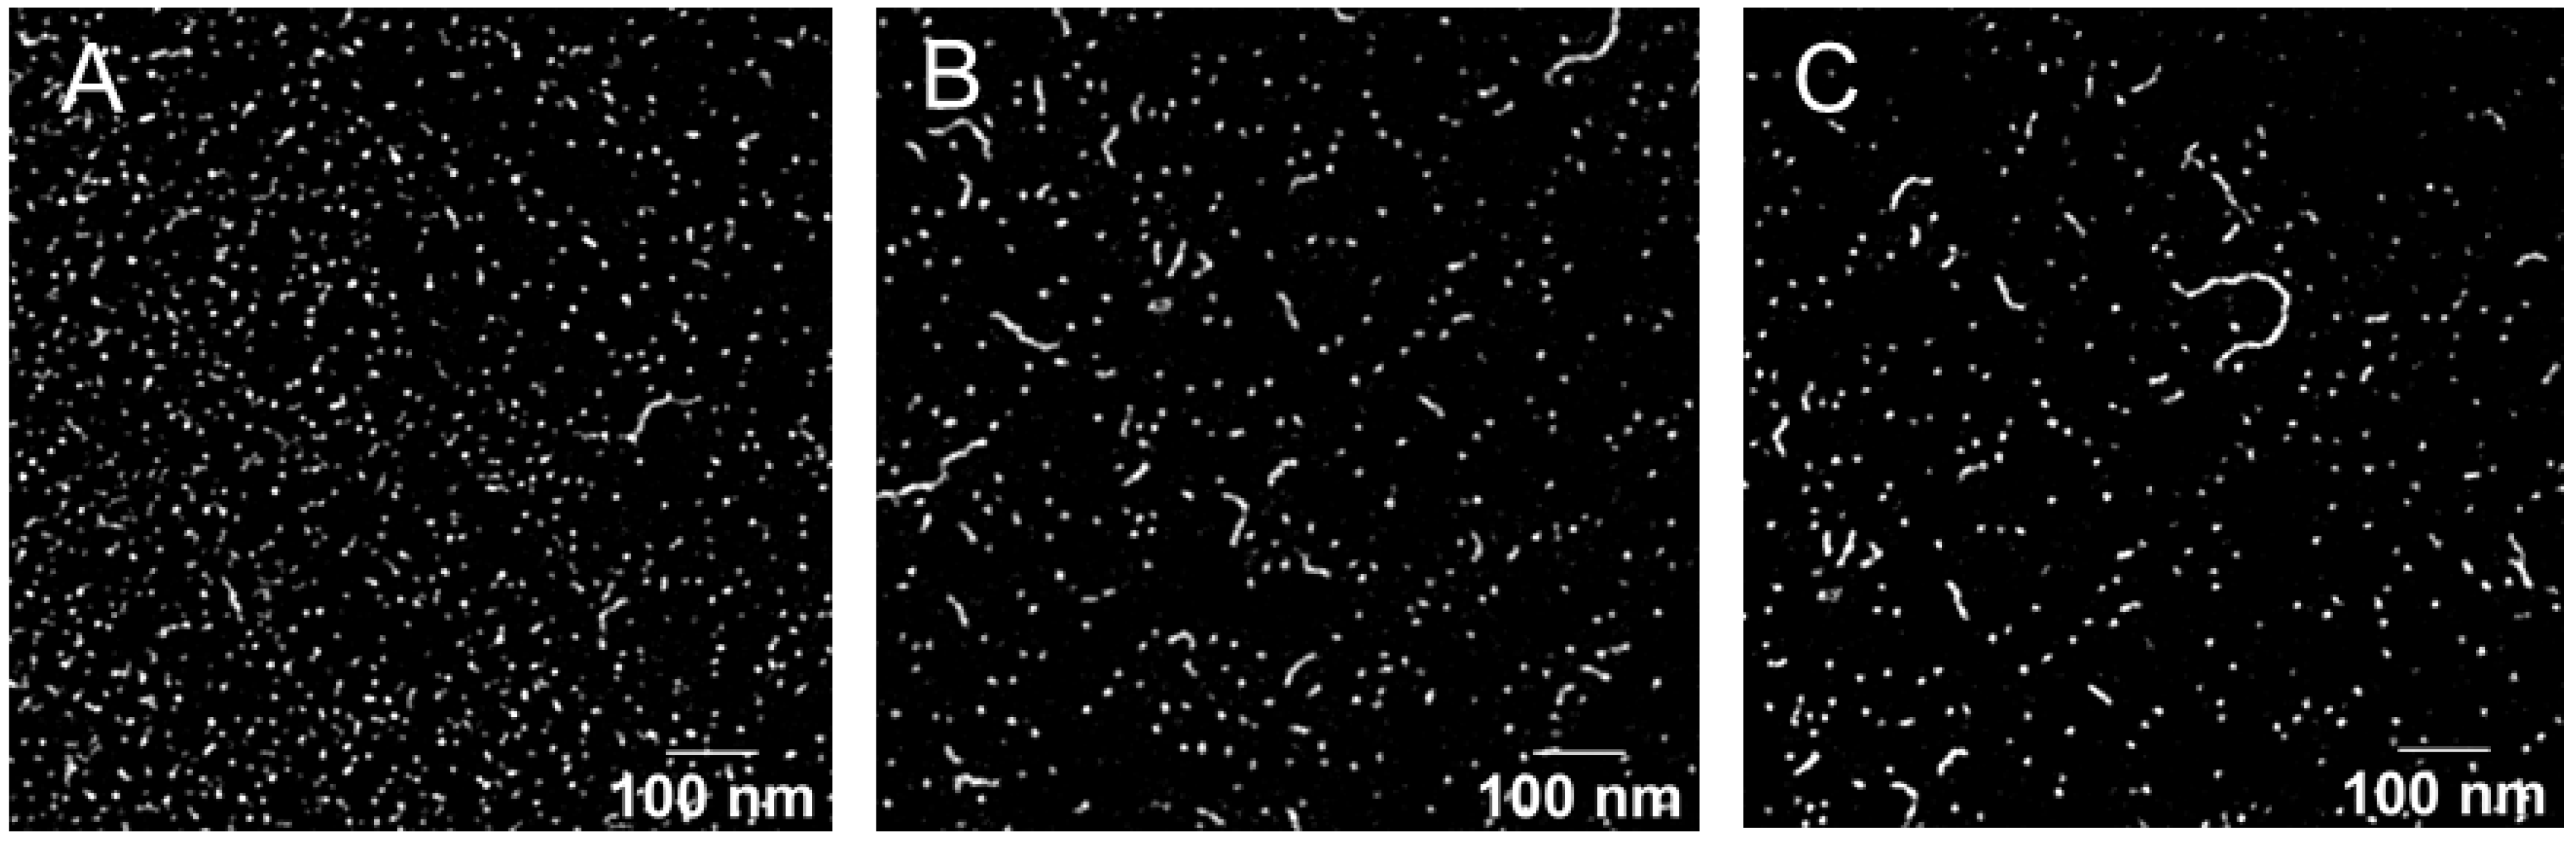
2.4.3. Size and Morphology Characterization
2.4.4. Drug Content Determination
2.4.5. Stability
2.4.6. In Vitro Drug Release from the Micelles
2.5. Evaluation of Skin Delivery In Vitro
2.5.1. Porcine Skin Preparation
2.5.2. Drug Delivery under Infinite Dose Conditions
2.5.3. Investigation of Drug Biodistribution Profile
2.5.4. Data Analysis
3. Results
3.1. Development of Micelle Formulations
3.1.1. Drug Solubility in Water and in Aqueous Solutions of TPGS
3.1.2. Optimization and Characterization of Micelle Formulation
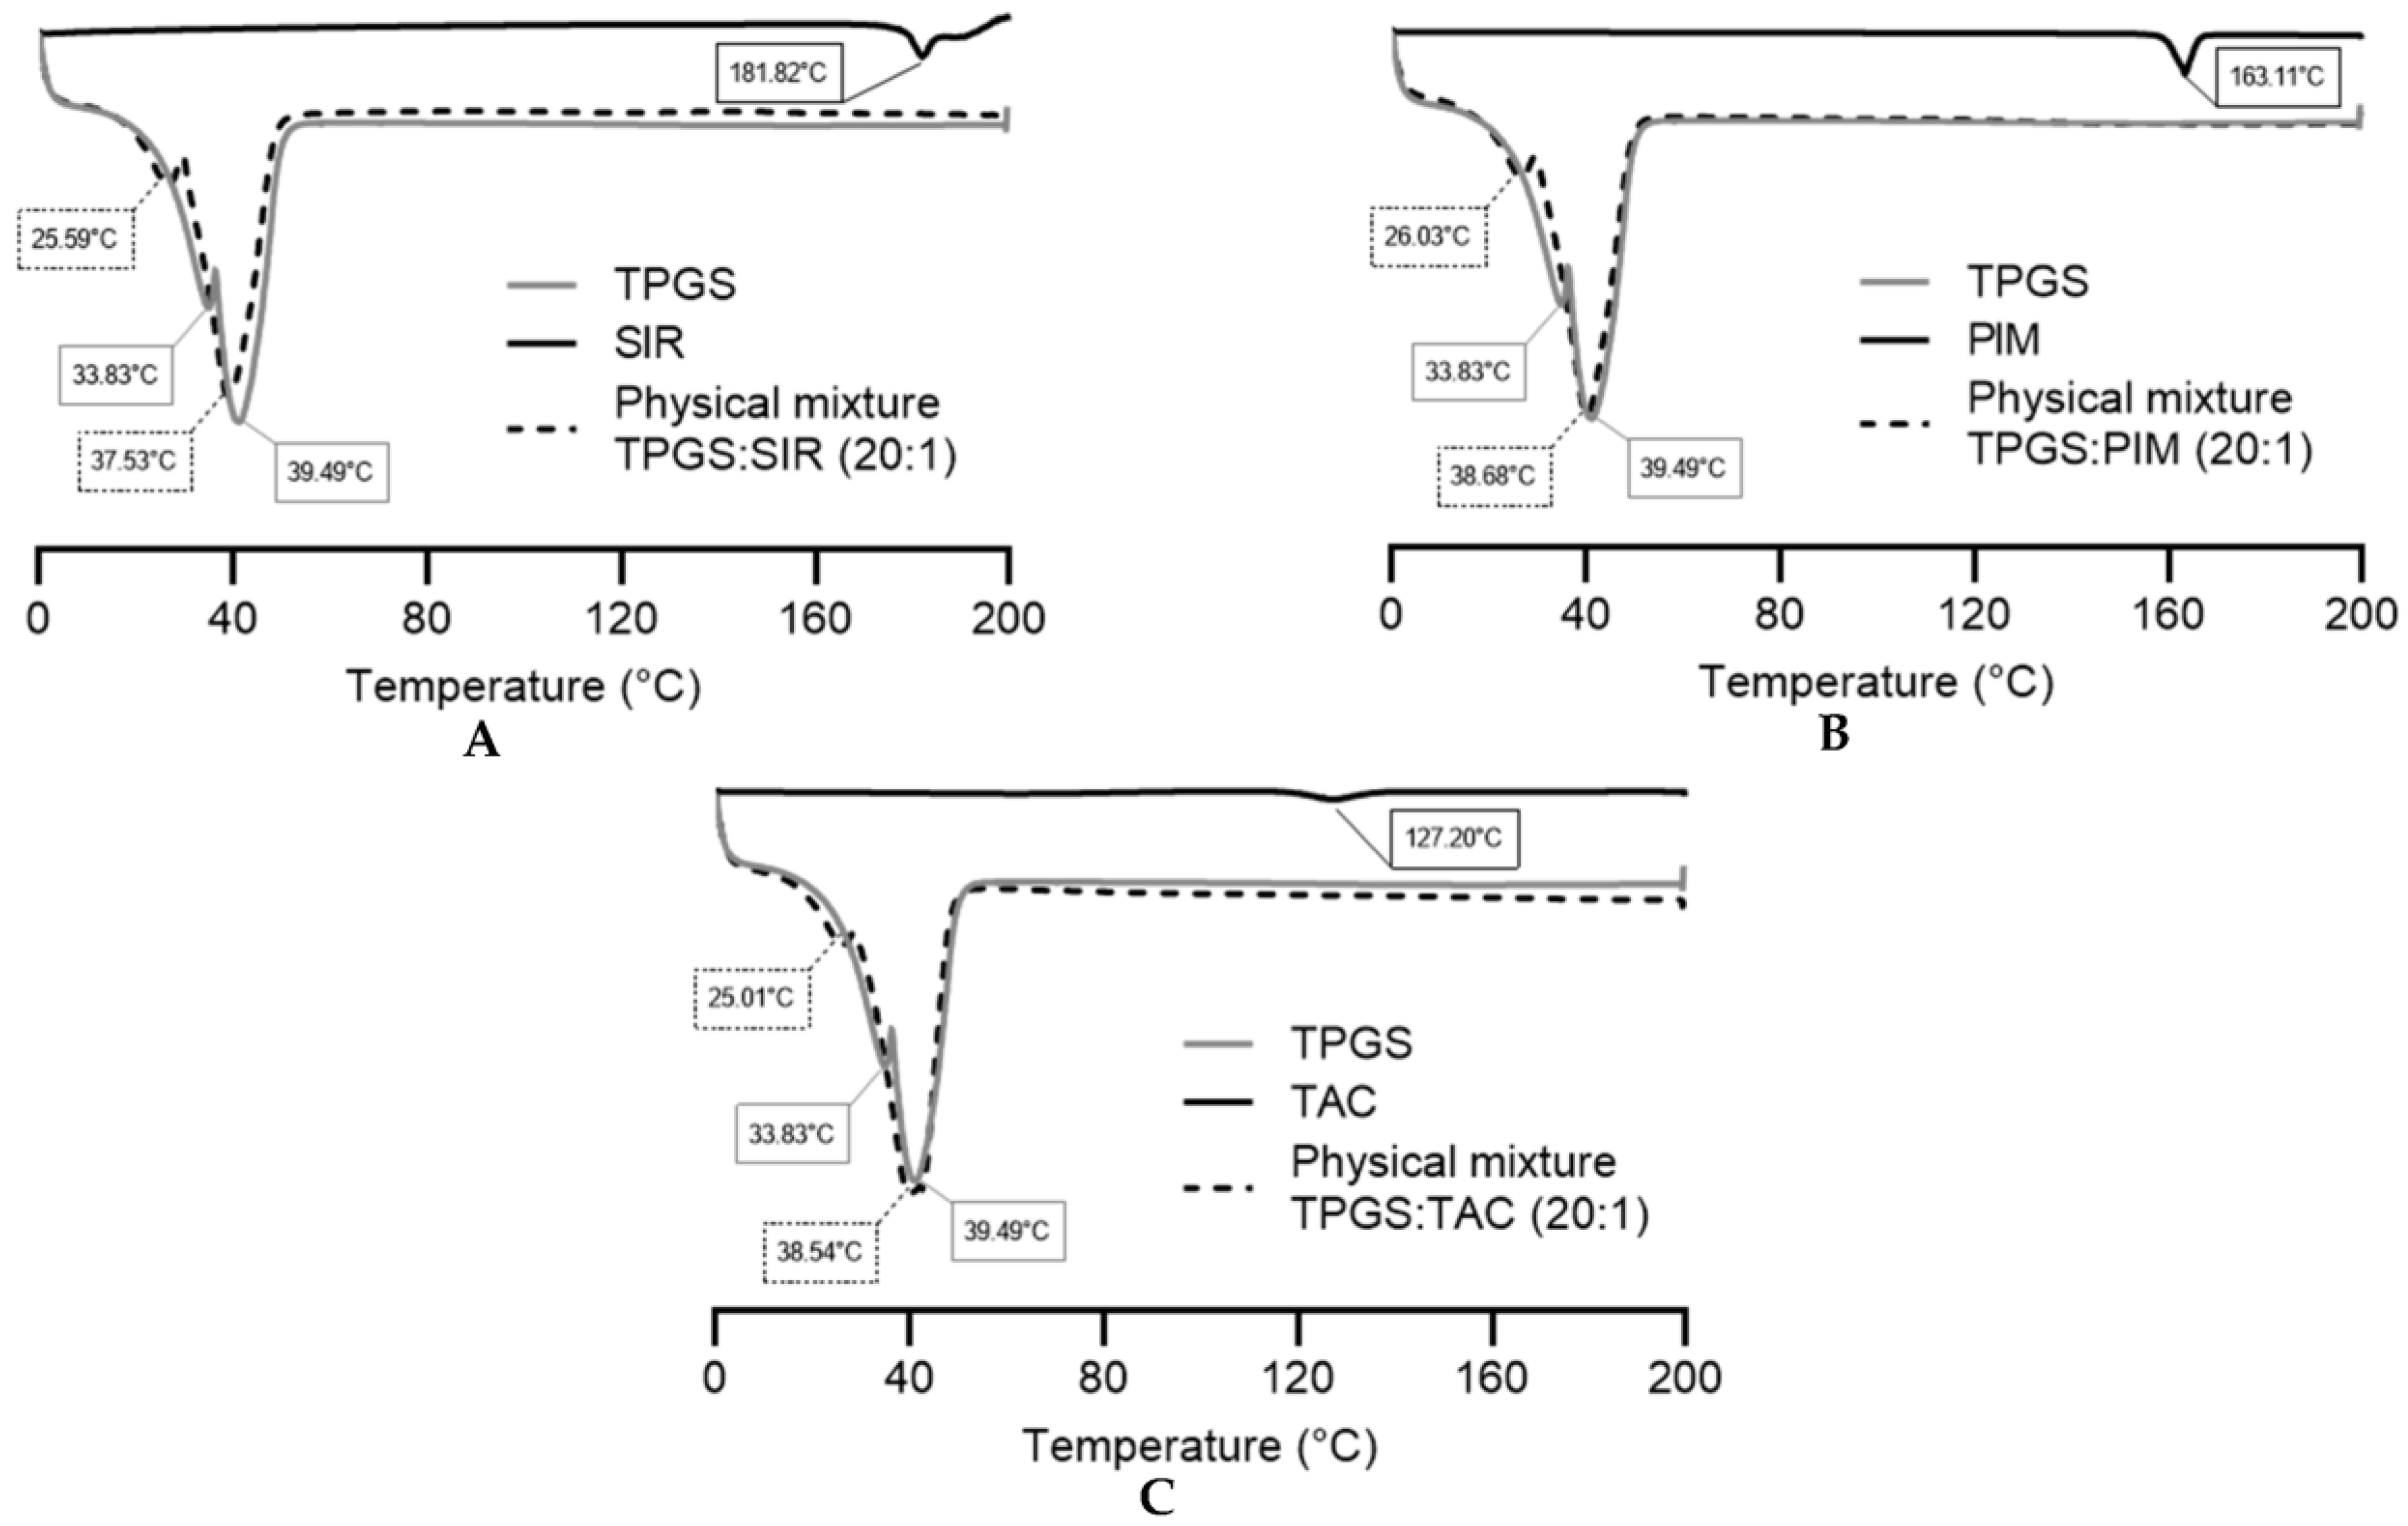
3.1.3. DSC Analysis
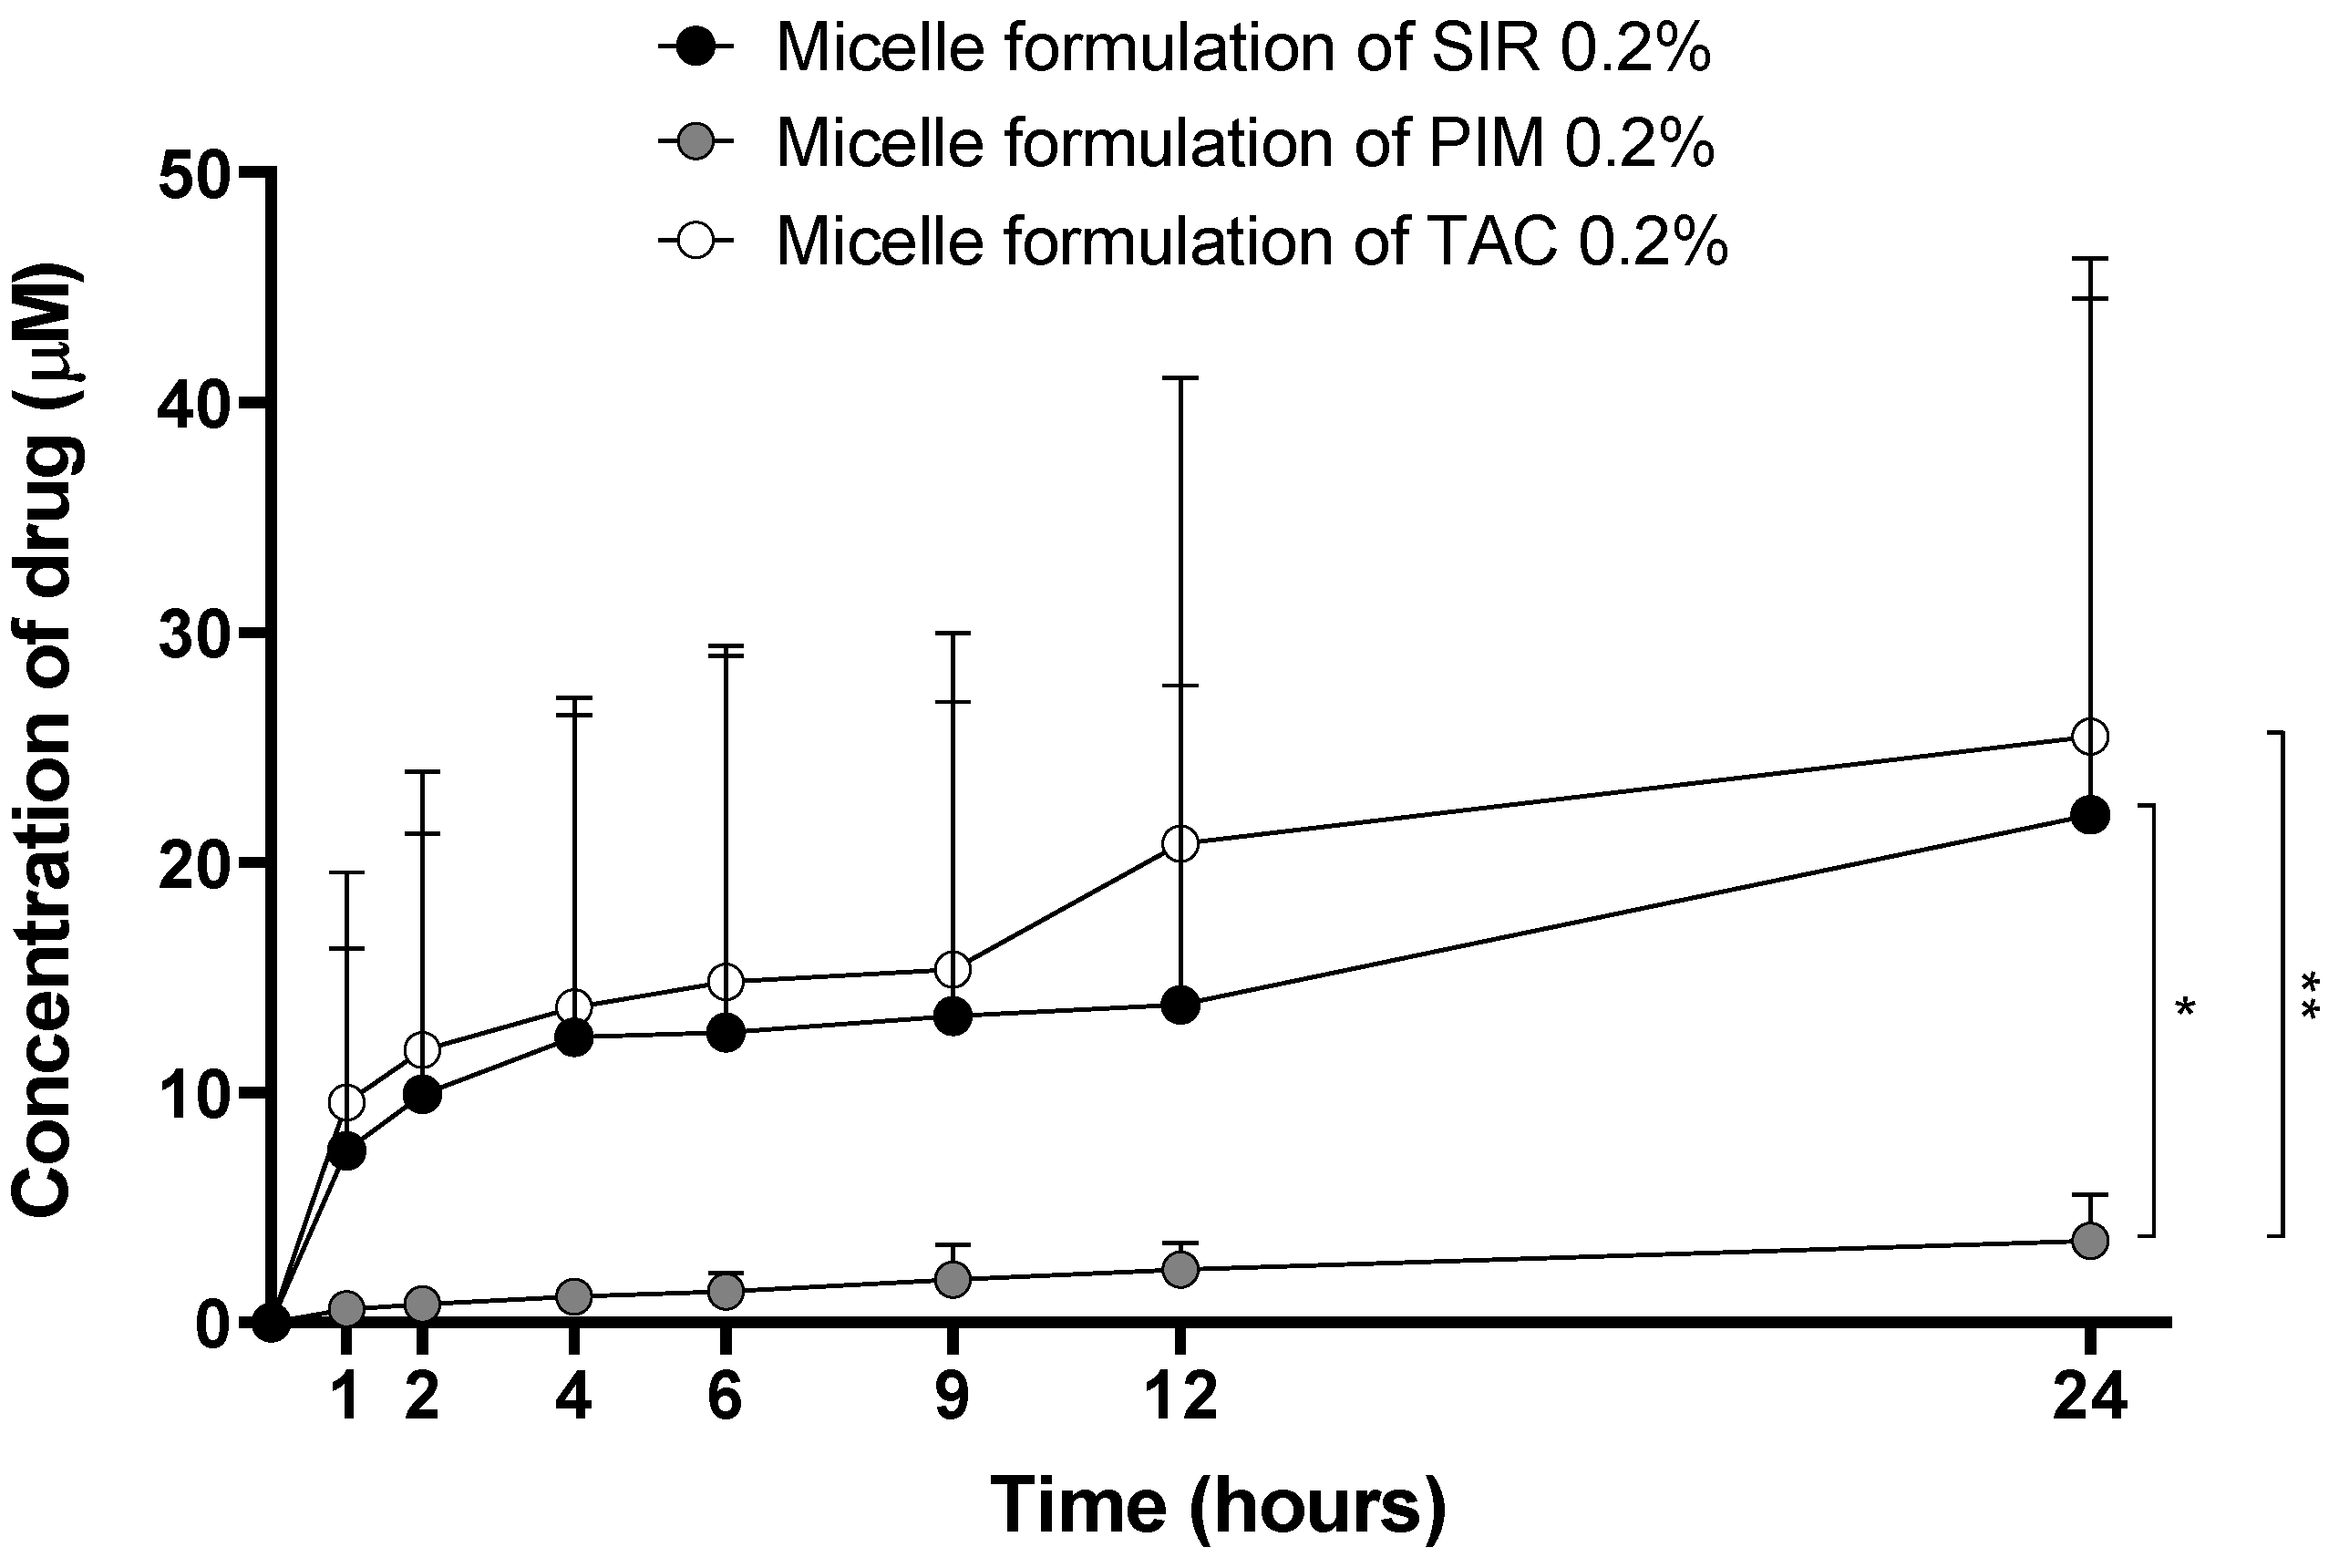
3.1.4. Drug Release Kinetics from the Micelles
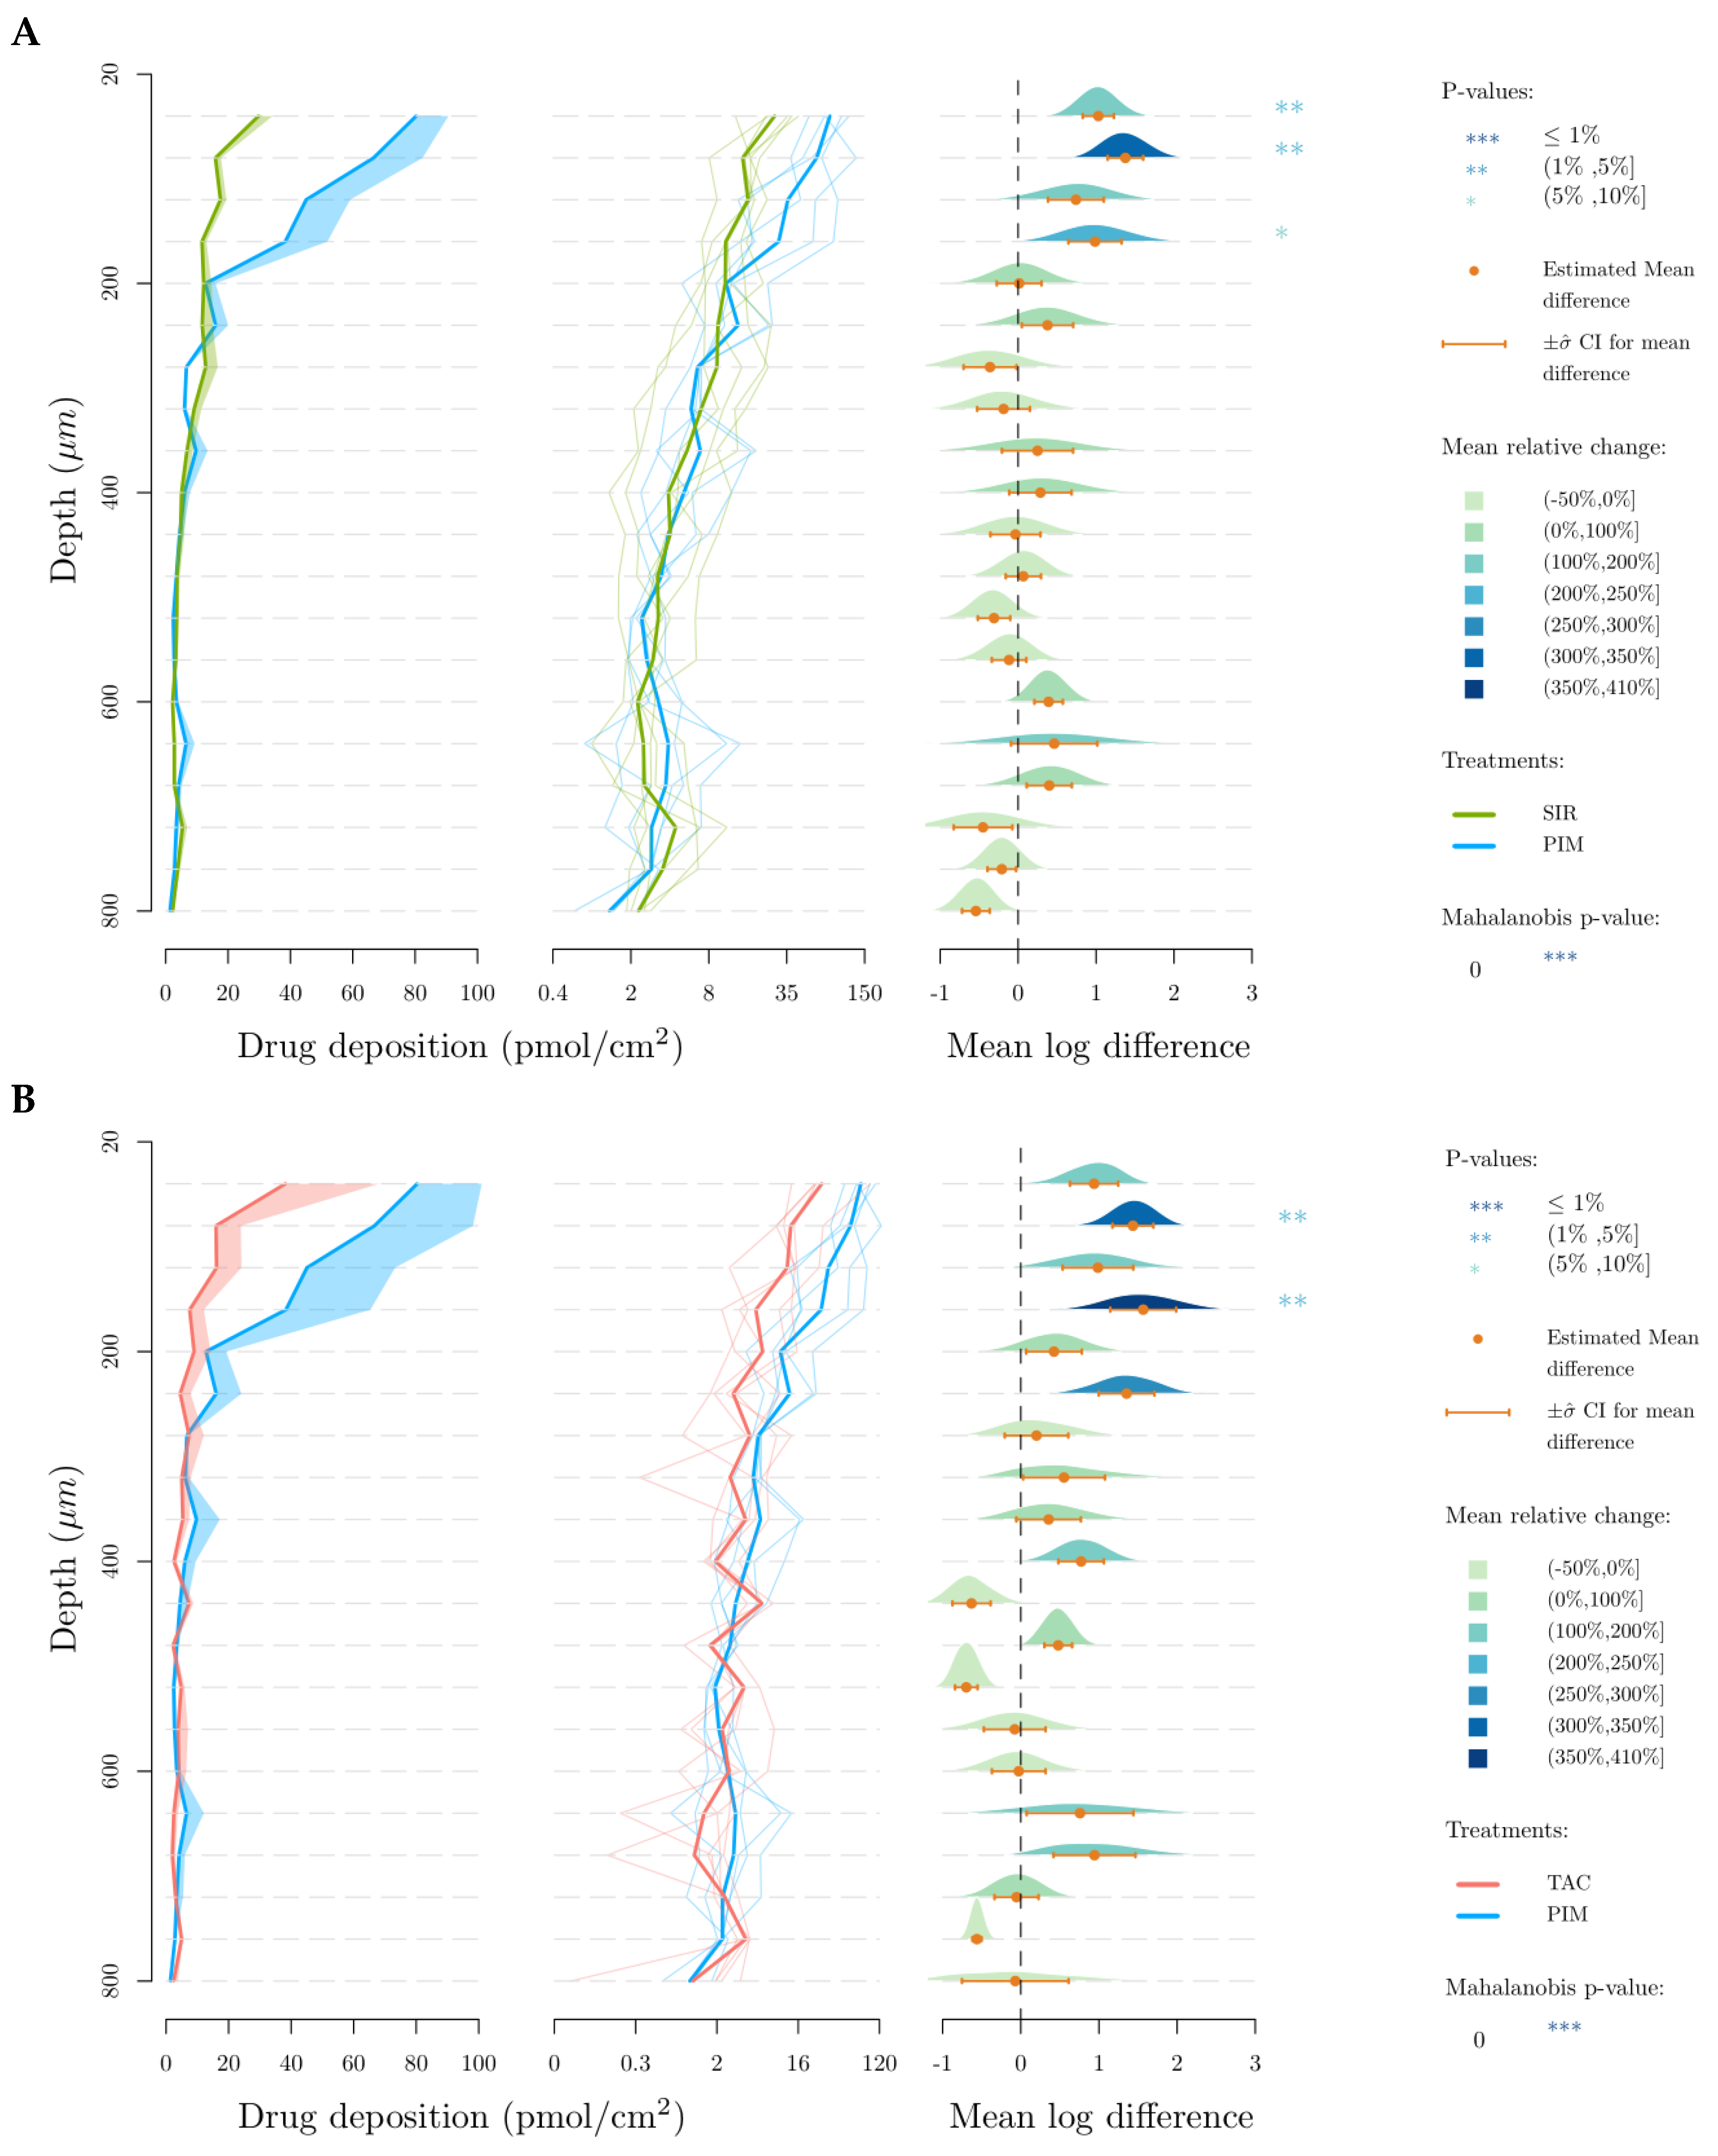
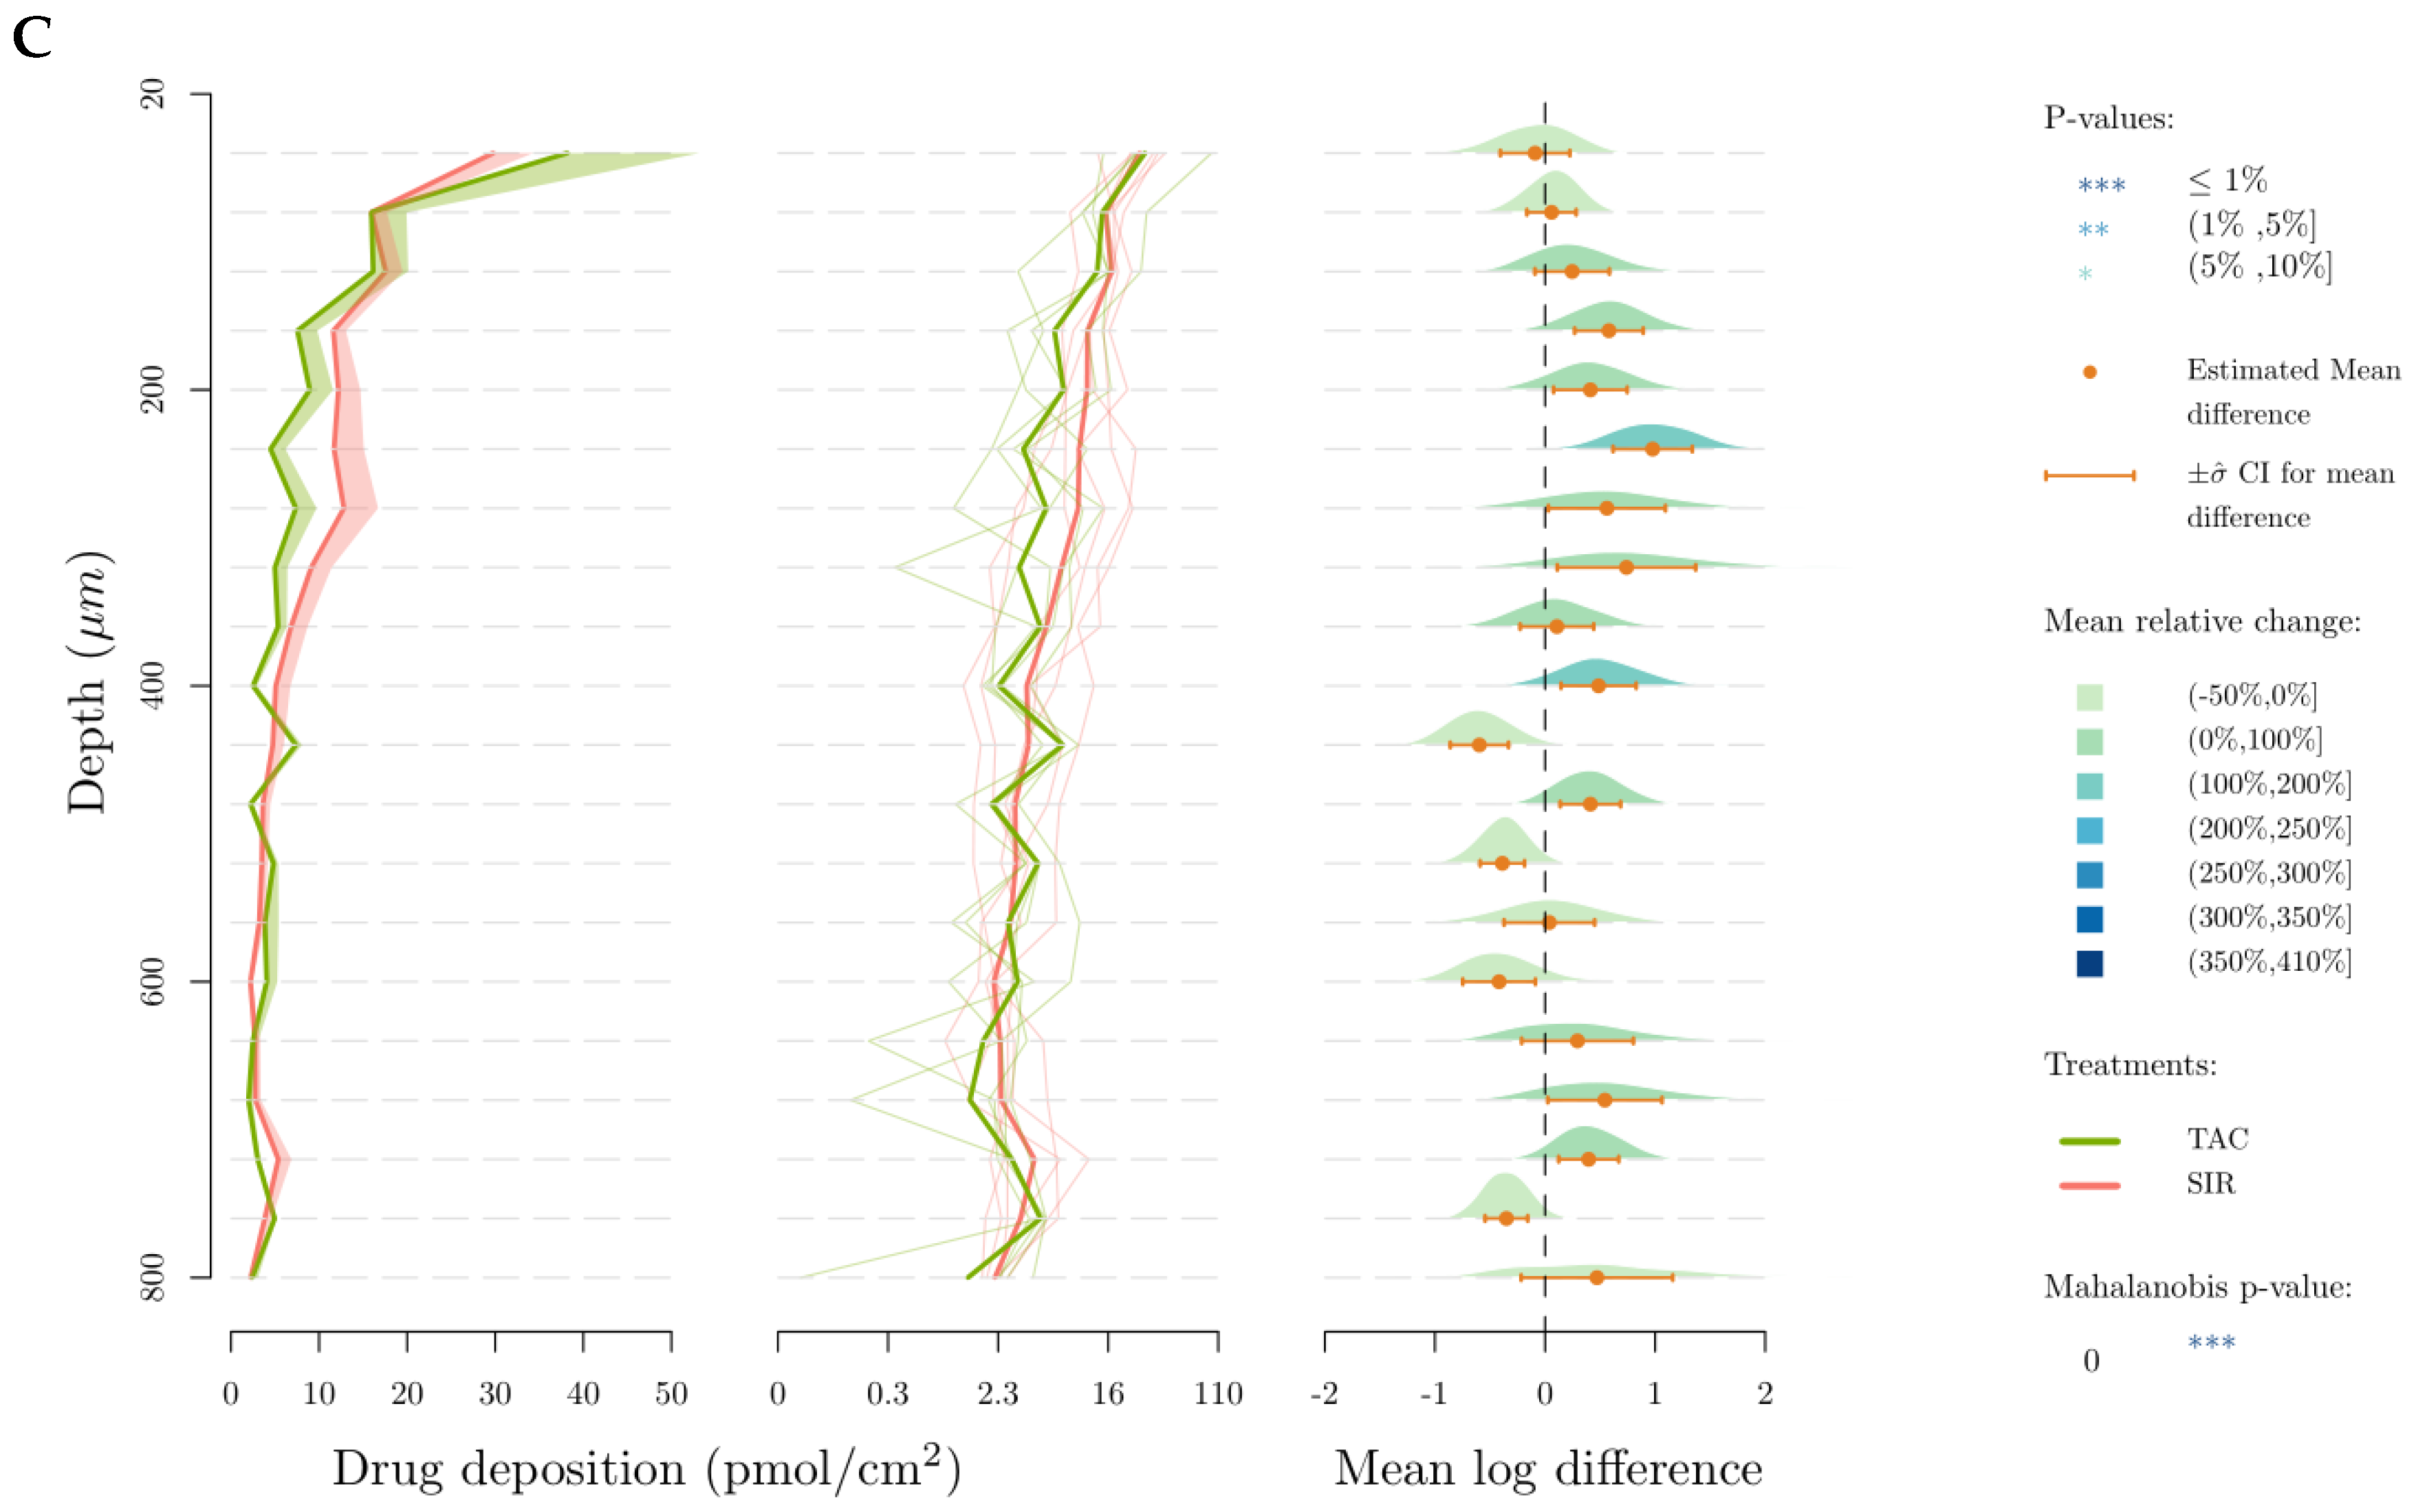
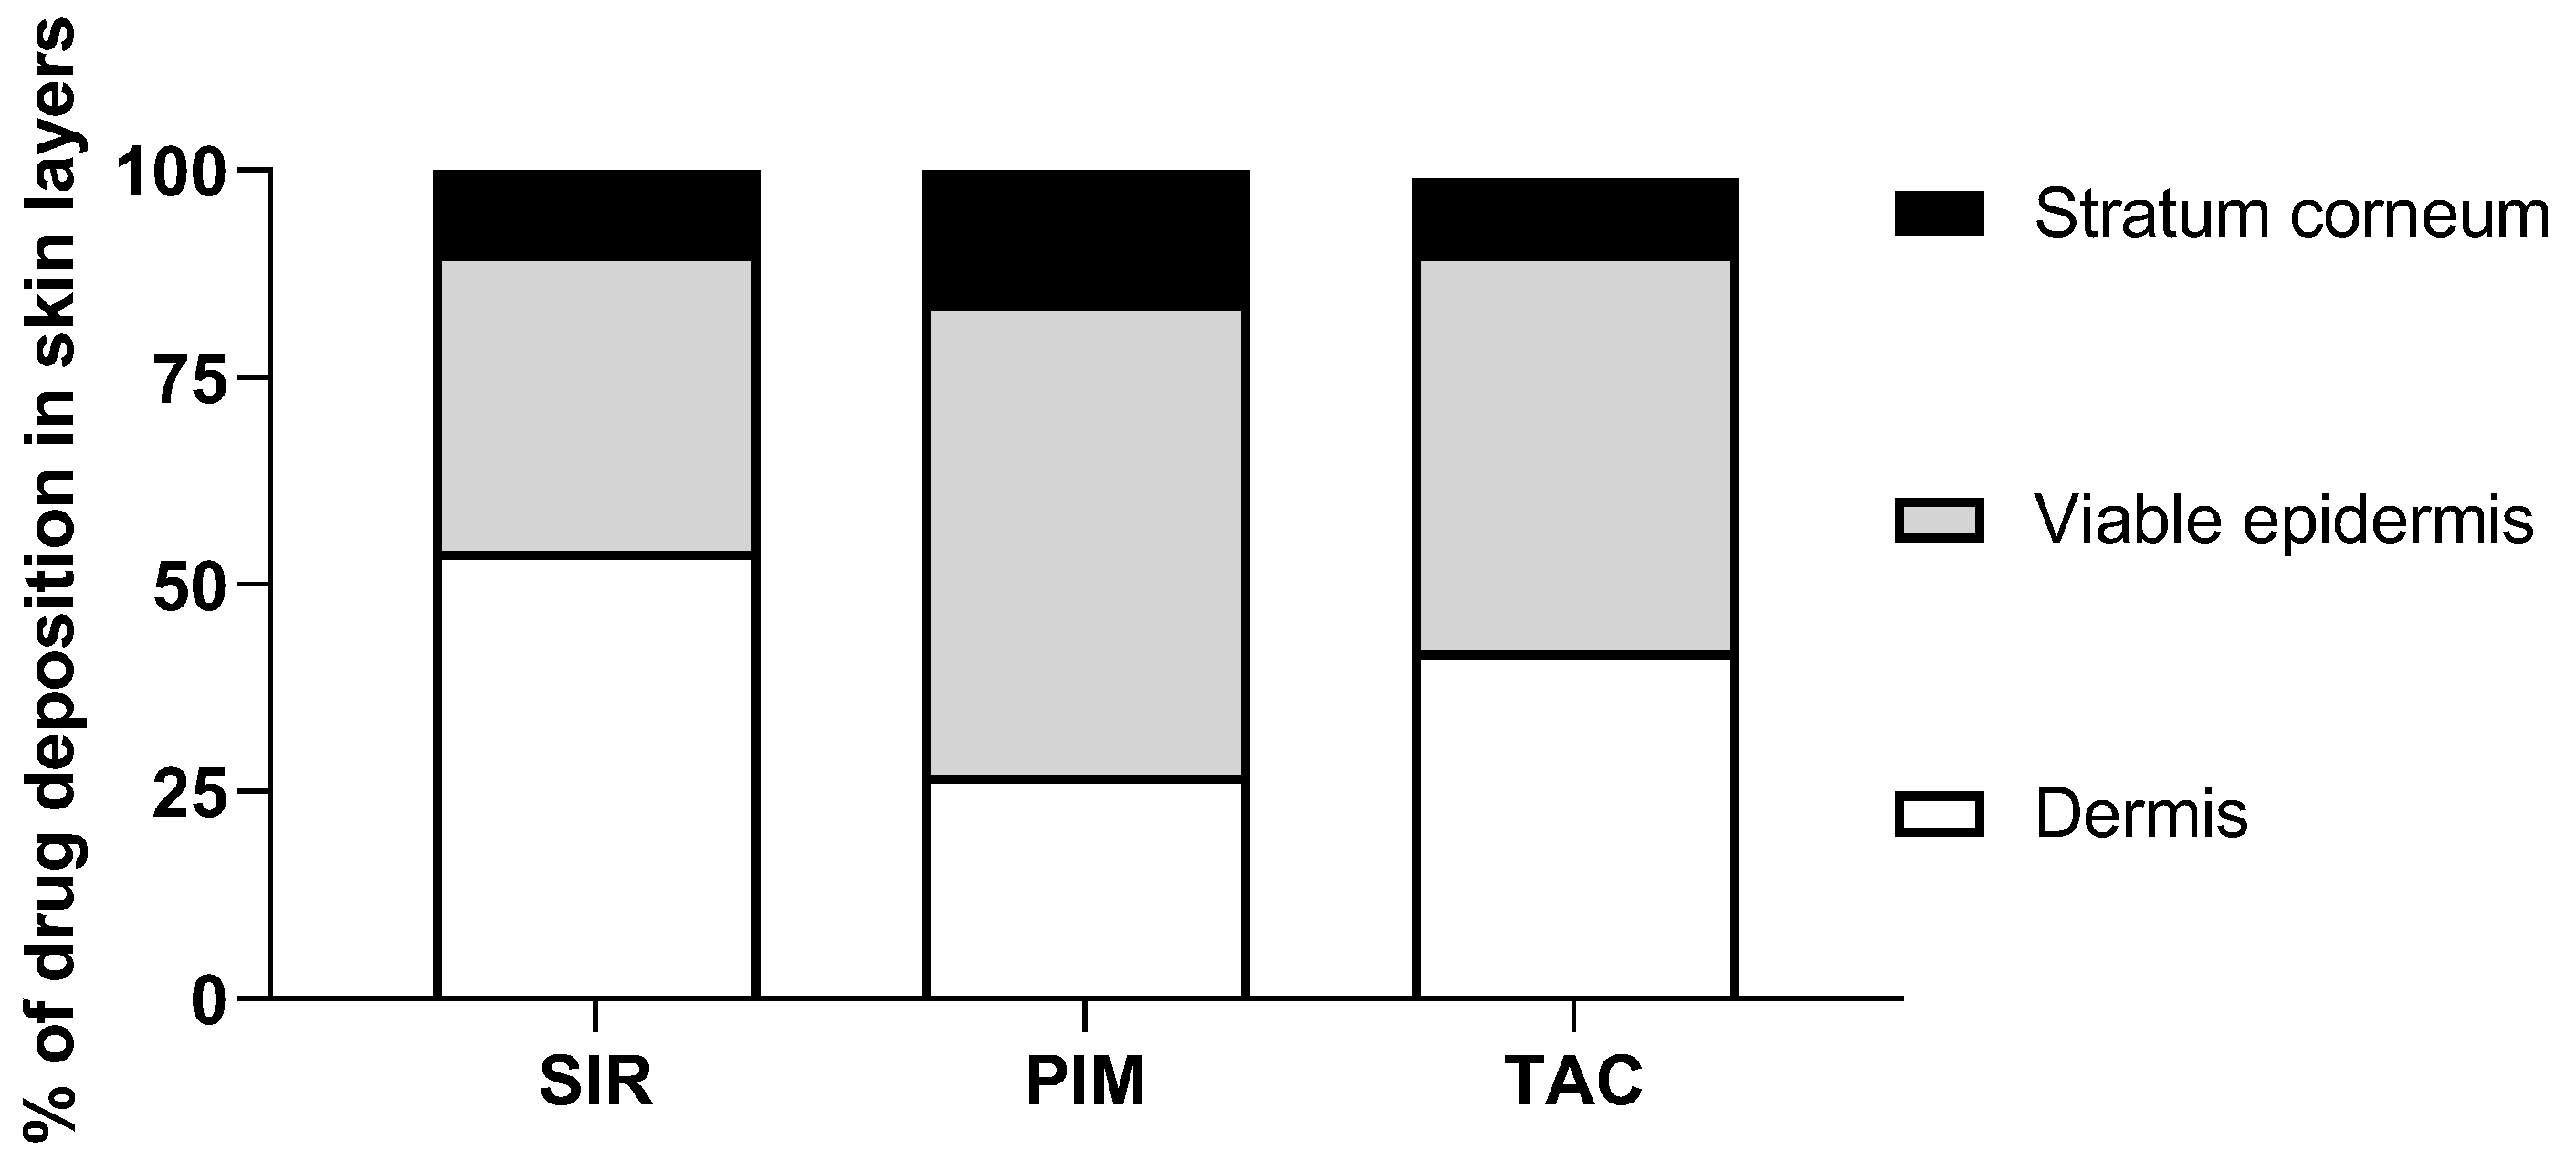
3.2. Skin Delivery from Micelle Formulations 0.2% under Infinite Dose Conditions
4. Discussion
4.1. Development of Micelle Formulations
4.1.1. Aqueous Solubility of the Drugs
4.1.2. Micelle Formulations Characterization
4.1.3. In Vitro Drug Release Profile
4.2. In Vitro Skin Delivery
4.3. Summary of the Comparative Studies
5. Conclusions
Supplementary Materials
Author Contributions
Funding
Data Availability Statement
Acknowledgments
Conflicts of Interest
References
- Bachhav, Y.G.; Mondon, K.; Kalia, Y.N.; Gurny, R.; Moller, M. Novel micelle formulations to increase cutaneous bioavailability of azole antifungals. J. Control. Release 2011, 153, 126–132. [Google Scholar] [CrossRef] [PubMed]
- Lapteva, M.; Mignot, M.; Mondon, K.; Moller, M.; Gurny, R.; Kalia, Y.N. Self-assembled mPEG-hexPLA polymeric nanocarriers for the targeted cutaneous delivery of imiquimod. Eur. J. Pharm. Biopharm. 2019, 142, 553–562. [Google Scholar] [CrossRef] [PubMed]
- Kandekar, S.G.; Singhal, M.; Sonaje, K.B.; Kalia, Y.N. Polymeric micelle nanocarriers for targeted epidermal delivery of the hedgehog pathway inhibitor vismodegib: Formulation development and cutaneous biodistribution in human skin. Expert Opin. Drug Deliv. 2019, 16, 667–674. [Google Scholar] [CrossRef]
- Bender, A.; Glen, R.C. Molecular similarity: A key technique in molecular informatics. Org. Biomol. Chem. 2004, 2, 3204–3218. [Google Scholar] [CrossRef] [PubMed]
- Alves, V.M.; Hwang, D.; Muratov, E.; Sokolsky-Papkov, M.; Varlamova, E.; Vinod, N.; Lim, C.; Andrade, C.H.; Tropsha, A.; Kabanov, A. Cheminformatics-driven discovery of polymeric micelle formulations for poorly soluble drugs. Sci. Adv. 2019, 5, eaav9784. [Google Scholar] [CrossRef] [PubMed]
- Bulusu, M.A.; Baumann, K.; Stuetz, A. Chemistry of the immunomodulatory macrolide ascomycin and related analogues. Prog. Chem. Org. Nat. Prod. 2011, 94, 59–126. [Google Scholar] [CrossRef]
- Campanero, M.A.; Cardenas, E.; Sadaba, B.; Garcia-Quetglas, E.; Munoz-Juarez, M.J.; Gil-Aldea, I.; Pazo, D.; Azanza, J.R.; Honorato, J. Therapeutic drug monitoring for sirolimus in whole blood of organ transplants by high-performance liquid chromatography with ultraviolet detection. J. Chromatogr. A 2004, 1031, 265–273. [Google Scholar] [CrossRef]
- Sierra-Paredes, G.; Sierra-Marcuno, G. Ascomycin and FK506: Pharmacology and therapeutic potential as anticonvulsants and neuroprotectants. CNS Neurosci. Ther. 2008, 14, 36–46. [Google Scholar] [CrossRef]
- Wolff, K.; Stuetz, A. Pimecrolimus for the treatment of inflammatory skin disease. Expert Opin. Pharm. 2004, 5, 643–655. [Google Scholar] [CrossRef]
- Stuetz, A.; Baumann, K.; Grassberger, M.; Wolff, K.; Meingassner, J.G. Discovery of topical calcineurin inhibitors and pharmacological profile of pimecrolimus. Int. Arch. Allergy Immunol. 2006, 141, 199–212. [Google Scholar] [CrossRef]
- Nikolova, N.; Jaworska, J. Approaches to Measure Chemical Similarity—A Review. QSAR Comb. Sci. 2003, 22, 1006–1026. [Google Scholar] [CrossRef]
- Bornhovd, E.; Burgdorf, W.H.; Wollenberg, A. Macrolactam immunomodulators for topical treatment of inflammatory skin diseases. J. Am. Acad. Derm. 2001, 45, 736–743. [Google Scholar] [CrossRef] [PubMed]
- Paine, M.F.; Leung, L.Y.; Lim, H.K.; Liao, K.; Oganesian, A.; Zhang, M.Y.; Thummel, K.E.; Watkins, P.B. Identification of a novel route of extraction of sirolimus in human small intestine: Roles of metabolism and secretion. J. Pharmacol. Exp. Ther. 2002, 301, 174–186. [Google Scholar] [CrossRef] [PubMed]
- Kalthoff, F.S.; Winiski, A.; Fichtinger, P.; Schwendinger, B.; Wang, S.; Weishaeupl, C.; Stuetz, A. Differential inhibition of primary versus preactivated T cells by pimecrolimus but not by tacrolimus in vitro. Int. Arch. Allergy Immunol. 2007, 142, 255–264. [Google Scholar] [CrossRef]
- Haemel, A.K.; O’Brian, A.L.; Teng, J.M. Topical rapamycin: A novel approach to facial angiofibromas in tuberous sclerosis. Arch. Derm. 2010, 146, 715–718. [Google Scholar] [CrossRef]
- Dill, P.E.; De Bernardis, G.; Weber, P.; Losch, U. Topical everolimus for facial angiofibromas in the tuberous sclerosis complex. A first case report. Pediatr. Neurol. 2014, 51, 109–113. [Google Scholar] [CrossRef]
- Ormerod, A.D.; Shah, S.A.; Copeland, P.; Omar, G.; Winfield, A. Treatment of psoriasis with topical sirolimus: Preclinical development and a randomized, double-blind trial. Br. J. Derm. 2005, 152, 758–764. [Google Scholar] [CrossRef]
- Rappersberger, K.; Komar, M.; Ebelin, M.E.; Scott, G.; Burtin, P.; Greig, G.; Kehren, J.; Chibout, S.D.; Cordier, A.; Holter, W.; et al. Pimecrolimus identifies a common genomic anti-inflammatory profile, is clinically highly effective in psoriasis and is well tolerated. J. Investig. Derm. 2002, 119, 876–887. [Google Scholar] [CrossRef]
- Kroft, E.B.; Erceg, A.; Maimets, K.; Vissers, W.; van der Valk, P.G.; van de Kerkhof, P.C. Tacrolimus ointment for the treatment of severe facial plaque psoriasis. J. Eur. Acad. Derm. Venereol. 2005, 19, 249–251. [Google Scholar] [CrossRef]
- Dahmana, N.; Mugnier, T.; Gabriel, D.; Favez, T.; Kowalczuk, L.; Behar-Cohen, F.; Gurny, R.; Kalia, Y.N. Polymeric micelle mediated follicular delivery of spironolactone: Targeting the mineralocorticoid receptor to prevent glucocorticoid-induced activation and delayed cutaneous wound healing. Int. J. Pharm. 2021, 604, 120773. [Google Scholar] [CrossRef]
- Quartier, J.; Lapteva, M.; Boulaguiem, Y.; Guerrier, S.; Kalia, Y.N. Polymeric micelle formulations for the cutaneous delivery of sirolimus: A new approach for the treatment of facial angiofibromas in tuberous sclerosis complex. Int. J. Pharm. 2021, 604, 120736. [Google Scholar] [CrossRef] [PubMed]
- Kandekar, S.G.; Del Rio-Sancho, S.; Lapteva, M.; Kalia, Y.N. Selective delivery of adapalene to the human hair follicle under finite dose conditions using polymeric micelle nanocarriers. Nanoscale 2018, 10, 1099–1110. [Google Scholar] [CrossRef] [PubMed]
- Dahmana, N.; Mugnier, T.; Gabriel, D.; Kaltsatos, V.; Bertaim, T.; Behar-Cohen, F.; Gurny, R.; Kalia, Y.N. Topical Administration of Spironolactone-Loaded Nanomicelles Prevents Glucocorticoid-Induced Delayed Corneal Wound Healing in Rabbits. Mol. Pharm. 2018, 15, 1192–1202. [Google Scholar] [CrossRef] [PubMed]
- Lapteva, M.; Moller, M.; Gurny, R.; Kalia, Y.N. Self-assembled polymeric nanocarriers for the targeted delivery of retinoic acid to the hair follicle. Nanoscale 2015, 7, 18651–18662. [Google Scholar] [CrossRef]
- Lapteva, M.; Santer, V.; Mondon, K.; Patmanidis, I.; Chiriano, G.; Scapozza, L.; Gurny, R.; Moller, M.; Kalia, Y.N. Targeted cutaneous delivery of ciclosporin A using micellar nanocarriers and the possible role of inter-cluster regions as molecular transport pathways. J. Control. Release 2014, 196, 9–18. [Google Scholar] [CrossRef]
- Lapteva, M.; Mondon, K.; Moller, M.; Gurny, R.; Kalia, Y.N. Polymeric micelle nanocarriers for the cutaneous delivery of tacrolimus: A targeted approach for the treatment of psoriasis. Mol. Pharm. 2014, 11, 2989–3001. [Google Scholar] [CrossRef]
- ICH. Validation of Analytical Procedures: Text and Methodology Topics Q 2 (R1). Available online: http://academy.gmp-compliance.org/guidemgr/files/Q2(R1).PDF (accessed on 28 October 2019).
- FDA. Guidance for Industry: Bioanalytical Method Validation. Available online: https://www.fda.gov/files/drugs/published/Bioanalytical-Method-Validation-Guidance-for-Industry.pdf (accessed on 28 October 2019).
- OECD. Guidance Document for the Conduct of Skin Absorption Studies. Available online: https://www.oecd-ilibrary.org/docserver/9789264078796-en.pdf?expires=1554124290&id=id&accname=guest&checksum=CA29912A7F5982B46C4F21EE93B66034 (accessed on 1 April 2019).
- Quartier, J.; Capony, N.; Lapteva, M.; Kalia, Y.N. Cutaneous Biodistribution: A High-Resolution Methodology to Assess Bioequivalence in Topical Skin Delivery. Pharmaceutics 2019, 11, 484. [Google Scholar] [CrossRef]
- Benjamini, Y.; Drai, D.; Elmer, G.; Kafkafi, N.; Golani, I. Controlling the false discovery rate in behavior genetics research. Behav. Brain Res. 2001, 125, 279–284. [Google Scholar] [CrossRef]
- Gou, S.; Monod, M.; Salomon, D.; Kalia, Y.N. Simultaneous Delivery of Econazole, Terbinafine and Amorolfine with Improved Cutaneous Bioavailability: A Novel Micelle-Based Antifungal “Tri-Therapy”. Pharmaceutics 2022, 14, 271. [Google Scholar] [CrossRef]
- Goddeeris, C.; Willems, T.; Houthoofd, K.; Martens, J.A.; Van den Mooter, G. Dissolution enhancement of the anti-HIV drug UC 781 by formulation in a ternary solid dispersion with TPGS 1000 and Eudragit E100. Eur. J. Pharm. Biopharm. 2008, 70, 861–868. [Google Scholar] [CrossRef]
- Bi, F.; Zhang, X.; Liu, J.; Yong, H.; Gao, L.; Liu, J. Development of antioxidant and antimicrobial packaging films based on chitosan, D-α-tocopheryl polyethylene glycol 1000 succinate and silicon dioxide nanoparticles. Food Packag. Shelf Life 2020, 24, 100503. [Google Scholar] [CrossRef]
- Koulouktsi, C.; Nanaki, S.; Barmpalexis, P.; Kostoglou, M.; Bikiaris, D. Preparation and characterization of Alendronate depot microspheres based on novel poly(-epsilon-caprolactone)/Vitamin E TPGS copolymers. Int. J. Pharm. X 2019, 1, 100014. [Google Scholar] [CrossRef] [PubMed]
- Emami, S.; Valizadeh, H.; Islambulchilar, Z.; Zakeri-Milani, P. Development and physicochemical characterization of sirolimus solid dispersions prepared by solvent evaporation method. Adv. Pharm. Bull. 2014, 4, 369–374. [Google Scholar] [CrossRef]
- Hu, X.; Lin, C.; Chen, D.; Zhang, J.; Liu, Z.; Wu, W.; Song, H. Sirolimus solid self-microemulsifying pellets: Formulation development, characterization and bioavailability evaluation. Int. J. Pharm. 2012, 438, 123–133. [Google Scholar] [CrossRef] [PubMed]
- Aggarwal, N.; Goindi, S.; Mehta, S.D. Preparation and evaluation of dermal delivery system of griseofulvin containing vitamin E-TPGS as penetration enhancer. AAPS PharmSciTech 2012, 13, 67–74. [Google Scholar] [CrossRef] [PubMed]
- Zhang, Z.; Tan, S.; Feng, S.S. Vitamin E TPGS as a molecular biomaterial for drug delivery. Biomaterials 2012, 33, 4889–4906. [Google Scholar] [CrossRef]
- Wehrlé, P. Pharmacie Galénique: Formulation et Technologie Pharmaceutique, 2nd ed.; Maloine: Paris, France, 2012. [Google Scholar]
- Chuang, S.Y.; Lin, Y.K.; Lin, C.F.; Wang, P.W.; Chen, E.L.; Fang, J.Y. Elucidating the Skin Delivery of Aglycone and Glycoside Flavonoids: How the Structures Affect Cutaneous Absorption. Nutrients 2017, 9, 1304. [Google Scholar] [CrossRef]
- Dumontet Mondon, K. Novel Micellar Systems for the Formulation of Poorly Water Soluble Drugs: Biocompatibility Aspects and Pharmaceutical Applications. Ph.D. Thesis, University of Geneva, Geneva, Switzerland, 2011. [Google Scholar]
- Yang, X.; Zhu, B.; Dong, T.; Pan, P.; Shuai, X.; Inoue, Y. Interactions between an anticancer drug and polymeric micelles based on biodegradable polyesters. Macromol. Biosci. 2008, 8, 1116–1125. [Google Scholar] [CrossRef]
- Sezgin, Z.; Yuksel, N.; Baykara, T. Preparation and characterization of polymeric micelles for solubilization of poorly soluble anticancer drugs. Eur. J. Pharm. Biopharm. 2006, 64, 261–268. [Google Scholar] [CrossRef]
- Takahashi, A.; Ozaki, Y.; Kuzuya, A.; Ohya, Y. Impact of core-forming segment structure on drug loading in biodegradable polymeric micelles using PEG-b-poly(lactide-co-depsipeptide) block copolymers. Biomed Res. Int. 2014, 2014, 579212. [Google Scholar] [CrossRef]
- Hussein, Y.H.A.; Youssry, M. Polymeric Micelles of Biodegradable Diblock Copolymers: Enhanced Encapsulation of Hydrophobic Drugs. Materials 2018, 11, 688. [Google Scholar] [CrossRef] [PubMed]
- Yang, L.; Alexandridis, P. Physicochemical aspects of drug delivery and release from polymer-based colloids. Colloid Interface Sci. 2000, 5, 132–143. [Google Scholar] [CrossRef]
- Trimaille, T.; Gurny, R.; Möller, M. Poly(hexyl-substituted lactides): Novel injectable hydrophobic drug delivery systems. J. Biomed. Mater. Res. Part A 2007, 80A, 55–65. [Google Scholar] [CrossRef] [PubMed]
- Torchilin, V. Structure and design of polymeric surfactant-based drug delivery systems. J. Control. Release 2001, 73, 137–172. [Google Scholar] [CrossRef]
- Soo, P.L.; Luo, L.; Maysinger, D.; Eisenberg, A. Incorporation and Release of Hydrophobic Probes in Biocompatible Polycaprolactone-block-poly(ethylene oxide) Micelles: Implications for Drug Delivery. Langmuir 2002, 18, 9996–10004. [Google Scholar] [CrossRef]
- Aliabadi, H.M.; Lavasanifar, A. Polymeric micelles for drug delivery. Expert Opin. Drug Deliv. 2006, 3, 139–162. [Google Scholar] [CrossRef] [PubMed]
- Press, A.T.; Ramoji, A.; vd Lühe, M.; Rinkenauer, A.C.; Hoff, J.; Butans, M.; Rössel, C.; Pietsch, C.; Neugebauer, U.; Schacher, F.H.; et al. Cargo–carrier interactions significantly contribute to micellar conformation and biodistribution. NPG Asia Mater. 2017, 9, e444. [Google Scholar] [CrossRef]
- Makhmalzade, B.S.; Chavoshy, F. Polymeric micelles as cutaneous drug delivery system in normal skin and dermatological disorders. J. Adv. Pharm. Technol. Res. 2018, 9, 2–8. [Google Scholar] [CrossRef]
- Raza, K.K.; Kumar, M.M.; Kumar, P.P.; Malik, R.R.; Sharma, G.G.; Kaur, M.M.; Katare, O.P.M. Topical delivery of aceclofenac: Challenges and promises of novel drug delivery systems. BioMed Res. Int. 2014, 2014, 406731. [Google Scholar] [CrossRef]
- Benson, H.A. Transdermal drug delivery: Penetration enhancement techniques. Curr. Drug Deliv. 2005, 2, 23–33. [Google Scholar] [CrossRef]
- Weiss, H.M.; Fresneau, M.; Moenius, T.; Stuetz, A.; Billich, A. Binding of pimecrolimus and tacrolimus to skin and plasma proteins: Implications for systemic exposure after topical application. Drug Metab. Dispos. 2008, 36, 1812–1818. [Google Scholar] [CrossRef] [PubMed]
- Meingassner, J.G.; Aschauer, H.; Stuetz, A.; Billich, A. Pimecrolimus permeates less than tacrolimus through normal, inflamed, or corticosteroid-pretreated skin. Exp. Derm. 2005, 14, 752–757. [Google Scholar] [CrossRef] [PubMed]
- Billich, A.; Aschauer, H.; Aszódi, A.; Stuetz, A. Percutaneous absorption of drugs used in atopic eczema: Pimecrolimus permeates less through skin than corticosteroids and tacrolimus. Int. J. Pharm. 2004, 269, 29–35. [Google Scholar] [CrossRef] [PubMed]
- Draelos, Z.; Nayak, A.; Pariser, D.; Shupack, J.L.; Chon, K.; Abrams, B.; Paul, C.F. Pharmacokinetics of topical calcineurin inhibitors in adult atopic dermatitis: A randomized, investigator-blind comparison. J. Am. Acad. Derm. 2005, 53, 602–609. [Google Scholar] [CrossRef]
- Bolzinger, M.-A.; Briançon, S.; Pelletier, J.; Chevalier, Y. Penetration of drugs through skin, a complex rate-controlling membrane. Curr. Opin. Colloid Interface Sci. 2012, 17, 156–165. [Google Scholar] [CrossRef]


| Parameters | SIR | PIM | TAC |
|---|---|---|---|
| Column | C8 2.5 μm, 2.1 × 50 mm | C18 2.5 μm, 2.1 × 100 mm | C18 2.5 μm, 2.1 × 100 mm |
| Mobile phase | (a) ACN and (b) Milli-Q water + 0.003% TFA (85:15 v/v) | (a) ACN and (b) Milli-Q water + 0.1% FA (95:5 v/v) | (a) ACN and (b) Milli-Q water + 0.1% FA (95:5 v/v) |
| Column temperature (°C) | 45 | 45 | 45 |
| Flow (mL/min) | 0.5 | 0.5 | 0.5 |
| Volume of injection (µL) | 5 | 5 | 5 |
| Wavelength (nm) | 278 | 210 | 210 |
| Retention time (min) | 0.48 | 0.80 | 0.66 |
| Limit of quantification (µg/mL) Limit of detection (µg/mL) | 3.0 1.0 | 5.0 1.6 | 2.0 0.7 |
| Parameters | SIR | SIR-D3 | PIM | TAC |
|---|---|---|---|---|
| Nature of parent ion | [M − H]− | [M − H]− | [M + NH4]+ | [M + NH4]+ |
| Parent ion (m/z) | 912.67 | 915.65 | 832.50 | 826.60 |
| Daughter ion (m/z) | 590.42 | 321.21 | 593.44 | 616.20 |
| Collision energy (V) | 36 | 40 | 30 | 40 |
| Cone voltage (V) | 60 | 52 | 60 | 50 |
| Capillary voltage (kV) | 3.6 | 3.0 | ||
| Source temperature (°C) | 150 | 150 | ||
| Desolvation temperature (°C) | 500 | 500 | ||
| Desolvation gas flow (L/h) | 1000 | 850 | ||
| Cone gas flow (L/h) | 0 | 0 | ||
| LM resolution 1 | 2.96 | 2.96 | ||
| HM resolution 1 | 15.00 | 15.00 | ||
| Ion energy 1 (V) | 0.3 | 0.3 | ||
| LM resolution 2 | 2.91 | 2.91 | ||
| HM resolution 2 | 15.24 | 15.24 | ||
| Ion energy 2 (V) | 0.6 | 0.6 | ||
| Limit of quantification (ng/mL) | 3.0 | / | 3.0 | 3.0 |
| Limit of detection (ng/mL) | 1.0 | / | 1.0 | 1.0 |
| Water | At TPGS Concentration (33 mM or 50 mg/mL) | Increase in Solubility | ||
|---|---|---|---|---|
| Drug solubility (µM) | SIR | 8.24 ± 0.22 | 1214.10 ± 123.50 | 147× |
| PIM | 0.17 ± 0.02 | 330.32 ± 31.22 | 1943× | |
| TAC | 0.20 ± 0.05 | 636.74 ± 73.45 | 3184× |
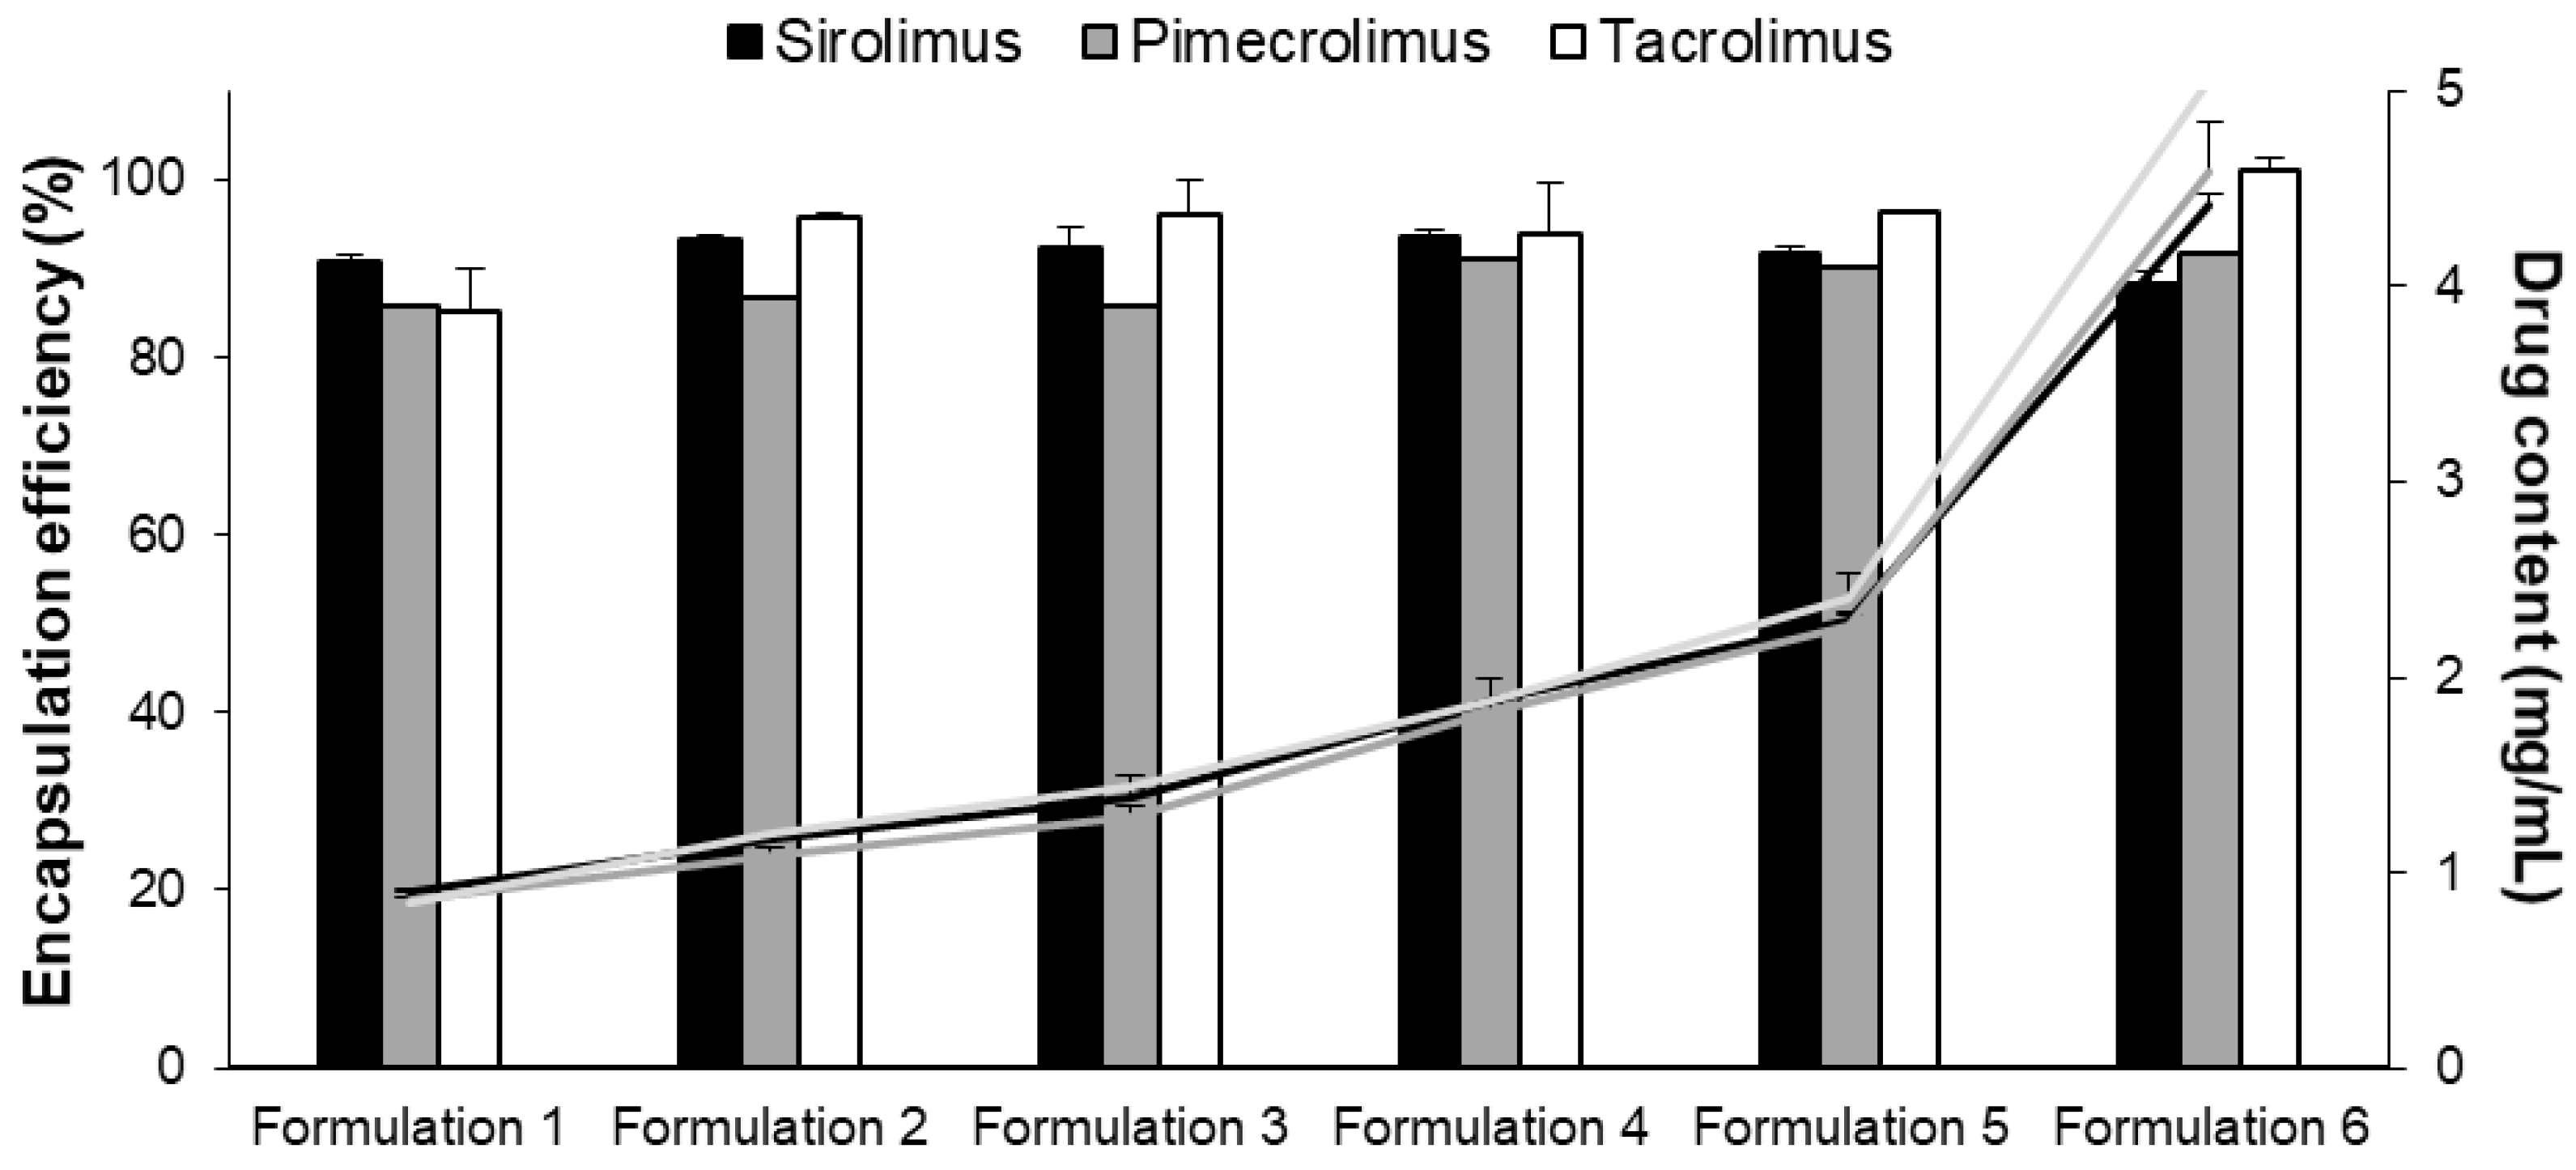
| Formulation | |||||||||
|---|---|---|---|---|---|---|---|---|---|
| Target TPGS Content (mg/mL) | Target Drug Content (mg/mL) | Target Drug Loading (mgDRUG/gTPGS) | Drug Loading (mgDRUG/gTPGS) | Incorporation Efficiency (%) | |||||
| SIR | PIM | TAC | SIR | PIM | TAC | ||||
| Formulation 1 | 50 | 1.00 | 20 | 18.1 ± 0.2 | 17.2 ± 0.0 | 17.0 ± 1.0 | 90.7 ± 0.9 | 85.8 ± 0.0 | 85.1 ± 5.1 |
| Formulation 2 | 50 | 1.25 | 25 | 23.3 ± 0.1 | 21.7 ± 0.0 | 23.9 ± 0.1 | 93.3 ± 0.4 | 86.7 ± 0.0 | 95.8 ± 0.5 |
| Formulation 3 | 50 | 1.50 | 30 | 27.7 ± 0.8 | 25.8 ± 0.0 | 28.9 ± 1.1 | 92.2 ± 2.6 | 85.9 ± 0.0 | 96.1 ± 3.7 |
| Formulation 4 | 50 | 2.00 | 40 | 37.5 ± 0.2 | 36.4 ± 0.0 | 37.6 ± 2.2 | 93.7 ± 0.6 | 91.0 ± 0.0 | 94.0 ± 5.5 |
| Formulation 5 | 50 | 2.50 | 50 | 45.8 ± 0.4 | 45.1 ± 0.0 | 48.2 ± 0.0 | 91.7± 0.8 | 90.2 ± 0.0 | 96.4 ± 0.1 |
| Formulation 6 | 50 | 5.00 | 100 | 88.4 ± 1.3 | 91.6 ± 0.1 | 101.0 ± 1.4 | 88.4 ± 1.3 | 91.6 ± 0.0 | 101.0 ± 1.4 |
| Sirolimus | Pimecrolimus | Tacrolimus | |
|---|---|---|---|
| MW | *** | ** | ** |
| logP | ** | *** | * |
| Solubility in water | *** | * | * |
| Solubility in aqueous solutions of TPGS | *** | * | ** |
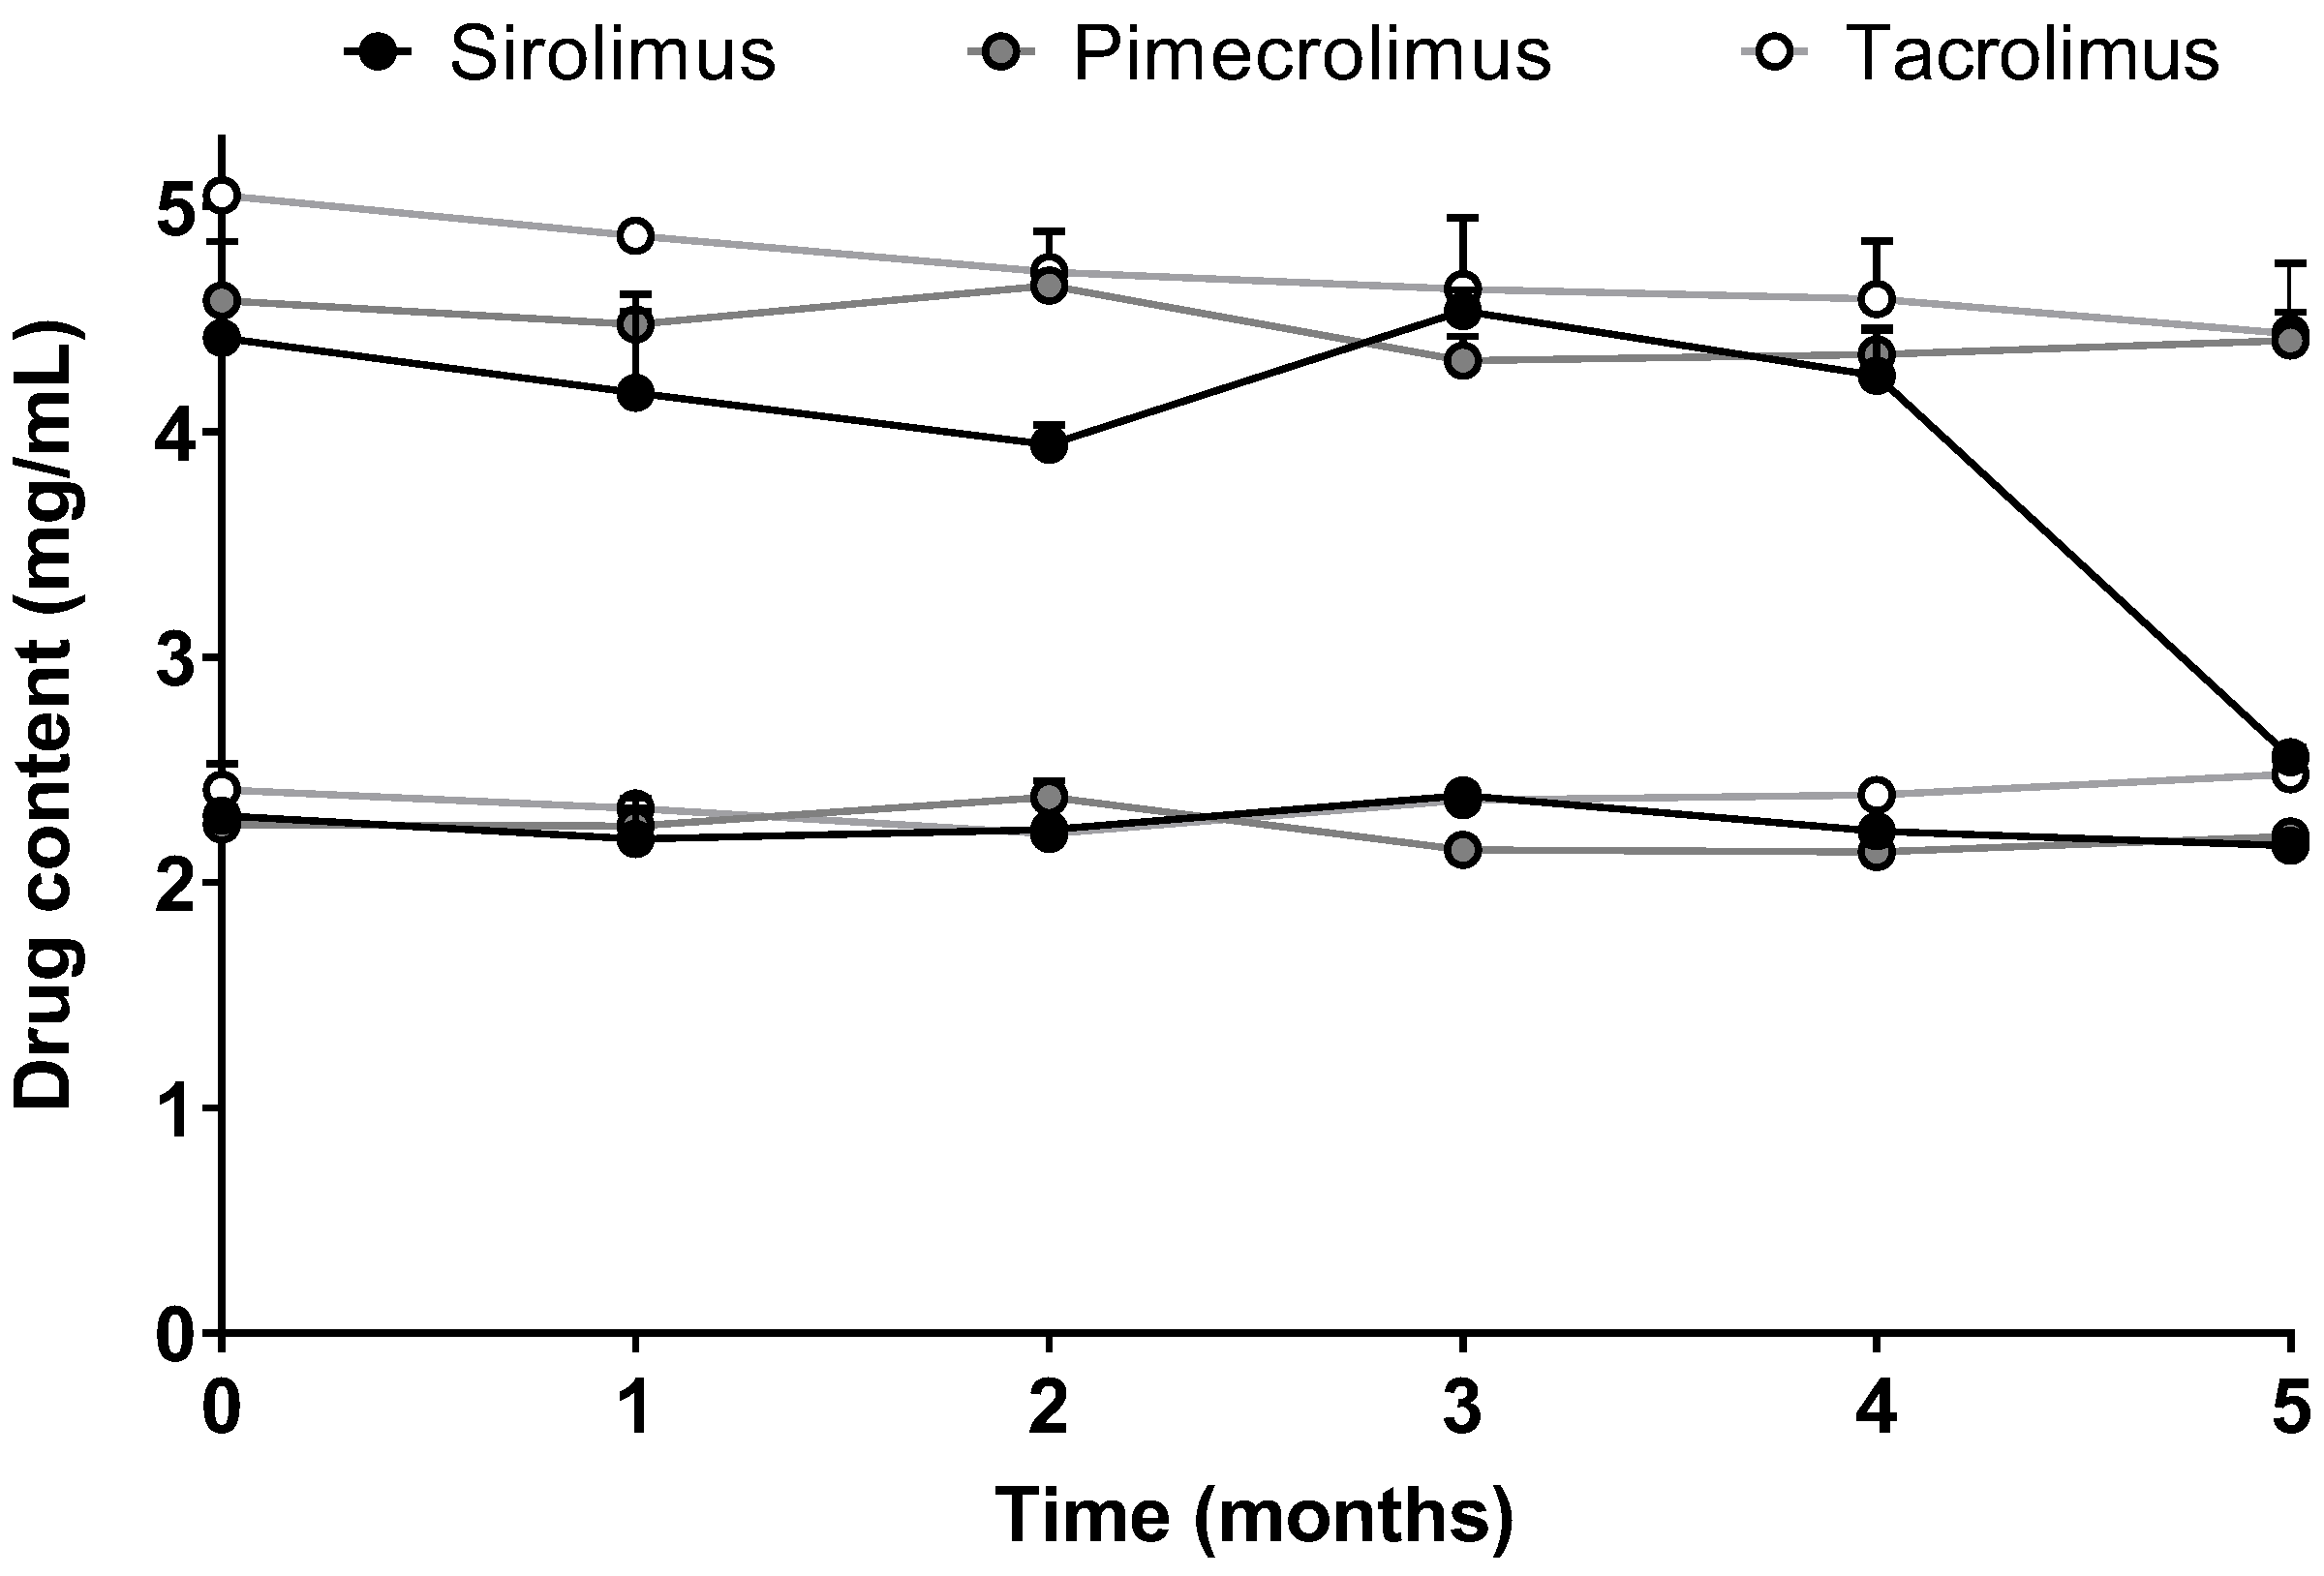
| Stability in micelle formulation | ** | *** | *** |
| In vitro drug release | *** | * | *** |
| Cutaneous drug delivery | * | *** | * |
Disclaimer/Publisher’s Note: The statements, opinions and data contained in all publications are solely those of the individual author(s) and contributor(s) and not of MDPI and/or the editor(s). MDPI and/or the editor(s) disclaim responsibility for any injury to people or property resulting from any ideas, methods, instructions or products referred to in the content. |
© 2023 by the authors. Licensee MDPI, Basel, Switzerland. This article is an open access article distributed under the terms and conditions of the Creative Commons Attribution (CC BY) license (https://creativecommons.org/licenses/by/4.0/).
Share and Cite
Quartier, J.; Lapteva, M.; Boulaguiem, Y.; Guerrier, S.; Kalia, Y.N. Influence of Molecular Structure and Physicochemical Properties of Immunosuppressive Drugs on Micelle Formulation Characteristics and Cutaneous Delivery. Pharmaceutics 2023, 15, 1278. https://doi.org/10.3390/pharmaceutics15041278
Quartier J, Lapteva M, Boulaguiem Y, Guerrier S, Kalia YN. Influence of Molecular Structure and Physicochemical Properties of Immunosuppressive Drugs on Micelle Formulation Characteristics and Cutaneous Delivery. Pharmaceutics. 2023; 15(4):1278. https://doi.org/10.3390/pharmaceutics15041278
Chicago/Turabian StyleQuartier, Julie, Maria Lapteva, Younes Boulaguiem, Stéphane Guerrier, and Yogeshvar N. Kalia. 2023. "Influence of Molecular Structure and Physicochemical Properties of Immunosuppressive Drugs on Micelle Formulation Characteristics and Cutaneous Delivery" Pharmaceutics 15, no. 4: 1278. https://doi.org/10.3390/pharmaceutics15041278
APA StyleQuartier, J., Lapteva, M., Boulaguiem, Y., Guerrier, S., & Kalia, Y. N. (2023). Influence of Molecular Structure and Physicochemical Properties of Immunosuppressive Drugs on Micelle Formulation Characteristics and Cutaneous Delivery. Pharmaceutics, 15(4), 1278. https://doi.org/10.3390/pharmaceutics15041278