Article

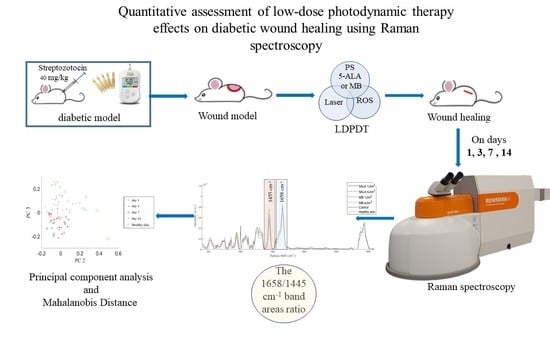
Quantitative Assessment of Low-Dose Photodynamic Therapy Effects on Diabetic Wound Healing Using Raman Spectroscopy

by
Hala Zuhayri
,
Alice A. Samarinova
,
Alexey V. Borisov
,
David A. Lopez Guardado
,
Houssain Baalbaki
,
Natalya A. Krivova
and
Yury V. Kistenev
*
Laboratory of Laser Molecular Imaging and Machine Learning, Tomsk State University, Lenin Ave. 36, Tomsk 634050, Russia
*
Author to whom correspondence should be addressed.
Pharmaceutics 2023, 15(2), 595; https://doi.org/10.3390/pharmaceutics15020595
Submission received: 27 November 2022 / Revised: 17 January 2023 / Accepted: 8 February 2023 / Published: 10 February 2023
(This article belongs to the Special Issue Tissue Diagnosis, Phototherapy and Drug Delivery)

Abstract

:
One of challenges that faces diabetes is the wound healing process. The delayed diabetic wound healing is caused by a complicated molecular mechanism involving numerous physiological variables. Low-dose photodynamic therapy (LDPDT) provides excellent results in rejuvenation and wound healing. In this study, the LDPDT effect on diabetic wounds in mice was studied using two photosensitizers, 5-aminolevulinic acid and methylene blue, and two laser dose expositions of 1 J/cm2 and 4 J/cm2 by Raman spectroscopy (RS). The latter was used as a noninvasive method, providing specific information about tissue state based on the fundamental vibrational modes of its molecular components. RS allows high spatial resolution acquisition of biochemical and structural information through the generation of point spectra or spectral images. An approach to in vivo quantitative assessment of diabetic wound healing state was developed. This approach is based on an application of the principal component analysis combined with the Mahalanobis metrics to skin Raman spectra, in particular, intensities of the amide I and CH2 bands.

Graphical Abstract

1. Introduction

Diabetes mellitus (DM) has become a global burden of over 537 million patients worldwide [1]. Diabetes is not only a huge health burden, but it also causes a considerable cost on society, economies, and health care systems. DM is a chronic, metabolic disease characterized by compromised insulin secretion, resistance to insulin action, or both, leading to hyperglycemia [2,3]. In fact, as a consequence of hyperglycemia, diabetic patients suffer from improper functioning of heart, blood vessels, eyes, kidneys, and nerves. The impairment of self-repairing abilities is one of diabetes’ major complications [4].
DM is one of the challenges of the wound healing process [5]. Normal wound healing is a dynamic and complex physiological process involving the following overlapping phases: hemostasis, inflammation, proliferation, and remodeling [6,7]. The wound healing begins with hemostasis achieved through vasoconstriction and platelet-mediated activation of the intrinsic clotting cascade, ending in formation of a fibrin clot [6,8]. The fibrin-plug formation is overlapped with the inflammatory phase, which is characterized by lymphocyte, macrophage, and neutrophil infiltration of the wound site to eliminate pathogens, bacteria, and cellular debris [5,9]. Then, the proliferative stage begins with the formation of new tissue, blood vessels (angiogenesis), and matrix construction to fill the wounded area [10]. Wound closure begins with the contraction caused by granulation tissue, keratinocyte migration, formation of extracellular matrix (ECM), and the appearance of myofibroblasts [2]. The role of the fibroblasts is wound-area reconstruction through collagen release. The final remodeling phase consists of collagen fibers’ reorganization, when collagen type III accumulating first is replaced by collagen type I, followed by the neovascularization, and then going back to the norm [11]. At this stage, the wound repair proceeds towards to the restoration of the physiologic structure of skin [12].
In diabetes, the wound healing is delayed due to the following biochemical processes. Inflammatory cytokines are present with high concentrations in the affected area, indicating the continued inflammatory response for a long period [13]. In addition to changes in growth factors, such as IGF-1 and TGFβ, insulin decreasing occurs in diabetics’ wound tissue [2,14]. Furthermore, there are many additional factors delaying the wound healing, including specific metabolic deficiencies, hypoxia caused by hemoglobin glycation, alteration of red blood cells’ membranes, and narrowing blood vessels [5,15]. The oxygen supply decreases in wounds, which, in turn, delays the healing.
Oxidative stress is caused by the increasing reactive oxygen species (ROSs) production. Oxidative stress occurs at the molecular level as a cellular event when ROS increasing overwhelms the antioxidant system’s defense capabilities. It varies in intensity, cell location, and time scale, i.e., acutely or chronically [16,17]. ROSs play a key role in the wound healing process. Increased ROS levels in chronic wounds may have a variety of deleterious effects. Oxidative stress may influence diabetic wound healing through skin injury, neuropathy, ischemic lesion, and topical infections [18].
Low-dose photodynamic therapy (LDPDT) is widely used in dermatology and produced worthwhile results in skin rejuvenation and wound healing [19,20,21]. LDPDT is based on a photosensitizer (PS) accumulation in tissues, following by irradiation with an appropriate wavelength light source, producing ROSs [22,23]. 5-aminolevulinic acid (5-ALA) and methylene blue (MB) are considered to be the most effective PSs [24,25,26]. The tissue response to photonic energy follows the Arndt–Schultz pattern, which is a suitable model to describe dose-dependent effects of a low-level laser therapy. A small stimulus may have no biological effect, a moderate stimulus may have a biostimulatory effect, and a large stimulus may have a bioinhibitory or even cytotoxic effect [27]. In accordance with the Arndt–Schultz pattern, it was found that the dose of 1 J/cm2 is close to the lower threshold of the biological response. Then, the curve begins to rise, which means an increase in the biological response with a laser light dose increase. The curve reaches the upper threshold around the laser light dose of 4 J/cm2, which is considered in the most effective range. After that, the biological response begins to decrease, indicating a bioinhibitory effect. Previous studies have found that the optimal light doses for LPDT are practically the same and should be in the 1–5 J/cm2 range [28,29,30,31].
Raman spectroscopy (RS) is a non-invasive and non-destructive method of chemical analysis with a high molecular specificity widely used for medical diagnostics and assessment of biophysical processes [32,33]. RS is a vibrational spectroscopic technique based on the registration of light inelastic scattering by molecules. The latter is caused by the excitation of a molecule by incident photons to a virtual energy state and the resultant energy loss (Stokes) or gain (anti-Stokes) occurs because of the interaction of light with vibrational modes associated with molecular chemical bonds. This shift in energy is associated with discrete vibrational modes of polarizable molecules, and thus, a sample biochemical composition can be discovered [34]. RS has been demonstrated to be a powerful analytical technique in the study of biological materials, and it allows for high spatial resolution acquisition of biochemical and structural information through the generation of point spectra or spectral images [35]. RS allows for in vivo tissue analysis, including skin [36,37]. The biological samples have a unique biological “fingerprints”, allowing understanding of the specimen, chemical structure, and composition [34]. The informative ranges in the Raman spectrum of a typical biological sample are as follows. The spectral range of 1500–1700 cm−1 is associated with bond vibrations of proteins. Phosphate groups’ spectral peaks are near 980, 1080, and 1240 cm−1. Carbohydrates are in the range of 470–1200 cm−1. High-frequency bond vibrations associated with CH, NH, and OH stretching in lipids and proteins can also be observed in the range of 2700–3500 cm−1 [38,39].
In oncology studies, RS was used to diagnose prostate, pancreatic, breast, and oral cancers [40]. In neurodegenerative diseases studies [41], RS was used to diagnose Alzheimer’s [42] and Parkinson’s [43] diseases. RS was applied in the analysis of metabolic syndrome [44], and metabolic changes during drug treatment in live cancer cells and tissues [45]. Correlations between Raman spectra in vivo data and X-ray microanalysis in vitro data in skin studies were established [46]. It is also worth noting the differences presented between the in vivo and in vitro Raman spectra of human skin. However, both forms represent a reliable technique to describe the information about the lipid and natural moisturizing factor content of the stratum corneum [47]. This evidence allows more profound research on the characterization of human skin, and, therefore, the research of wound healing process. So far, the description of such a process has been achieved from the study of skin wounds in rodents. It was shown how the RS technique in vivo can provide insight into the status of normally healing wounds [48]. The ability to study the burn-induced conformational changes of collagen using RS was confirmed [49]. Furthermore, RS has allowed for the development of other techniques, such as depth-sensitive RS, to perform depth-sensitive measurements [50]. In previous studies with RS, the difficulties facing wound healing, such as diabetes complications, were not studied, nor was a quantitative assessment and comparison of wound healing treatment using LDPDT with different parameters.
The aim of this work is to develop a quantitative method for in vivo assessment of the wound healing process in diabetics by RS, and to study the effect of LDPDT using topical application of two different photosensitizers: 5-ALA and MB and two laser doses of 1 J/cm2 and 4 J/cm2.

2. Materials and Methods

2.1. Type 1 Diabetes Model

Fifty laboratory CD1 six-seven-week-old male mice weighing 25–30 g obtained from the Department of Experimental Biological Models of the Research Institute of Pharmacology, TSC SB RAS, Tomsk, Russia were used in the study. The experimental protocol of this research was approved by the Bioethical Committee of Tomsk State University, Tomsk, Russia (Protocol No.4, 10.02.2021, registration No. 6). Before the experiments, the mice were kept for 7 days in standard conditions of a conventional vivarium with free access to food and water, and a 12/12 light regime, in a ventilated room at a temperature of 20 ± 2 °C and a humidity of 60%. All mice were weighed and randomly divided into control and experimental groups, each group consisted of 25 mice. For induction of type 1 diabetes mellitus in mice, the standard protocol of low dose Streptozotocin (STZ) injections was implemented [51]. Diabetic model was conducted in two weeks. The first stage was the treatment of mice with STZ for 5 days. In this stage, STZ (40 mg/kg) was injected daily after fasting 6 h, and water was replaced with 10% sucrose water. After completing the five-day STZ protocol, the 10% sucrose water was replaced by pure water.
The second stage was measuring the blood glucose level via a tail-vein using the “One Touch Flex” blood glucose monitoring system (Switzerland). For later-stage diabetes, after 15 and 25 days of last STZ injection, the process of blood glucose measurement was repeated. The results are presented in Table 1. The mice were weighed in all stages.

2.2. In Vivo Wound Model

Full-thickness wounds were created surgically on hind limbs as follows. The mice were anesthetized by isoflurane with concentration of about 3–4% for 10–15 min, using the Ugo Basile gas anesthesia system (Italy). After that, the mouse was put on a base with a mask on the nose with 0.5–1.5% isoflurane flow, as shown in Figure 1. The wound area was preliminarily depilated by Veet cream (France) and sterilized using chlorhexidine 20%. The right hind limb skin was folded and raised using forceps by medical scissors. The skin layers were completely removed and full-thickness excisional circular wounds (5 mm diameter) were created. The day of wound formation was denoted as day 0.

2.3. Wound Healing Assay

The wound area was estimated by measuring its larger A and minor B diameters by a digital caliper. The accuracy of the latter was 0.02 mm. This value makes an insignificant contribution to the measurement error and was not taken into account. The wound area S was calculated using the formula:
S = (A × B × π)/4.

2.4. Low Dose Photodynamic Therapy Protocol

While the mouse was under the influence of isoflurane, the photosensitizers 5-ALA and MB in saline solution were topically administered for 30 min on a wound, dripping 0.5–1 mL of PS solution directly on the wound. The wounds were irradiated by a CW AlGalnP laser (λ = 630 nm, p = 5 mW) with two doses: 1 J/cm2 or 4 J/cm2 for 3 min 45 s and 15 min, respectively. These doses were chosen, according to the Arndt–Schultz’s pattern of biological response [31], and they were used in the authors’ previous studies [7,21]. The diabetic mice were randomly divided into five groups; each group included 5 mice: the control group, LDPDT-5-ALA/1 J/cm2, LDPDT-MB/1 J/cm2, LDPDT-5-ALA/4 J/cm2, and LDPDT-MB/4 J/cm2 groups. The LDPDT procedure was conducted once immediately after wound formation. The experimental research design is presented in Figure 2.

2.5. Raman Spectroscopy

Raman spectra were measured by a Renishaw confocal Raman spectrometer (UK) with a spectral resolution of 1 cm−1, and spatial resolutions of 1 μm (horizontal) and <2 μm (vertical). A 785 nm diode laser with an output of 120 mW was used for Raman scattering excitation. An isoflurane-anesthetized mouse was placed on a foam pad. The leg with the wound was additionally fixed in the desired position. The leg was fixed in such a way that the surface of the wound was close to perpendicular to the incident laser radiation. After that, the mouse was placed in the working field of the spectrometer, as shown in Figure 3. The laser beam was focused on the sample through a 50 × lens. The Raman spectra wave-number was calibrated using a silicone sample before each test.
In the Raman spectrometer, the focus of laser radiation beam coincides with the focus of the camera. The motorized stage on which the mouse was placed was moved until a clear image of the tissue was seen in the camera (Figure 4).
After focusing on the selected point of the wound surface, the recording of spectral data began. Raman spectra were collected from 10 different spatial points superficially for each wound with a 10 s integration time and 3 accumulations. Spectra with a high cosmic noise were discarded.
Experiments were conducted on 3 mice out of 5 in each group, in order to maintain constant statistics throughout the duration of the experiments, and thus it is possible to replace mice whose condition worsens or dies due to anesthesia during the measurement operations. The measurements were conducted on days 1, 3, 7, and 14 after wound creation. In every experimental day, 30 Raman spectra were measured from 3 mice (10 spectra for every mouse at different points in the wound). For each group, 120 spectra for all control days were measured in the spectral range of 100–3500 cm−1. Healthy skin Raman spectra were measured in each group by 30 spectra (10 spectra for every mouse). For all groups, on all days were measured 750 spectra.

2.6. Data Preprocessing

Tissue Raman spectrum usually contains a fluorescence background. Although near-infrared excitation (785 nm) provides a low fluorescence background, it is still necessary to remove it due to its potential effect on the subsequent analysis accuracy. The background baseline was fitted by a polynomial of order 18 and subtracted using Renshaw WiRETM software (see Figure 5). Then, normalization was performed to bring all the spectra to the same interpretable scale. The spectra in each group were presented in terms of “mean ± standard deviation”.

2.7. Statistical Analysis

Principal Component Analysis (PCA) was applied to Raman spectra to explore the factors thought to be important in wound healing [52]. PCA uses orthogonal transformation of potentially correlated initial coordinates to linearly uncorrelated principal components (PC). PCA was carried out using the Matlab software.
Mahalanobis distance ( d M ) was used to assess a state of skin in relation to its ‘reference’ state. In this study, the latter corresponds to the healthy skin. The Mahalanobis distance between the i and j data samples is determined as follows:
d M x i , x j =   d x i , x j T C 1 d x i , x j
where x i is a Raman spectrum of the skin sample belonging to a studied state, x j is the same for healthy skin, C 1 is the variance–covariance matrix of a set S H of healthy skin Raman spectra. Let us denote by S a section of Raman spectra of skin belonging to a studied state. Then, the difference of the sets of Raman spectra of skin belonging to a studied state and to the reference state d S , S H can be calculated as follows:
d x i , S H = 1 N S H     j N S H d M x i , x j ,
d S , S H = 1 N S i N S d x i , S H ,
where x i , x j are the objects from sets S, SH, and N S ,   N S H are the sizes of the sets S, S H , respectively. The Student’s t-test was used to determine if there is a significant difference between the two independent datasets. The level of significance was set at p < 0.05.

3. Results

3.1. Characteristics of the Studied Mice

The following characteristics of studied mice were measured: weight, the blood glucose level, and water consumption, as presented in Table 1.
Water consumption difference between the control and diabetic groups was measured. During a week, the control group consumed (200 + 20) mL, while the diabetic group consumed (500 ± 75) mL.

3.2. Wound Area Analysis

The wound area was monitored at different time points on days 1, 3, 7, and 14. Wound digital images were captured as presented in Figure 6. A comparison was conducted between the control, LDPDT groups, and the healthy control group without diabetes that was in an early series of wound healing experiments. The enhancement of wound healing becomes apparent from the third day and evident from the seventh day after LDPDT. The 4 J/cm2 LDPDT groups exhibited a statistically significant effect on wound closure on days 3, 7, and 14 when compared to the control group.
The wound percentage was calculated as the value of a wound area to the initial one by the following equation:
[(S0 − S)/S0] × 100,
where S0 is the area of the wound at day 0 and S is the area of the current wound.
Different wound closure was observed in LDPDT groups compared to the control. The wound closure percentage was presented in Figure 7 in terms of “mean ± standard deviation”. These results reveal the gradual closure of the wound and the difference between studied groups. The Student’s t-test was used to check observed differences statistically, and p-value was calculated for all days in comparison with the control.

3.3. Raman Spectra of Healthy Skin

The healthy skin averaged Raman spectra are presented in Figure 8. In the 1200–1700 cm−1 range, the amide bands associated with amide bond vibrations in polypeptide chains are observed [53]. The amide I band is dominated by the ν(C=O) vibrations, while the amide III band by the ν(C–N) and δ(N–H) vibrations [54]. In the Raman spectrum of healthy skin, the peak of the amide I band was identified near 1658 cm−1, which primarily corresponds to collagen type I. Within the amide III band, two peaks of 1247 cm−1 and 1270 cm−1 are associated with proline-rich (non-polar) and proline-poor (polar) spectral fingerprints of the collagen [55]. The peak 1445 cm–1 is dominated by the vibrations of CH2 bending, which indicate the total dermal matrix protein content [49,56]. In the 1050–1150 cm−1 spectral range, the peaks are mainly assigned to the ν(C–C) modes associated with lipid components [57]. Spectral features in the 450–1050 cm−1 spectral range were attributed to amino acids: 1003 cm−1 (phenylalanine), 936 cm−1 (proline), 877 cm–1 (hydroxyproline, tryptophan), 854 cm−1 (proline, tyrosine), and 755 cm−1 (tryptophan) [54,58]. In the 2730−3160 cm−1 spectral range, peaks correspond to the −CH stretching, which indicates relative quantities of total protein and lipid content [48,59].

3.4. Raman Spectra of Skin Wounds

The average Raman spectra of skin wounds in all groups on observation days and healthy skin are presented in Figure 9.
As mentioned above, the peak 1445 cm−1 is dominated by the CH2 associated with the total dermal matrix protein content, while the peak 1658 cm−1 is dominated by amide I associated with collagen content. The 1658/1445 cm−1 band areas ratio gives information on collagen content, which is an important factor in wound healing [60]. The 1658/1445 cm−1 band areas ratio was calculated using Gaussian peak fitting (see Figure 10). Thus, an increase in collagen content is indicated by a larger value of this ratio. The differences were observed between the control, LDPDT groups, and healthy skin on day 14. The highest collagen content was found in LDPDT 4 J/cm2 groups.
The Student’s t-test was used to check observed differences statistically, and p-values were calculated for all data in comparison with healthy skin, for 15 measurements for each sample, as presented in Table 2.
p-values for all data were lower than the selected significance level (0.05), except the control group on day 14, which seems to be caused by data random variability. It means that there are essential differences between groups. The 1658/1445 cm−1 band areas ratio is shown from the Table 2 to have a negative correlation with wound healing stage. The biochemical origin of this will be discussed below.
Differences in Raman spectra were estimated by subtracting the healthy skin mean Raman spectrum from skin Raman spectra for other groups (see Figure 11). In order to study the differences in more detail, the spectra were split into three spectral regions, where differences were observed: the first region corresponds to the 1020–1140 cm−1 range, the second region corresponds to the 1200–1750 cm−1 range, and the third one is in the 2700–3000 cm−1 range (see Figure 12, Figure 13 and Figure 14, respectively).

3.5. Principal Component Analysis

PCA was applied to the wounds where Raman spectra related to the following spectral ranges: 600–800 cm−1, 1020–1140 cm−1, 1200–1370 cm−1, 1390–1500 cm−1, 1570–1750 cm−1, 1200–1750 cm−1, and 2800–3000 cm−1 to visualize the changes in skin chemical content from a point of view of distinguishing wound state in studied groups. PC2 and PC3 of Raman spectra in the range of 2800–3000 cm−1 were shown to be the most effective in wound healing process control. It allows distinguishing groups and days of observation (see Figure 15). For example, PC2 and PC3 of the wound Raman spectra in the range 2800–3000 cm−1 in 5ALA 1 J/cm2, 5ALA 4 J/cm2, and MB 4 J/cm2 groups at day 14 were closely clustered to the healthy skin group. The situation on days 1 and 3 is not so obvious. Similar results were not observed for other spectral sub-bands from 400 to 2800 cm−1.
To calculate the Mahalanobis distance, the PCs space was scaled, so that, in the PCs subspace, the healthy group was inside the area with a radius r calculated using the following formula:
r = σ 2 2 + σ 3 2 ,
where σ 2 and σ 3 are standard deviations for the PC2 and PC3 coordinates of the healthy group samples, respectively [61]. To simplify calculating the distance, the PCs space was normalized so that the radius r was equal to √2. After scaling PCs space, the Mahalanobis distances between distributions of healthy skin and other groups’ Raman spectra PCs were calculated using Equations (2a) and (2b). Table 3 presents the Mahalanobis distance in the PC2–PC3 space between the healthy skin and 5ALA 1 J/cm2, 5ALA 4 J/cm2, MB 1 J/cm2, MB 4 J/cm2, and the control groups corresponding to the Raman spectra from 2800 to 3000 cm−1 range on days 1, 3, 7, and 14 after wounding. On day 14, this distance decreases significantly compared to days 1, 3, and 7, and the 5-ALA 4 J/cm2 group is the closest to the healthy skin group.

4. Discussion

A diabetes model has been created in mice using low doses of Streptozotocin injections. The wound healing process in the control and LDPDT groups was studied on days 1, 3, 7, and 14 after wounding. The difference between groups in wound size was found on day 14 by visual observation (see Figure 6). It was also confirmed by the wound closure percentage calculation (see Figure 7). As mentioned above, according to the Arendt–Schultz pattern, there is an interval of light dose for a positive biological response on a low-level laser therapy. In fact, LDPDT has to act similarly, with the difference that in LDPDT, there is a specific targeting to cells accumulating a PS [22].
From the presented results, it can be concluded that LDPDT 4 J/cm2 groups have a positive effect on the diabetic wound healing process, and therefore, the dose 4 J/cm2 is in the effective range of biological response. It is interesting that the wound healing rate was higher for the non-diabetic control group compared to LDPDT 1 J/cm2 diabetics groups and lower compared to LDPDT 4 J/cm2 groups. While the statistical difference was smaller between LDPDT 1 J/cm2 groups and the diabetic control, it can be said that the dose of 1 J/cm2 is close to the lower threshold for diabetic wound LDPDT.
The Raman spectra of wounds are dominated by the vibrational bands of skin structural proteins, amino acids, and lipids. Both position and intensity changes are observed in certain Raman spectra bands. For example, the wounds Raman spectra had significant peaks in the fingerprint spectral region of collagen.
According to Figure 11, the control group is unique in its behavior: the decrease in the 1658/1445 cm−1 band areas ratio indicates an impaired collagen deposition in wounds that is classified as “impaired healing wounds”. As for the LDPDT groups, they show an increasing tendency in the collagen content, and it is evidence of LDPDT’s positive role in the wound healing process. On day 14, the group 5ALA-4 J/cm2 shows the highest 1658/1445 cm−1 band areas ratio, that indicates better healing. In addition, the healthy group without diabetes also showed a tendency in the collagen content.
In the 1020–1140 cm−1 spectral range, there are bands associated with phosphate groups, phospholipids, and the C–C stretch of proline [57]. On day 3, these bands’ intensities in the control group wounds are higher compared to the healthy skin, as shown in Figure 12. On the other hand, these bands’ intensities in LDPDT 5-ALA groups are slightly different from the healthy skin, while the bands’ intensities of skin in LDPDT MB groups are lower compared to the healthy skin.
The difference is noticed by comparison between the LDPDT MB groups and the control. Based on this, it can be concluded that LDPDT with MB has effects on phosphate groups, phospholipids, and proline content. Phospholipids are the major targets sensitive to radicals and ROSs [62], which can be generated by LDPDT [23,63]. Lipid peroxidation occurs as the result of hydroxyl radical action, and lipid hydro-peroxides are produced that affect the structure and function of cell membrane and can be harmful to cells. They may also participate in redox reactions that can mitigate the negative effects of the injury [62]. The biological activity of phospholipids and their structural functions are drastically altered by fatty acids oxidation. Oxidation converts oxidized phospholipids (OxPLs) into markers of “modified-self” type. These markers are recognized by soluble and cell-associated receptors of innate immunity, including scavenger receptors, natural (germ line-encoded) antibodies, and C-reactive protein, thus directing removal of senescent and apoptotic cells or oxidized lipoproteins. The functional significance of OxPL accumulating during acute inflammation is not well understood yet. Products of lipid peroxidation are regarded as toxic compounds inducing tissue damage and initiating inflammation. However, under certain conditions, OxPLs also demonstrate tissue-protective and anti-inflammatory activities. OxPLs cause a variety of positive and negative inflammatory responses and, as a consequence, may have varying and context-dependent effects on the inflammatory pathway. Therefore, OxPL accumulation is a characteristic of various types of inflammatory reactions. OxPL’s inhibition of toll-like receptors and the oxidative blast may act as negative feedback, limiting activation of antibacterial mechanisms and reducing host tissue damage [64]. The nature of the effect of reduced phospholipids on wound healing requires further studies.
According to Figure 13, the 1200–1750 cm−1 spectral range is basically associated with the amides and CH2. The essential difference between the control and LDPDT groups is observed in the 1200–1300 cm−1 spectral range near the positions of the amide III bands, which are also characteristic bands associated with polypeptide chains, vibrations of C–N stretching and N–H bending [49]. Amide III is directly related to the structural configuration of collagen [65] associated with wound healing. On days 1, 3, 7, and 14, the wounds’ Raman spectra in the control group are lower than the LDPDT groups’ Raman spectra. On day 14, the LDPDT groups’ wound Raman spectra are close to the healthy skin Raman spectrum (in PC space). The differences in the wound Raman spectra between the control and LDPDT groups were established in the 1300–1750 cm−1 range, which is dominated by the CH2 and amide I at 1445 and 1658 cm−1, respectively. As previously mentioned, the 1658/1445 cm−1 band areas ratio is associated with collagen content.
The 2700–3000 cm−1 spectral range corresponds to the CH group, which indicates relative quantities of total protein and lipid content [48]. Lipids play an important role in many cellular mechanisms relevant to the wound healing process, but not all the lipid biochemistry processes are yet well understood [66].
Diabetes is a common endogenous cause of lipid metabolism disorders [67,68,69]. Diabetes-related changes in lipid metabolism and signaling may be attributed to a significant delay in diabetic wound healing [66]. Diabetic wounds are characterized by a high inflammatory status. Leukotrienes are a major factor in the recruitment of inflammatory cells. Diabetic mice have been demonstrated to produce higher levels of leukotrienes in the skin correlating with larger non-healing wounds, excessive neutrophil migration, and uncontrolled collagen deposition [70]. The leukotrienes are lipid mediators belonging to a large family of eicosanoids. They are generated from arachidonic acid and essential eicosapentaenoic acid [71]. Arachidonic acid is present in the phospholipids of the cellular membrane. It has peaks at 2862 cm−1, 2886 cm−1, and 2923 cm−1 related to νs(=CH2), νas(=CH2), and νs(=CH3), respectively [72]. From the above and Figure 14, it can be said that the control group is in an inflammatory state because it has a higher Raman spectra intensity associated with leukotrienes, delaying wound healing. In LDPDT groups, this factor is less compared to the control. Still, there is a need to study in more detail the role of lipids in wound healing processes.
In the initial stage of wound healing, an early provisional matrix is formed, which it is a fibrin-rich polymer with interspersed, cross-linked plasma fibronectin [73]. It can explain the decrease of the Mahalanobis distance on day 3 for LDPDT-MB groups (see Table 3). Due to overlapping wound healing stages, it is a possible reason why this behavior was not observed in the other groups. In later stages, the early provisional fibrin-rich matrix is replaced. Fibroblasts are the main cell type responsible for replacing the provisional fibrin-rich matrix with a more substantial granulation tissue [8]. Fibroblasts degrade the provisional matrix by producing MMPs and replace it with a granulation tissue rich in fibronectin and immature collagen [74]. This granulation tissue acts as a scaffold for the migration and differentiation of wound cells, regulates cell adhesion dynamics, and provides the crucial ECM template for ensuring collagen deposition [75]. Fibroblasts begin to activate in the wound site on days 2–5 after wounding as the inflammatory phase is ended and their numbers peak at one to two weeks post-wounding. By the end of the first week, fibroblasts are the main cells in the wound [76].
LDPDT plays an important role in the stimulation of fibroblast proliferation, and thus, wound healing. In some studies, an increase in fibroblasts has been seen after LDPDT of chronic wounds compared to the control group [77]. ROSs facilitated wound healing by stimulating fibroblast proliferation and migration, resulting in the development of ECM, keratinocyte growth and migration, and re-epithelialization [78]. ROSs are also known to induce transforming growth factor alpha (TGF) in fibroblasts [79]. Increased ROSs and activated TGF-signaling promote fibroblast cell proliferation and trans-differentiation into fibroblasts, as well as excessive ECM deposition and fibrosis [80]. ROSs are capable of triggering keratinocyte growth factor receptor activation and its internalization, which is an important component in epidermal regeneration [81]. The current literature indicates that photo-biomodulation can be a potent short-term way to decrease oxidative stress markers and to enhance antioxidant content [82]. LDPDT could positively affect the diabetic wound healing process, using a low concentration of 5-ALA. In both normal and diabetic cell models, it causes an increase in ROS level compared to the control group. It could suggest the positive effect of LDPDT on stimulation of dermal fibroblast proliferation caused by small amounts of ROSs activating extracellular signal-regulated kinases [22]. This explains the decrease in the Mahalanobis distance of wounds’ Raman spectra in the LDPDT groups relatively healthy skin on days 7–14. It was followed from Table 3 that the LDPDT groups, especially the 5ALA 4 J/cm2 group, are closer to healthy skin than the control. It is also consistent with the results of the 1658/1445 cm−1 band areas ratio estimations (Figure 9).

5. Conclusions

In summary, it was found that Raman spectroscopy is effective in monitoring biological processes such as wound healing. The effect of LDPDT on diabetic wound healing was studied by Raman spectroscopy. A method for the quantitative assessment of wound healing was developed based on the information about the chemical structure and content of the skin that can be obtained from the Raman spectra. Analysis of the changes in positions and intensities of the amide I and CH2 bands reveals the collagen content in the wound, which plays an important role in the wound healing process. The results indicate the positive effect of the LDPDT in diabetic wounds, where the LDPDT groups had an increased tendency for collagen content compared to the control group, and the 5ALA 4 J/cm2 group showed the best results. It can be concluded that a dose of 4 J/cm2 is in the effective range of biological response of LDPDT, while 1 J/cm2 is close to the lower threshold for diabetic wound LDPDT. The estimation of the Mahalanobis distance between Raman spectra in the principal component space also can be used as a quantitative assessment of the wound healing progress.
For a future work, studies are planned in order to monitor the more complex dynamic changes that occur to the cellular and molecular elements of the wound healing process.

Author Contributions

Conceptualization, Y.V.K. and A.V.B.; methodology, H.Z. and N.A.K.; software, A.V.B.; validation, H.Z., A.A.S. and D.A.L.G.; formal analysis, A.V.B., H.Z. and H.B.; investigation, H.Z., A.A.S., D.A.L.G. and N.A.K.; data curation, A.V.B. and H.B.; writing—original draft preparation, H.Z., A.A.S. and D.A.L.G.; writing—review and editing, Y.V.K.; visualization, H.Z.; supervision, Y.V.K. All authors have read and agreed to the published version of the manuscript.

Funding

This research was funded by a grant under the Decree of the Government of the Russian Federation No. 220 of 9 April 2010 (Agreement No. 075-15-2021-615 of 4 June 2021).

Institutional Review Board Statement

The study was approved by the Ethics Committee of Tomsk State University (Protocol No.4, 10.02.2021), registration No. 6.

Data Availability Statement

The data presented in this study are available on request from the corresponding author. The data are not publicly available due to privacy or ethical restrictions.

Conflicts of Interest

The authors declare no conflict of interest.

References

  1. International Diabetes Federation. IDF Diabetes Atlas, 10th ed.; International Diabetes Federation: Brussels, Belgium, 2021; Available online: https://diabetesatlas.org/ (accessed on 26 November 2022).
  2. Spampinato, S.F.; Caruso, G.I.; De Pasquale, R.; Sortino, M.A.; Merlo, S. The Treatment of Impaired Wound Healing in Diabetes: Looking among Old Drugs. Pharmaceuticals 2020, 13, 60. [Google Scholar] [CrossRef] [PubMed]
  3. Ji, J.-Y.; Ren, D.-Y.; Weng, Y.-Z. Efficiency of Multifunctional Antibacterial Hydrogels for Chronic Wound Healing in Diabetes: A Comprehensive Review. Int. J. Nanomed. 2022, 17, 3163–3176. [Google Scholar] [CrossRef] [PubMed]
  4. Dinh, T.; Elder, S.; Veves, A. Delayed Wound Healing in Diabetes: Considering Future Treatments. Diabetes Manag. 2011, 1, 509–519. [Google Scholar] [CrossRef]
  5. Patel, S.; Srivastava, S.; Singh, M.R.; Singh, D. Mechanistic Insight into Diabetic Wounds: Pathogenesis, Molecular Targets and Treatment Strategies to Pace Wound Healing. Biomed. Pharmacother. 2019, 112, 108615. [Google Scholar] [CrossRef]
  6. Mickelson, M.A.; Mans, C.; Colopy, S.A. Principles of Wound Management and Wound Healing in Exotic Pets. Vet. Clin. N. Am. Exot. Anim. Pract. 2016, 19, 33–53. [Google Scholar] [CrossRef]
  7. Zuhayri, H.; Nikolaev, V.V.; Knyazkova, A.I.; Lepekhina, T.B.; Krivova, N.A.; Tuchin, V.V.; Kistenev, Y.V. In Vivo Quantification of the Effectiveness of Topical Low-Dose Photodynamic Therapy in Wound Healing Using Two-Photon Microscopy. Pharmaceutics 2022, 14, 287. [Google Scholar] [CrossRef]
  8. Wilkinson, H.N.; Hardman, M.J. Wound Healing: Cellular Mechanisms and Pathological Outcomes. Open Biol. 2020, 10, 200223. [Google Scholar] [CrossRef]
  9. Guo, S.; DiPietro, L.A. Factors Affecting Wound Healing. J. Dent. Res. 2010, 89, 219–229. [Google Scholar] [CrossRef]
  10. Garcia, J.G.M. The Role of Photodynamic Therapy in Wound Healing and Scarring in Human Skin. Ph.D. Thesis, The University of Manchester, Manchester, UK, 2015. [Google Scholar]
  11. Gonzalez, A.C.D.O.; Costa, T.F.; Andrade, Z.D.A.; Medrado, A.R.A.P. Wound Healing—A Literature Review. An. Bras. Dermatol. 2016, 91, 614–620. [Google Scholar] [CrossRef]
  12. Han, G.; Ceilley, R. Chronic Wound Healing: A Review of Current Management and Treatments. Adv. Ther. 2017, 34, 599–610. [Google Scholar] [CrossRef] [Green Version]
  13. Wetzler, C.; Kämpfer, H.; Stallmeyer, B.; Pfeilschifter, J.; Frank, S. Large and Sustained Induction of Chemokines during Impaired Wound Healing in the Genetically Diabetic Mouse: Prolonged Persistence of Neutrophils and Macrophages during the Late Phase of Repair. J. Investig. Dermatol. 2000, 115, 245–253. [Google Scholar] [CrossRef] [PubMed]
  14. Brown, D.L.; Kane, C.D.; Chernausek, S.D.; Greenhalgh, D.G. Differential Expression and Localization of Insulin-like Growth Factors I and II in Cutaneous Wounds of Diabetic and Nondiabetic Mice. Am. J. Pathol. 1997, 151, 715–724. [Google Scholar] [PubMed]
  15. Brem, H.; Tomic-Canic, M. Cellular and Molecular Basis of Wound Healing in Diabetes. J. Clin. Investig. 2007, 117, 1219–1222. [Google Scholar] [CrossRef]
  16. Cano Sanchez, M.; Lancel, S.; Boulanger, E.; Neviere, R. Targeting Oxidative Stress and Mitochondrial Dysfunction in the Treatment of Impaired Wound Healing: A Systematic Review. Antioxidants 2018, 7, 98. [Google Scholar] [CrossRef]
  17. Tangvarasittichai, S. Oxidative Stress, Insulin Resistance, Dyslipidemia and Type 2 Diabetes Mellitus. World J. Diabetes 2015, 6, 456–480. [Google Scholar] [CrossRef] [PubMed]
  18. Mieczkowski, M.; Mrozikiewicz-Rakowska, B.; Kowara, M.; Kleibert, M.; Czupryniak, L. The Problem of Wound Healing in Diabetes—From Molecular Pathways to the Design of an Animal Model. Int. J. Mol. Sci. 2022, 23, 7930. [Google Scholar] [CrossRef]
  19. Tedesco, A.; Jesus, P. Low Level Energy Photodynamic Therapy for Skin Processes and Regeneration. In Photomedicine—Advances in Clinical Practice; Tanaka, Y., Ed.; InTech: Rijeka, Croatia, 2017; ISBN 978-953-51-3155-7. [Google Scholar]
  20. Shaw, T.J.; Martin, P. Wound Repair at a Glance. J. Cell Sci. 2009, 122, 3209–3213. [Google Scholar] [CrossRef] [PubMed]
  21. Zuhayri, H.; Nikolaev, V.V.; Lepekhina, T.B.; Sandykova, E.A.; Krivova, N.A.; Kistenev, Y.V. The In Vivo Quantitative Assessment of the Effectiveness of Low-Dose Photodynamic Therapy on Wound Healing Using Optical Coherence Tomography. Pharmaceutics 2022, 14, 399. [Google Scholar] [CrossRef]
  22. Khorsandi, K.; Fekrazad, R.; Hamblin, M.R. Low-dose Photodynamic Therapy Effect on Closure of Scratch Wounds of Normal and Diabetic Fibroblast Cells: An in Vitro Study. J. Biophotonics 2021, 14, e202100005. [Google Scholar] [CrossRef]
  23. Peplow, P.V.; Chung, T.-Y.; Baxter, G.D. Photodynamic Modulation of Wound Healing: A Review of Human and Animal Studies. Photomed. Laser Surg. 2012, 30, 118–148. [Google Scholar] [CrossRef]
  24. Morimoto, K.; Ozawa, T.; Awazu, K.; Ito, N.; Honda, N.; Matsumoto, S.; Tsuruta, D. Photodynamic Therapy Using Systemic Administration of 5-Aminolevulinic Acid and a 410-Nm Wavelength Light-Emitting Diode for Methicillin-Resistant Staphylococcus Aureus-Infected Ulcers in Mice. PLoS ONE 2014, 9, e105173. [Google Scholar] [CrossRef] [PubMed]
  25. Yin, R.; Lin, L.; Xiao, Y.; Hao, F.; Hamblin, M.R. Combination ALA-PDT and ablative fractional Er:YAG laser (2,940 nm) on the treatment of severe acne. Lasers Surg. Med. 2014, 46, 165–172. [Google Scholar] [CrossRef] [PubMed]
  26. Jiang, C.; Yang, W.; Wang, C.; Qin, W.; Ming, J.; Zhang, M.; Qian, H.; Jiao, T. Methylene Blue-Mediated Photodynamic Therapy Induces Macrophage Apoptosis via ROS and Reduces Bone Resorption in Periodontitis. Oxidative Med. Cell. Longev. 2019, 2019, 1529520. [Google Scholar] [CrossRef] [PubMed]
  27. Carroll, J.D. A 3D Dose Model for Low Level Laser/Led Therapy Biostimulation and Bioinhibition. In Proceedings of the SPIE BiOS 2008, San Jose, CA, USA, 6 March 2008; p. 684603. [Google Scholar]
  28. Kilík, R.; Lakyová, L.; Sabo, J.; Kruzliak, P.; Lacjaková, K.; Vasilenko, T.; Vidová, M.; Longauer, F.; Radoňak, J. Effect of Equal Daily Doses Achieved by Different Power Densities of Low-Level Laser Therapy at 635 Nm on Open Skin Wound Healing in Normal and Diabetic Rats. BioMed Res. Int. 2014, 2014, 269253. [Google Scholar] [CrossRef] [PubMed]
  29. Hawkins, D.H.; Abrahamse, H. The Role of Laser Fluence in Cell Viability, Proliferation, and Membrane Integrity of Wounded Human Skin Fibroblasts Following Helium-Neon Laser Irradiation. Lasers Surg. Med. 2006, 38, 74–83. [Google Scholar] [CrossRef] [PubMed]
  30. Byrnes, K.R.; Barna, L.; Chenault, V.M.; Waynant, R.W.; Ilev, I.K.; Longo, L.; Miracco, C.; Johnson, B.; Anders, J.J. Photobiomodulation Improves Cutaneous Wound Healing in an Animal Model of Type II Diabetes. Photomed. Laser Surg. 2004, 22, 281–290. [Google Scholar] [CrossRef]
  31. Sommer, A.P.; Pinheiro, A.L.B.; Mester, A.R.; Franke, R.P.; Whelan, H.T. Biostimulatory windows in low-intensity laser activation: Lasers, scanners, and NASA’s light-emitting diode array system. J. Clin. Laser Med. Surg. 2001, 19, 29–33. [Google Scholar] [CrossRef]
  32. Kaniyala Melanthota, S.; Kistenev, Y.V.; Borisova, E.; Ivanov, D.; Zakharova, O.; Boyko, A.; Vrazhnov, D.; Gopal, D.; Chakrabarti, S.; Shama Prasada, K.; et al. Types of Spectroscopy and Microscopy Techniques for Cancer Diagnosis: A Review. Lasers Med. Sci. 2022, 37, 3067–3084. [Google Scholar] [CrossRef]
  33. Zhuo, G.-Y.; Spandana, K.U.; Sindhoora, K.M.; Kistenev, Y.V.; Kao, F.-J.; Nikolaev, V.V.; Zuhayri, H.; Krivova, N.A.; Mazumder, N. Label-Free Multimodal Nonlinear Optical Microscopy for Biomedical Applications. J. Appl. Phys. 2021, 129, 214901. [Google Scholar] [CrossRef]
  34. Butler, H.J.; Ashton, L.; Bird, B.; Cinque, G.; Curtis, K.; Dorney, J.; Esmonde-White, K.; Fullwood, N.J.; Gardner, B.; Martin-Hirsch, P.L.; et al. Using Raman Spectroscopy to Characterize Biological Materials. Nat. Protoc. 2016, 11, 664–687. [Google Scholar] [CrossRef] [Green Version]
  35. Agarwala, N. Application of Raman Spectroscopy to Study of Biological Systems. Master’s Thesis, Missouri State University, Springfield, MO, USA, 2017; p. 89. [Google Scholar]
  36. Guevara, E.; Torres-Galván, J.C.; Ramírez-Elías, M.G.; Luevano-Contreras, C.; González, F.J. Use of Raman Spectroscopy to Screen Diabetes Mellitus with Machine Learning Tools. Biomed. Opt. Express 2018, 9, 4998–5010. [Google Scholar] [CrossRef]
  37. Toporski, J.; Dieing, T.; Hollricher, O. (Eds.) Confocal Raman Microscopy; Springer Series in Surface Sciences; Springer International Publishing: Cham, Switzerland, 2018; Volume 66, ISBN 978-3-319-75378-2. [Google Scholar]
  38. Movasaghi, Z.; Rehman, S.; Rehman, I.U. Raman Spectroscopy of Biological Tissues. Appl. Spectrosc. Rev. 2007, 42, 493–541. [Google Scholar] [CrossRef]
  39. Clemens, G.; Hands, J.R.; Dorling, K.M.; Baker, M.J. Vibrational Spectroscopic Methods for Cytology and Cellular Research. Analyst 2014, 139, 4411–4444. [Google Scholar] [CrossRef] [PubMed]
  40. Auner, G.W.; Koya, S.K.; Huang, C.; Broadbent, B.; Trexler, M.; Auner, Z.; Elias, A.; Mehne, K.C.; Brusatori, M.A. Applications of Raman Spectroscopy in Cancer Diagnosis. Cancer Metastasis Rev. 2018, 37, 691–717. [Google Scholar] [CrossRef] [PubMed]
  41. Devitt, G.; Howard, K.; Mudher, A.; Mahajan, S. Raman Spectroscopy: An Emerging Tool in Neurodegenerative Disease Research and Diagnosis. ACS Chem. Neurosci. 2018, 9, 404–420. [Google Scholar] [CrossRef]
  42. Huang, C.-C.; Isidoro, C. Raman Spectrometric Detection Methods for Early and Non-Invasive Diagnosis of Alzheimer’s Disease. J. Alzheimer’s Dis. 2017, 57, 1145–1156. [Google Scholar] [CrossRef]
  43. Schipper, H.M.; Kwok, C.S.; Rosendahl, S.M.; Bandilla, D.; Maes, O.; Melmed, C.; Rabinovitch, D.; Burns, D.H. Spectroscopy of Human Plasma for Diagnosis of Idiopathic Parkinson’s Disease. Biomark. Med. 2008, 2, 229–238. [Google Scholar] [CrossRef]
  44. Donjuán-Loredo, G.; Espinosa-Tanguma, R.; Ramírez-Elías, M.G. Raman Spectroscopy in the Diagnosis of Metabolic Syndrome. Appl. Spectrosc. Rev. 2021, 1–21. [Google Scholar] [CrossRef]
  45. Larion, M.; Dowdy, T.; Ruiz-Rodado, V.; Meyer, M.; Song, H.; Zhang, W.; Davis, D.; Gilbert, M.; Lita, A. Detection of Metabolic Changes Induced via Drug Treatments in Live Cancer Cells and Tissue Using Raman Imaging Microscopy. Biosensors 2018, 9, 5. [Google Scholar] [CrossRef]
  46. Caspers, P.J.; Lucassen, G.W.; Carter, E.A.; Bruining, H.A.; Puppels, G.J. In Vivo Confocal Raman Microspectroscopy of the Skin: Noninvasive Determination of Molecular Concentration Profiles. J. Investig. Dermatol. 2001, 116, 434–442. [Google Scholar] [CrossRef] [Green Version]
  47. Caspers, P.J.; Lucassen, G.W.; Wolthuis, R.; Bruining, H.A.; Puppels, G.J. In Vitro Andin Vivo Raman Spectroscopy of Human Skin. Biospectroscopy 1998, 4, S31–S39. [Google Scholar] [CrossRef]
  48. Jain, R.; Calderon, D.; Kierski, P.R.; Schurr, M.J.; Czuprynski, C.J.; Murphy, C.J.; McAnulty, J.F.; Abbott, N.L. Raman Spectroscopy Enables Noninvasive Biochemical Characterization and Identification of the Stage of Healing of a Wound. Anal. Chem. 2014, 86, 3764–3772. [Google Scholar] [CrossRef] [PubMed]
  49. Ye, H.; Rahul; Kruger, U.; Wang, T.; Shi, S.; Norfleet, J.; De, S. Burn-Related Collagen Conformational Changes in Ex Vivo Porcine Skin Using Raman Spectroscopy. Sci. Rep. 2019, 9, 19138. [Google Scholar] [CrossRef] [PubMed]
  50. Su, J.W.; Wang, Q.; Tian, Y.; Madden, L.; Ling Teo, E.M.; Becker, D.L.; Liu, Q. Depth-Sensitive Raman Spectroscopy for Skin Wound Evaluation in Rodents. Biomed. Opt. Express 2019, 10, 6114. [Google Scholar] [CrossRef] [PubMed]
  51. Furman, B.L. Streptozotocin-Induced Diabetic Models in Mice and Rats. Curr. Protoc. 2021, 1, e78. [Google Scholar] [CrossRef] [PubMed]
  52. Jolliffe, I.T.; Cadima, J. Principal Component Analysis: A Review and Recent Developments. Philos. Trans. R. Soc. A 2016, 374, 20150202. [Google Scholar] [CrossRef]
  53. Gąsior-Głogowska, M.; Komorowska, M.; Hanuza, J.; Mączka, M.; Zając, A.; Ptak, M.; Będziński, R.; Kobielarz, M.; Maksymowicz, K.; Kuropka, P.; et al. FT-Raman Spectroscopic Study of Human Skin Subjected to Uniaxial Stress. J. Mech. Behav. Biomed. Mater. 2013, 18, 240–252. [Google Scholar] [CrossRef]
  54. Olsztyńska-Janus, S.; Gąsior-Głogowska, M.; Szymborska-Małek, K.; Komorowska, M.; Witkiewicz, W.; Pezowicz, C.; Szotek, S.; Kobielarz, M. Spectroscopic Techniques in the Study of Human Tissues and Their Components. Part II: Raman Spectroscopy. Acta Bioeng. Biomech. 2012, 14, 121–133. [Google Scholar] [CrossRef]
  55. Nguyen, T.T.; Gobinet, C.; Feru, J.; Pasco, S.B.; Manfait, M.; Piot, O. Characterization of Type I and IV Collagens by Raman Microspectroscopy: Identification of Spectral Markers of the Dermo-Epidermal Junction. Spectrosc. Int. J. 2012, 27, 421–427. [Google Scholar] [CrossRef]
  56. De Campos Vidal, B.; Mello, M.L.S. Collagen Type I Amide I Band Infrared Spectroscopy. Micron 2011, 42, 283–289. [Google Scholar] [CrossRef]
  57. Girard, A.; Cooper, A.; Mabbott, S.; Bradley, B.; Asiala, S.; Jamieson, L.; Clucas, C.; Capewell, P.; Marchesi, F.; Gibbins, M.P.; et al. Raman Spectroscopic Analysis of Skin as a Diagnostic Tool for Human African Trypanosomiasis. PLoS Pathog. 2021, 17, e1010060. [Google Scholar] [CrossRef]
  58. Pezzotti, G.; Boffelli, M.; Miyamori, D.; Uemura, T.; Marunaka, Y.; Zhu, W.; Ikegaya, H. Raman Spectroscopy of Human Skin: Looking for a Quantitative Algorithm to Reliably Estimate Human Age. J. Biomed. Opt. 2015, 20, 065008. [Google Scholar] [CrossRef] [PubMed]
  59. Tfaili, S.; Gobinet, C.; Josse, G.; Angiboust, J.-F.; Manfait, M.; Piot, O. Confocal Raman Microspectroscopy for Skin Characterization: A Comparative Study between Human Skin and Pig Skin. Analyst 2012, 137, 3673–3682. [Google Scholar] [CrossRef] [PubMed]
  60. Liu, H.; Liu, H.; Deng, X.; Chen, M.; Han, X.; Yan, W.; Wang, N. Raman Spectroscopy Combined with SHG Gives a New Perspective for Rapid Assessment of the Collagen Status in the Healing of Cutaneous Wounds. Anal. Methods 2016, 8, 3503–3510. [Google Scholar] [CrossRef]
  61. Brereton, R.G. The Mahalanobis Distance and Its Relationship to Principal Component Scores: The Mahalanobis Distance and PCA. J. Chemom. 2015, 29, 143–145. [Google Scholar] [CrossRef]
  62. Lajtha, A. Handbook of Neurochemistry and Molecular Neurobiology Neural Lipids, 3rd ed.; Springer: New York, NY, USA, 2009. [Google Scholar]
  63. Kwiatkowski, S.; Knap, B.; Przystupski, D.; Saczko, J.; Kędzierska, E.; Knap-Czop, K.; Kotlińska, J.; Michel, O.; Kotowski, K.; Kulbacka, J. Photodynamic Therapy—Mechanisms, Photosensitizers and Combinations. Biomed. Pharmacother. 2018, 106, 1098–1107. [Google Scholar] [CrossRef]
  64. Bochkov, V.N.; Oskolkova, O.V.; Birukov, K.G.; Levonen, A.-L.; Binder, C.J.; Stöckl, J. Generation and Biological Activities of Oxidized Phospholipids. Antioxid. Redox Signal. 2010, 12, 1009–1059. [Google Scholar] [CrossRef]
  65. Felician, F.F.; Yu, R.-H.; Li, M.-Z.; Li, C.-J.; Chen, H.-Q.; Jiang, Y.; Tang, T.; Qi, W.-Y.; Xu, H.-M. The Wound Healing Potential of Collagen Peptides Derived from the Jellyfish Rhopilema Esculentum. Chin. J. Traumatol. 2019, 22, 12–20. [Google Scholar] [CrossRef]
  66. Wijesinghe, D.S. Role of Lipid Mediators in Diabetic Wound Healing. In Wound Healing, Tissue Repair, and Regeneration in Diabetes; Elsevier: Amsterdam, The Netherlands, 2020; pp. 181–195. ISBN 978-0-12-816413-6. [Google Scholar]
  67. Goldberg, R.B. Lipid Disorders in Diabetes. Diabetes Care 1981, 4, 561–572. [Google Scholar] [CrossRef]
  68. Athyros, V.G.; Doumas, M.; Imprialos, K.P.; Stavropoulos, K.; Georgianou, E.; Katsimardou, A.; Karagiannis, A. Diabetes and Lipid Metabolism. Hormones 2018, 17, 61–67. [Google Scholar] [CrossRef] [Green Version]
  69. Parhofer, K.G. Interaction between Glucose and Lipid Metabolism: More than Diabetic Dyslipidemia. Diabetes Metab. J. 2015, 39, 353–362. [Google Scholar] [CrossRef] [PubMed]
  70. Brandt, S.L.; Wang, S.; Dejani, N.N.; Klopfenstein, N.; Winfree, S.; Filgueiras, L.; McCarthy, B.P.; Territo, P.R.; Serezani, C.H. Excessive Localized Leukotriene B4 Levels Dictate Poor Skin Host Defense in Diabetic Mice. JCI Insight 2018, 3, e120220. [Google Scholar] [CrossRef] [PubMed]
  71. Drozd, A.; Kotlęga, D.; Nowacki, P.; Ciećwież, S.; Trochanowski, T.; Szczuko, M. Fatty Acid Levels and Their Inflammatory Metabolites Are Associated with the Nondipping Status and Risk of Obstructive Sleep Apnea Syndrome in Stroke Patients. Biomedicines 2022, 10, 2200. [Google Scholar] [CrossRef] [PubMed]
  72. Czamara, K.; Majzner, K.; Pacia, M.Z.; Kochan, K.; Kaczor, A.; Baranska, M. Raman Spectroscopy of Lipids: A Review: Raman Spectroscopy of Lipids. J. Raman Spectrosc. 2015, 46, 4–20. [Google Scholar] [CrossRef]
  73. Barker, T.H.; Engler, A.J. The Provisional Matrix: Setting the Stage for Tissue Repair Outcomes. Matrix Biol. 2017, 60–61, 1–4. [Google Scholar] [CrossRef]
  74. Xue, M.; Jackson, C.J. Extracellular Matrix Reorganization During Wound Healing and Its Impact on Abnormal Scarring. Adv. Wound Care 2015, 4, 119–136. [Google Scholar] [CrossRef]
  75. Sottile, J.; Hocking, D.C. Fibronectin Polymerization Regulates the Composition and Stability of Extracellular Matrix Fibrils and Cell-Matrix Adhesions. MBoC 2002, 13, 3546–3559. [Google Scholar] [CrossRef]
  76. Bainbridge, P. Wound Healing and the Role of Fibroblasts. J. Wound Care 2013, 22, 407–412. [Google Scholar]
  77. Khorsandi, K.; Hosseinzadeh, R.; Esfahani, H.; Zandsalimi, K.; Shahidi, F.K.; Abrahamse, H. Accelerating Skin Regeneration and Wound Healing by Controlled ROS from Photodynamic Treatment. Inflamm. Regen. 2022, 42, 40. [Google Scholar] [CrossRef]
  78. Hoffmann, M.H.; Griffiths, H.R. The Dual Role of Reactive Oxygen Species in Autoimmune and Inflammatory Diseases: Evidence from Preclinical Models. Free. Radic. Biol. Med. 2018, 125, 62–71. [Google Scholar] [CrossRef]
  79. Vivekananda, J.; Lin, A.; Coalson, J.J.; King, R.J. Acute Inflammatory Injury in the Lung Precipitated by Oxidant Stress Induces Fibroblasts to Synthesize and Release Transforming Growth Factor-Alpha. J. Biol. Chem. 1994, 269, 25057–25061. [Google Scholar] [CrossRef] [PubMed]
  80. Morry, J.; Ngamcherdtrakul, W.; Yantasee, W. Oxidative Stress in Cancer and Fibrosis: Opportunity for Therapeutic Intervention with Antioxidant Compounds, Enzymes, and Nanoparticles. Redox Biol. 2017, 11, 240–253. [Google Scholar] [CrossRef]
  81. Marchese, C.; Maresca, V.; Cardinali, G.; Belleudi, F.; Ceccarelli, S.; Bellocci, M.; Frati, L.; Torrisi, M.R.; Picardo, M. UVB-Induced Activation and Internalization of Keratinocyte Growth Factor Receptor. Oncogene 2003, 22, 2422–2431. [Google Scholar] [CrossRef] [PubMed]
  82. Choi, W.; Baik, K.Y.; Jeong, S.; Park, S.; Kim, J.E.; Kim, H.B.; Chung, J.H. Photobiomodulation as an Antioxidant Substitute in Post-Thawing Trauma of Human Stem Cells from the Apical Papilla. Sci. Rep. 2021, 11, 17329. [Google Scholar] [CrossRef] [PubMed]
Figure 1. A mouse anesthetized by isoflurane, using the Ugo Basile gas anesthesia system (Italy).
Pharmaceutics 15 00595 g001
Figure 2. The experimental research design.
Pharmaceutics 15 00595 g002
Figure 3. The mouse in the working field of the confocal Raman spectrometer.
Pharmaceutics 15 00595 g003
Figure 4. A tissue image on the Raman spectrometer camera screen.
Pharmaceutics 15 00595 g004
Figure 5. An example of a Raman spectrum before (a) and after (b) background subtraction.
Pharmaceutics 15 00595 g005
Figure 6. Digital photos of the wound healing progression from day 0 to day 14: (a) control group, (b) 5-ALA 4 J/cm2 group, (c) 5-ALA 1 J/cm2 group, (d) MB 4 J/cm2 group, (e) MB 1 J/cm2 group, (f) healthy control without diabetes. * This line of pictures was adapted from [6] under CC BY 4.0 license. 2022, MDPI).
Pharmaceutics 15 00595 g006
Figure 7. Wound healing progression in the following groups: red line—control, blue line—5-ALA 4 J/cm2, green line—MB 4 J/cm2, yellow line—5-ALA 1 J/cm2, purple line—MB 4 J/cm2, black line—control without diabetes. (The number of mice was equal to 3 for each group), * p-value < 0.05, ** p-value < 0.1. † The wound areas of control without diabetes were taken from a previous study of the authors [6].
Pharmaceutics 15 00595 g007
Figure 8. Mice healthy skin average Raman spectra (the number of processed Raman spectra was equal to 20).
Pharmaceutics 15 00595 g008
Figure 9. The mean Raman spectra of skin wounds in all groups on all observation days and healthy skin, black line—5ALA 1 J/cm2, black dashed line—5ALA 4 J/cm2, red line—MB 1 J/cm2, red dashed line—MB 4 J/cm2, blue line—control, green line—healthy skin (the number of processed Raman spectra was equal to 30 for each group).
Pharmaceutics 15 00595 g009aPharmaceutics 15 00595 g009b
Figure 10. The 1658/1445 cm−1 band areas ratio during wound healing in the following groups: black line—5ALA 1 J/cm2, black dashed line—5ALA 4 J/cm2, red line—MB 1 J/cm2, red dashed line—MB 4 J/cm2, blue line—control, green line—healthy skin (the number of processed Raman spectra was equal to 30 for each group).
Pharmaceutics 15 00595 g010
Figure 11. Differences between the wound Raman spectra of all groups subtracting the healthy skin mean Raman spectrum. The Raman spectra are presented in terms of mean ± StD values. Black line—5ALA 1 J/cm2, black dashed line—5ALA 4 J/cm2, red line—MB 1 J/cm2, red dashed line—MB 4 J/cm2, blue line—control, green line—healthy skin (the number of processed Raman spectra was equal to 30 for each group).
Pharmaceutics 15 00595 g011aPharmaceutics 15 00595 g011b
Figure 12. Difference between the wound Raman spectra of all groups subtracting the healthy skin mean Raman spectrum in the 1020–1140 cm−1 spectral range. The Raman spectra are presented in terms of mean ± StD values. Black line—5ALA 1 J/cm2, black dashed line—5ALA 4 J/cm2, red line—MB 1 J/cm2, red dashed line—MB 4 J/cm2, blue line—control, green line—healthy skin (the number of processed Raman spectra was equal to 30 for each group).
Pharmaceutics 15 00595 g012aPharmaceutics 15 00595 g012b
Figure 13. Difference between the wound Raman spectra of all groups subtracting the healthy skin mean Raman spectrum in the 1200–1750 cm−1 spectral range. The Raman spectra are presented in terms of mean ± StD values. Black line—5ALA 1 J/cm2, black dashed line—5ALA 4 J/cm2, red line—MB 1 J/cm2, red dashed line—MB 4 J/cm2, blue line—control, green line—healthy skin (the number of processed Raman spectra was equal to 30 for each group).
Pharmaceutics 15 00595 g013
Figure 14. Difference between the wound Raman spectra of all groups subtracting the healthy skin mean Raman spectrum in the 2700–3000 cm−1 spectral range. The Raman spectra are presented in terms of mean ± StD values. Black line—5ALA 1 J/cm2, black dashed line—5ALA 4 J/cm2, red line—MB 1 J/cm2, red dashed line—MB 4 J/cm2, blue line—control, green line—healthy skin (the number of processed Raman spectra was equal to 30 for each group).
Pharmaceutics 15 00595 g014
Figure 15. Principal component analysis of the wound and healthy skin Raman spectra in the 2800–3000 cm−1 spectral range on different observation days in a subspace of PC2 and PC3: (a) 5-ALA 1 J/cm2 group, (b) 5-ALA 4 J/cm2 group, (c) MB 1 J/cm2 group, (d) MB 4 J/cm2 group, (e) the control group.
Pharmaceutics 15 00595 g015
Table 1. Weight and blood glucose levels (Mean ± StD) in control and diabetic mice groups (n = 25 per group).
Weight (g)Glucose (mg/dL)
aAll30.2 ± 2.48.0 ± 1.7
bControl32.5 ± 4.38.7 ± 2.1
Diabetics31.9 ± 2.413.9 ± 3.9
cControl35.4 ± 3.28.9 ± 0.9
Diabetics30.3 ± 3.821.6 ± 4.7
dControl36.6 ± 3.19.5 ± 4.1
Diabetics31.4 ± 2.926.9 ± 4.0
(a) before diabetic model creation, (b) the early stage of diabetes (after 5 days of last STZ injection), (c) the later stage of diabetes (after 15 of last STZ injection), (d) after 25 days of last STZ injection.
Table 2. The p-values for all groups in comparison with healthy skin on all observation days (n = 15).
Control5ALA 1 J/cm25ALA 4 J/cm2MB 1 J/cm2MB 4 J/cm2
day 10.00410.00130.00150.00460.0082
day 30.00380.00060.00720.00130.0003
day 70.00810.00110.00070.00170.0038
day 140.06890.00020.00030.000030.000003
Table 3. Mahalanobis distances in the PC2–PC3 space between the healthy skin and other groups in the 2800–3000 cm−1 spectral range on various observation days.
5ALA 1 J/cm25ALA 4 J/cm2MB 1 J/cm2MB 4 J/cm2Control
day 113.116.215.713.824.8
day 318.317.110.811.734.9
day 716.520.417.517.823.2
day 143.82.97.64.113.0
Disclaimer/Publisher’s Note: The statements, opinions and data contained in all publications are solely those of the individual author(s) and contributor(s) and not of MDPI and/or the editor(s). MDPI and/or the editor(s) disclaim responsibility for any injury to people or property resulting from any ideas, methods, instructions or products referred to in the content.

