Article

Penetration Depth of Propylene Glycol, Sodium Fluorescein and Nile Red into the Skin Using Non-Invasive Two-Photon Excited FLIM

1
Center of Experimental and Applied Cutaneous Physiology, Department of Dermatology, Venerology and Allergology, Charité–Universitätsmedizin Berlin, Corporate Member of Freie Universität Berlin and Humboldt-Universität zu Berlin, Charitéplatz 1, 10117 Berlin, Germany
2
Department of Mathematics, Physics and Chemistry, Berliner Hochschule für Technik, Luxemburger Straße 10, 13353 Berlin, Germany
3
Department of Pharmaceutics and Biopharmaceutics, Philipps University Marburg, 35037 Marburg, Germany
*
Author to whom correspondence should be addressed.
Pharmaceutics 2022, 14(9), 1790; https://doi.org/10.3390/pharmaceutics14091790
Submission received: 25 July 2022 / Revised: 19 August 2022 / Accepted: 22 August 2022 / Published: 26 August 2022
(This article belongs to the Special Issue Tissue Diagnosis, Phototherapy and Drug Delivery)

Abstract

:
The stratum corneum (SC) forms a strong barrier against topical drug delivery. Therefore, understanding the penetration depth and pathways into the SC is important for the efficiency of drug delivery and cosmetic safety. In this study, TPT-FLIM (two-photon tomography combined with fluorescence lifetime imaging) was applied as a non-invasive optical method for the visualization of skin structure and components to study penetration depths of exemplary substances, like hydrophilic propylene glycol (PG), sodium fluorescein (NaFl) and lipophilic Nile red (NR) into porcine ear skin ex vivo. Non-fluorescent PG was detected indirectly based on the pH-dependent increase in the fluorescence lifetime of SC components. The pH similarity between PG and viable epidermis limited the detection of PG. NaFl reached the viable epidermis, which was also proved by laser scanning microscopy. Tape stripping and confocal Raman micro-spectroscopy were performed additionally to study NaFl, which revealed penetration depths of ≈5 and ≈8 μm, respectively. Lastly, NR did not permeate the SC. We concluded that the amplitude-weighted mean fluorescence lifetime is the most appropriate FLIM parameter to build up penetration profiles. This work is anticipated to provide a non-invasive TPT-FLIM method for studying the penetration of topically applied drugs and cosmetics into the skin.

1. Introduction

With an area of about 1.5–2 m2, the skin covers most of the body and contributes to the mechanical and biochemical defense system [1]. Acting as an effective barrier against pathogen penetration and solar light exposure, it protects the body against temperature changes and water loss [2,3,4]. Due to this function, the skin forms a barrier against topically applied pharmaceuticals and cosmetics, i.e., ointments, creams and drugs. The stratum corneum (SC) is the uppermost layer of the skin consisting of corneocytes embedded in the structurally organized lipid matrix [3,5] and forms the strongest non-homogenous in-depth barrier between body and environment [6,7]. Cosmetics like sunscreens and skin moisturizers act in the SC and should not permeate the skin barrier [8,9], while drugs must first cross the SC to reach the living cells of the viable epidermis [10]. To ensure the permeation through the SC, different methods are used [11] including the addition of penetration enhancers into the formulations [12]. In general, molecules which can pass the SC can usually penetrate into the deeper layers of the skin [13]. Therefore, to guarantee efficient drug delivery, it is important to investigate the penetration into the SC. The penetration depth depends on several factors, including skin health, age, and most importantly, the substances themselves. Molecule size, solvents, and the hydrophilicity or lipophilicity of the substances play a crucial role in penetration [10,14,15].
Beside human skin, different skin models have been used in penetration studies, i.e., porcine and murine skin [6,16,17], which resemble human skin in terms of morphology and properties like thickness, radical production, and components. Differences in the barrier-related parameters of the SC between porcine ear and human skin have been, however, shown by Choe et al. [18].
Different methods have been considered for cutaneous penetration studies in vivo. Besides taking biopsies and histological sections prepared from them [14], there are many invasive methods, e.g., microdialysis [15,19,20] and the suction blister method [21]. Among the most commonly used methods are the minimally invasive tape-stripping and cyanoacrylate-stripping techniques [22]. Since the invasive and minimally invasive methods can be painful, unsafe, not applicable for kinetic measurements, and not permissible according to ethical rules [23], the focus is always on the application of advantageous optical non-invasive techniques. Confocal laser scanning microscopy (LSM) uses the fluorescence property of certain substances and thus can visualize the skin structure and the presence of these substances in different skin layers [24,25]. The method is suitable for both in vivo and ex vivo investigations; however, it requires a fluorescence-labelled substance and is, therefore, not suitable for non-fluorescent substances [14]. Raman micro-spectroscopy measures the energy of changes in the vibrational states of molecules, thus providing characteristic information about the molecules present in the sample [26]. The strong superposition of substance- and skin-related Raman bands, as well as the long measurement time and the high price of the device are considered as the main disadvantages of this method [27]. Optical coherence tomography is not appropriate for penetration studies due to non-detectable changes in the optical properties of the skin and the investigated formulation [25]. Furthermore, none of the mentioned methods provides clear information about the penetration pathways due to resolution restriction.
In this work we present the application of two-photon excited fluorescence lifetime imaging (TPE-FLIM) as a non-invasive optical method for studying the penetration into the skin. It is a pixel-by-pixel time-resolved imaging method for visualizing skin components and applied substances based on the analysis of the two-photon excited fluorescence intensity and subsequent determination of TPE-FLIM parameters of fluorophores [28,29]. TPE-FLIM offers many advantages, e.g., unlike the fluorescence intensity the fluorescence lifetime does not depend on the fluorophore concentration but on its molecular environment [24,30]. The dependence on the molecular environment enabled an imaging of Ca2+ concentration in cells [31,32], mapping oxygen [33,34], pH [35,36,37] and temperature [38,39] in cells as well as monitoring the viscosity of the plasma membrane [40]. Furthermore, many endogenous fluorophores overlap fluorescence emission spectra but have different lifetimes; thus TPE-FLIM can separate those fluorophores depending on their characteristic lifetime regardless of their emission wavelength [24,41]. Another advantage is that one photon excitation depends linearly on the excitation energy, but TPE is a function of the square of this energy [24,42,43] and occurs only in the focal plane, where the photon density is sufficient for two-photon absorption [44]. Moreover, restricting photochemical interaction to the focal plane reduces autofluorescence photobleaching [45,46].
TPE-FLIM provides a powerful method for detecting chemical and physical changes in the molecules [41], thereby providing an excellent opportunity for fluorescence lifetime and the microscopic environment-dependent visualization of substances [47,48] and cells in the skin [49,50,51]. The method has been also used to determine the morphological differences between healthy and cancerous skin [52,53,54,55,56]. Thus, the TPE-FLIM method has proved to be well suited for dermatological and skin-physiological studies.
The application of TPT-FLIM for penetration studies in the skin have been presented, for example, on zinc oxide nanoparticles [57], antibiotic minocycline gel [58], an anti-inflammatory compound [59], and silver nanoparticles [29]. Nevertheless, this application of TPE-FLIM has so far been rarely used in practice. Therefore, this work aims to explore the efficiency of the TPT-FLIM method for penetration studies on further hydrophilic and lipophilic substances with and without their own fluorescence.

2. Materials and Methods

2.1. Porcine Skin Samples

In this study, fresh porcine ears were obtained from a local butcher a few hours after slaughter. The ears were cleaned with cold tap water and dried with soft paper tissue. For each experiment, six different ears were used. The hair was carefully removed using scissors so that the SC was not damaged, then the ears were stored in a fridge at a temperature of 4 °C until the next day. Measurements were performed on fresh ears within 48 h of delivery to exclude an influence on the penetration experiments of post-mortem changes [60]. On the measurement day, a 2 cm × 2 cm area was selected and marked on each ear for the application of 20 μL/cm2 of the examined substance. A finger massage was applied gently in circular motion for 1 min to ensure that the solution was homogeneously distributed over the entire area. After that, the treated and untreated skin samples were incubated for 30 min at a temperature of 32 °C, which mimics the in vivo conditions of human skin surface temperature [61,62]. After the incubation, the rest of the substances was removed from the skin surface using a soft dry tissue, then cleaned with wet tissue 3–5 times. A 1 cm × 1 cm area was excised from the skin for the TPT-FLIM measurements. For tape stripping, a 6 cm × 6 cm sample was treated with 72 μL of the examined solution for 30 min. Before pressing the tapes onto the skin, a small piece of approx. 1 cm × 1 cm was excised for the Raman micro-spectroscopic measurements.

2.2. Propylene Glycol (PG)

PG (1,2-propanediol-CH3CH(OH)CH2OH)) is a colorless viscous liquid and is used as a vehicle for drugs as well as as a hydrophilic penetration enhancer [63]. The action mechanism of PG on the skin has not yet been well understood [64]. PG is thought to act by dissolving keratin through binding at the hydrogen bonding sites. It may also act by interacting with the polar head groups of the intercellular lipids and can thus weaken the barrier function of the SC [10,65]. In this study, PG (SIGMA-Aldrich Chemie GmbH, Steinheim, Germany) was applied undiluted on the skin and incubated for 30 min at 32 °C. The pH value of the PG was 7.29 ± 0.04. PG has no TPE fluorescence at 760 nm excitation.

2.3. Sodium Fluorescein (NaFl)

NaFl (C20H10Na2O5) is an orange-red salt powder of very good solubility in water, which has the ability to bind proteins [66]. NaFl was selected because it is often used in dermatology as a marker substance for penetration measurements in vivo and ex vivo [13,67]. The fluorescence lifetime of NaFl is pH dependent and varies between 3770–4110 ps in a pH range of 6.5–8.6 [68]. For TPT-FLIM and LSM measurements, 1 mL of NaFl solution was prepared by diluting 10 μL of NaFl 2% w/v eye-drop solution (Bausch & Lomb GmbH, Berlin, Germany) in 990 μL of phosphate-buffered saline (PBS), whose pH value is 7.4. After TPE by 760 nm a fluorescence lifetime of τ = 4090 ± 50 ps was measured using single-exponential decay. For tape stripping and confocal Raman micro-spectroscopy, a NaFl solution (Fluoreszein SE Thilo® eyedrops, 1.7 mg/mL, Alcon Pharma GmbH, Freiburg, Germany) was applied to the skin. The treatment time was 30 min at 32 °C for both of the NaFl-solutions.

2.4. Nile Red (NR)

NR was chosen due to its strong lipophilicity and its emission-dependence on the polarity of the environment [69]. For example, phospholipids show a red-shifted emission spectrum, while the neutral lipids such as cholesterol and triglycerides show a yellow-shifted spectrum [69,70]. Not only the emission but also the fluorescence lifetime of NR varies depending on the polarity of its environment. The fluorescence lifetime of NR was examined in different solvents [70,71]. Taking into consideration a strong occlusion and swelling of the SC induced by topically applied petrolatum [72], which results in the formation of a waterfront and the reduced penetration depth of lipophilic NL [73], paraffin oil was chosen as a solvent. To prepare the NR solution, 1 mg of NR powder (SIGMA-Aldrich Chemie GmbH, Steinheim, Germany) was dissolved in 1 mL of paraffin oil (SIGMA-Aldrich Chemie GmbH, Steinheim, Germany) and mixed using a vortex shaker for 15 min, followed by 15 min in ultrasonic bath under a temperature of 30 °C. At last, the skin was treated with 80 μL of NR for 30 min at 32 °C. The fluorescence lifetime of the solution was τ = 3176 ± 53 ps, determined using a single-exponential decay after a TPE at 760 nm. The solvent used (paraffin oil) is itself non-fluorescent, can be used as a skin moisturizer, and does not permeate the SC, and thus cannot enhance the penetration and reach the viable epidermis [74,75]. The control skin samples were treated with the vehicle of NR, which is paraffin oil, to ensure that both samples were examined under the same conditions.

2.5. Two-Photon Tomography in Combination with Fluorescence Lifetime Imaging (TPT-FLIM)

A two-photon tomograph (TPT, Dermainspect, JenLab GmbH, Jena, Germany) equipped with a tunable (710–920 nm) Ti:sapphire laser (Mai Tai XF, Spectra Physics, Milpitas, CA, USA) operated with a 100 fs pulse at a repetition rate of 80 MHz was used for the horizontal imaging of the skin based on TPE. A drop of immersion oil (Immersol™ 518F, Carl Zeiss Jena GmbH, Oberkochen, Germany) was placed between the objective and the objective ring with glass (No.1, 18 mm, VWR, Darmstadt, Germany) along with a drop of water between the glass and the skin to provide refraction-index matching. A bandpass filter (410–680 nm) was used to detect the fluorescence signal after TPE at a wavelength of 760 nm. In addition, the TPT has a 375–385 nm bandpass filter for the detection of the second-harmonic generation (SHG) signal. The lateral and axial resolutions of the TPT-FLIM are approximately 0.5 μm and 1.2–2.0 μm, respectively, with a horizontal scan field of up to 350 μm × 350 μm and a vertical field of up to 200 μm and a numerical aperture of the objective of 1.3 [76]. The acquisition time to record one image was 6.8 s with a scan field of 75 μm × 75 μm. Stack images were acquired at 4 μm increments from the skin surface to a depth of 32 μm. The laser power was adjusted experimentally depending on the fluorophore applied on the skin regarding the imaging depth (Table 1).
The TPE-FLIM data were processed and analyzed using SPCImage software version 8.4 (Becker & Hickl, Berlin, Germany). The fluorescence lifetime decay was determined in each pixel of the skin images using a bi-exponential function and the maximum likelihood estimation method. The fast lifetime and amplitude decay components are τ 1 ,   α 1 ; the slow ones are τ 2 ,   α 2 . The amplitude-weighted mean fluorescence lifetime τ m was defined as shown in Equation (1):
τ m = α 1 τ 1 + α 2 τ 2 / α 1 + α 2
The fluorescence lifetime decay was averaged over the 48 neighboring pixels using a binning value of 3. The TPE-FLIM parameters of each image were exported using SPCImage software and the data were analyzed using Microsoft Excel 2019 to create parameter-depth charts. The utilized TPT-FLIM was described in detail by our group [29,50].

2.6. Confocal Laser Scanning Microscopy

A confocal laser scanning microscope (VivaScope® 1500, Multilaser, MAVIG, Munich, Germany) was used in fluorescent mode for one-photon excitation. The system is equipped with three laser diodes (488, 685 and 785 nm) and an objective with a numerical aperture of 0.9. In this study, the 488 nm wavelength was chosen to investigate the skin in the fluorescent mode. A drop of immersion oil (Crodamol STS, Croda Inc., Snaith, UK) was applied between the skin and the ring glass (adhesive window with crosshair, Lucid Vision Labs GmbH, Ilsfeld, Germany). Ultrasonic gel (Aquasonic 100, Parker laboratories Inc., Fairfield, CT, USA) was placed between the objective and the objective ring glass to maintain the optical contact. The utilized LSM system was described previously by our group [77,78].
Stack images (500 μm × 500 μm) were made at 1.5 μm increments from the skin surface down to approximately 80 μm depth. The laser power was fixed at 5 mW for the treated and untreated skin, aiming at comparing the fluorescence intensities. Using ImageJ 1.53K software (Wayne Rasband, National Institute of Health, Bethesda, MD, USA), an area of 188 μm × 188 μm was selected on a fixed position of the images from the sample surface down to approximately 80 μm. The mean gray values of the selected areas were measured and then averaged at the corresponding depth.

2.7. Tape Stripping (TS) and UV/VIS Spectroscopy Measurements

The TS method was used to study the penetration of NaFl into porcine ear skin. A 72 μL quantity of the NaFl was applied onto a 6 cm × 6 cm area of each skin sample for 30 min, then the rest of the solution was removed. Adhesive tapes (Tesa®, No. 5529, Beiersdorf AG, Hamburg, Germany) were pressed onto the skin using a rubber roller weight of 746 g and rolled 5 times without external pressure; then the tape was removed with one swift movement. Following the method described by Jacobi et al. [79], approx. 84% of the SC was removed after 30 tapes had been stripped from the same area.
The tape strips were cut to a size of 1.9 cm × 3.4 cm and the fluorescein on them was extracted by solving each of them in 6.46 mL ethanol (Uvasol® Ethanol 99.9%, Merck KGaA, Darmstadt, Germany) using an ultrasonic bath, then purified by centrifuge (MR 1812, Jouan GmbH, Unterhaching, Germany). The extract was decanted in a UV cuvette using a pipette and the absorbance was measured by a spectroscope (Lambda 650S, PerkinElmer, Frankfurt/Main, Germany) at 480 nm for the detection of NaFl.

2.8. Confocal Raman Micro-Spectroscopy (CRM)

Raman spectra were recorded using a skin-composition analyzer (Model 3510 SCA, River D International B.V., Rotterdam, The Netherlands) and CRM measurements were performed on the same 6 porcine ear-skin samples which had been used for the UV/VIS spectroscopy measurements. The fingerprint Raman spectra (400–2000 cm−1) were recorded from the skin surface down to a depth of 40 μm with a step size of 2 μm. The acquisition time was 5 s/spectrum, the excitation wavelength was 785 nm, and the maximal power at the surface was set to 20 mW. For each skin sample, 10 different points were measured. The semiquantitative concentration profiles of NaFl in the SC were determined for each measurement point using the unconstrained multiple least square fit method (available in the SkinTools software developed by RiverD International B.V.) [80] and averaged for further analysis. The utilized CRM was described previously by our group [27].

3. Results

TPT was used to determine the thickness of the SC based on the appearance of cells attributed to the stratum granulosum. On average, this was 16.0 ± 3.3 μm, which is consistent with data from the literature [3,75,81]. Thus, 16 μm was considered in the following results as the SC thickness.

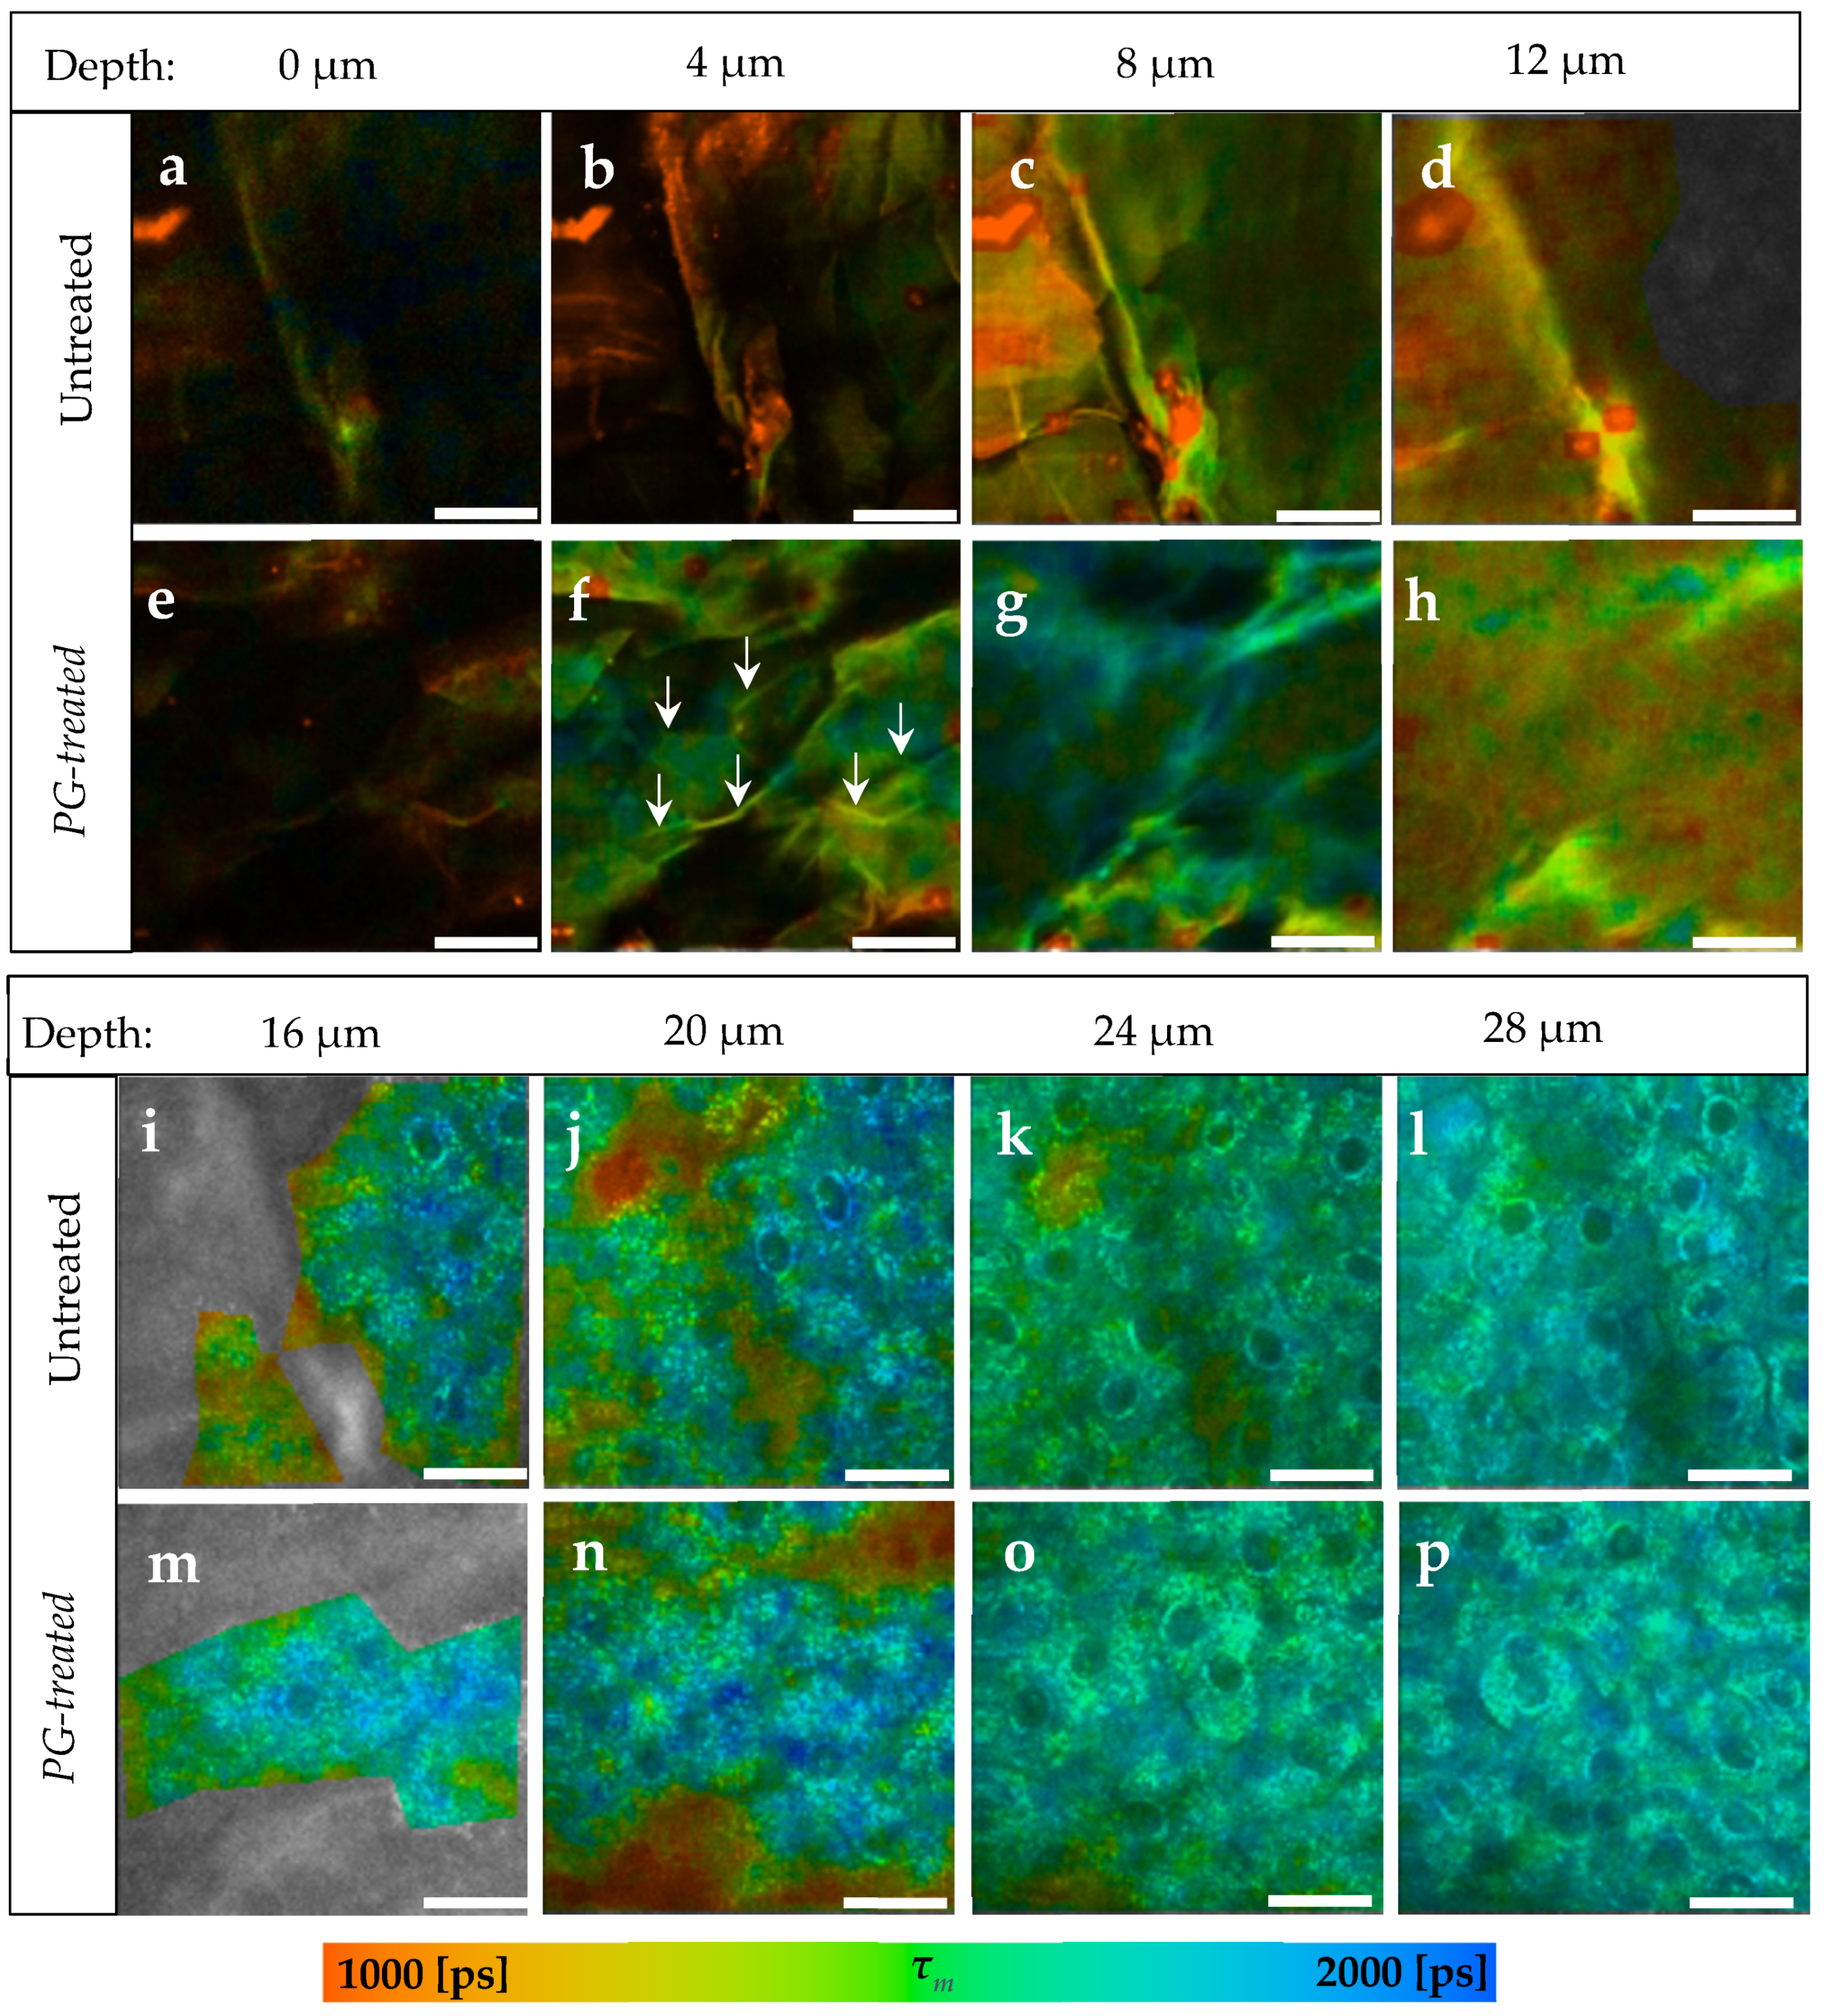
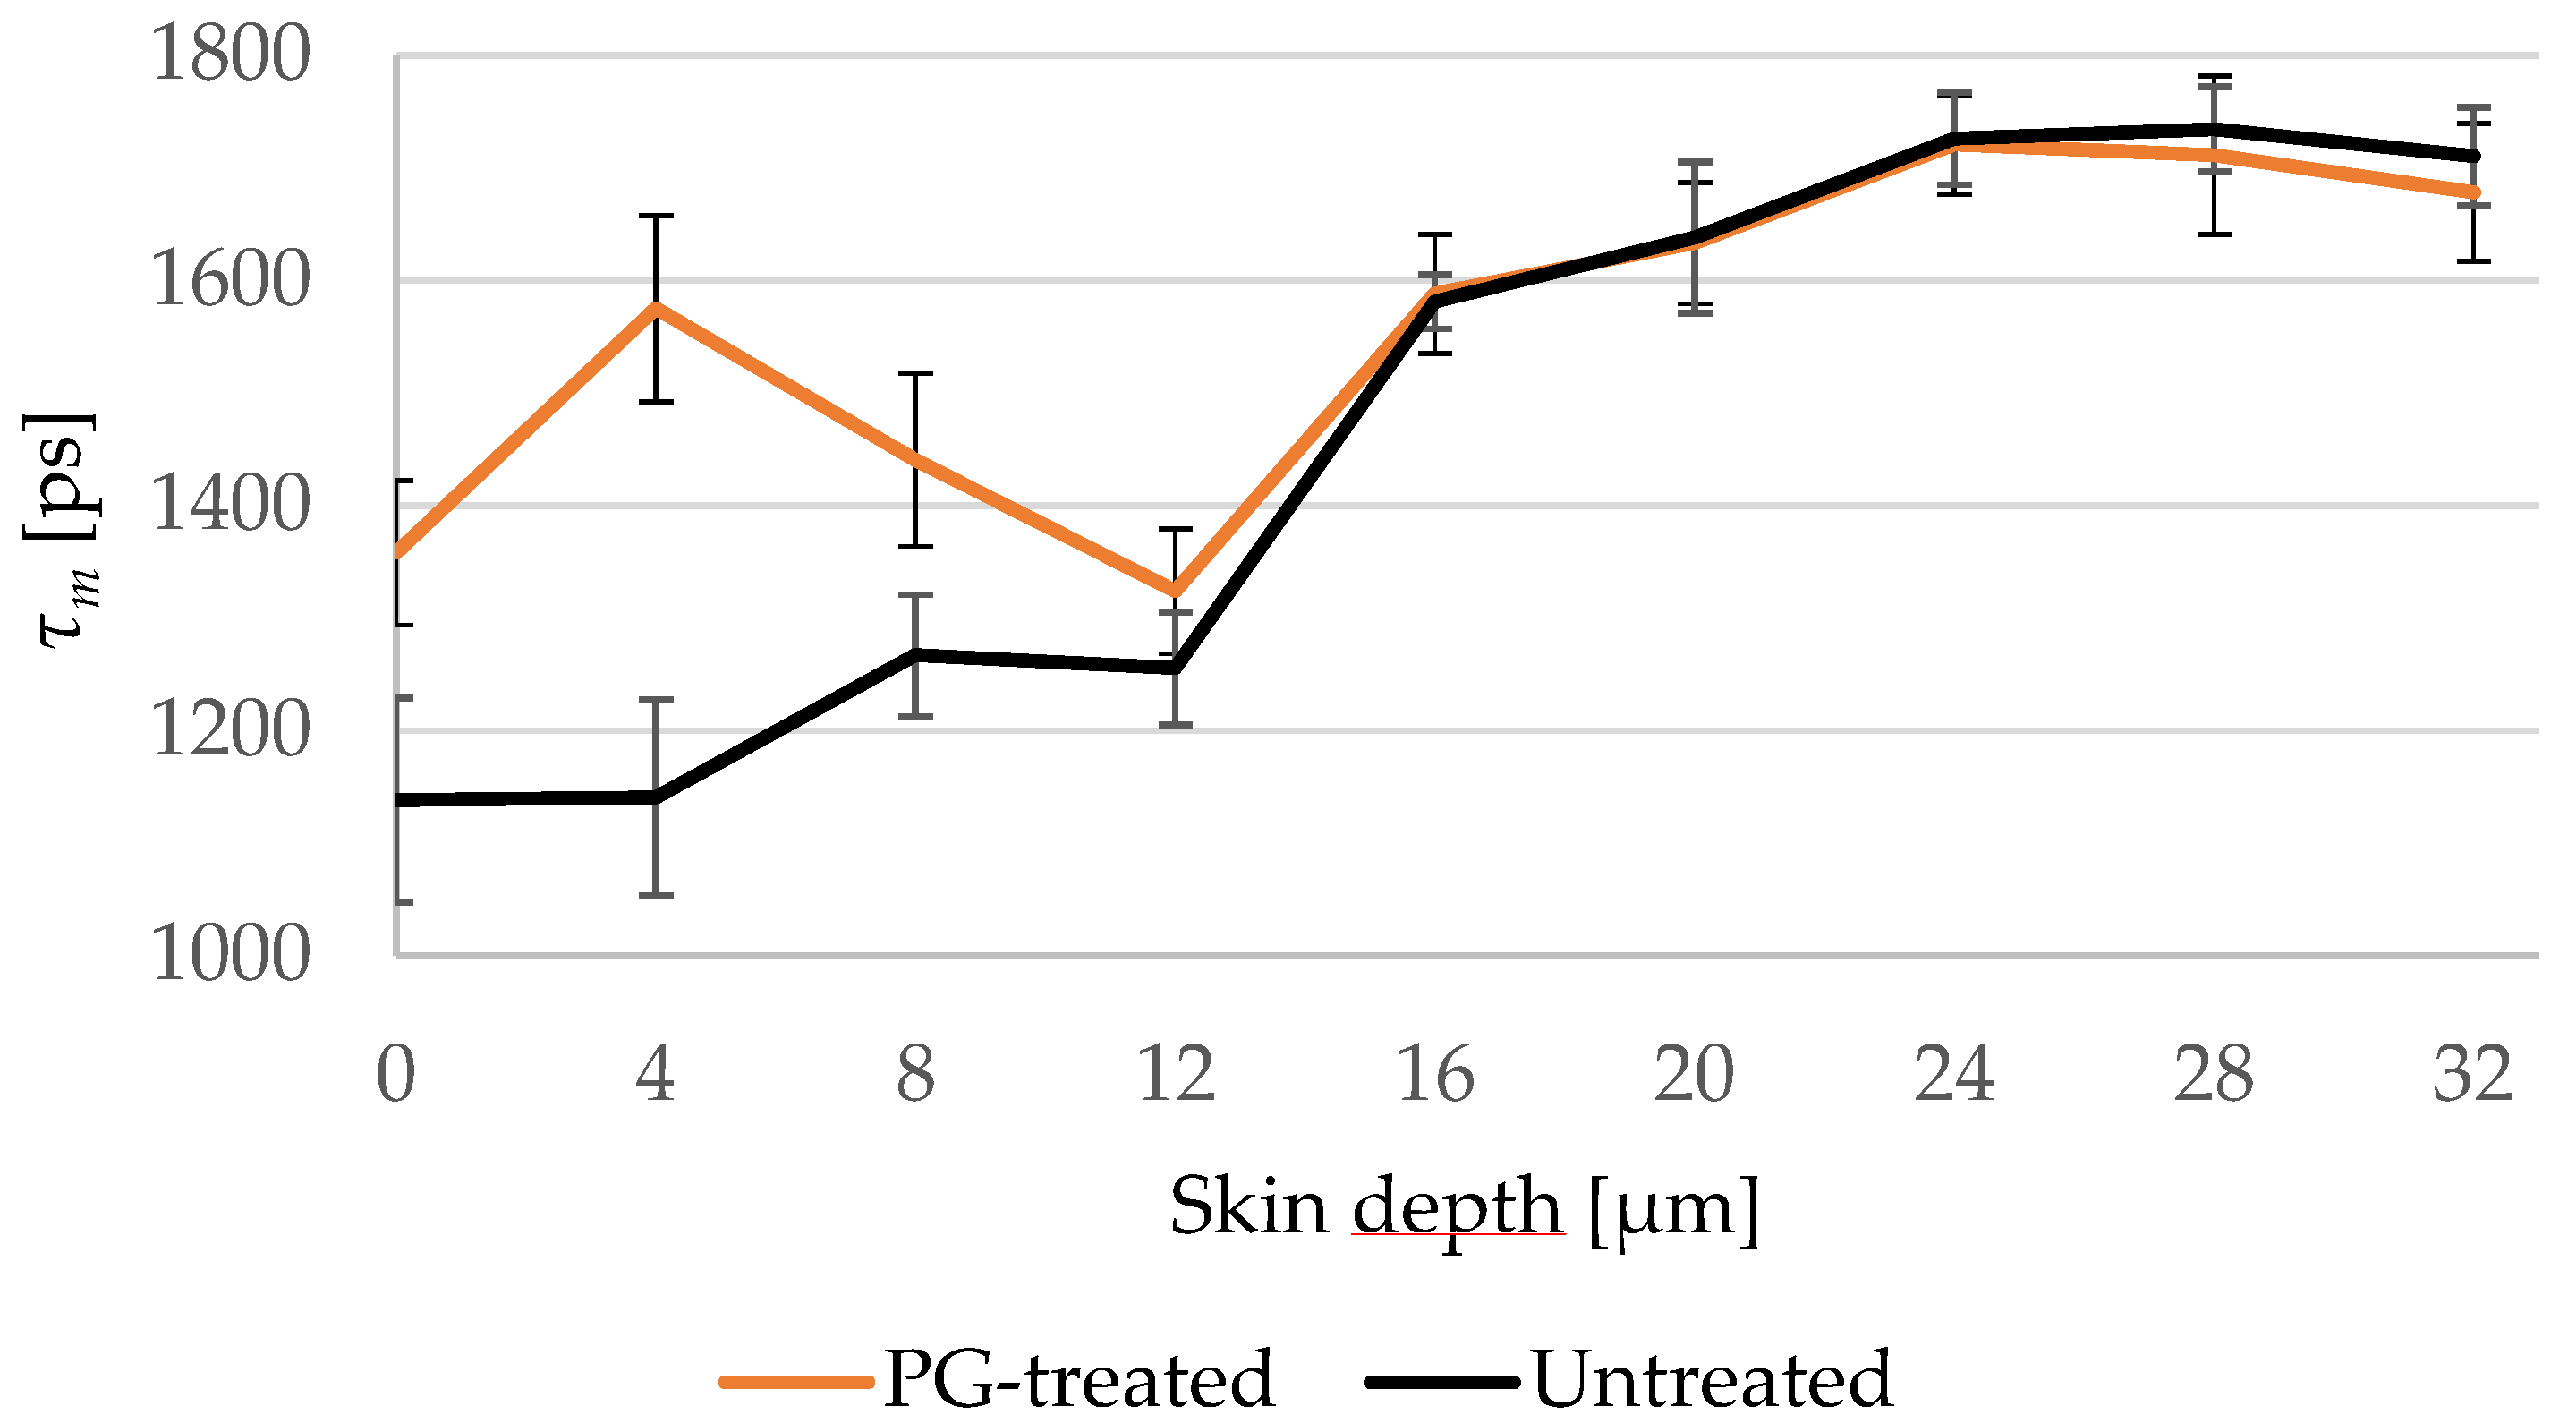
3.1. Penetration of PG

After applying 40 μL of PG on 2 cm × 2 cm skin sample, it was incubated for 30 min at a temperature of 32 °C. TPT-FLIM measurements were done starting from the skin surface down to a depth of 32 μm. PG has a pH = 7.30 ± 0.04, which is about 1 more than the skin surface of porcine ear [82]. Using pseudocolor scale of τm = 1000–2000 ps, a comparison between the TPE-FLIM images for untreated and PG-treated skin is shown in Figure 1 for different depths.
Generally, an increase in τm in the whole image down to a depth of 12 μm in SC was observed after the treatment with PG. In Figure 1f, τm was about 334 ± 65 ps longer in the corneocytes, while in the areas between them (Figure 1f, arrows) the increase in τm was about 280 ± 55 ps. Those areas were no more visible in the deeper SC, therefore it is assumed that those areas refer to the extracellular area separating the corneocytes. At 12 μm depth (Figure 1h), a small increase from τm = 1134 ± 87 ps to τm = 1278 ± 107 ps was measured.
Compared to the untreated skin in Figure 1i–l, τm of the viable epidermis was not affected after the treatment with PG (Figure 1m–p) showing a non-significant Δτm of only 14–40 ps.
TPE-FLIM parameters of both samples are presented in Table 2. τ1, τ2, and τm increased in the SC after the treatment with PG, while the relative amplitudes were not affected since no additional fluorophore was applied on the skin. At 16 μm depth, the viable epidermis starts and the differences in TPE-FLIM parameters disappear.
Furthermore, the penetration profile of PG in porcine ear skin using the average of τm for the six ears is shown in Figure 2. The penetration profile exhibited the same results shown in Figure 1, where PG was only detectable in the SC.

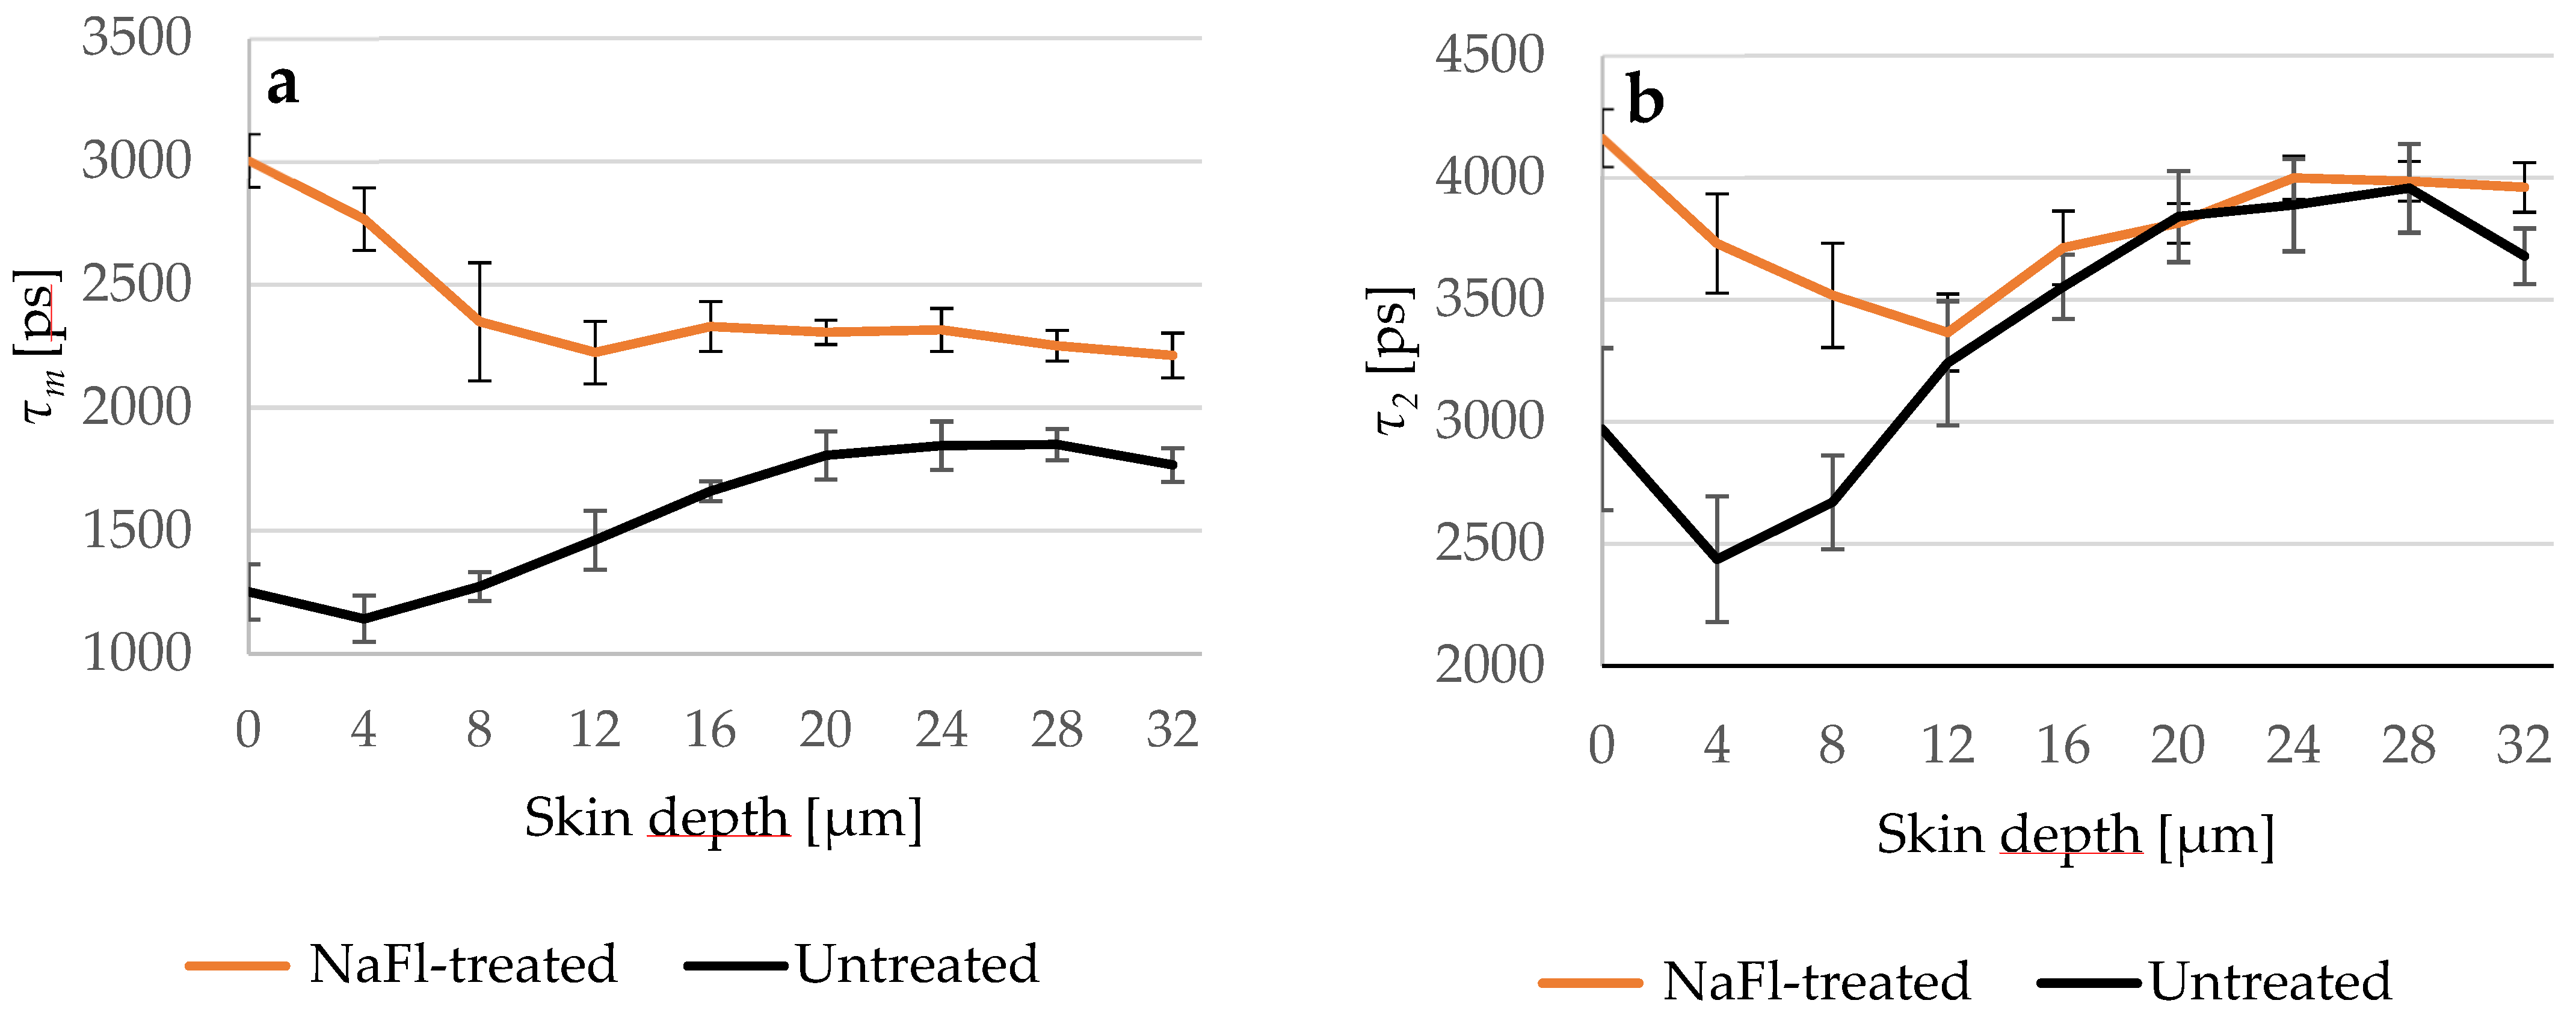
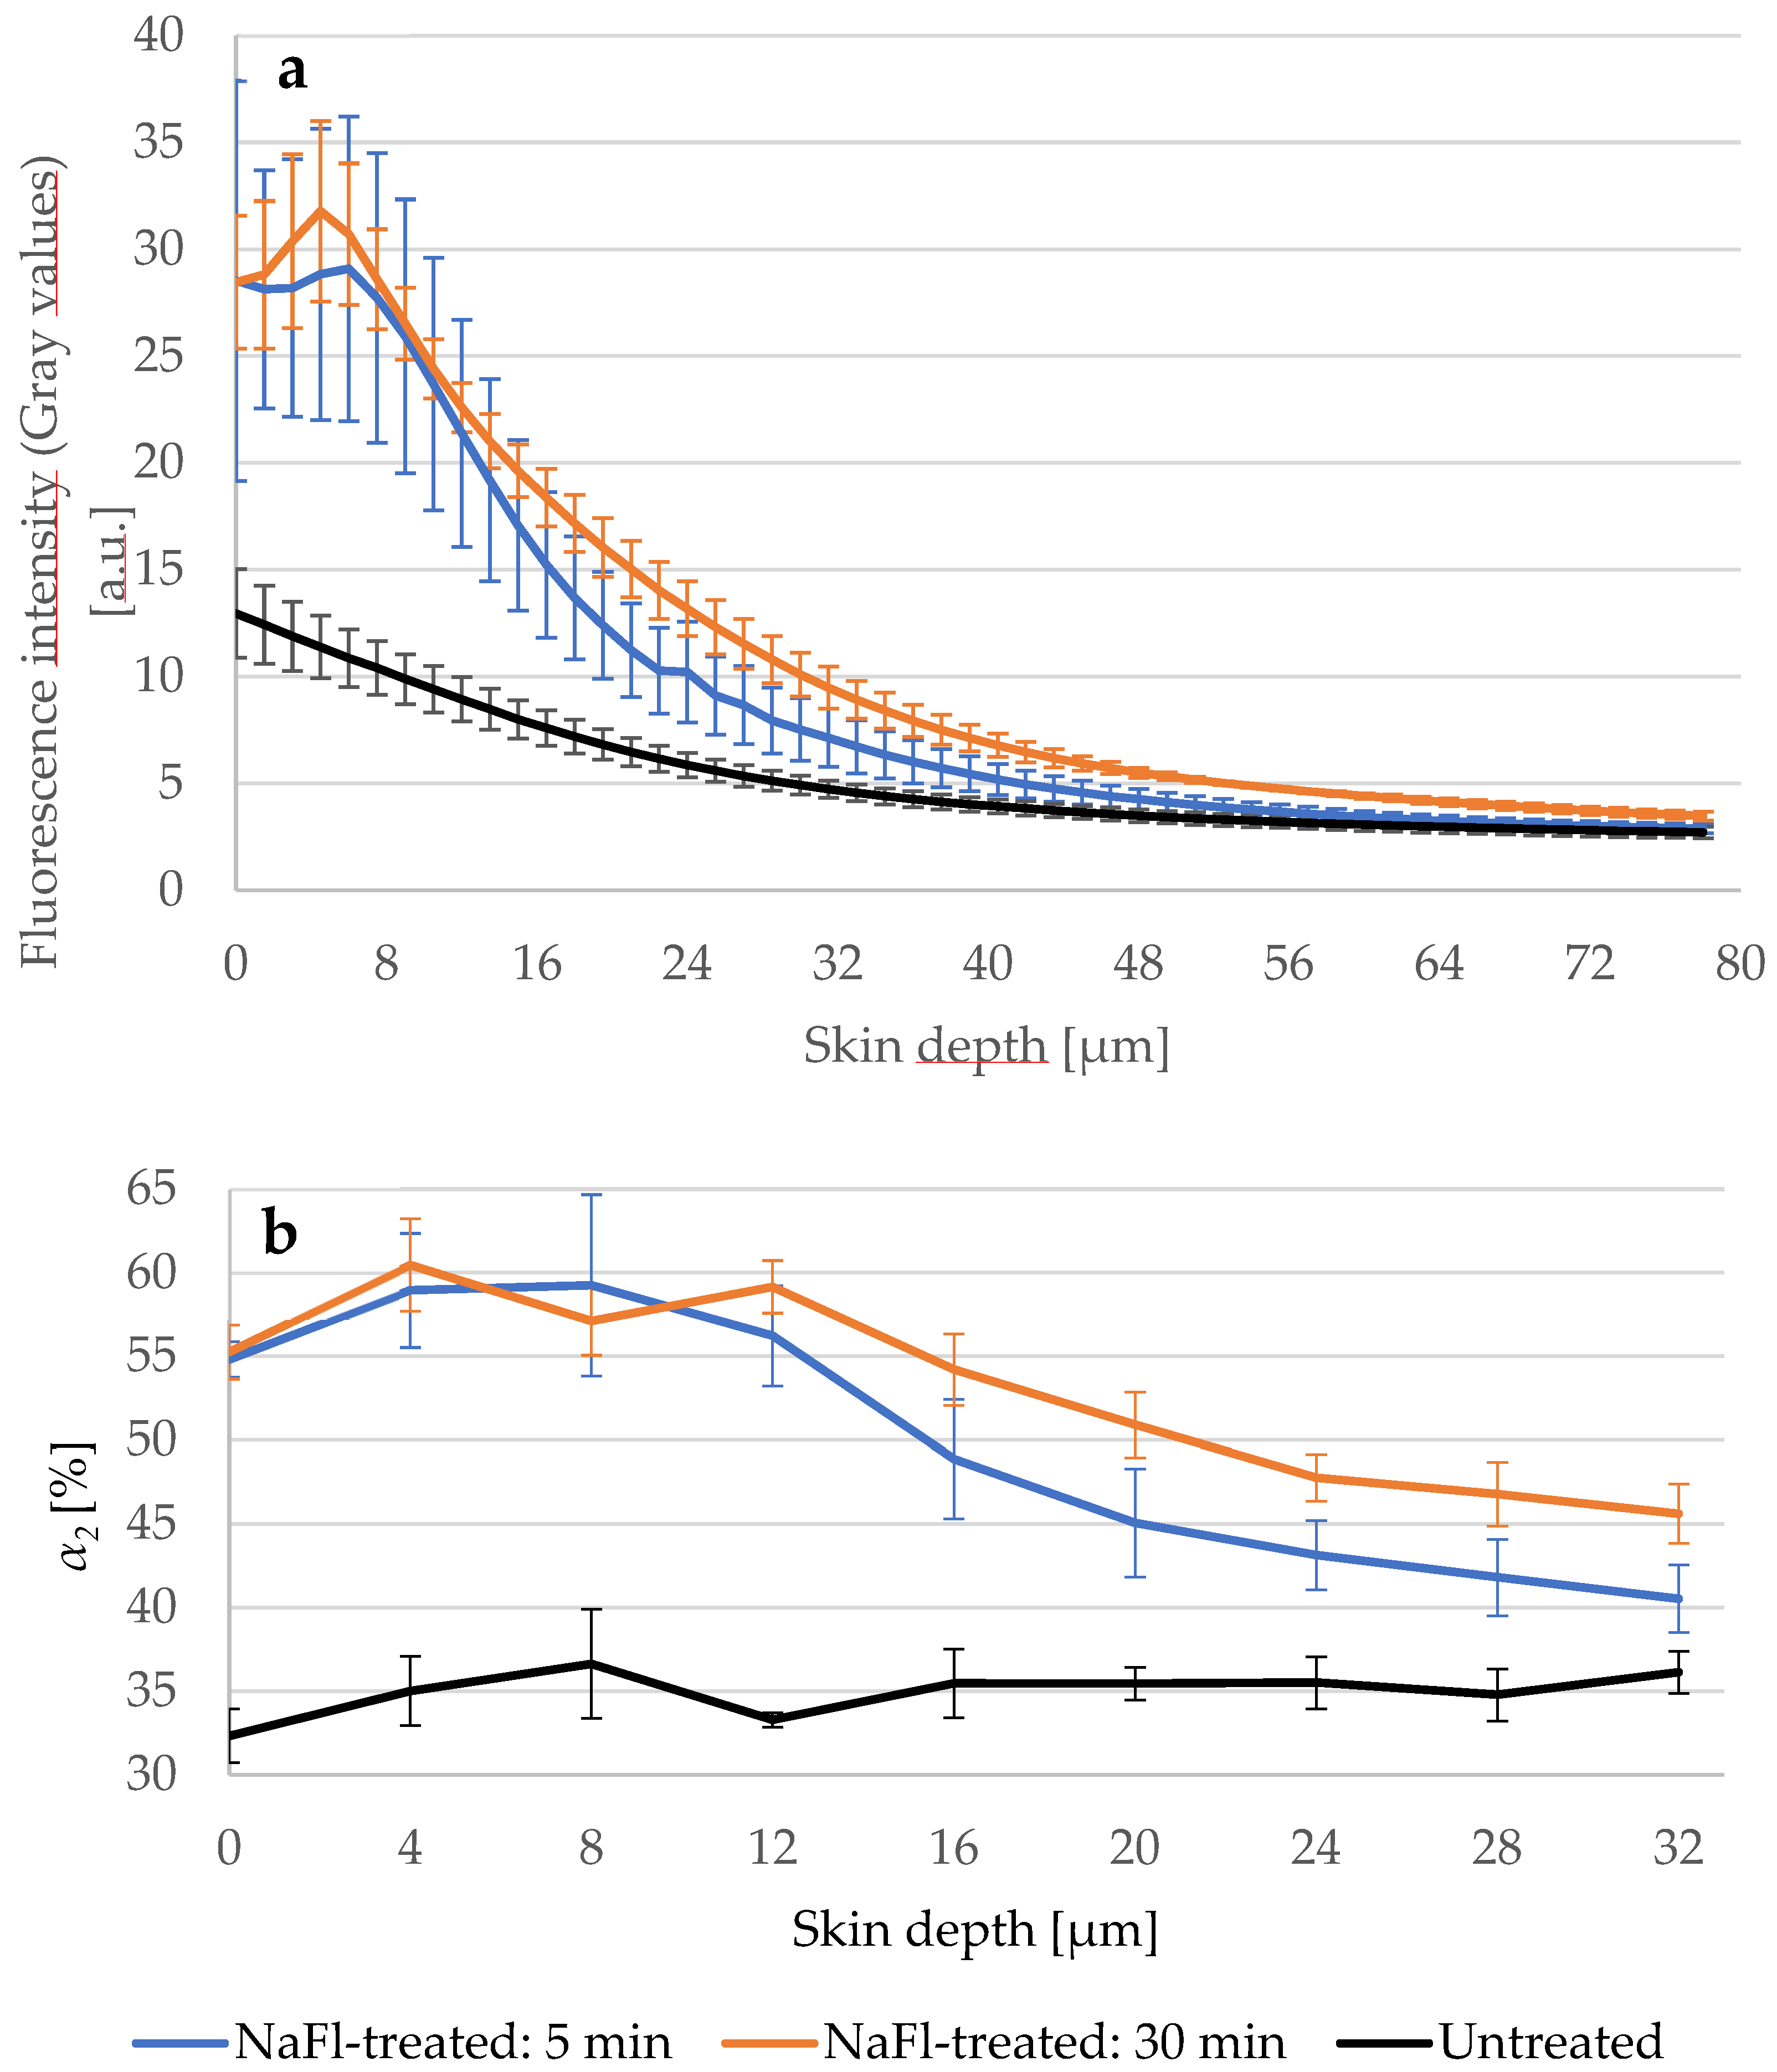
3.2. Penetration of NaFl Using TPE-FLIM and LSM

The fluorescence lifetime of the NaFl solution was measured by a single-exponential decay to be τ = 4090 ± 50 ps. The TPE-FLIM parameters of the untreated and the NaFl-treated skin were determined after a treatment time of 30 min and a TPE by 760 nm. Figure 3 shows the distribution of NaFl in the skin after treatment, where the τm of the SC increases on average from τm = 1522 ± 89 ps in the untreated sample (Figure 3a–d) to τm = 2725 ± 210 ps in the treated one (Figure 3e–h).
Furthermore, τm increased in the viable epidermis from τm = 1667 ± 69 ps in the untreated (Figure 3i–l) to τm = 2079 ± 42 ps in the NaFl-treated sample (Figure 3m–p). The TPE-FLIM parameters are shown in Table 3 for both skin samples. The fast and slow fluorescence lifetime components τ1 and τ2 had increased down to a depth of 16 μm, while τm and the relative amplitude α2 indicated an increase even in the viable epidermis till at least 32 μm depth. The fluorescence lifetime of the NaFl solution amounts to τ = 4090 ± 50 ps and is close to the τ2 of the viable epidermis of the untreated skin, which varied in a range of τ2 = (3553 ± 131)–(3956 ± 181) ps. Thus, τ1 and τ2 may not show a noticeable increment, but with their relative amplitudes α1 and α2 will, because they also represent the amount of the contributing fluorophores. This increase is therefore also detectable by τm because it is amplitude-weighted lifetime.
Figure 4 presents the different penetration profiles of NaFl based on τm and τ2 and it shows also that the influence of NaFl on the viable epidermis using τ2 as a representative TPE-FLIM parameter is not detectable.
To ensure that the penetration depth indicated by τm is correctly determined, we treated three skin samples of different porcine ears with NaFl and measured the fluorescence intensity of the untreated and treated samples via LSM. The treatment time was 5 min and 30 min at 32 °C. Figure 5a shows that the fluorescence intensity in the viable epidermis of the 5- and 30-min treated skin was higher compared to the untreated skin. On the other hand, the 30-min treated sample showed a higher intensity than the 5-min treated sample indicating that more NaFl reached the viable epidermis after a longer treatment time. This result was confirmed by the relative amplitude α2 (Figure 5b), which reflects the relative amount of the contributing fluorophores in τ2, which includes NaFl because it has a long fluorescence lifetime. In the viable epidermis from 16 μm to 32 μm depth, α2 was on average 5.2 ± 0.2% higher in the 30-min treated than in the 5-min treated sample.

3.3. Penetration of NaFl Using CRM and TS

Further experiments were performed to study the penetration depth of NaFl using TS and CRM methods. The thickness of the SC in the examined skin samples was 20 μm. The Raman spectrum of the NaFl is presented in Figure 6a and the corresponding penetration profiles of NaFl in the skin are shown in Figure 6b. Results obtained using CRM show the exponential decay: at 2 μm depth, the concentration of NaFl decreased from 100% to 58 ± 10% and to 21 ± 12% at 4 μm depth. At 8 μm, no signal was detected.
Regarding TS and the UV/VIS spectroscopy measurements, the absorbance of the extracted NaFl was measured at 460 nm and the recorded value of the first TS was considered as 100%, so the absorbance from the next TS was calculated as a corresponding percentage value. Within the first 2 μm, the absorbance fell from 100% to 27 ± 10% and at 4 μm to 3 ± 7%. At 4.5 μm depth, no more absorbance was measured. As shown in Figure 6b, the value of the penetration-depth profile obtained by CRM is higher than by TS.

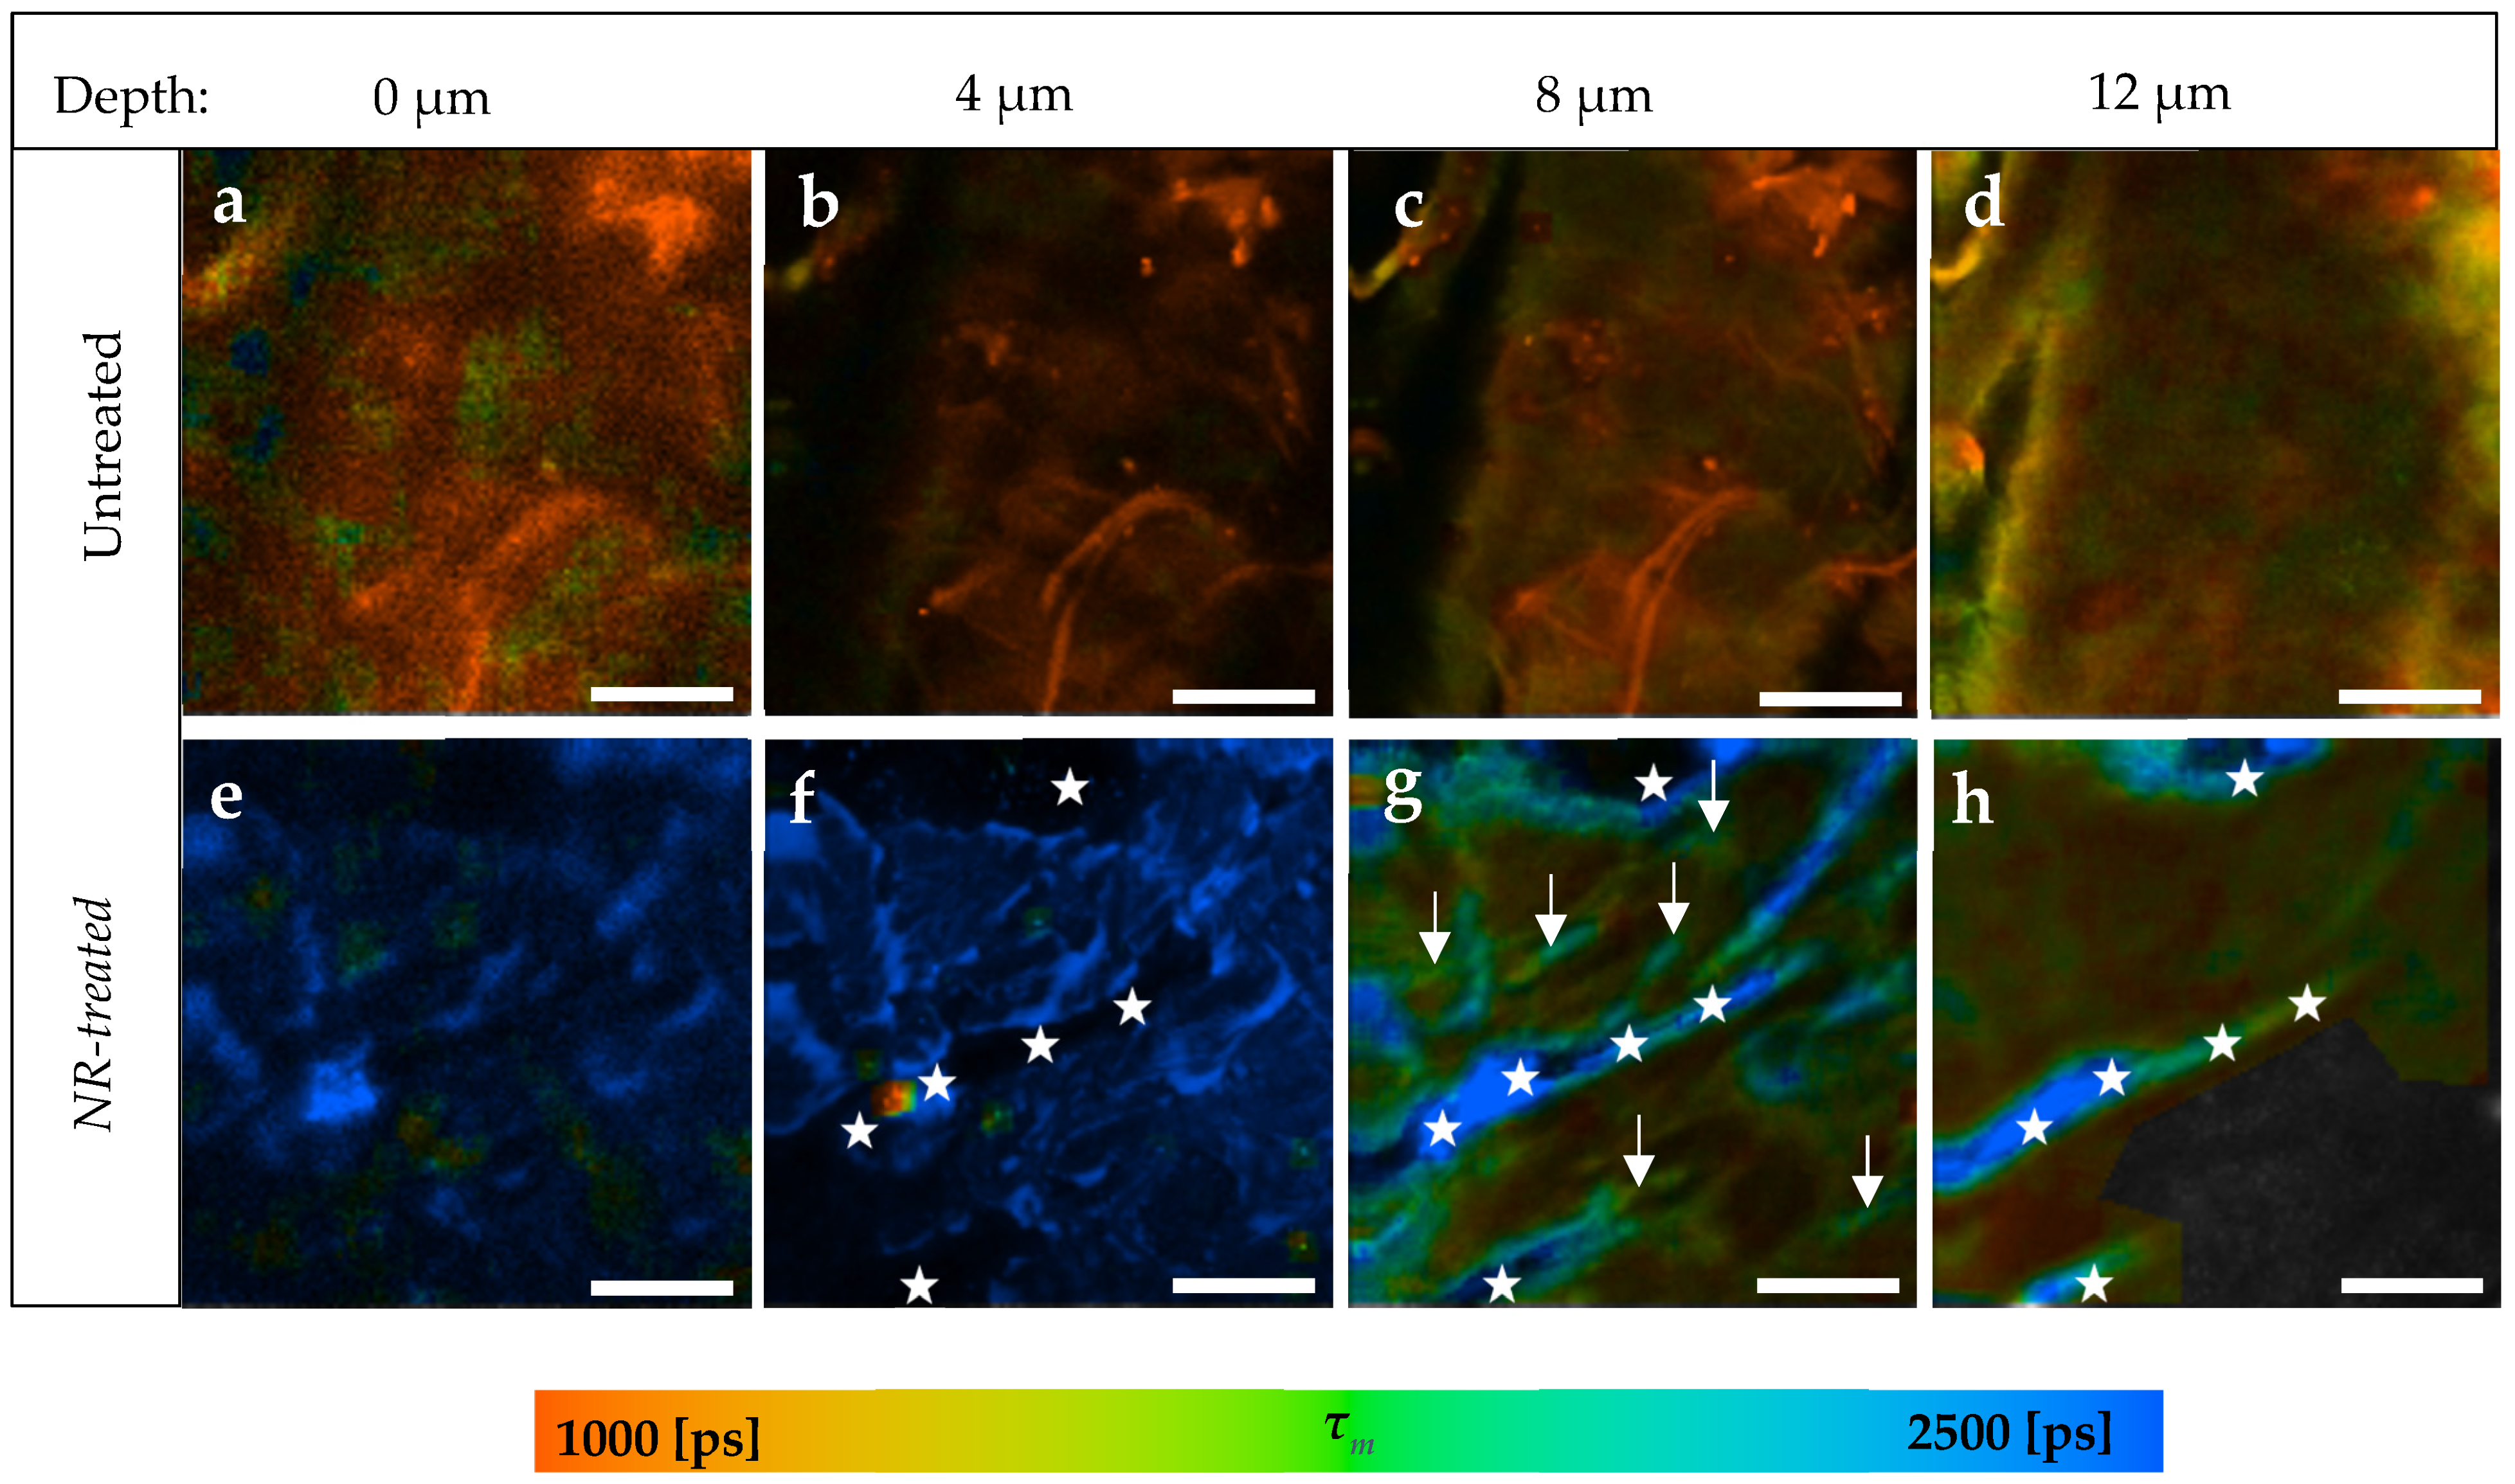
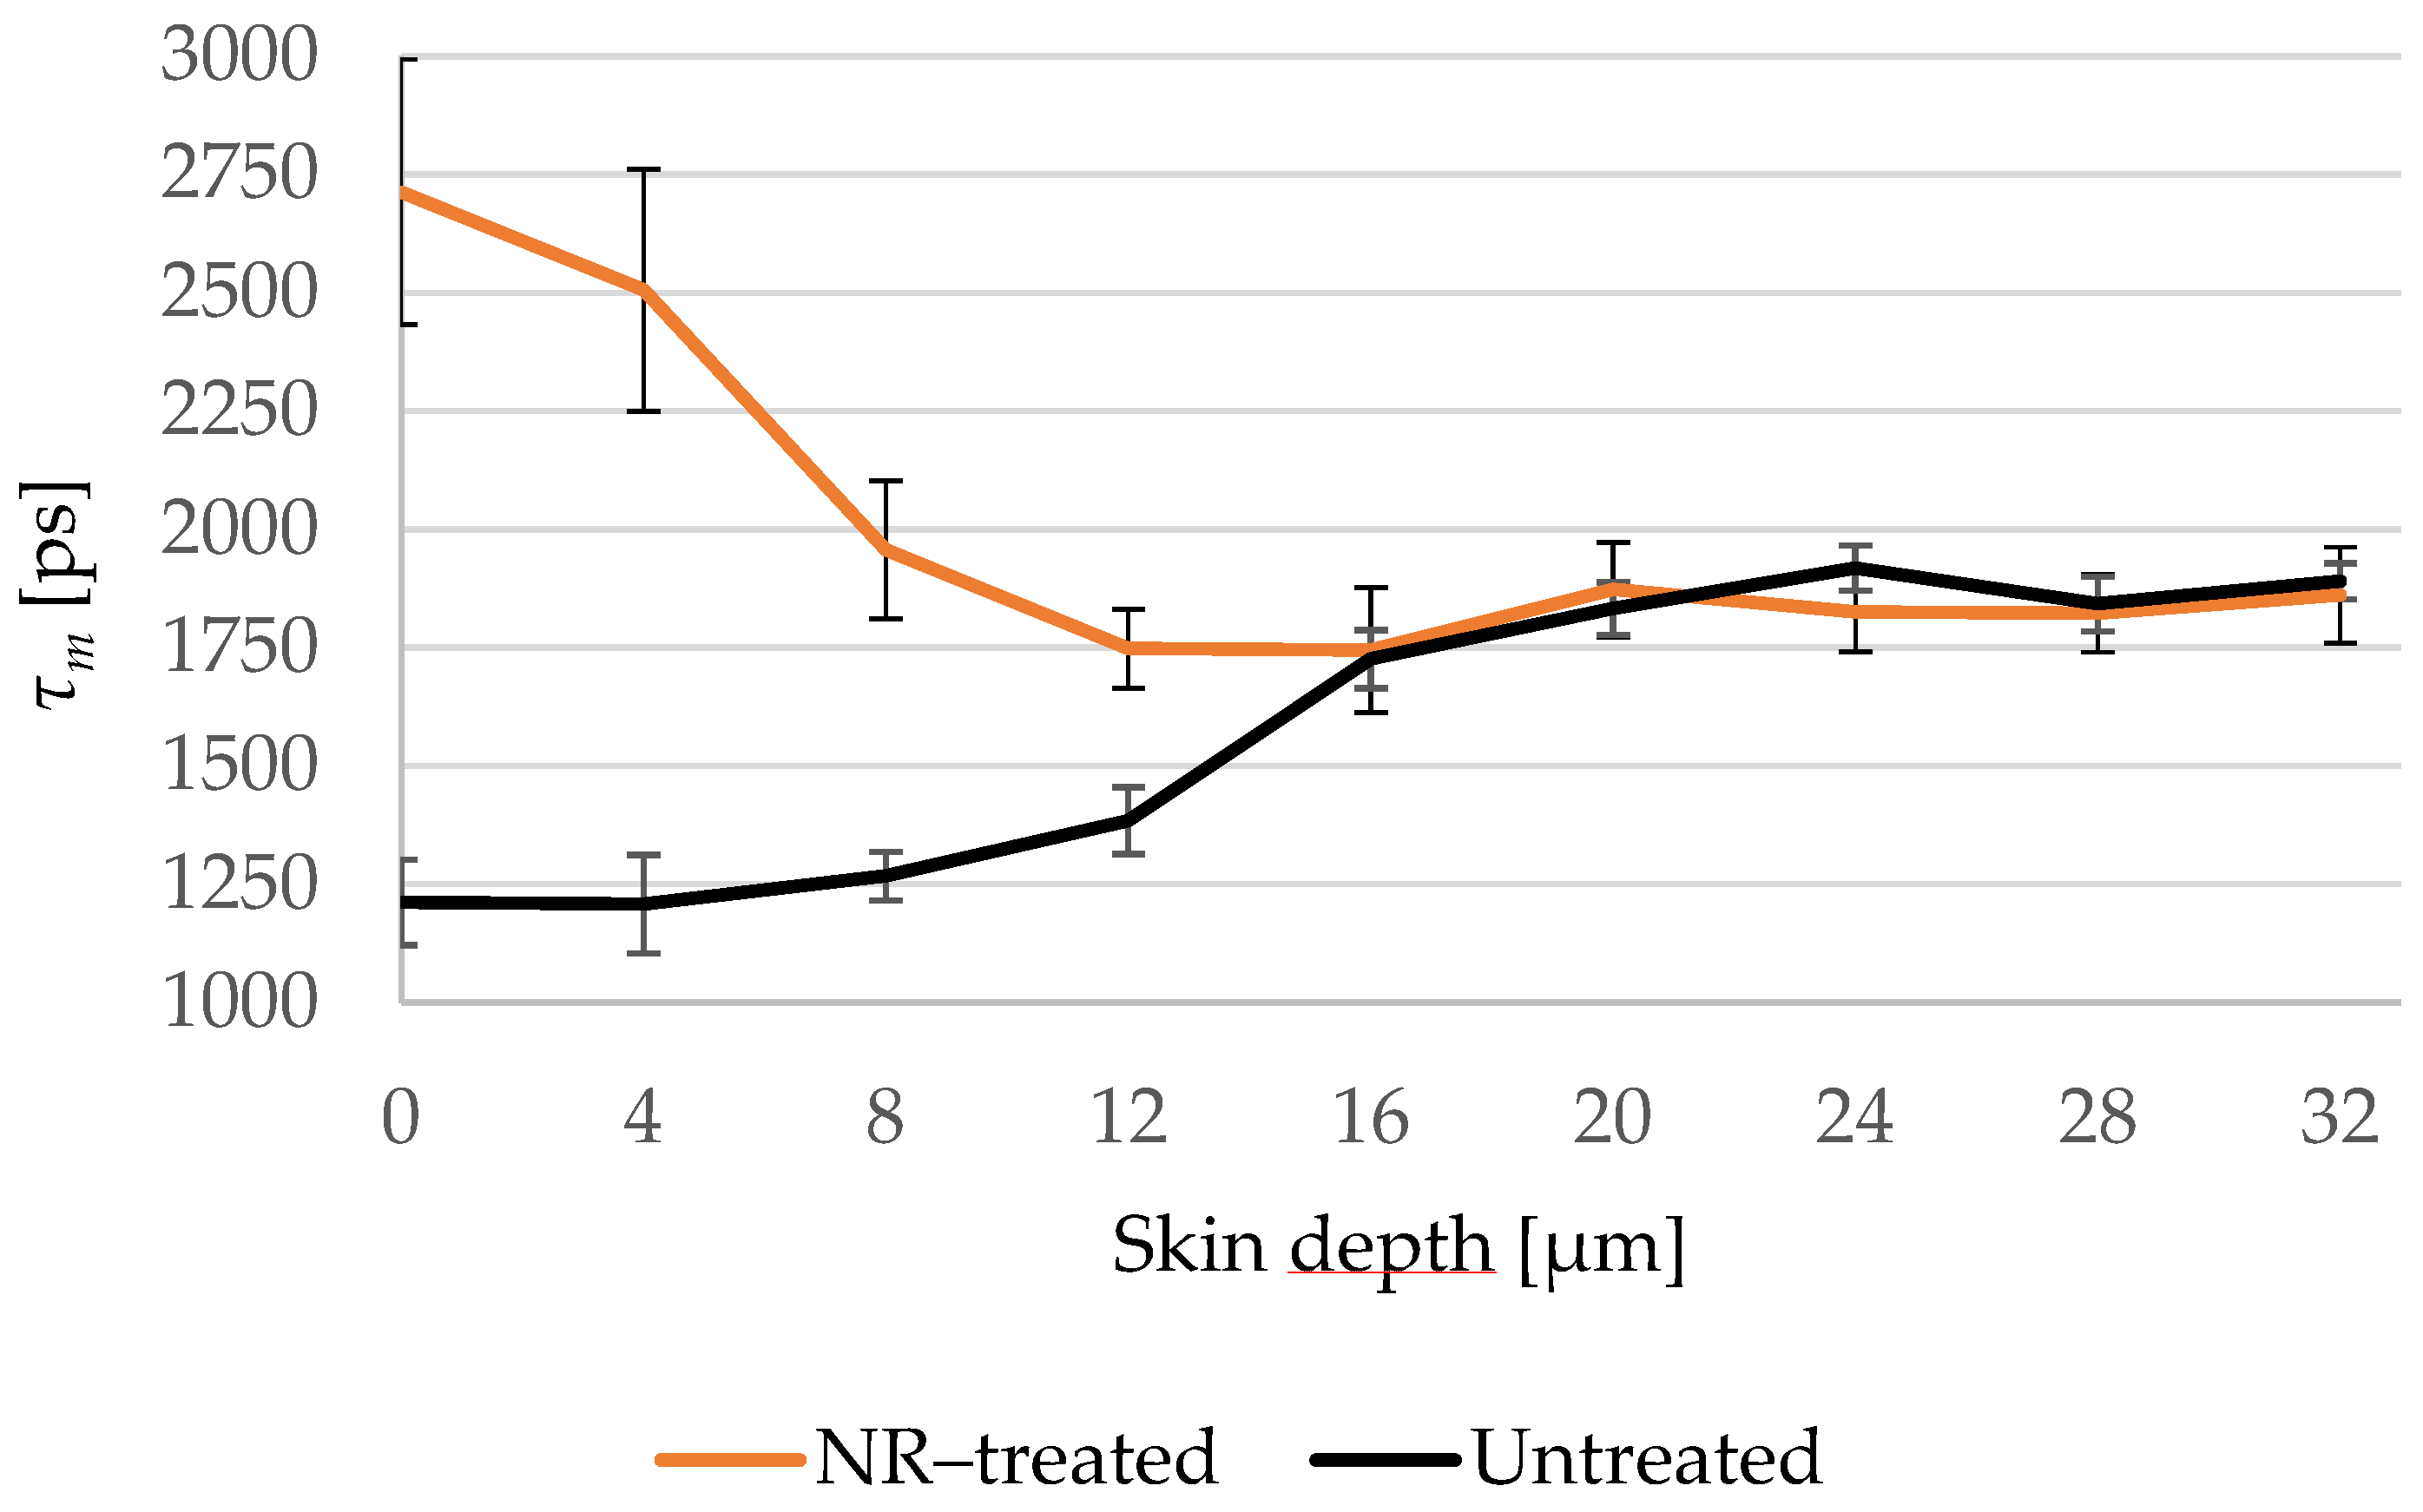
3.4. Penetration of NR

In the last part of this study, the penetration of the lipophilic NR in the skin was investigated. The prepared NR solution had a fluorescence lifetime τ = 3176 ± 53 ps calculated by single exponential decay after TPE at 760 nm. Figure 7a–d presents an example of the SC of an untreated skin sample compared to an NR-treated sample (Figure 7e–h) taken from the same porcine ear.
NR was found to penetrate only in the SC without being able to reach the viable epidermis. In the first 4 μm (Figure 7a,b,e,f), NR was distributed in the SC, inducing an average increment of about Δτm = 1963 ± 92 ps. Following this, the presence of NR was limited in specific areas of SC (Figure 7g, arrows), where τm = 1926 ± 29 ps, while the rest of the same image of treated skin showed τm = 1232 ± 35 ps.
The stars in Figure 7f refer to the background, as they are located on the black areas of the image. In Figure 7g,h, those areas are colored blue, because NR appears, thereby referring to the skin surface due to the furrows. Thus, stars’ locations were not considered as having been penetrated by NR at the corresponding depth.
The TPE-FLIM parameters are shown in Table 4. Significant differences in α1, α2, and τm were detected down to a depth of 12 μm, but only to an 8 μm depth in τ1 and τ2. The untreated skin had a fluorescence lifetime τ2 = 3155 ± 192 ps at 12 μm depth, which is similar to the fluorescence lifetime of NR solution with τ = 3176 ± 53 ps. Therefore, the presence of NR at this depth did not induce changes in τ2. However, the relative amplitude α2 increased at 12 μm from 32.4 ± 0.9% to 49.0 ± 1.6%. The viable epidermis started at around 16 μm, where all of the TPE-FLIM parameters were comparable in both skin samples.
The mean fluorescence lifetime τm was chosen to create the penetration profile of NR in the skin and Figure 8 shows that τm of the treated and untreated samples overlaps in the viable epidermis and hence NR did not permeate the SC.

4. Discussion

The penetration depth of three different substances—PG, NaFl and NR—into porcine ear skin ex vivo was evaluated non-invasively using TPE-FLIM. It was possible to study the penetration of a non-fluorescent substance like PG taking advantage of the dependence of TPE-FLIM on the environmental parameter, which in this study was the pH value.
PG shows no fluorescence at 760 nm, but its pH value is about 1 higher than the SC [83,84]. Thus, the pH-dependence of the fluorescence lifetime [35,36,37,85] was taken into account, aiming at proving the presence of PG indirectly through the influence of its pH value on the fluorescence lifetime of the endogenous fluorophores. Therefore, the FLIM-parameters τ1, τ2, and τm increased, which was shown in Table 2. Based on the TPE-FLIM images in Figure 1, the increase in τm was detected in the whole space of the SC images, thus PG affected the corneocytes and the extracellular region. This leads to the conclusion that PG penetrated transcellularly, passing the intra- and the intercellular penetration pathways in the SC, which is typical for lipophilic substances [1,65,86]. Nevertheless, PG could not be detected anymore in the viable epidermis, which starts at around 16 μm depth. Mujica Ascencio et al. [63] showed by using multivariate analysis of Raman spectra that PG can permeate the SC and reach the depth of max. 22.0 μm in the skin, where the thickness of SC was ≈18 μm. This penetration depth could not be precisely detected using TPE-FLIM because PG and the viable epidermis share the same pH value of pH ≈ 7.4 [82] and thus cannot induce further changes in its fluorescence lifetime, which can be explained by the limited sensitivity of TPE-FLIM method to the non-fluorescent PG.
For fluorescent dyes like NaFl and NR with τ= 4090 ± 50 ps and τ= 3176 ± 53 ps, respectively, τm was more suitable than τ1 and τ2 for studying the penetration depth, due to the similar values of τ2 in the viable epidermis and the fluorescence lifetime of both examined substances. In this case, the lifetime components of the untreated skin will overlap with the components of the treated skin and the presence of the exogenous fluorophore is detectable only when the relative amplitude is taken into consideration because this amplitude is sensitive to the relative amount of the fluorophores. The application of TPE-FLIM to study the penetration of zinc oxide nanoparticles was presented by Roberts et al. [57,87] and showed the limitation of TPE-FLIM due to the overlapping of the τ1 and τ2 of zinc oxide with the autofluorescence lifetime of the endogenous fluorophores. As a solution, they used appropriate emission-bandpass filters to exclude the emission and lifetime of specific endogenous fluorophores. In this study, we show that this limitation can be overcome without a bandpass filter by taking the relative amplitudes into account, because they reflect the proportion of τ1 and τ2. Thus, τm can distinguish between two samples that have similar fast and slow lifetime components but in different fractions.
NaFl reached the viable epidermis and diffused into it. This result was presented by the TPE-FLIM parameters shown in Table 3, excluding τ1 and τ2 for the reason mentioned above. The penetration depth was confirmed by fluorescence-intensity analysis using LSM, where the gray values of the intensity images were considered as fluorescence intensity. The fluorescence intensity was measured after 30 min of treatment with NaFl and was, e.g., at 40.5 μm depth I 30 min-treated =6.8 ± 0.5 a.u., while in the untreated skin I untreated= 3.9 ± 0.3 a.u. which refers to the presence of NaFl in the stratum spinosum. Furthermore, the same measurement was repeated on each skin sample after 5 min of treatment and the fluorescence intensity was I 5 min-treated =5.2 ± 0.7a.u., which is lower compared to 30 min of treatment but still higher than in the untreated skin. Consequently, NaFl is able to penetrate at least 40.5 μm into the epidermis within only 5 min, and more NaFl diffuses into the viable epidermis after 30 min. As the relative amplitude α2 reflects the relative amount of the contributing fluorophores in τ2, the parameter α2 was measured in the three samples. Again, more NaFl was detected in the viable epidermis after 30 min than after 5 min which is confirmed by LSM data.
The CRM data showed a smaller penetration depth of approximately 8 μm. However, with only approximately 4 μm, the penetration depth using TS and UV/VIS spectroscopy was the smallest compared to the other methods. According to these CRM and TS results, it can be concluded that NaFl does not permeate the SC, while it was detectable in the stratum spinosum down to at least 32 μm using TPE-FLIM, and until at least 40 μm using LSM. The differences in the results for TS, CRM, TPE-FLIM, and LSM could be attributed to differences in the sensitivity of each method. According to O’goshi and Serup [66], NaFl can hardly permeate through the SC. Further information about the penetration depth of NaFl applied topically onto the skin could not be found in the literature. However, in this study, we demonstrated deeper penetration into the viable epidermis using TPT-FLIM and LSM.
The hydrophilic NaFl penetrated via the transcellular pathway in the SC, as all points on the TPE-FLIM images of the SC (Figure 3e–h) indicate an increase in τm. In the viable epidermis, the structure of the keratinocytes was more apparent, where the lifetime of the intercellular region between the keratinocytes had increased more with τm = 2169 ± 20 ps (Figure 3o–p, arrows) compared to the keratinocytes with τm = 1918 ± 21 ps. This leads to the assumption that NaFl crossed the lipophilic barrier of the SC transcellularly and intercellularly and diffused into the hydrophilic viable epidermis, with a higher presence in the intercellular space of the viable epidermis. The intercellular penetration pathway of NaFl in the human viable epidermis was shown previously by Roberts et al. [87] who injected NaFl into the skin and investigated it using fluorescence-intensity images after TPE at 920 nm.
Based on the analysis of τm, NR was found not to permeate the SC. It is known that the fluorescence lifetime of NR depends on the polarity of its environment [70] as well as on the kind of lipids it is binding to. For example, cholesterol and phospholipids induce a longer lifetime of 4200 ps, while triglycerides induce a shorter lifetime of approx. 3000 ps [70,88,89]. The lipid content in the viable epidermis is small compared to the SC [90], but even if NR was present in the viable epidermis, it should have bound to those lipids and therefore induce a longer τm compared to the untreated skin. Thus, we conclude that NR did not reach the viable epidermis. In addition, the viable epidermis being a hydrophilic layer [91] with a water content of 60–70% [92] should prevent NR from penetration into the viable epidermis. Comparing to the literature, the penetration depth of NR solved in PG [93] as well as of NR gel [94] was examined using LSM. Both studies showed the same results: that NR does not reach the viable epidermis.
TPE-FLIM images of the NR-treated SC showed at 8 μm depth (Figure 7g, arrows) areas with longer τm = 1926 ± 92 ps compared to the rest of the image with τm = 1232 ± 35 ps. It is assumed that those areas refer to the lipid matrix in the intercellular penetration pathway, because the intercellular lipids should bind the NR molecules as shown by Talreja et al. [95] due to the strong lipophilicity of NR, thereby inducing a longer τm as we observed in this study. On this basis it can be summarized that NR penetrates into the SC through the lipophilic intercellular pathway, but does not permeate the SC.

5. Conclusions

The outcome of this study demonstrates that TPE-FLIM can be a powerful non-invasive method for skin-penetration studies. We have shown that TPE-FLIM is not limited to fluorescent dyes, but can also indirectly detect non-fluorescent substances depending on their influence on the molecular environment of the skin’s endogenous fluorophores. However, this influence may disappear if skin parameters, e.g., the pH differences between the SC and the viable epidermis, change. Furthermore, the study showed how the choice of the TPE-FLIM parameters can affect the evaluation of the penetration depth of fluorescent dyes, i.e., if the examined substance has a fluorescence lifetime, which is similar to one of the fluorescence-lifetime components (τ1 or τ2) and therefore the amplitude-weighted τm is proposed as a representative parameter for the penetration profile in the skin. Based on this study, we found that both PG and NR cannot permeate the SC and may penetrate at least 12 μm into the SC (SC thickness is 16.0 ± 3.3 μm), while NaFl reaches the viable epidermis down to a depth of at least 40 μm. In contrast, TS and CRM detected NaFl only in the superficial SC depth, and the observed differences are explained by the different sensitivity of the applied methods. PG and NaFl penetrate transcellularly as they are hydrophilic, and NR intercellularly due to its lipophilic property.

Author Contributions

Conceptualization, M.E.D.; methodology, J.L., I.B., M.C.M., and M.E.D.; validation, M.E.D., M.C.M., and J.L.; formal analysis, M.A., M.K., S.S., L.B., and J.L.; investigation, M.A., M.K., S.S., L.B., and M.E.D.; writing—original draft preparation, M.A.; writing—review and editing, M.K., S.S., L.B, J.L., I.B., M.C.M., and M.E.D.; visualization, M.A.; supervision, M.E.D.; project administration, M.E.D.; funding acquisition, M.C.M. All authors have read and agreed to the published version of the manuscript.

Funding

This research was funded by the Foundation of Skin and Physiology of the Donor Association for German Science and Humanities. The APC was funded by Charité-Universitätsmedizin Berlin and the German Research Foundation (DFG).

Institutional Review Board Statement

Freshly slaughtered pig ear skin without additional treatment was provided by a local butcher. Ethical approval was obtained from the Veterinary Board Dahme-Spreewald, Germany.

Informed Consent Statement

No applicable.

Data Availability Statement

The data are available from the corresponding author upon reasonable request.

Acknowledgments

We thank Heike Richter from Charité-Universitätsmedizin Berlin for her excellent technical support during achieving this work. We acknowledge financial support from the Open Access Publication Fund of Charité-Universitätsmedizin Berlin and the German Research Foundation (DFG).

Conflicts of Interest

The authors declare no conflict of interest. The funders had no role in the design of the study; in the collection, analyses, or interpretation of data; in the writing of the manuscript; or in the decision to publish the results.

References

  1. Ng, K.W.; Lau, W.M. Skin Deep: The Basics of Human Skin Structure and Drug Penetration. In Percutaneous Penetration Enhancers Chemical Methods in Penetration Enhancement; Springer: Berlin/Heidelberg, Germany, 2015; pp. 3–11. [Google Scholar] [CrossRef]
  2. Sterry, W. Kurzlehrbuch Dermatologie; Thieme: Stuttgart, Germany, 2018. [Google Scholar] [CrossRef]
  3. van Smeden, J.; Janssens, M.; Gooris, G.S.; Bouwstra, J.A. The Important Role of Stratum Corneum Lipids for the Cutaneous Barrier Function. Biochim. Et Biophys. Acta (BBA)-Mol. Cell Biol. Lipids 2014, 1841, 295–313. [Google Scholar] [CrossRef]
  4. Darvin, M.E.; Schleusener, J.; Lademann, J.; Choe, C.-S. Current Views on Non-Invasive in Vivo Determination of Physiological Parameters of the Stratum Corneum Using Confocal Raman Microspectroscopy. Ski. Pharmacol. Physiol. 2022, 35, 125–136. [Google Scholar] [CrossRef]
  5. Schmitt, T.; Neubert, R.H.H. State of the Art in Stratum Corneum Research. Part II: Hypothetical Stratum Corneum Lipid Matrix Models. Ski. Pharmacol. Physiol. 2020, 33, 213–230. [Google Scholar] [CrossRef]
  6. Sdobnov, A.; Darvin, M.E.; Lademann, J.; Tuchin, V. A Comparative Study of Ex Vivo Skin Optical Clearing Using Two-Photon Microscopy. J. Biophotonics 2017, 10, 1115–1123. [Google Scholar] [CrossRef]
  7. Choe, C.S.; Schleusener, J.; Lademann, J.; Darvin, M.E. Age Related Depth Profiles of Human Stratum Corneum Barrier-Related Molecular Parameters by Confocal Raman Microscopy in Vivo. Mech. Ageing Dev. 2018, 172, 6–12. [Google Scholar] [CrossRef]
  8. Verdier-Sévrain, S.; Bonté, F. Skin Hydration: A Review on Its Molecular Mechanisms. J. Cosmet. Dermatol. 2007, 6, 75–82. [Google Scholar] [CrossRef]
  9. Tampucci, S.; Burgalassi, S.; Chetoni, P.; Monti, D. Cutaneous Permeation and Penetration of Sunscreens: Formulation Strategies and in Vitro Methods. Cosmetics 2018, 5, 1. [Google Scholar] [CrossRef]
  10. Trommer, H.; Neubert, R.H.H. Overcoming the Stratum Corneum: The Modulation of Skin Penetration. A Review. Skin Pharmacol. Physiol. 2006, 19, 106–121. [Google Scholar] [CrossRef]
  11. Alkilani, A.Z.; Nasereddin, J.; Hamed, R.; Nimrawi, S.; Hussein, G.; Abo-Zour, H.; Donnelly, R.F. Beneath the Skin: A Review of Current Trends and Future Prospects of Transdermal Drug Delivery Systems. Pharmaceutics 2022, 14, 1152. [Google Scholar] [CrossRef]
  12. Williams, A.C.; Barry, B.W. Penetration Enhancers. Adv. Drug Deliv. Rev. 2004, 56, 603–618. [Google Scholar] [CrossRef]
  13. Lademann, J.; Richter, H.; Schanzer, S.; Meinke, M.C.; Darvin, M.E.; Schleusener, J.; Carrer, V.; Breuckmann, P.; Patzelt, A. Follicular Penetration of Nanocarriers Is an Important Penetration Pathway for Topically Applied Drugs. Hautarzt 2019, 70, 185–192. [Google Scholar] [CrossRef] [PubMed]
  14. Supe, S.; Takudage, P. Methods for Evaluating Penetration of Drug into the Skin: A Review. Ski. Res. Technol. 2021, 27, 299–308. [Google Scholar] [CrossRef]
  15. Lubda, M.; Zander, M.; Salazar, A.; Kolmar, H.; von Hagen, J. Lateral Dermal Penetration Is Dependent on the Lipophilicity of Active Ingredients. Ski. Pharmacol. Physiol. 2022, 35, 235–245. [Google Scholar] [CrossRef]
  16. Lakner, P.H.; Monaghan, M.G.; Möller, Y.; Olayioye, M.A.; Schenke-Layland, K. Applying Phasor Approach Analysis of Multiphoton FLIM Measurements to Probe the Metabolic Activity of Three-Dimensional in Vitro Cell Culture Models. Sci. Rep. 2017, 7, 42730. [Google Scholar] [CrossRef]
  17. Darvin, M.E.; Richter, H.; Zhu, Y.J.; Meinke, M.C.; Knorr, F.; Gonchukov, S.A.; Koenig, K.; Lademann, J. Comparison of in Vivo and Ex Vivo Laser Scanning Microscopy and Multiphoton Tomography Application for Human and Porcine Skin Imaging. Quantum Electron. 2014, 44, 646–651. [Google Scholar] [CrossRef]
  18. Choe, C.S.; Schleusener, J.; Lademann, J.; Darvin, M.E. Human Skin in vivo Has a Higher Skin Barrier Function than Porcine Skin Ex Vivo—Comprehensive Raman Microscopic Study of the Stratum Corneum. J. Biophotonics 2018, 11, e201700355. [Google Scholar] [CrossRef]
  19. Klein, A.L.; Lubda, M.; Specht, D.; Pyo, S.M.; Busch, L.; Lademann, J.; Meinke, M.C.; Beckers, I.; von Hagen, J.; Keck, C.M.; et al. Microdialysis on Ex Vivo Porcine Ear Skin Can Validly Study Dermal Penetration Including the Fraction of Transfollicular Penetration—Demonstrated on Caffeine Nanocrystals. Nanomaterials 2021, 11, 2387. [Google Scholar] [CrossRef] [PubMed]
  20. Lubda, M.; Zander, M.; Salazar, A.; Kolmar, H.; Von Hagen, J. Comparison of Membrane Depth Determination Techniques for Active Ingredient Skin Penetration Studies Using Microdialysis. Ski. Pharmacol. Physiol. 2021, 34, 203–213. [Google Scholar] [CrossRef]
  21. Czaika, V.; Alborova, A.; Richter, H.; Sterry, W.; Vergou, T.; Antoniou, C.; Lademann, J.; Koch, S. Comparison of Transepidermal Water Loss and Laser Scanning Microscopy Measurements to Assess Their Value in the Characterization of Cutaneous Barrier Defects. Skin Pharmacol. Physiol. 2011, 25, 39–46. [Google Scholar] [CrossRef]
  22. Dong, P.; Nikolaev, V.; Kröger, M.; Zoschke, C.; Darvin, M.E.; Witzel, C.; Lademann, J.; Patzelt, A.; Schäfer-Korting, M.; Meinke, M.C. Barrier-Disrupted Skin: Quantitative Analysis of Tape and Cyanoacrylate Stripping Efficiency by Multiphoton Tomography. Int. J. Pharm. 2020, 574, 118843. [Google Scholar] [CrossRef]
  23. Xu, C.; Wang, X.; Pramanik, M. Imaging Technologies and Transdermal Delivery in Skin Disorders; John Wiley & Sons: Hoboken, NJ, USA, 2019; pp. 1–480. [Google Scholar] [CrossRef]
  24. Dancik, Y.; Favre, A.; Loy, C.J.; Zvyagin, A.V.; Roberts, M.S. Use of Multiphoton Tomography and Fluorescence Lifetime Imaging to Investigate Skin Pigmentation in Vivo. J. Biomed. Opt. 2013, 18, 026022. [Google Scholar] [CrossRef] [PubMed]
  25. Lademann, J.; Patzelt, A.; Darvin, M.; Richter, H.; Antoniou, C.; Sterry, W.; Koch, S. Application of Optical Non-Invasive Methods in Skin Physiology. Laser Phys. Lett. 2008, 5, 335–346. [Google Scholar] [CrossRef]
  26. Zsikó, S.; Csányi, E.; Kovács, A.; Budai-Szűcs, M.; Gácsi, A.; Berkó, S. Methods to Evaluate Skin Penetration in Vitro. Sci. Pharm. 2019, 87, 19. [Google Scholar] [CrossRef]
  27. Darvin, M.E.; Meinke, M.C.; Sterry, W.; Lademann, J. Optical Methods for Noninvasive Determination of Carotenoids in Human and Animal Skin. J. Biomed. Opt. 2013, 18, 061230. [Google Scholar] [CrossRef]
  28. Pena, A.M.; Chen, X.; Pence, I.J.; Bornschlögl, T.; Jeong, S.; Grégoire, S.; Luengo, G.S.; Hallegot, P.; Obeidy, P.; Feizpour, A.; et al. Imaging and Quantifying Drug Delivery in Skin—Part 2: Fluorescence Andvibrational Spectroscopic Imaging Methods. Adv. Drug Deliv. Rev. 2020, 153, 147–168. [Google Scholar] [CrossRef]
  29. Zhu, Y.; Choe, C.-S.; Ahlberg, S.; Meinke, M.C.; Alexiev, U.; Lademann, J.; Darvin, M.E. Penetration of Silver Nanoparticles into Porcine Skin Ex Vivo Using Fluorescence Lifetime Imaging Microscopy, Raman Microscopy, and Surface-Enhanced Raman Scattering Microscopy. J. Biomed. Opt. 2015, 20, 51006. [Google Scholar] [CrossRef]
  30. Becker, W. Fluorescence Lifetime Imaging—Techniques and Applications. J. Microsc. 2012, 247, 119–136. [Google Scholar] [CrossRef]
  31. Lakowicz, J.R. Principles of Fluorescence Spectroscopy; Springer: Boston, MA, USA, 2006; pp. 1–954. [Google Scholar] [CrossRef]
  32. Zheng, K.; Jensen, T.P.; Rusakov, D.A. Monitoring Intracellular Nanomolar Calcium Using Fluorescence Lifetime Imaging. Nat. Protoc. 2018, 13, 581–597. [Google Scholar] [CrossRef]
  33. Wang, X.D.; Wolfbeis, O.S. Optical Methods for Sensing and Imaging Oxygen: Materials, Spectroscopies and Applications. Chem. Soc. Rev. 2014, 43, 3666–3761. [Google Scholar] [CrossRef]
  34. Wu, H.M.; Lee, T.A.; Ko, P.L.; Liao, W.H.; Hsieh, T.H.; Tung, Y.C. Widefield Frequency Domain Fluorescence Lifetime Imaging Microscopy (FD-FLIM) for Accurate Measurement of Oxygen Gradients within Microfluidic Devices. Analyst 2019, 144, 3494–3504. [Google Scholar] [CrossRef]
  35. Linders, P.T.A.; Ioannidis, M.; Ter Beest, M.; Van Den Bogaart, G. Fluorescence Lifetime Imaging of PH along the Secretory Pathway. ACS Chem. Biol. 2022, 17, 240–251. [Google Scholar] [CrossRef] [PubMed]
  36. Goryashchenko, A.S.; Pakhomov, A.A.; Ryabova, A.V.; Romanishkin, I.D.; Maksimov, E.G.; Orsa, A.N.; Serova, O.V.; Mozhaev, A.A.; Maksimova, M.A.; Martynov, V.I.; et al. Flim-Based Intracellular and Extracellular Ph Measurements Using Genetically Encoded Ph Sensor. Biosensors 2021, 11, 340. [Google Scholar] [CrossRef] [PubMed]
  37. Lin, H.J.; Herman, P.; Lakowicz, J.R. Fluorescence Lifetime-Resolved PH Imaging of Living Cells. Cytom. Part A 2003, 52, 77–89. [Google Scholar] [CrossRef]
  38. Okabe, K.; Inada, N.; Gota, C.; Harada, Y.; Funatsu, T.; Uchiyama, S. Intracellular Temperature Mapping with a Fluorescent Polymeric Thermometer and Fluorescence Lifetime Imaging Microscopy. Nat. Commun. 2012, 3, 705. [Google Scholar] [CrossRef] [PubMed]
  39. Ogle, M.M.; Smith McWilliams, A.D.; Ware, M.J.; Curley, S.A.; Corr, S.J.; Martí, A.A. Sensing Temperature in Vitro and in Cells Using a BODIPY Molecular Probe. J. Phys. Chem. B 2019, 123, 7282–7289. [Google Scholar] [CrossRef] [PubMed]
  40. Kashirina, A.S.; López-Duarte, I.; Kubánková, M.; Gulin, A.A.; Dudenkova, V.V.; Rodimova, S.A.; Torgomyan, H.G.; Zagaynova, E.V.; Meleshina, A.V.; Kuimova, M.K. Monitoring Membrane Viscosity in Differentiating Stem Cells Using BODIPY-Based Molecular Rotors and FLIM. Sci. Rep. 2020, 10, 14063. [Google Scholar] [CrossRef] [PubMed]
  41. Datta, R.; Heaster, T.M.; Sharick, J.T.; Gillette, A.A.; Skala, M.C. Fluorescence Lifetime Imaging Microscopy: Fundamentals and Advances in Instrumentation, Analysis, and Applications. J. Biomed. Opt. 2020, 25, 1. [Google Scholar] [CrossRef]
  42. Shirshin, E.A.; Yakimov, B.P.; Darvin, M.E.; Omelyanenko, N.P.; Rodionov, S.A.; Gurfinkel, Y.I.; Lademann, J.; Fadeev, V.V.; Priezzhev, A.V. Label-Free Multiphoton Microscopy: The Origin of Fluorophores and Capabilities for Analyzing Biochemical Processes. Biochemistry 2019, 84, 69–88. [Google Scholar] [CrossRef]
  43. Bille, J.F. High Resolution Imaging in Microscopy and Ophthalmology; Springer: Berlin, Germany, 2019; ISBN 978-3-030-16638-0. [Google Scholar]
  44. König, K. Clinical Multiphoton Tomography. J. Biophotonics 2008, 1, 13–23. [Google Scholar] [CrossRef] [PubMed]
  45. Schleusener, J.; Lademann, J.; Darvin, M.E. Depth-Dependent Autofluorescence Photobleaching Using 325, 473, 633, and 785 Nm of Porcine Ear Skin Ex Vivo. J. Biomed. Opt. 2017, 22, 091503. [Google Scholar] [CrossRef]
  46. So, P.T. Two-photon Fluorescence Light Microscopy. eLS 2001. [Google Scholar] [CrossRef]
  47. König, K. Multiphoton Microscopy and Fluorescence Lifetime Imaging: Applications in Biology and Medicine; Walter de Gruyter GmbH & Co KG: Berlin, Germany, 2018; pp. 1–450. [Google Scholar] [CrossRef]
  48. Schaefer, P.M.; Kalinina, S.; Rueck, A.; von Arnim, C.A.F.; von Einem, B. NADH Autofluorescence—A Marker on Its Way to Boost Bioenergetic Research. Cytom. Part A 2019, 95, 34–46. [Google Scholar] [CrossRef] [PubMed]
  49. Suhling, K.; Hirvonen, L.M.; Levitt, J.A.; Chung, P.H.; Tregidgo, C.; Le Marois, A.; Rusakov, D.A.; Zheng, K.; Ameer-Beg, S.; Poland, S.; et al. Fluorescence Lifetime Imaging (FLIM): Basic Concepts and Some Recent Developments. Med. Photonics 2015, 27, 3–40. [Google Scholar] [CrossRef]
  50. Kröger, M.; Scheffel, J.; Nikolaev, V.V.; Shirshin, E.A.; Siebenhaar, F.; Schleusener, J.; Lademann, J.; Maurer, M.; Darvin, M.E. In Vivo Non-Invasive Staining-Free Visualization of Dermal Mast Cells in Healthy, Allergy and Mastocytosis Humans Using Two-Photon Fluorescence Lifetime Imaging. Sci. Rep. 2020, 10, 14930. [Google Scholar] [CrossRef]
  51. Kröger, M.; Scheffel, J.; Shirshin, E.A.; Schleusener, J.; Meinke, M.C.; Lademann, J.; Maurer, M.; Darvin, M.E. Label-Free Imaging of Macrophage Phenotypes and Phagocytic Activity in the Human Dermis in Vivo Using Two-Photon Excited FLIM. bioRxiv 2021. [Google Scholar] [CrossRef]
  52. Wallrabe, H.; Svindrych, Z.; Alam, S.R.; Siller, K.H.; Wang, T.; Kashatus, D.; Hu, S.; Periasamy, A. Segmented Cell Analyses to Measure Redox States of Autofluorescent NAD(P)H, FAD & Trp in Cancer Cells by FLIM. Sci. Rep. 2018, 8, 79. [Google Scholar] [CrossRef]
  53. Ouyang, Y.; Liu, Y.; Wang, Z.M.; Liu, Z.; Wu, M. FLIM as a Promising Tool for Cancer Diagnosis and Treatment Monitoring. Nano-Micro Lett. 2021, 13, 1–27. [Google Scholar] [CrossRef]
  54. Liu, L.; Yang, Q.; Zhang, M.; Wu, Z.; Xue, P. Fluorescence Lifetime Imaging Microscopy and Its Applications in Skin Cancer Diagnosis. J. Innov. Opt. Health Sci. 2019, 12, 1930004. [Google Scholar] [CrossRef]
  55. Klemp, M.; Meinke, M.C.; Weinigel, M.; Röwert-Huber, H.J.; König, K.; Ulrich, M.; Lademann, J.; Darvin, M.E. Comparison of Morphologic Criteria for Actinic Keratosis and Squamous Cell Carcinoma Using in Vivo Multiphoton Tomography. Exp. Dermatol. 2016, 25, 218–222. [Google Scholar] [CrossRef]
  56. Vasanthakumari, P.; Romano, R.A.; Teixeira Rosa, R.G.; Salvio, A.G.; Yakovlev, V.; Kurachi, C.; Jo, J.A. Classification of Skin-Cancer Lesions Based on Fluorescence Lifetime Imaging. In Medical Imaging 2020: Biomedical Applications in Molecular, Structural, and Functional Imaging; SPIE: Bellingham, WA, USA, 2020; p. 34. [Google Scholar] [CrossRef]
  57. Roberts, M.S.; Roberts, M.J.; Robertson, T.A.; Sanchez, W.; Thörling, C.; Zou, Y.; Zhao, X.; Becker, W.; Zvyagin, A.V. In Vitro and in Vivo Imaging of Xenobiotic Transport in Human Skin and in the Rat Liver. J. Biophotonics 2008, 1, 478–493. [Google Scholar] [CrossRef]
  58. Jeong, S.; Hermsmeier, M.; Osseiran, S.; Yamamoto, A.; Nagavarapu, U.; Chan, K.F.; Evans, C.L. Visualization of Drug Distribution of a Topical Minocycline Gel in Human Facial Skin. Biomed. Opt. Express 2018, 9, 3434. [Google Scholar] [CrossRef] [PubMed]
  59. Alex, A.; Frey, S.; Angelene, H.; Neitzel, C.D.; Li, J.; Bower, A.J.; Spillman, D.R.; Marjanovic, M.; Chaney, E.J.; Medler, J.L.; et al. In Situ Biodistribution and Residency of a Topical Anti-Inflammatory Using Fluorescence Lifetime Imaging Microscopy. Br. J. Dermatol. 2018, 179, 1342–1350. [Google Scholar] [CrossRef] [PubMed]
  60. Keck, C.M.; Abdelkader, A.; Pelikh, O.; Wiemann, S.; Kaushik, V.; Specht, D.; Eckert, R.W.; Alnemari, R.M.; Dietrich, H.; Brüßler, J. Assessing the Dermal Penetration Efficacy of Chemical Compounds with the Ex-Vivo Porcine Ear Model. Pharmaceutics 2022, 14, 678. [Google Scholar] [CrossRef] [PubMed]
  61. Jung, S.; Nagel, G.; Giulbudagian, M.; Calderón, M.; Patzelt, A.; Knorr, F.; Lademann, J. Temperature-Enhanced Follicular Penetration of Thermoresponsive Nanogels. Z. Für Phys. Chem. 2018, 232, 805–817. [Google Scholar] [CrossRef]
  62. Darvin, M.E.; Haag, S.; Meinke, M.; Zastrow, L.; Sterry, W.; Lademann, J. Radical Production by Infrared A Irradiation in Human Tissue. Ski. Pharmacol. Physiol. 2010, 23, 40–46. [Google Scholar] [CrossRef] [PubMed]
  63. Mujica Ascencio, S.; Choe, C.S.; Meinke, M.C.; Müller, R.H.; Maksimov, G.V.; Wigger-Alberti, W.; Lademann, J.; Darvin, M.E. Confocal Raman Microscopy and Multivariate Statistical Analysis for Determination of Different Penetration Abilities of Caffeine and Propylene Glycol Applied Simultaneously in a Mixture on Porcine Skin Ex Vivo. Eur. J. Pharm. Biopharm. 2016, 104, 51–58. [Google Scholar] [CrossRef]
  64. Lane, M.E. Skin Penetration Enhancers. Int. J. Pharm. 2013, 447, 12–21. [Google Scholar] [CrossRef]
  65. Carrer, V.; Alonso, C.; Pont, M.; Zanuy, M.; Córdoba, M.; Espinosa, S.; Barba, C.; Oliver, M.A.; Martí, M.; Coderch, L. Effect of Propylene Glycol on the Skin Penetration of Drugs. Arch. Dermatol. Res. 2020, 312, 337–352. [Google Scholar] [CrossRef]
  66. O’goshi, K.I.; Serup, J. Safety of Sodium Fluorescein for in Vivo Study of Skin. Ski. Res. Technol. 2006, 12, 155–161. [Google Scholar] [CrossRef]
  67. Lademann, J.; Richter, H.; Patzelt, A.; Meinke, M.C.; Gross, I.; Grether-Beck, S.; Krutmann, J.; Frazier, L.; Darvin, M.E. Laser Scanning Microscopy for Control of Skin Decontamination Efficacy from Airborne Particulates Using Highly Absorbent Textile Nanofiber Material in Combination with PEG-12 Dimethicone. Ski. Res. Technol. 2020, 26, 558–563. [Google Scholar] [CrossRef]
  68. Hammer, M.; Schweitzer, D.; Richter, S.; Königsdörffer, E. Sodium Fluorescein as a Retinal PH Indicator? Physiol. Meas. 2005, 26, N9. [Google Scholar] [CrossRef] [PubMed]
  69. Diaz, G.; Melis, M.; Batetta, B.; Angius, F.; Falchi, A.M. Hydrophobic Characterization of Intracellular Lipids in Situ by Nile Red Red/Yellow Emission Ratio. Micron 2008, 39, 819–824. [Google Scholar] [CrossRef] [PubMed]
  70. Levitt, J.A.; Chung, P.-H.; Suhling, K. Spectrally Resolved Fluorescence Lifetime Imaging of Nile Red for Measurements of Intracellular Polarity. J. Biomed. Opt. 2015, 20, 096002. [Google Scholar] [CrossRef] [PubMed]
  71. Cser, A.; Nagy, K.; Biczók, L. Fluorescence Lifetime of Nile Red as a Probe for the Hydrogen Bonding Strength with Its Microenvironment. Chem. Phys. Lett. 2002, 360, 473–478. [Google Scholar] [CrossRef]
  72. Choe, C.; Schleusener, J.; Choe, S.; Ri, J.; Lademann, J.; Darvin, M.E. Stratum Corneum Occlusion Induces Water Transformation towards Lower Bonding State: A Molecular Level in Vivo Study by Confocal Raman Microspectroscopy. Int. J. Cosmet. Sci. 2020, 42, 482–493. [Google Scholar] [CrossRef]
  73. Kaushik, V.; Ganashalingam, Y.; Schesny, R.; Raab, C.; Sengupta, S.; Keck, C.M. Influence of Massage and Skin Hydration on Dermal Penetration Efficacy of Nile Red from Petroleum Jelly—an Unexpected Outcome. Pharmaceutics 2021, 13, 2190. [Google Scholar] [CrossRef]
  74. Stamatas, G.N.; de Sterke, J.; Hauser, M.; von Stetten, O.; van der Pol, A. Lipid Uptake and Skin Occlusion Following Topical Application of Oils on Adult and Infant Skin. J. Dermatol. Sci. 2008, 50, 135–142. [Google Scholar] [CrossRef]
  75. Choe, C.; Lademann, J.; Darvin, M.E. Analysis of Human and Porcine Skin in Vivo/Ex Vivo for Penetration of Selected Oils by Confocal Raman Microscopy. Skin Pharmacol. Physiol. 2015, 28, 318–330. [Google Scholar] [CrossRef]
  76. Breunig, H.G.; Weinigel, M.; Bückle, R.; Kellner-Höfer, M.; Lademann, J.; Darvin, M.E.; Sterry, W.; König, K. Clinical Coherent Anti-Stokes Raman Scattering and Multiphoton Tomography of Human Skin with a Femtosecond Laser and Photonic Crystal Fiber. Laser Phys. Lett. 2013, 10, 025604. [Google Scholar] [CrossRef]
  77. Ulrich, M.; Klemp, M.; Darvin, M.E.; König, K.; Lademann, J.; Meinke, M.C. In Vivo Detection of Basal Cell Carcinoma: Comparison of a Reflectance Confocal Microscope and a Multiphoton Tomograph. J. Biomed. Opt. 2013, 18, 061229. [Google Scholar] [CrossRef]
  78. Meinke, M.C.; Richter, H.; Kleemann, A.; Lademann, J.; Tscherch, K.; Rohn, S.; Schempp, C.M. Characterization of Atopic Skin and the Effect of a Hyperforin-Rich Cream by Laser Scanning Microscopy. J. Biomed. Opt. 2014, 20, 051013. [Google Scholar] [CrossRef] [PubMed]
  79. Jacobi, U.; Weigmann, H.J.; Ulrich, J.; Sterry, W.; Lademann, J. Estimation of the Relative Stratum Corneum Amount Removed by Tape Stripping. Ski. Res. Technol. 2005, 11, 91–96. [Google Scholar] [CrossRef] [PubMed]
  80. Caspers, P.J.; Lucassen, G.W.; Carter, E.A.; Bruining, H.A.; Puppels, G.J. In Vivo Confocal Raman Microspectroscopy of the Skin: Noninvasive Determination of Molecular Concentration Profiles. J. Investig. Dermatol. 2001, 116, 434–442. [Google Scholar] [CrossRef] [PubMed]
  81. Haque, T.; Talukder, M.M.U. Chemical Enhancer: A Simplistic Way to Modulate Barrier Function of the Stratum Corneum. Adv. Pharm. Bull. 2018, 8, 169–179. [Google Scholar] [CrossRef] [PubMed] [Green Version]
  82. Dimde, M.; Sahle, F.F.; Wycisk, V.; Steinhilber, D.; Camacho, L.C.; Licha, K.; Lademann, J.; Haag, R. Synthesis and Validation of Functional Nanogels as PH-Sensors in the Hair Follicle. Macromol. Biosci. 2017, 17, 1600505. [Google Scholar] [CrossRef]
  83. Vitali, M.; Picazo, F.; Prokazov, Y.; Duci, A.; Turbin, E.; Götze, C.; Llopis, J.; Hartig, R.; Visser, A.J.W.G.; Zuschratter, W. Wide-Field Multi-Parameter FLIM: Long-Term Minimal Invasive Observation of Proteins in Living Cells. PLoS ONE 2011, 6, e15820. [Google Scholar] [CrossRef]
  84. Öhman, H.; Vahlquist, A. The PH Gradient over the Stratum Corneum Differs in X-Linked Recessive and Autosomal Dominant Ichthyosis: A Clue to the Molecular Origin of the “Acid Skin Mantle”? J. Investig. Dermatol. 1998, 111, 674–677. [Google Scholar] [CrossRef]
  85. Ogikubo, S.; Nakabayashi, T.; Adachi, T.; Islam, M.S.; Yoshizawa, T.; Kinjo, M.; Ohta, N. Intracellular PH Sensing Using Autofluorescence Lifetime Microscopy. J. Phys. Chem. B 2011, 115, 10385–10390. [Google Scholar] [CrossRef]
  86. Frosch, P.J.; Menné, T.; Lepoittevin, J.P. Contact Dermatitis; Springer: Berlin/Heidelberg, Germany, 2011; pp. 1–1136. [Google Scholar] [CrossRef]
  87. Roberts, M.S.; Dancik, Y.; Prow, T.W.; Thorling, C.A.; Lin, L.L.; Grice, J.E.; Robertson, T.A.; König, K.; Becker, W. Non-Invasive Imaging of Skin Physiology and Percutaneous Penetration Using Fluorescence Spectral and Lifetime Imaging with Multiphoton and Confocal Microscopy. Eur. J. Pharm. Biopharm. 2011, 77, 469–488. [Google Scholar] [CrossRef]
  88. Song, Y.S.; Won, Y.J.; Kim, D.Y. Time-Lapse in Situ Fluorescence Lifetime Imaging of Lipid Droplets in Differentiating 3T3-L1 Preadipocytes with Nile Red. Curr. Appl. Phys. 2015, 15, 1634–1640. [Google Scholar] [CrossRef]
  89. Mukherjee, S.; Raghuraman, H.; Chattopadhyay, A. Membrane Localization and Dynamics of Nile Red: Effect of Cholesterol. Biochim. Et Biophys. Acta (BBA)-Biomembr. 2007, 1768, 59–66. [Google Scholar] [CrossRef] [PubMed]
  90. Elias, P.M.; Brown, B.E.; Fritsch, P.; Goerke, J.; Gray, G.M.; White, R.J. Localization and Composition of Lipids in Neonatal Mouse Stratum Granulosum and Stratum Corneum. J. Investig. Dermatol. 1979, 73, 339–348. [Google Scholar] [CrossRef] [PubMed]
  91. Lu, F.; Wang, C.; Zhao, R.; Du, L.; Fang, Z.; Guo, X.; Zhao, Z. Review of Stratum Corneum Impedance Measurement in Non-Invasive Penetration Application. Biosensors 2018, 8, 31. [Google Scholar] [CrossRef] [PubMed] [Green Version]
  92. Huclova, S.; Baumann, D.; Talary, M.S.; Fröhlich, J. Sensitivity and Specificity Analysis of Fringing-Field Dielectric Spectroscopy Applied to a Multi-Layer System Modelling the Human Skin. Phys. Med. Biol. 2011, 56, 7777–7793. [Google Scholar] [CrossRef]
  93. Alvarez-Román, R.; Merino, G.; Kalia, Y.N.; Naik, A.; Guy, R.H. Skin Permeability Enhancement by Low Frequency Sonophoresis: Lipid Extraction and Transport Pathways. J. Pharm. Sci. 2003, 92, 1138–1146. [Google Scholar] [CrossRef] [PubMed]
  94. Saunders, J.; Davis, H.; Coetzee, L.; Botha, S.; Kruger, A.; Grobler, A. A Novel Skin Penetration Enhancer: Evaluation by Membrane Diffusion and Confocal Microscopy. J. Pharm. Pharm. Sci. 1999, 2, 99–107. [Google Scholar]
  95. Tajreja, P.S.; Kleene, N.K.; Pickens, W.L.; Wang, T.F.; Kasting, G.B. Visualization of the Lipid Barrier and Measurement of Lipid Pathlength in Human Stratum Corneum. Aaps PharmSci 2001, 3, 48–56. [Google Scholar] [CrossRef] [Green Version]
Figure 1. TPE-FLIM images depending on skin depth of PG-treated compared to untreated skin. (ad) The SC of untreated skin sample; (eh) The SC of PG-treated skin sample; (f) arrows refer to lines, which are assumed to be the areas between the corneocytes; (il) The viable epidermis of untreated skin. (mp) The viable epidermis of PG-treated skin. In both samples there was no differences in the pseudocolors. Τm was measured after excitation with 760 nm using TPT-FLIM and is shown by a pseudocolor scale of 1000–2000 ps. Scale bar: 20 μm. Acquisition time: 6.8 s. Excitation power is depth-dependent and shown in Table 1.
Pharmaceutics 14 01790 g001
Figure 2. Changes of τm of untreated (black line) and PG-treated (orange line) skin depending on the depth at 4 μm increment. PG-treated skin shows longer τm down to 8 μm. SC thickness is 16.0 ± 3.3 μm. N = 6.
Pharmaceutics 14 01790 g002
Figure 3. TPE-FLIM images of NaFl-treated compared to untreated skin at different depths. (ad) The SC of the untreated skin; (eh) The SC of NaFl-treated skin. The treated SC showed an average increase in τm from τm = 1522 ± 89 to τm = 2725 ± 210 ps; (il) The viable epidermis of the untreated skin; (mp) The viable epidermis of the NaFl-treated skin; (o,p) The white arrows refer to the extracellular areas between the keratinocytes. τm was measured after an excitation with 760 nm using a TPT and is shown by a pseudocolor scale of 500–3000 ps. Scale bar: 20 μm. Acquisition time: 6.8 s. Excitation power is depth-dependent and shown in Table 1.
Pharmaceutics 14 01790 g003
Figure 4. (a) Comparison between τm of the untreated (black line) and NaFl-treated (orange line) skin depending on the depth; (b) τ2 of both skin samples in different depths. τ2 curves overlapped at 12 μm, while τm of the NaFl-treated skin was longer at all measured depths. SC thickness is 16.0 ± 3.3 μm. N = 6.
Pharmaceutics 14 01790 g004
Figure 5. (a) LSM-fluorescence intensity of the skin after 5 (blue line) and 30 min (orange line) treatment with NaFl compared to untreated skin (black line). SC-thickness is 16.0 ± 3.3 μm. Excitation power was fixed at 5 mW. Gray values of LSM images were used as fluorescence intensities. Higher intensity was measured in the 30 min treated sample; (b) The relative amplitude of the slow lifetime component α2 increased after longer treatment time in the viable epidermis. TPE-excitation power shown in Table 1. SC-thickness is 16.0 ± 3.3 μm. N = 3.
Pharmaceutics 14 01790 g005
Figure 6. (a) Raman spectrum of NaFl excited at 785 nm; (b) Comparison between the detected NaFl concentration depending of the skin depth determined using CRM (orange line) and TS (blue line) methods. N = 6.
Pharmaceutics 14 01790 g006
Figure 7. TPE-FLIM images of NR-treated compared to untreated skin depending on skin depth. (ad) SC of untreated skin sample; (eh) SC of NR-treated skin; (g) Arrows refer to areas with a longer τm than the rest of the image indicating the presence of NR; (f) The stars refer to the background and stars in (g,h) refer to the skin surface because of skin furrow. Τm was measured after an excitation with 760 nm using a TPT and is shown by a pseudocolor scale of 1000–2500 ps. Scale bar: 20 μm. Acquisition time: 6.8 s. Excitation power is depth-dependent and shown in Table 1.
Pharmaceutics 14 01790 g007
Figure 8. Changes of τm of the NR-treated (orange line) compared to the untreated (black line) skin depending on the depth at 4 μm increments. τm of the NR-treated skin decreases in the deep SC and overlaps with the untreated skin in the viable epidermis. SC thickness is 16.0 ± 3.3 μm. N = 6.
Pharmaceutics 14 01790 g008
Table 1. Laser power (TPE at 760 nm) for the fluorophore-treated skin depending on the depth.
Skin Depth [μm]Excitation Power [mW]
PG and Untreated SkinNaFlNRParaffin Oil
0101510
101821215
2023102020
3033232828
4040334040
Table 2. TPE-FLIM parameters of untreated and PG-treated skin. Mean ± SEM. N = 6.
Untreated SkinPG-Treated Skin
Depth [μm]τ1 [ps]τ2 [ps]τm [ps]a1 [%]a2 [%]τ1 [ps]τ2 [ps]τm [ps]a1 [%]a2 [%]
0463 ± 462628 ± 1841138 ± 9165.7 ± 0.934.34 ± 0.9599 ± 352955 ± 1901358 ± 6463.8 ± 2.236.2 ± 2.2
4455 ± 562501 ± 2531141 ± 8765.5 ± 2.034.5 ± 2.0671 ± 593489 ± 2881575 ± 8365.9 ± 2.834.1 ± 3.2
8516 ± 342819 ± 1861267 ± 5466.3 ± 1.633.7 ± 1.6574 ± 573236 ± 2831441 ± 7766.3 ± 2.833.7 ± 2.8
12491 ± 312816 ± 1521256 ± 5066.5 ± 1.233.5 ± 1.2518 ± 243062 ± 1471324 ± 5567.8 ± 0.832.2 ± 0.8
16605 ± 113570 ± 861581 ± 2466.5 ± 1.533.5 ± 1.5606 ± 353620 ± 1791588 ± 5367.0 ± 1.033.0 ± 1.0
20618 ± 283611 ± 1491638 ± 6765.5 ± 1.034.5 ± 1.0616 ± 213690 ± 1091633 ± 5466.8 ± 0.533.2 ± 0.5
24644 ± 193846 ± 1001726 ± 4165.8 ± 0.934.2 ± 0.9651 ± 173900 ± 991721 ± 4466.9 ± 1.233.1 ± 1.2
28656 ± 223882 ± 1561735 ± 3866.1 ± 1.333.9 ± 1.3646 ± 183843 ± 1271712 ± 7066.6 ± 0.733.4 ± 0.7
32654 ± 233801 ± 961710 ± 4466.1 ± 0.733.9 ± 0.7636 ± 163743 ± 1121679 ± 6166.4 ± 0.933.6 ± 0.9
Table 3. TPE-FLIM parameters of untreated and NaFl-treated skin. Mean ± SEM. N = 6.
Untreated SkinNaFl-Treated Skin
Depth [μm]τ1 [ps]τ2 [ps]τm [ps]a1 [%]a2 [%]τ1 [ps]τ2 [ps]τm [ps]a1 [%]a2 [%]
0555 ± 732970 ± 3321253 ± 11367.7 ± 1.632.3 ± 1.61655 ± 1684164 ± 1183005 ± 10944.8 ± 1.655.2 ± 1.6
4441 ± 552437 ± 2571143 ± 9465.0 ± 2.135.0 ± 2.11325 ± 1773730 ± 2032766 ± 12639.5 ± 2.860.5 ± 2.8
8471 ± 362671 ± 1931275 ± 5863.4 ± 3.336.6 ± 3.3849 ± 2283518 ± 2142349 ± 24042.9 ± 2.057.1 ± 2.0
12585 ± 693241 ± 2541463 ± 12066.7 ± 0.433.3 ± 0.4605 ± 843366 ± 1572225 ± 12740.9 ± 1.659.1 ± 1.6
16599 ± 153553 ± 1311661 ± 4064.5 ± 2.135.5 ± 2.1732 ± 633713 ± 1512330 ± 10145.9 ± 1.954.2 ± 2.1
20665 ± 493841 ± 1871807 ± 9764.6 ± 1.035.4 ± 1.0767 ± 253813 ± 812306 ± 4949.1 ± .1950.9 ± 1.9
24691 ± 443888 ± 1891847 ± 9764.5 ± 1.635.5 ± 1.6792 ± 273998 ± 892316 ± 8752.2 ± 1.447.8 ± 1.4
28690 ± 323956 ± 1811852 ± 6465.2 ± 1.634.8 ± 1.6756 ± 163984 ± 812252 ± 6353.2 ± .1946.8 ± 1.9
32671 ± 303678 ± 1141768 ± 6963.9 ± 1.336.1 ± 1.3761 ± 303960 ± 1022214 ± 9054.4 ± 1.845.6 ± 1.8
Table 4. TPE-FLIM parameters of untreated and NR-treated skin. Mean ± SEM. N = 6.
Untreated SkinNR-Treated Skin
Depth [μm]τ1 [ps]τ2 [ps]τm [ps]a1 [%]a2 [%]τ1 [ps]τ2 [ps]τm [ps]a1 [%]a2 [%]
0498 ± 422723 ± 1551212 ± 9065.2 ± 1.334.8 ± 1.31268 ± 2504706 ± 5382713 ± 28149.0 ± 2.251.0 ± 2.2
4469 ± 452485 ± 1691208 ± 10463.1 ± 0.936.9 ± 0.91123 ± 2093586 ± 2452506 ± 25645.2 ± 1.554.8 ± 1.5
8501 ± 322772 ± 1851267 ± 5165.5 ± 1.434.5 ± 1.4541 ± 753111 ± 1501957 ± 14644.7 ± 3.055.3 ± 3.0
12559 ± 383155 ± 1921384 ± 7167.6 ± 0.932.4 ± 0.9510 ± 233065 ± 1001748 ± 8351.0 ± 1.649.0 ± 1.6
16618 ± 223755 ± 1531726 ± 6264.3 ± 0.635.7 ± 0.6602 ± 453587 ± 2111745 ± 13262.6 ± 1.437.4 ± 1.4
20656 ± 253867 ± 1381833 ± 5562.9 ± 0.737.1 ± 0.7665 ± 233943 ± 1351873 ± 10063.1 ± 1.636.9 ± 1.6
24695 ± 154059 ± 1051919 ± 4863.3 ± 0.436.7 ± 0.4663 ± 133808 ± 791825 ± 8462.9 ± 1.737.1 ± 1.7
28665 ± 213853 ± 1421842 ± 5862.7 ± 0.637.3 ± 0.6664 ± 193844 ± 1231822 ± 8263.4 ± 1.636.6 ± 1.6
32698 ± 184020 ± 881890 ± 3863.9 ± 0.536.1 ± 0.5698 ± 243964 ± 1651861 ± 10164.4 ± 1.235.6 ± 1.2
Publisher’s Note: MDPI stays neutral with regard to jurisdictional claims in published maps and institutional affiliations.

