1. Introduction
Domperidone and metoclopramide are both dopamine D2 receptor antagonists prescribed as antiemetic drugs. Their pharmacological targets are the peripheral D2 receptors, especially at the area postrema level, a spinal structure responsible for the vomiting reflex. Metoclopramide is also a 5HT
3 serotonin receptor antagonist responsible for its gastroprokinetic effect. Their action on the D2 receptors of the central nervous system (CNS) is related to adverse events. They are rarely observed with domperidone, which acts at the antehypophyse level, generating gynecomastia and galactorrhea [
1]. The Food and Drug Administration (FDA) put a black-box warning on metoclopramide, thus restricting its clinical use [
2]. Metoclopramide has been shown to cause neurological side effects such as peripheral extrapyramidal symptoms and tardive dyskinesia. The risks increase when metoclopramide is administered in high doses and during long-term treatment [
3].
Table 1 shows the CNS relative frequencies of the side effects of domperidone and metoclopramide.
These differences may be explained by lower brain penetration of domperidone compared with metoclopramide [
7]. It is, however, difficult to estimate brain penetration and exposure in vivo. There is a need for minimally invasive methods to explore and compare the brain penetration of such compounds with clinical perspectives.
Both domperidone and metoclopramide are substrates of the P-glycoprotein (P-gp, ABCB1), the main efflux transporter expressed at the blood–brain barrier (BBB). A large body of literature suggests that the P-gp function controls the brain exposure to many drugs [
8]. The most widely accepted hypothesis for low brain penetration of domperidone is that domperidone is an avid substrate of the P-gp [
9]. In contrast, metoclopramide is considered a comparatively “weak” P-gp substrate in vitro [
10], implying that metoclopramide exerts CNS effects despite fully functional P-gp at the BBB.
Comparison of the brain kinetics of domperidone and metoclopramide can first be informed by available data in the literature. The BBB passage of domperidone and metoclopramide has been compared in an in vitro model of the BBB using bovine brain capillary endothelial cells grown on filter inserts in a co-culture system with glial cells [
11]. Compared with the passage of solutes across the filter (no BBB), the authors reported a 76% passage for domperidone versus 100% for metoclopramide [
11]. The transport across parallel artificial membrane permeability assays (PAMPA) was 76-fold lower for domperidone compared with metoclopramide, suggesting higher passive diffusion of metoclopramide across lipid membranes [
12]. The efflux ratio of domperidone in cells overexpressing the human P-gp (MDCK-MDR1), using bidirectional transport assay, was 31.2 for domperidone. This transport was reduced to ~1 in the presence of P-gp inhibition, thus confirming that domperidone is an avid substrate of the P-gp [
13]. In comparison, a 1.4 efflux ratio for metoclopramide was reported using the same MDCK-MDR1 cell line from the same origin, suggesting that metoclopramide is a much “weaker” substrate of the P-gp [
10]. This was also observed in cells transfected with the rodent P-gp gene (LLC-PK1-Mdr1a), in which the efflux ratio of domperidone was 87.5 versus 1.6 for metoclopramide [
7]. Ex vivo studies in rats reported a tissue/plasma ratio (K
p,brain) of 0.17 for domperidone [
14] versus 1.72 for metoclopramide [
15]. The K
p,uu,brain, which takes the binding to plasma and brain proteins into account, was 0.022 for domperidone versus 2.4 for metoclopramide in rats [
16]. Another rat study consistently reported a K
p,uu,brain of 0.044 for domperidone versus 0.235 for metoclopramide [
7]. A 6.6-fold increase in the K
p,brain of metoclopramide was observed in P-gp deficient mice compared with wild-type mice [
17]. Schinkel et al. reported that the K
p,brain of radiolabeled domperidone (
3H-domperidone) was not increased in P-gp deficient mice, which was attributed to the predominant proportion of circulating radiometabolites, which rapidly surpassed the radioactive signal of parent unmetabolized
3H-domperidone in plasma [
9]. However, P-gp deficiency was associated with increased CNS effects and catalepsy compared with wild-type mice when an oral pharmacological dose of domperidone was administered. This suggests a higher level of domperidone in the CNS of P-gp-deficient mice. However, as P-gp is abundant in the intestinal epithelium, increased oral bioavailability of domperidone in P-gp-deficient mice may also have contributed to the observed effect [
9,
18]. By using in situ brain perfusion, which bypasses the effect of plasma protein binding and peripheral metabolism, a significant increase of the K
p,brain of domperidone was observed in the presence of P-gp inhibition achieved using high concentration of the P-gp inhibitors cyclosporin A (2.5 µM) [
19] or verapamil (500 µM) in the perfusate, which could hardly be achieved in vivo.
It is broadly assumed that avid substrates expose to a higher risk of drug–drug interactions (DDIs) caused by P-gp inhibitors. In comparison, weak substrates have less impact on brain kinetics, assuming a limited risk for clinically relevant DDI [
20]. It may therefore be hypothesized that the consequences of DDI precipitated by P-gp inhibitors may lead to unintended brain exposure and CNS effects, which may balance the CNS safety of domperidone in this particular situation.
Positron emission tomography (PET) imaging provides an advanced technology to study in vivo the crossing of biological barriers, as it allows for the study of drug distribution and pharmacokinetics in a non-invasive way. Both metoclopramide and domperidone can be isotopically radiolabeled with carbon-11, i.e., without modification of the chemical structure and, by extension, the biological properties of the drug. [
11C]metoclopramide has been validated as a PET probe for detecting the regulation of P-gp function at the BBB in animals and humans, including the impact of inhibition and induction of the transporter [
21,
22,
23]. Accumulated in vitro and in vivo data suggest the high vulnerability of [
11C]metoclopramide to P-gp inhibition. Availability of [
11C]domperidone for PET imaging offers the unique opportunity to compare the brain kinetics of domperidone with previously published data of metoclopramide [
21] obtained using the same approach [
24]. This study assesses the P-gp substrate properties of domperidone in vitro in transfected cells expressing the human P-gp. Baseline brain exposure and consequences of DDI precipitated by tariquidar (TQD), a potent inhibitor of P-gp, are then assessed in vivo using PET imaging in rats.
2. Materials and Methods
2.1. [11C]Metoclopramide PET Data
All in vitro and in vivo experiments performed using [
11C]metoclopramide presented in this article have already been published [
21,
24]. However, some newly estimated pharmacokinetic parameters and previously published data relative to [
11C]metoclopramide brain PET imaging are displayed to allow for direct comparison with data obtained using [
11C]domperidone.
2.2. Chemistry
Tariquidar (TQD) used for P-gp inhibition was purchased from Eras Labo (Saint-Nazaire-les-Eymes, France). TQD solutions for intravenous injections were freshly prepared at the selected concentrations on the day of the experiment by dissolving TQD dimesylate 2.35 H
2O in dextrose solution (5%,
w/
v), followed by dilution with sterile water.
O-desmethyl metoclopramide was purchased from LGC standards (France). The precursor for [
11C]domperidone radiosynthesis was synthesized in house [
25].
2.3. Radiochemistry
[
11C]metoclopramide was synthesized by automated radiomethylation using a TRACERlab
® FX C Pro module (GE Healthcare, Buc, France) and cyclotron-produced [
11C]CO
2 according to the method described in the literature [
26]. No carrier added [
11C]CO
2 (50–70 GBq) was produced via the
14N(p, α)
11C nuclear reaction by irradiation of an [
14N]N
2 target containing 0.15–0.5% of O
2 on a cyclone 18/9 cyclotron (18 MeV, IBA, Ottignies-Louvain-la-Neuve, Belgium). [
11C]CO
2 was subsequently reduced to [
11C]CH
4 and iodinated to [
11C]CH
3I following the process described by Larsen et al. [
27] and finally converted to [
11C]CH
3OTf according to the method of Jewett [
28]. [
11C]CH
3OTf was bubbled into a solution of
O-desmethyl-metoclopramide (1 mg) and aqueous sodium hydroxide (3 M, 7 μL) in acetone (400 μL) at −20 °C for 3 min. The mixture was heated at 110 °C for 2 min, then evaporating the residual solvent to dryness at 110 °C under a vacuum for 30 s. Upon cooling to 60 °C, a mixture of aqueous NaH
2PO
4 (20 mM)/CH
3CN/H
3PO
4 (85/15/0.2
v/
v/
v) was added. Purification was realized by reverse phase HPLC (Waters Symmetry
® C18 7.8 × 300 mm, 7 μm) with a 501 HPLC Pump (Waters, Guyancourt, France) using aqueous NaH
2PO
4 (20 mM)/CH
3CN/H
3PO
4 (85/15/0.2
v/
v/
v, 5 mL/min) as eluent. UV detection (K2501, Knauer, Germany) was performed at 220 nm. The purified compound was diluted with water (20 mL) and passed through a Sep-Pak
® C18 cartridge (Waters, Milford, CT, USA). The cartridge was rinsed with water (10 mL) and eluted with ethanol (2 mL). The final compound was diluted with saline (0.9%
w/
v, 8 mL) to afford ready-to-inject [
11C]metoclopramide (1.9 ± 0.2 GBq) in 12% ± 3% radiochemical yield (RCY) within 40 min and with a molar activity (MA) of 88 ± 13 GBq/μmol at the end of the beam (EOB) (
n = 35) (
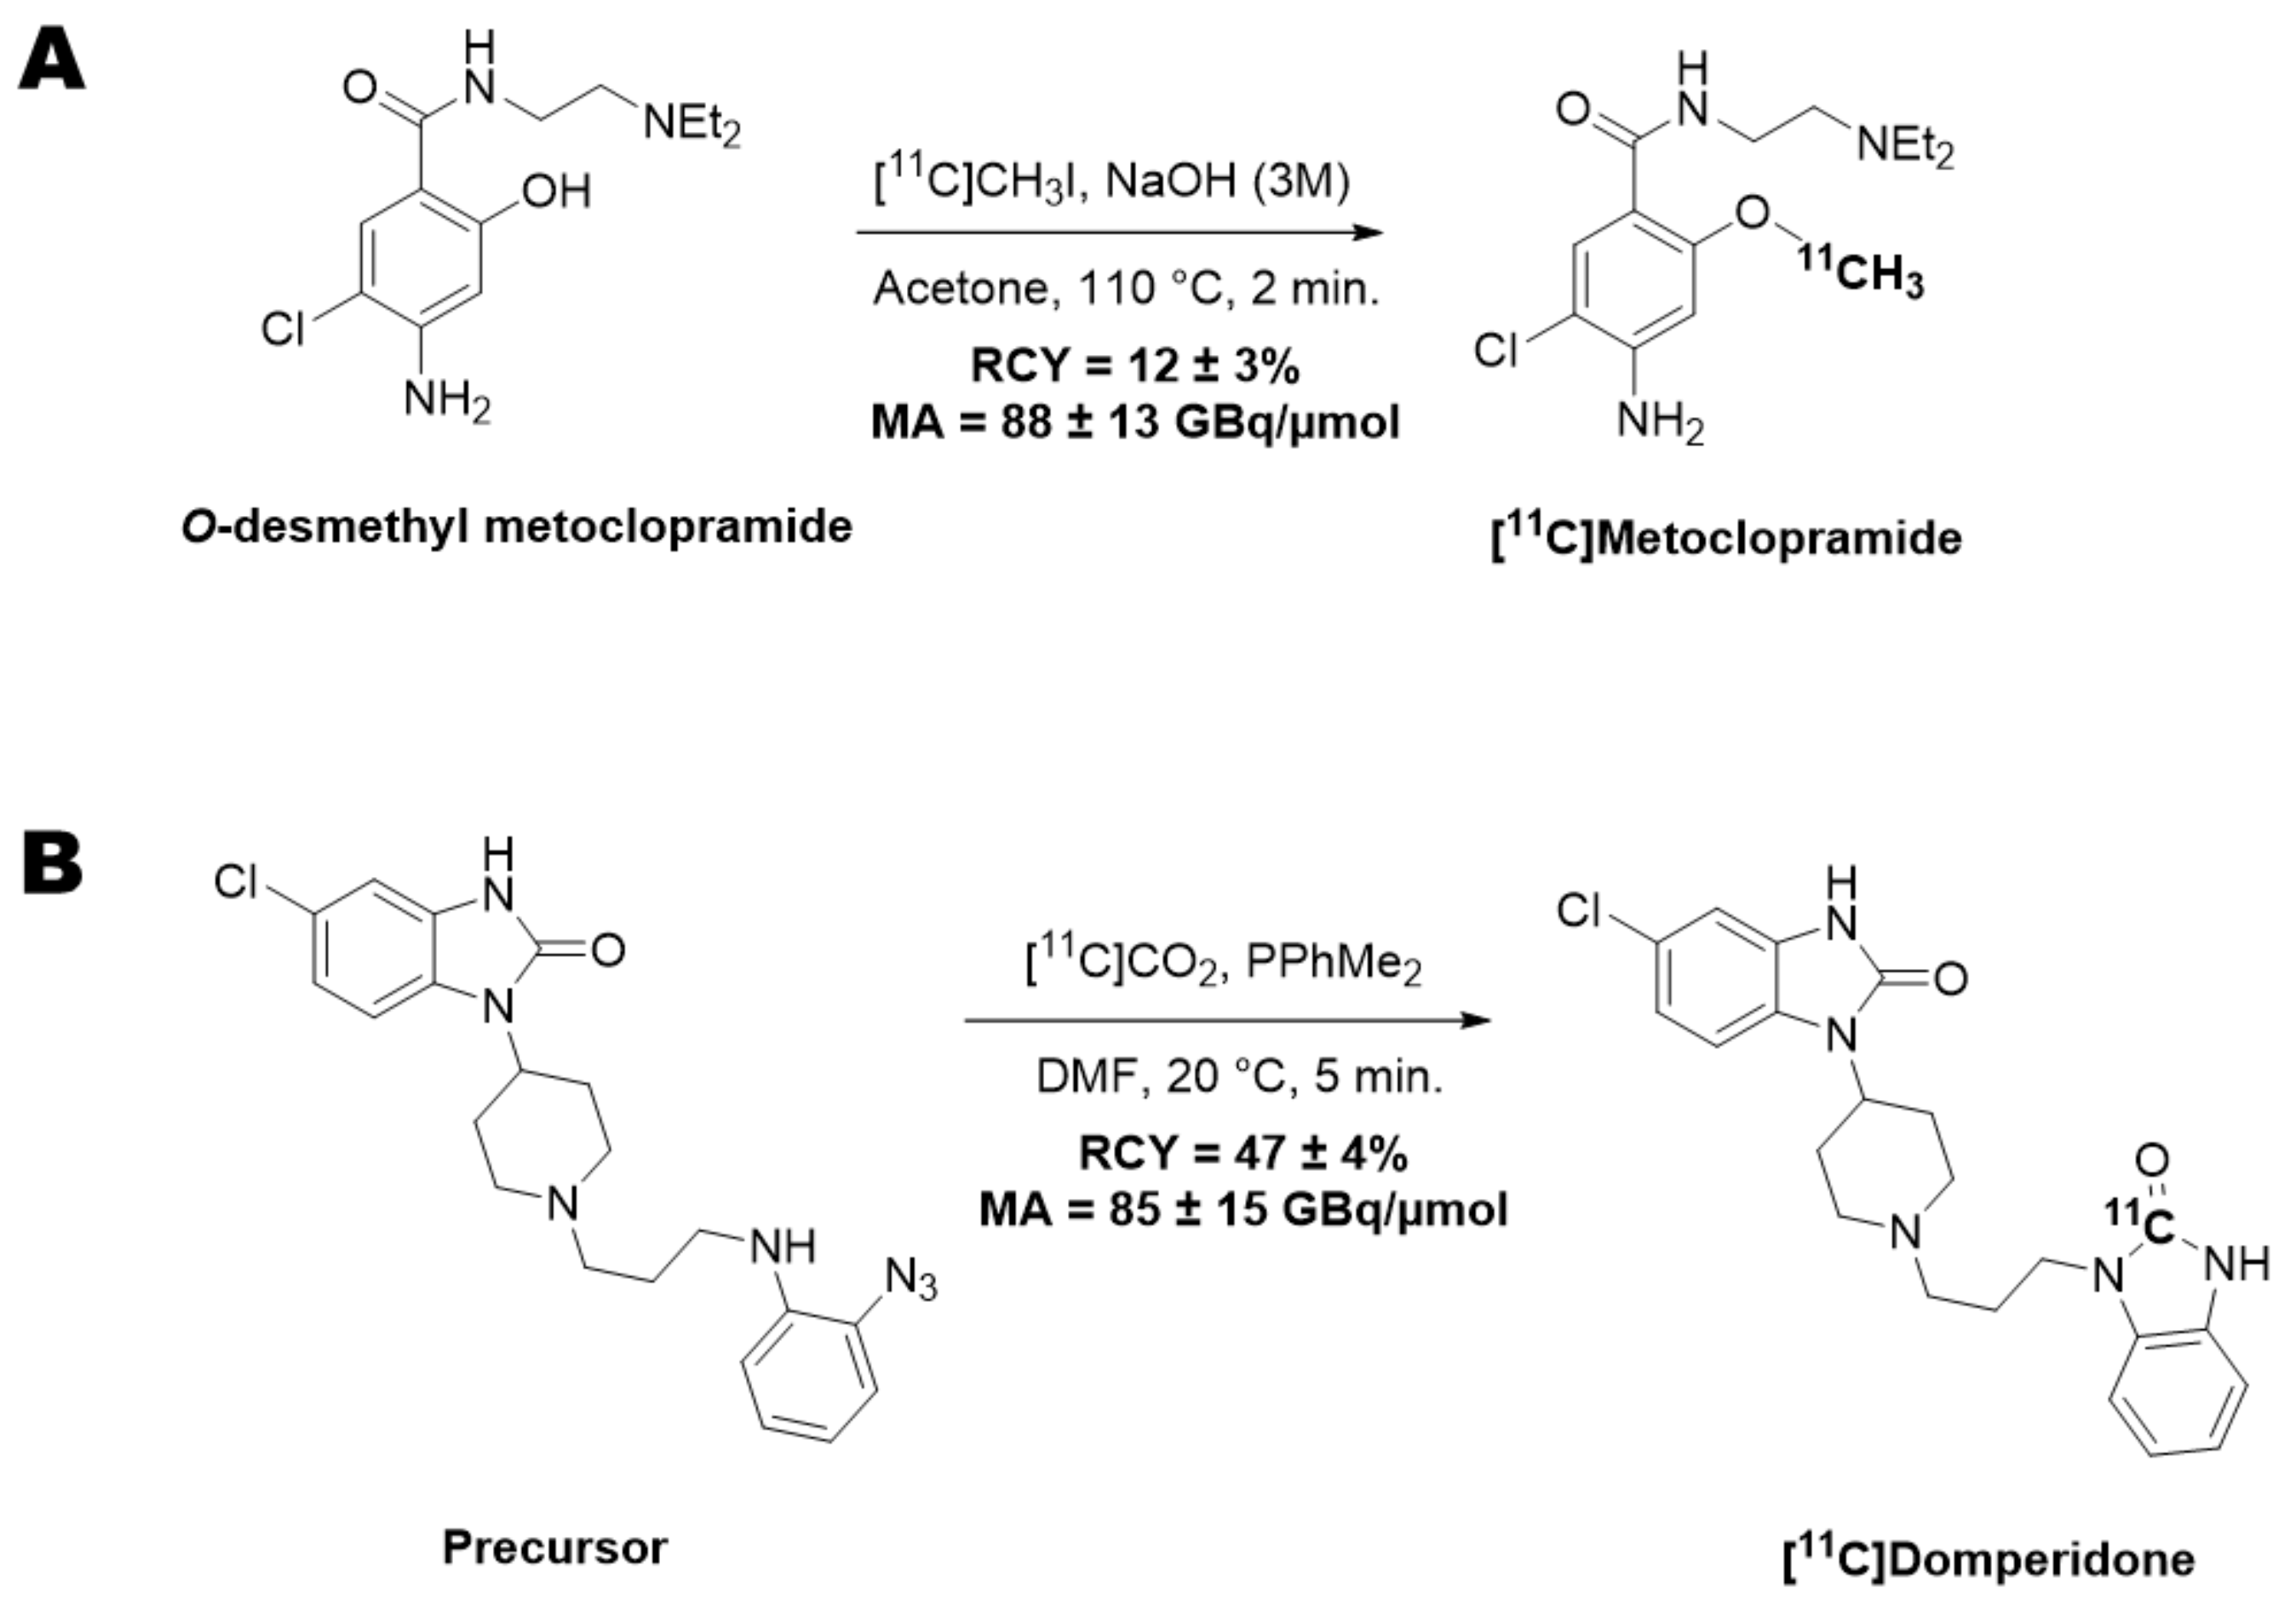
Figure 1A).
[
11C]Domperidone was synthesized by radiocarbonylation following the original Staudiger Aza-Wittig (SAW) method described in the literature [
25]. Automated radiolabelling was performed using a MeIplus research module (Synthra GmbH, Hamburg, Germany) with modifications to undergo direct bubbling of the [
11C]CO
2. No carrier-added [
11C]CO
2 (30–40 GBq) was produced via the
14N(p, α)
11C nuclear reaction by irradiation of an [
14N]N
2 target containing 0.15–0.5% of O
2 on a cyclone 18/9 cyclotron (18 MeV, IBA, Ottignies-Louvain-la-Neuve, Belgium) and trapped at −180 °C. [
11C]CO
2 was then released at 0 °C under a stream of helium (8 mL/min) to bubble for 10 s into the reaction vessel containing a solution of the precursor (1 mg) and dimethylphenyl phosphine (15 µL) in DMF (300 µL) at −50 °C. The mixture was heated at 20 °C for 5 min and hydrolyzed with glacial acetic acid (100 µL), followed by a mixture of H
2O/CH
3CN/TFA (65/35/0.1
v/
v/
v, 1 mL). The crude product was purified by semi-preparative HPLC on a reverse-phase Symmetry C18 column (250 × 4.6 mm, 5 μm, Waters, Milford, CT, USA) using a mixture of H
2O/CH
3CN/TFA (65/35/0.1
v/
v/
v, 5 mL/min) as eluent with gamma and UV (λ = 280 nm) detection. The collected peak of [
11C]domperidone was diluted with water (20 mL) and loaded on a C18 cartridge (Sep-Pak C18, Waters, Milford, CT, USA). The cartridge was rinsed with water (10 mL), and the product was eluted with ethanol (2 mL) and further diluted with aq. 0.9% NaCl (8 mL). Ready-to-inject [
11C]domperidone (5.9 ± 0.3 GBq) was obtained within 30 min from the end of the beam in 47 ± 4% RCY and 85 ± 15 GBq/µmol MA at the EOB (
n = 12) (
Figure 1B).
For both radiotracers, quality control was performed by HPLC using a 717 plus Autosampler system equipped with a 1525 binary pump and a 2996 photodiode array detector (Waters, Milford, CT, USA) and a Flowstar LB 513 (Berthold, Thoiry, France) gamma detector. The system was monitored with the Empower 3 (Waters, Milford, CT, USA) software. HPLC were realized on a reverse-phase analytical Symmetry C18 (50 × 3.9 mm, 5 μm, Waters, Milford, CT, USA) column using either a mixture of aqueous NaH2PO4 (4 mM)/acetonitrile/H3PO4 (90/10/0.2 v/v/v, 2 mL/min) or a mixture of H2O/CH3CN/PicB7® (70/30/0.2 v/v/v, 2 mL/min) as eluent for [11C]metoclopramide or [11C]domperidone, respectively. UV detection was performed at 274 nm or 285 nm for [11C]metoclopramide or [11C]domperidone, respectively. Identification of the peak was assessed by comparing the retention time of the carbon-11-labeled compound with the retention time of the non-radioactive reference (tRref). For acceptance, the retention time must be within the tRref ±10% range. Radiochemical purity (RCP) was calculated as the ratio of the peak’s area under the curve (AUC) over the sum of the AUCs of all other peaks on gamma chromatograms. RCP is the mean value of three consecutive runs. The RCY of the labeling reaction was calculated as the ratio of the decay-corrected activity at the end of the synthesis (AEOS) CO2 measured in an ionization chamber (Capintec®, Berthold, Thoiry, France) over the starting activity of [11C]CO2 (ACO2) measured by the calibrated detector of the synthesizer. This ratio was corrected for the RCP following the equation: RCY = (AEOS/ACO2) × RCP. MA was calculated as the ratio of the activity of the collected peak of the radioactive product measured in an ionization chamber (Capintec®, Berthold, Thoiry, France) over the molar quantity of the compound determined using calibration curves. MA was calculated as the mean value of three consecutive runs.
2.4. Uptake Assay in P-gp Overexpressing Cells
Culture media and buffers were obtained from Fischer Scientific, France. Stably transfected MDCKII-MDR1 cells were obtained from Dr. Alfred Schinkel (National Cancer Institute, Amsterdam, The Netherlands) and were grown under a controlled atmosphere at 37 °C, 5% CO2. The culture medium was composed of DMEM Glutamax (Dulbecco’s Modified Eagle Medium, 4.5 g/Ldextrose, 1 mM pyruvate) supplemented with 10% fetal bovine serum and 1% antibiotics (penicillin and streptomycin 5000 U/mL).
P-gp-mediated transport of [11C]domperidone and [11C]metoclopramide was compared in cells expressing human P-gp. Cells were seeded in 24-well plates (30,000 cells per well) in a 500 μL culture medium. Cells were grown to confluence (~2 days). On the day of the experiment, the culture medium was removed and replaced by 200 μL of incubation buffer (10% HBSS (Hanks’ Balanced Salt Solution) + 1.26 mM CaCl2 + 0.49 mM MgCl2) containing 1 mM pyruvate and 10 mM HEPES (4-(2-hydroxyethyl)-1-piperazineethanesulfonic acid, 37 °C). The incubation buffer contained the tested radiolabeled P-gp substrate (~37 MBq/40 mL corresponding to <1 µg/40 mL of the unlabeled compound) and TQD at the selected concentration. TQD was dissolved in DMSO, and TQD concentrations ranged from 0 to 800 nM (1% v/v final DMSO concentration). After 30 min of incubation at 37 °C, the buffer was removed, and cell monolayers were rapidly washed with 300 μL of ice-cold Dulbecco’s phosphate buffer. Cells were then lysed with 500 μL of NaOH (10 mM, 10 min). Then, 400 μL of cell lysate was collected from each well (n = 4 wells per condition) and gamma counted using a Cobra Quantum (Perkin-Elmer, Villebon-sur-Yvette, France).
2.5. Animals
A total of 12 male Wistar rats (Janvier, Le Genest-Saint-Isle, France) (263 ± 34 g) were used to investigate the brain kinetics of [
11C]domperidone. Animals were housed and acclimatized for at least 3 days before the experiments. Rats had free access to chow and water. All animal experiments were in accordance with the recommendations of the European Community (2010/63/UE) and the French National Committees (law 2013-
118) for the care and use of laboratory animals. The experimental protocol was approved by a local ethics committee for animal use (CETEA) and by the French Ministry of Agriculture (APAFIS#74662016110417049220 v2). The sample size for each group was based on previous studies [
21,
24].
2.6. PET Experiments
PET acquisitions were performed using an Inveon microPET scanner (Siemens, TN, USA). Anesthesia was induced and then maintained using 3.5% followed by 1.5–2.5% isoflurane in O
2. Radiotracers were diluted in saline to obtain at least <10% ethanol in the ready-to-inject preparation. Thirty-minute dynamic scans were acquired, starting with an intravenous bolus injection of [
11C]domperidone (32 ± 5 MBq, 0.80 ± 0.55 µg) via a catheter inserted in the caudal lateral vein. PET data of [
11C]metoclopramide used for comparison with [
11C]domperidone have already been reported. The injected dose of [
11C]metoclopramide used for comparison was (35 ± 5 MBq, 3.4 ± 1.3 µg) [
24].
2.7. P-gp Inhibition Protocol
TQD was used to inhibit P-gp function in rats. TQD was injected in a volume of 200–300 µL into the caudal vein 15 min before radiotracer injection. PET acquisitions using [11C]domperidone were performed after vehicle injection, 8 mg/kg (n = 1) or 15 mg/kg (n = 4) of TQD.
2.8. Arterial Input Function
Dedicated experiments were performed in additional rats to estimate the metabolism and arterial input function of [11C]domperidone in the absence and the presence of P-gp inhibition using TQD (n = 2 for each condition).
Blood samples (50 µL) were collected at selected times from the femoral artery to establish total radioactivity kinetics in arterial plasma. Plasma was separated from whole blood by centrifugation (5 min, 2054 g, 4 °C), and 20 µL of plasma and whole blood were counted using a PET cross-calibrated gamma well counter (WIZARD2, PerkinElmer, Villebon-sur-Yvette, France) to obtain the whole-blood and plasma activity curves. All data were corrected for radioactive decay from the injection time. For the larger blood samples, 80 µL plasma was deproteinized with acetonitrile. The supernatant was injected in high-performance liquid chromatography, equipped with an Atlantis® T3 5 μm 10 × 250 mm column (Waters, Guyancourt, France) and an Atlantis® T3 5 μm 19 × 10 mm pre-column (Waters) with an LB-514 radioactivity flow detector (Berthold, France, MX Z100 cell). The mobile phase was composed of water containing 0.1% (v/v) TFA (solvent A) and acetonitrile containing 0.1% (v/v) TFA (solvent B) delivered in a gradient elution mode at a flow rate of 5 mL min−1: solvent B increased linearly from 20 to 30% from 0 to 9 min. The [11C]domperidone parent fraction was calculated as a percentage of the total radioactivity (metabolites and parent).
For each animal, a 1-exponential decay function was fitted to [11C]domperidone parent fraction, which was time multiplied with the plasma activity curve to obtain the metabolite-corrected arterial plasma input function used for the kinetic modeling.
The method for [
11C]metoclopramide metabolism has been previously reported [
21].
2.9. Data Analysis and Statistics
2.9.1. In Vitro Data
Counting values obtained in each well were normalized using Equation (1):
where
I% is the extent of inhibition (
I%) between 0 and 100%,
R is the radioactivity in the 4 tested wells,
mRzero is the mean of the 4 wells without TQD, and
mRmax is the difference of means between the 4 wells containing the highest concentration of TQD (800 nM) and the 4 wells without TQD.
The in vitro half-maximum inhibitory concentration (IC50) was estimated by non-linear regression using the “One-site binding Hill equation” function in Graphpad Prism software (V8.0, San Diego, CA, USA) with maximal uptake constrained to 100%. IC50 values obtained for each radiotracer were considered different when their 95% confidence interval (CI95%) did not overlap. The uptake ratio (mean ± S.D) of each P-gp substrate was determined as the maximal intracellular radioactivity after complete inhibition of P-gp (800 nM TQD for [11C]-domperidone and 200 nM for [11C]metoclopramide) divided by the mean intracellular radioactivity without P-gp inhibition. The normality of the data was checked using the Kolmogorov–Smirnov test. Uptake ratios were then compared using the t-test.
2.9.2. PET Data Analysis
Images were reconstructed with the Fourier rebinning algorithm and the three-dimensional ordered-subset expectation-maximization algorithm, including normalization, attenuation, scatter, and random corrections. Image analysis and quantification of radioactivity uptake were performed using PMOD software (version 3.9; PMOD Technologies, Zurich, Switzerland). A region of interest was drawn over the whole brain to generate time-activity curves (TACs) with time frame durations of 0.25 min, 2 × 0.5 min, 0.75 min, 4 × 1 min, 1.5 min, 4 × 2 min, 3 × 2.5 min, 3 × 3 min, and 3.5 min. Brain radioactivity was corrected for 11C decay and expressed as the standardized uptake value (SUV) after correction by injected dose and animal weight.
Brain and plasma exposure of [11C]domperidone was estimated by the area under the TAC between 0 and 30 min and 20 and 30 min in the brain (AUCbrain 0–30; AUCbrain 20–30; n = 3–4 per condition) and between 20 and 30 min in the plasma (AUCplasma 20–30; n = 2 per condition). The mean AUCplasma 20–30 was obtained in each condition to estimate Kp,brain = AUCbrain 20–30/AUCplasma 20–30, considering the mean metabolite-corrected arterial input function. Kp,brain were compared with a two-way ANOVA and a Tukey’s post hoc test using Graphpad Prism software (V8.0, San Diego, CA, USA).
4. Discussion
PET imaging using isotopically radiolabeled drugs provides a unique method to compare their transporter-mediated brain kinetics in vivo, with translational perspectives [
29]. In the present study, domperidone was radiolabeled with carbon-11 to estimate its BBB penetration in rats. Domperidone is considered an avid substrate of the P-gp [
9] and may be viewed as an alternative probe to estimate the P-gp function at the BBB. The impact of P-gp inhibition on the P-gp-mediated transport of domperidone was first tested in vitro. Relevance for in vivo neuropharmacokinetics was then assessed in vivo using PET. [
11C]domperidone PET data could then be compared with those of [
11C]metoclopramide, which belongs to the same pharmacological class and is considered a weak substrate of the P-gp at the BBB [
21].
Because metoclopramide bears a methyl group on a phenol moiety, it is a candidate for carbon-11 isotopic labeling by radiomethylation, the most standard approach to incorporate this radioisotope [
30]. Radiomethylation was performed using [
11C]methyl triflate, which afforded better yields than [
11C]methyl iodide within shorter reaction times (2 min for [
11C]CH
3OTf versus 5 min for [
11C]CH
3I). Sodium hydroxide appeared to be the best base to perform this radiomethylation [
26]. Although other solvents with higher boiling points than acetone, such as butanone, can be used to radiolabel [
11C]metoclopramide [
31], yields are comparable, and acetone offers a strong solubility power regarding the desmethyl precursor. Compared with [
11C] metoclopramide, isotopic radiolabeling of domperidone with carbon-11 brings a real challenge. Domperidone does not offer a position for methylation, and an alternative strategy had to be developed. Domperidone displays two cyclic urea moieties, which could be radiolabeled with [
11C]CO
2 through carbonylation reactions either using phosgene [
32], phosphazene derivatives [
33], or carbon monoxide [
34]. However, these methods use very reactive chemical agents and/or harsh conditions incompatible with fully functionalized molecules such as drugs. As a result, these methods were never applied to the synthesis of radiotracers for in vivo PET imaging purposes. The orthogonal SAW approach enables the isotopic radiolabeling of domperidone, among other functionalized molecules, in high yields and purity [
25]. Moreover, this radiosynthesis strategy could be automated, leading to the reproducible production of [
11C]domperidone suitable for in vivo injection in rats.
From a translational perspective, the molar activity of ready-to-inject [
11C]domperidone allows for the injection of <100 µg of unlabeled domperidone for a classical dose of 370 MBq. This suggests that [
11C]domperidone may be further used in humans according to the PET microdosing guidelines [
35]. Moreover, preclinical data obtained in rodents showed linear pharmacokinetics, suggesting that a microdose of [
11C]domperidone may predict the pharmacokinetics of the pharmacological dose of domperidone [
36].
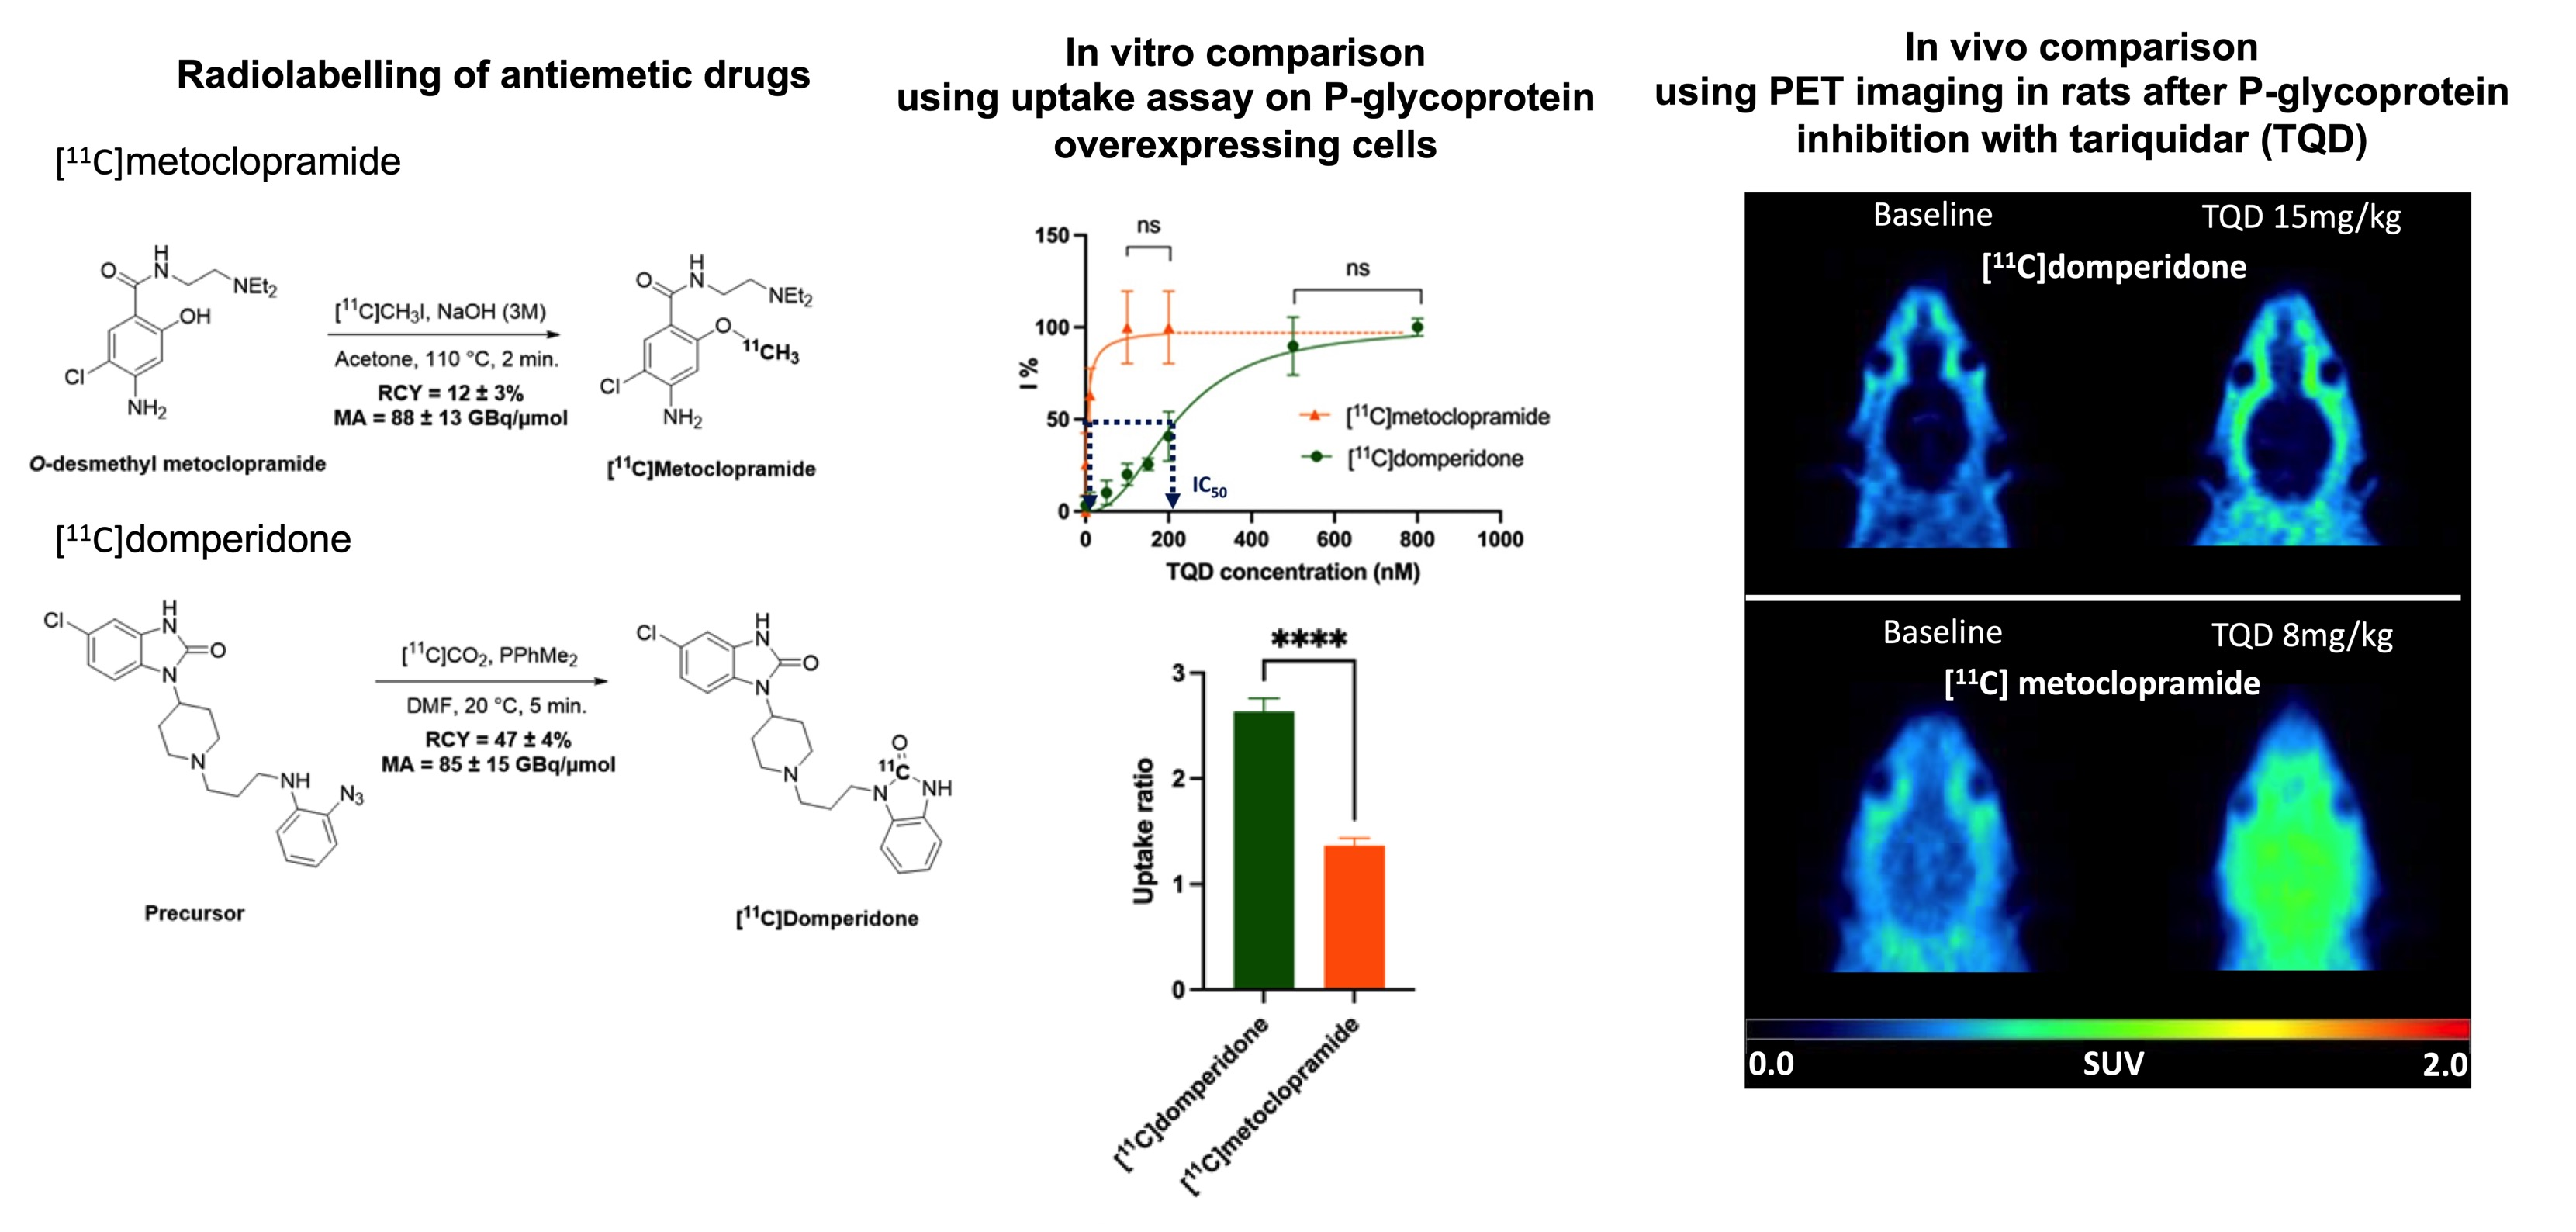
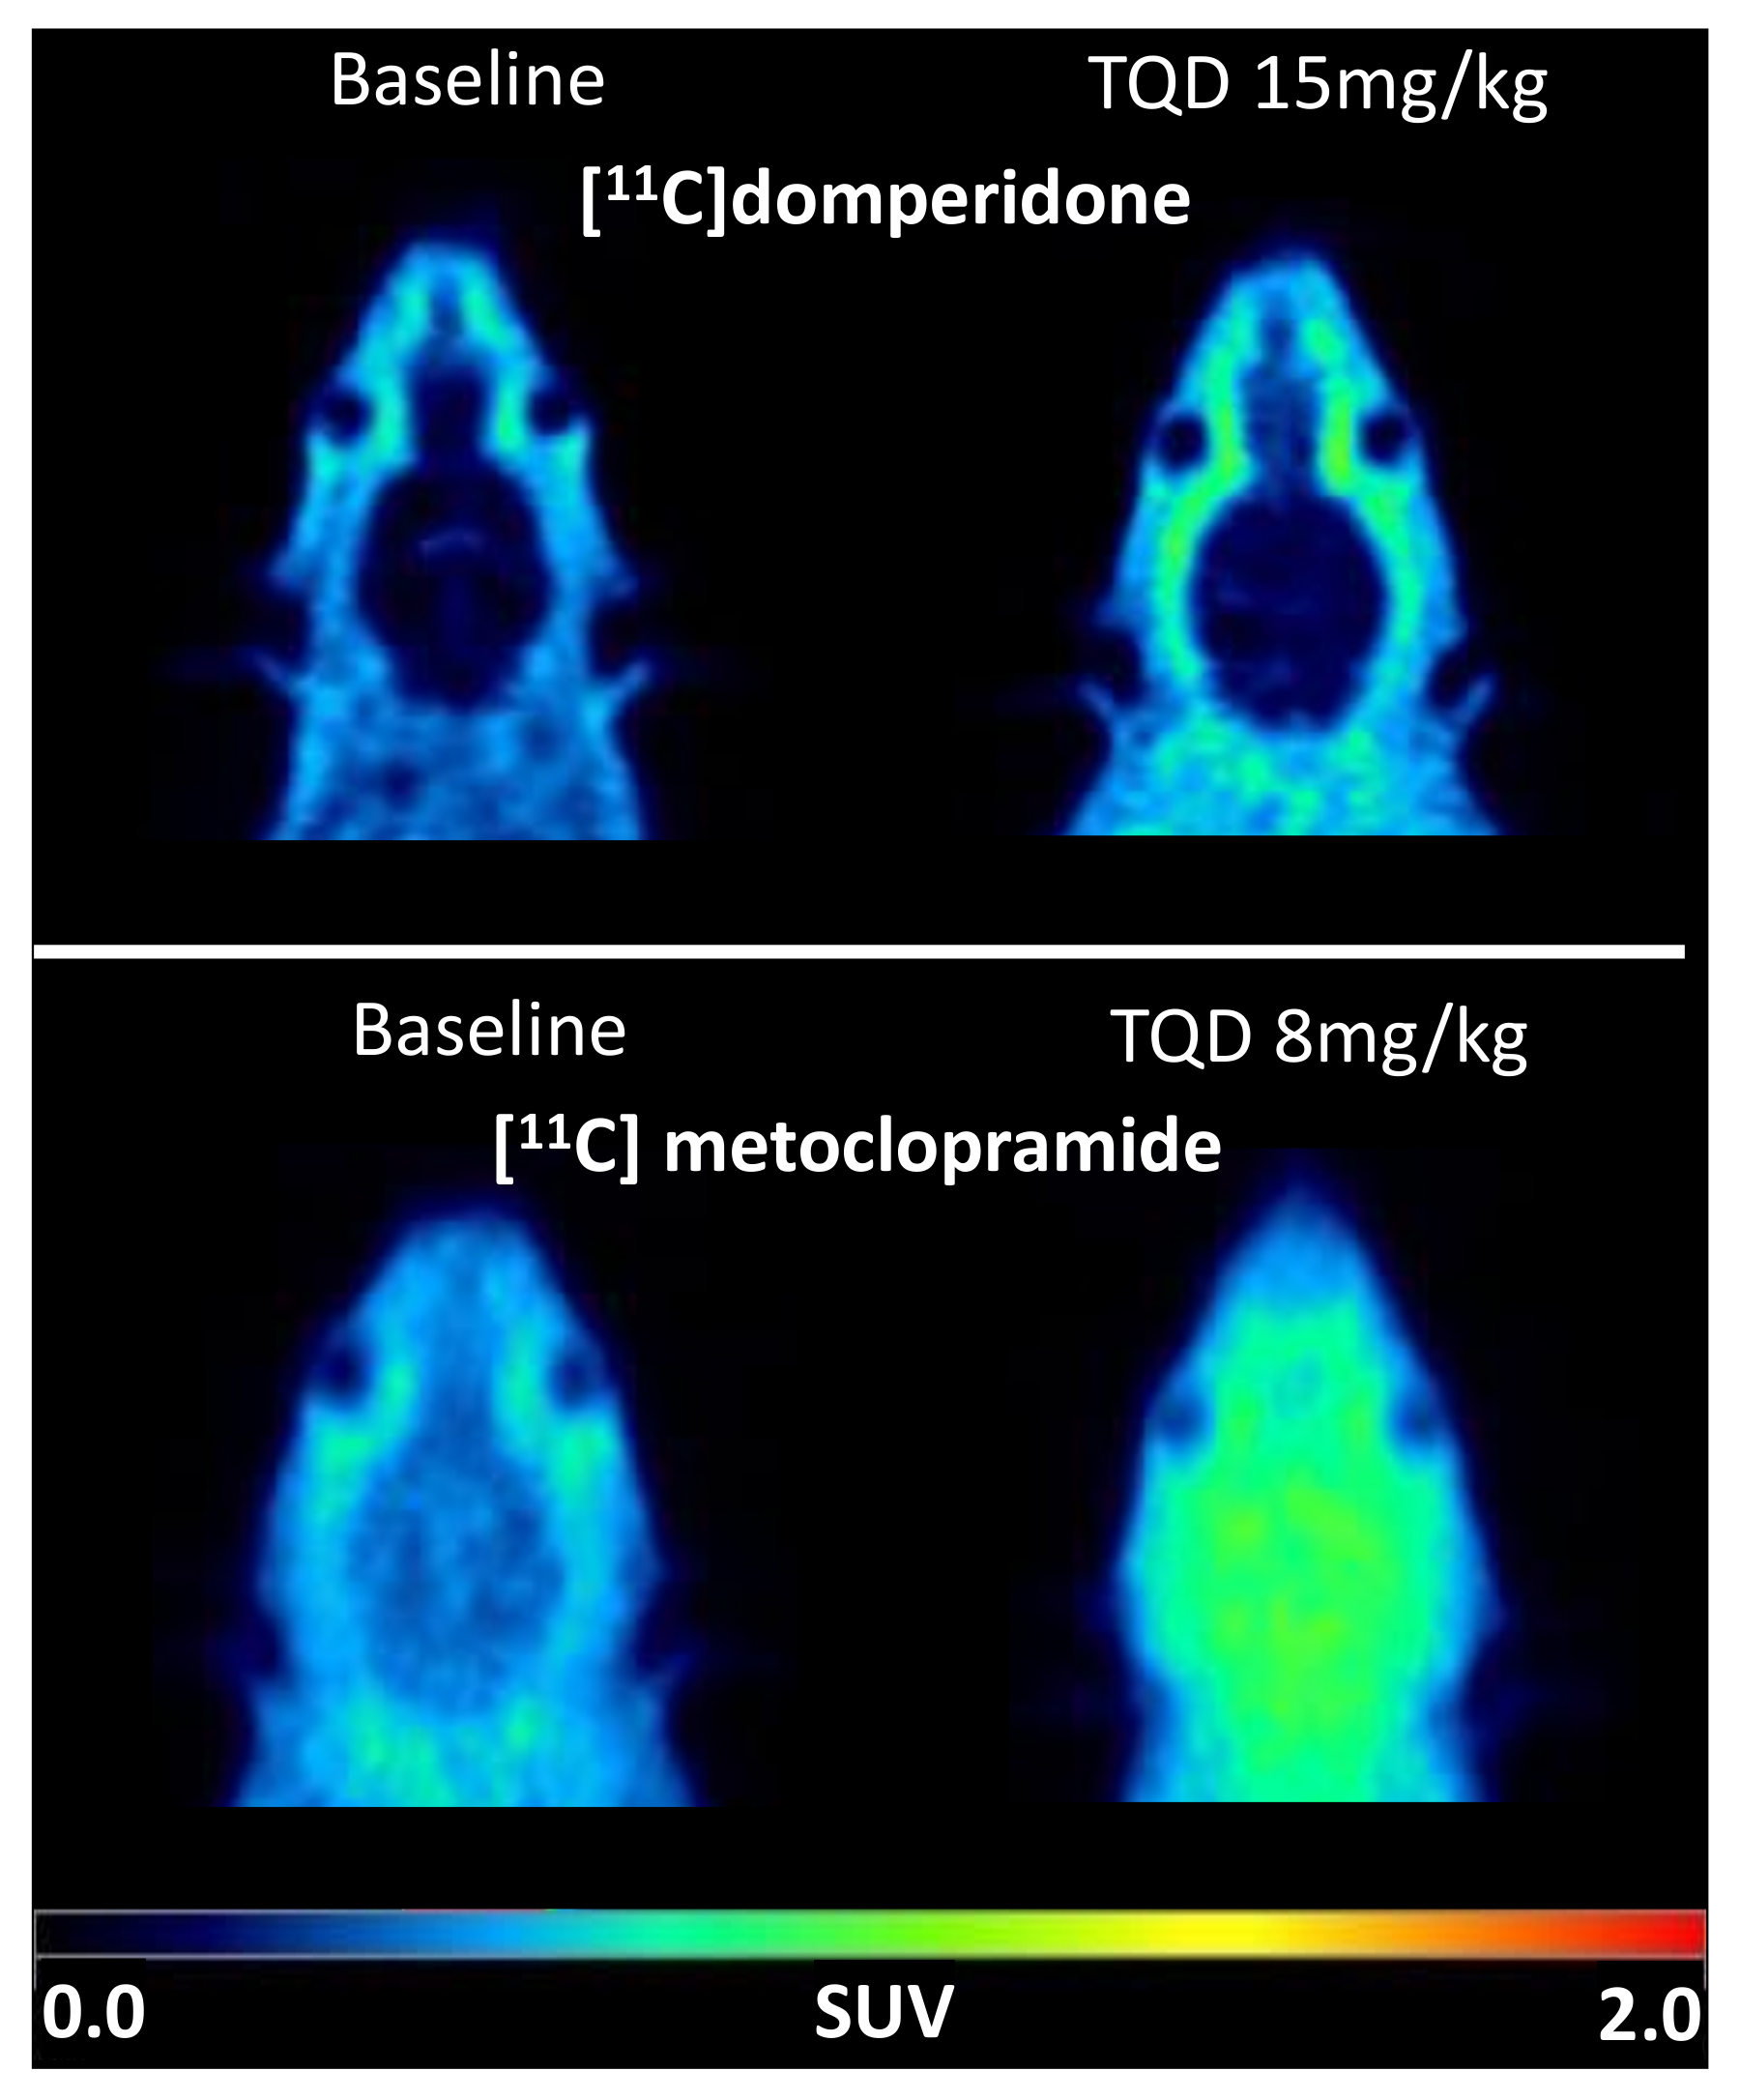
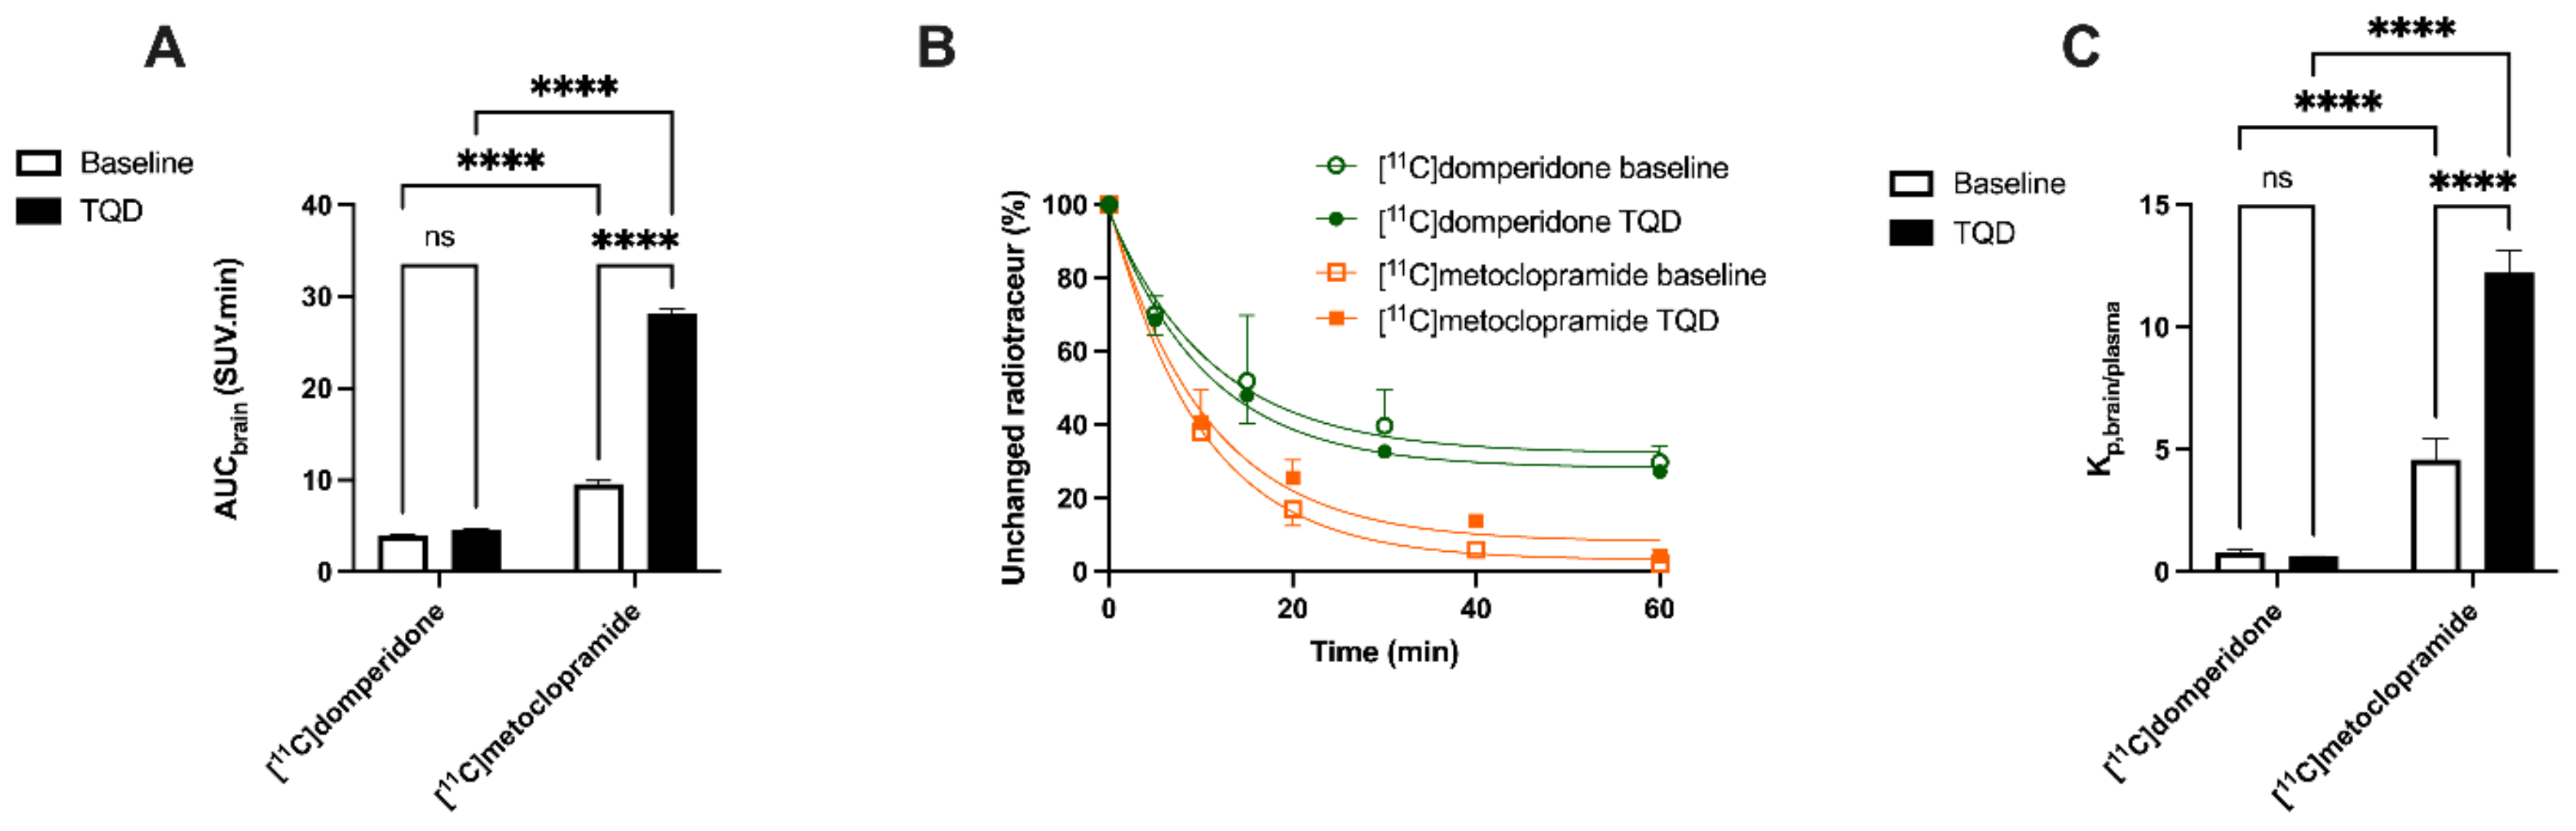
Brain PET images obtained after injection of [
11C]domperidone in rats revealed its extremely low brain uptake compared with surrounding tissues, suggesting limited passage across the BBB. Baseline uptake (AUC) of [
11C]domperidone was 2.5-fold lower (
p < 0.0001) than the uptake of [
11C]metoclopramide obtained in the same species and under the same conditions. However, brain PET kinetics have to be interpreted in the light of peripheral kinetics to correctly estimate the passage of radiolabeled compounds across the BBB [
37]. [
11C]Domperidone was slowly metabolized compared with [
11C]metoclopramide. Indeed, parent (unmetabolized) [
11C]domperidone accounted for more than >30% in plasma at 60 min post-injection, while parent [
11C]metoclopramide could hardly be detected at this time. Interestingly, metabolites of domperidone and domperidone itself were shown to poorly cross the BBB in rats using ex vivo determination [
36].
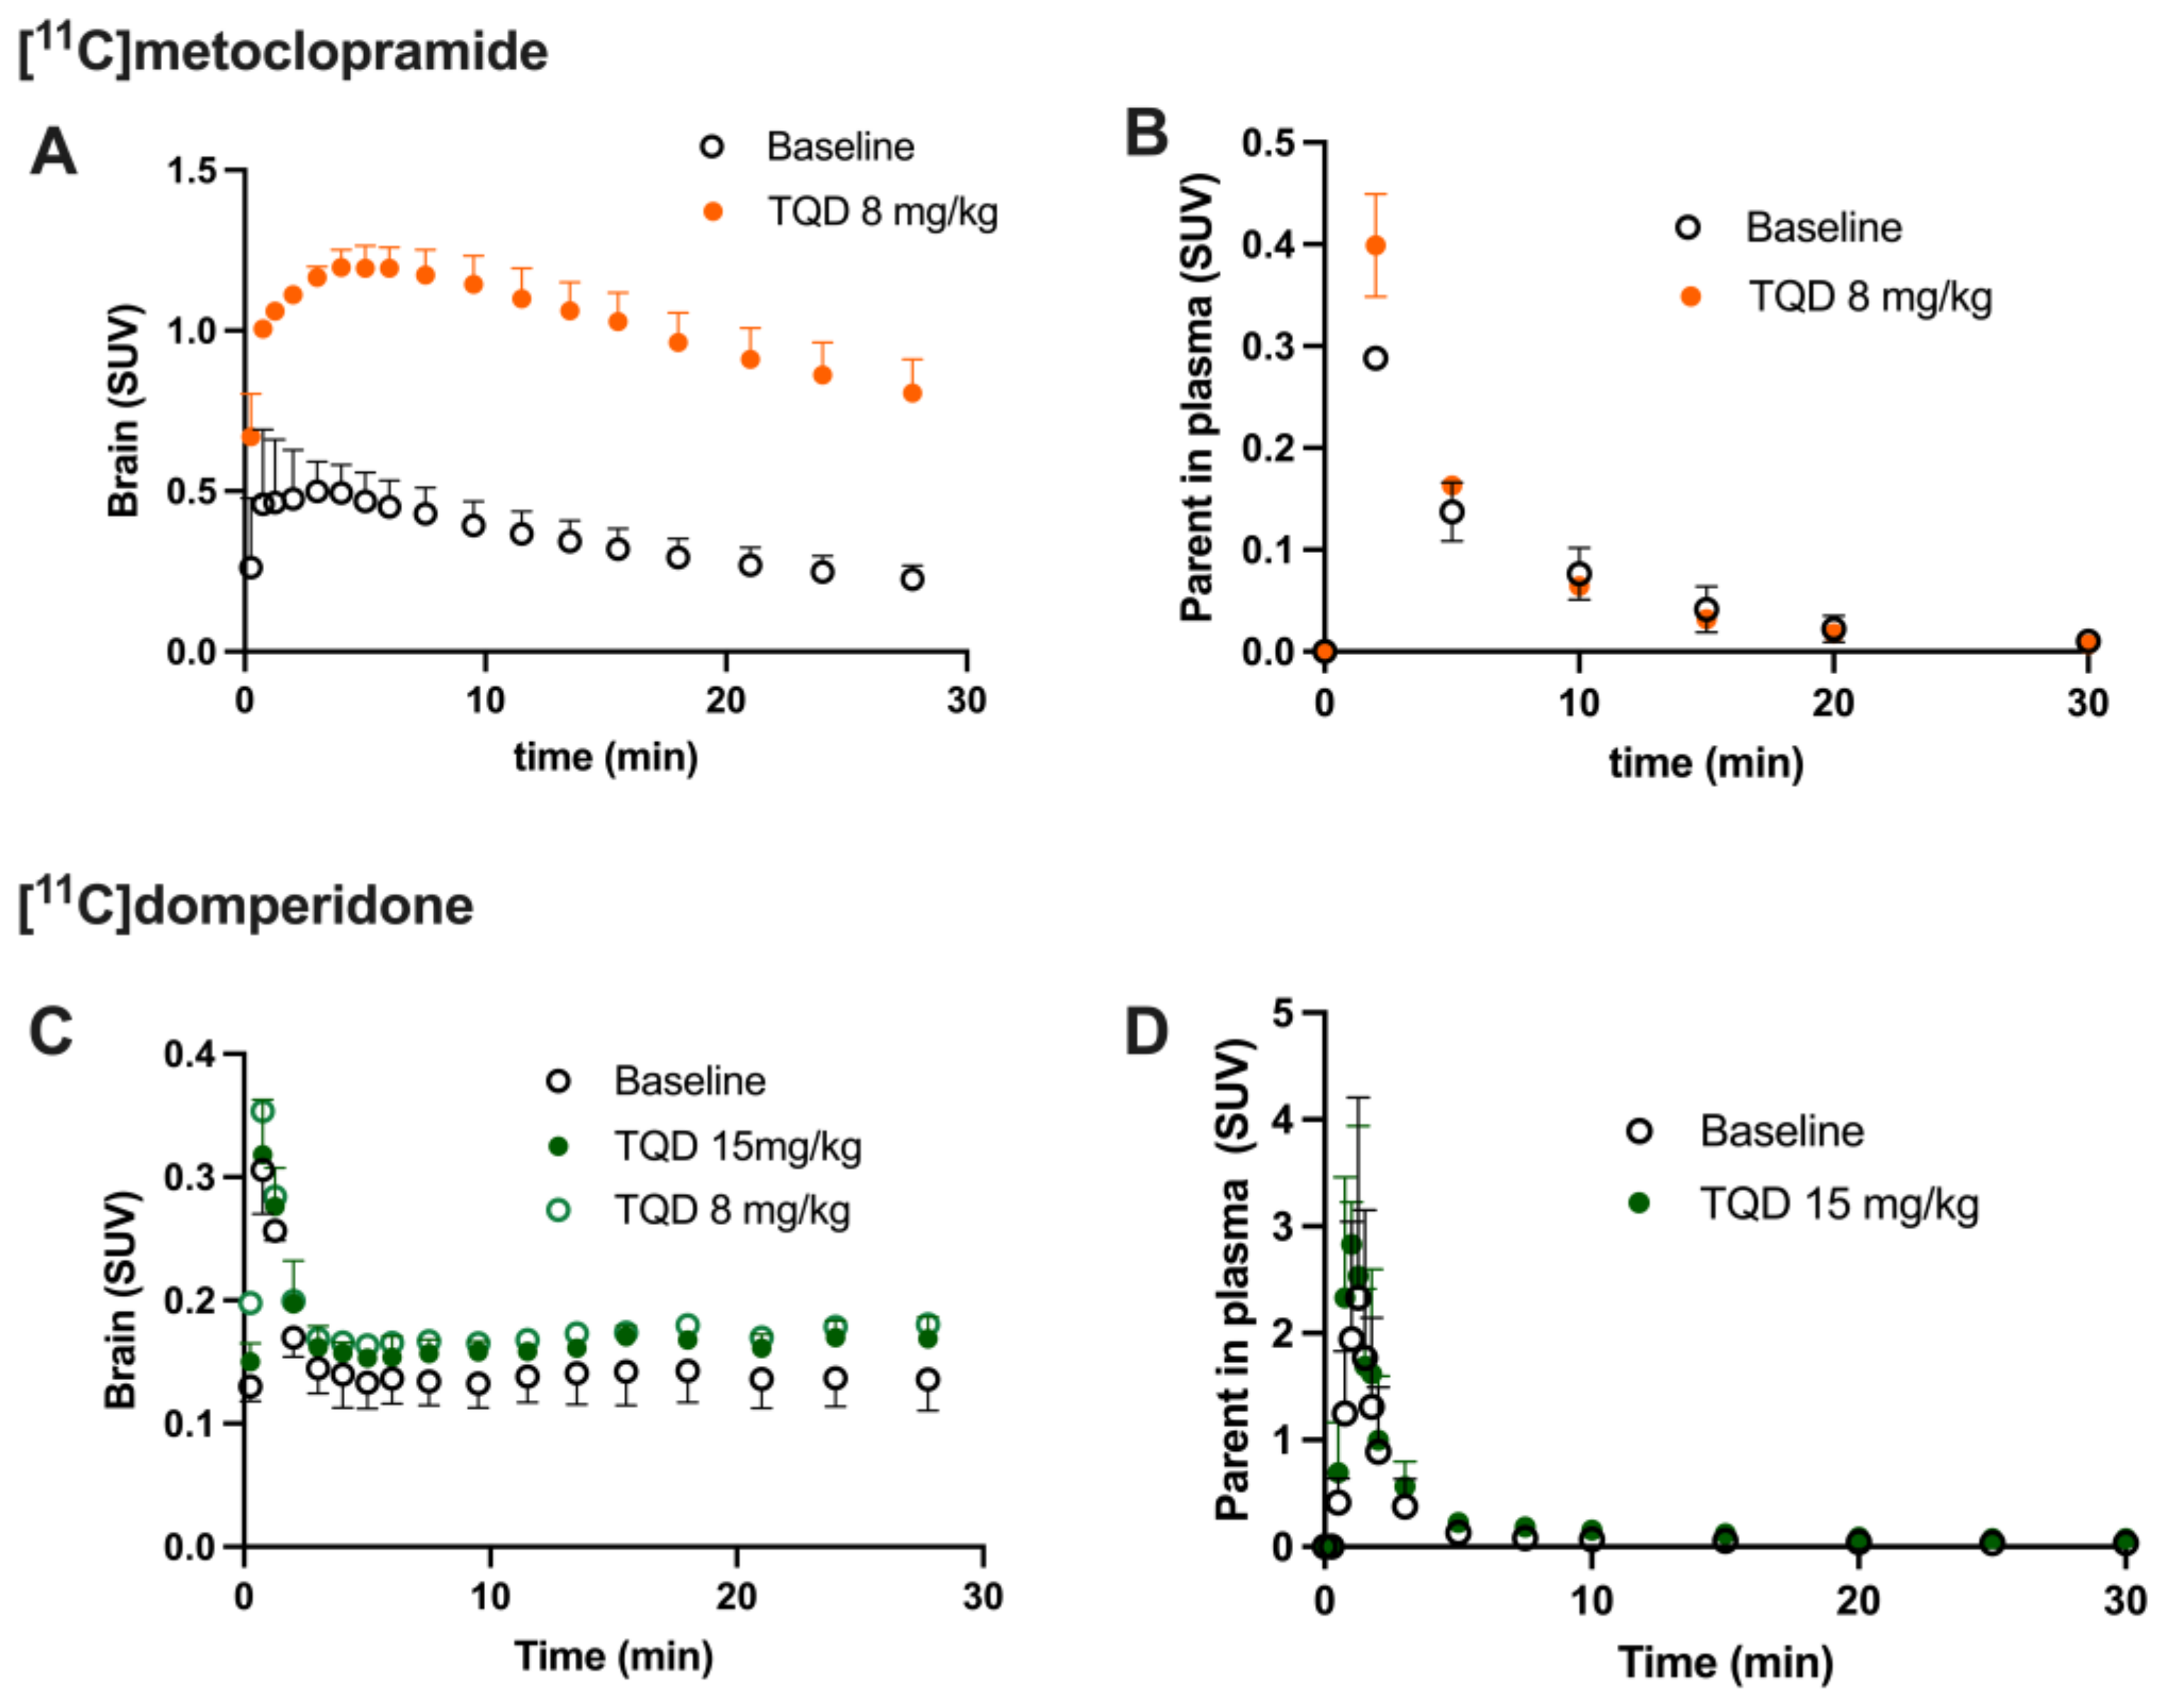
Determination of the arterial input function of [11C]domperidone was used to allow for kinetic modeling of the brain penetration across the BBB. However, poor estimation of kinetic parameters was obtained (data not shown). This may be linked with the negligible brain penetration of [11C]domperidone. Moreover, it is challenging to perform arterial blood sampling in rats during PET acquisition, and different animals were used for PET imaging and determining the arterial input function, respectively. This may complicate the kinetic modeling, especially in organs with poor uptake and rapid peak, such as the brain. Therefore, the brain penetration of [11C]domperidone was estimated in a model-independent manner. Kp,brain of [11C]domperidone was 2.46 ± 0.42. This is 4-fold lower than the Kp of [11C]metoclopramide, confirming a higher BBB passage for metoclopramide when P-gp is fully functional.
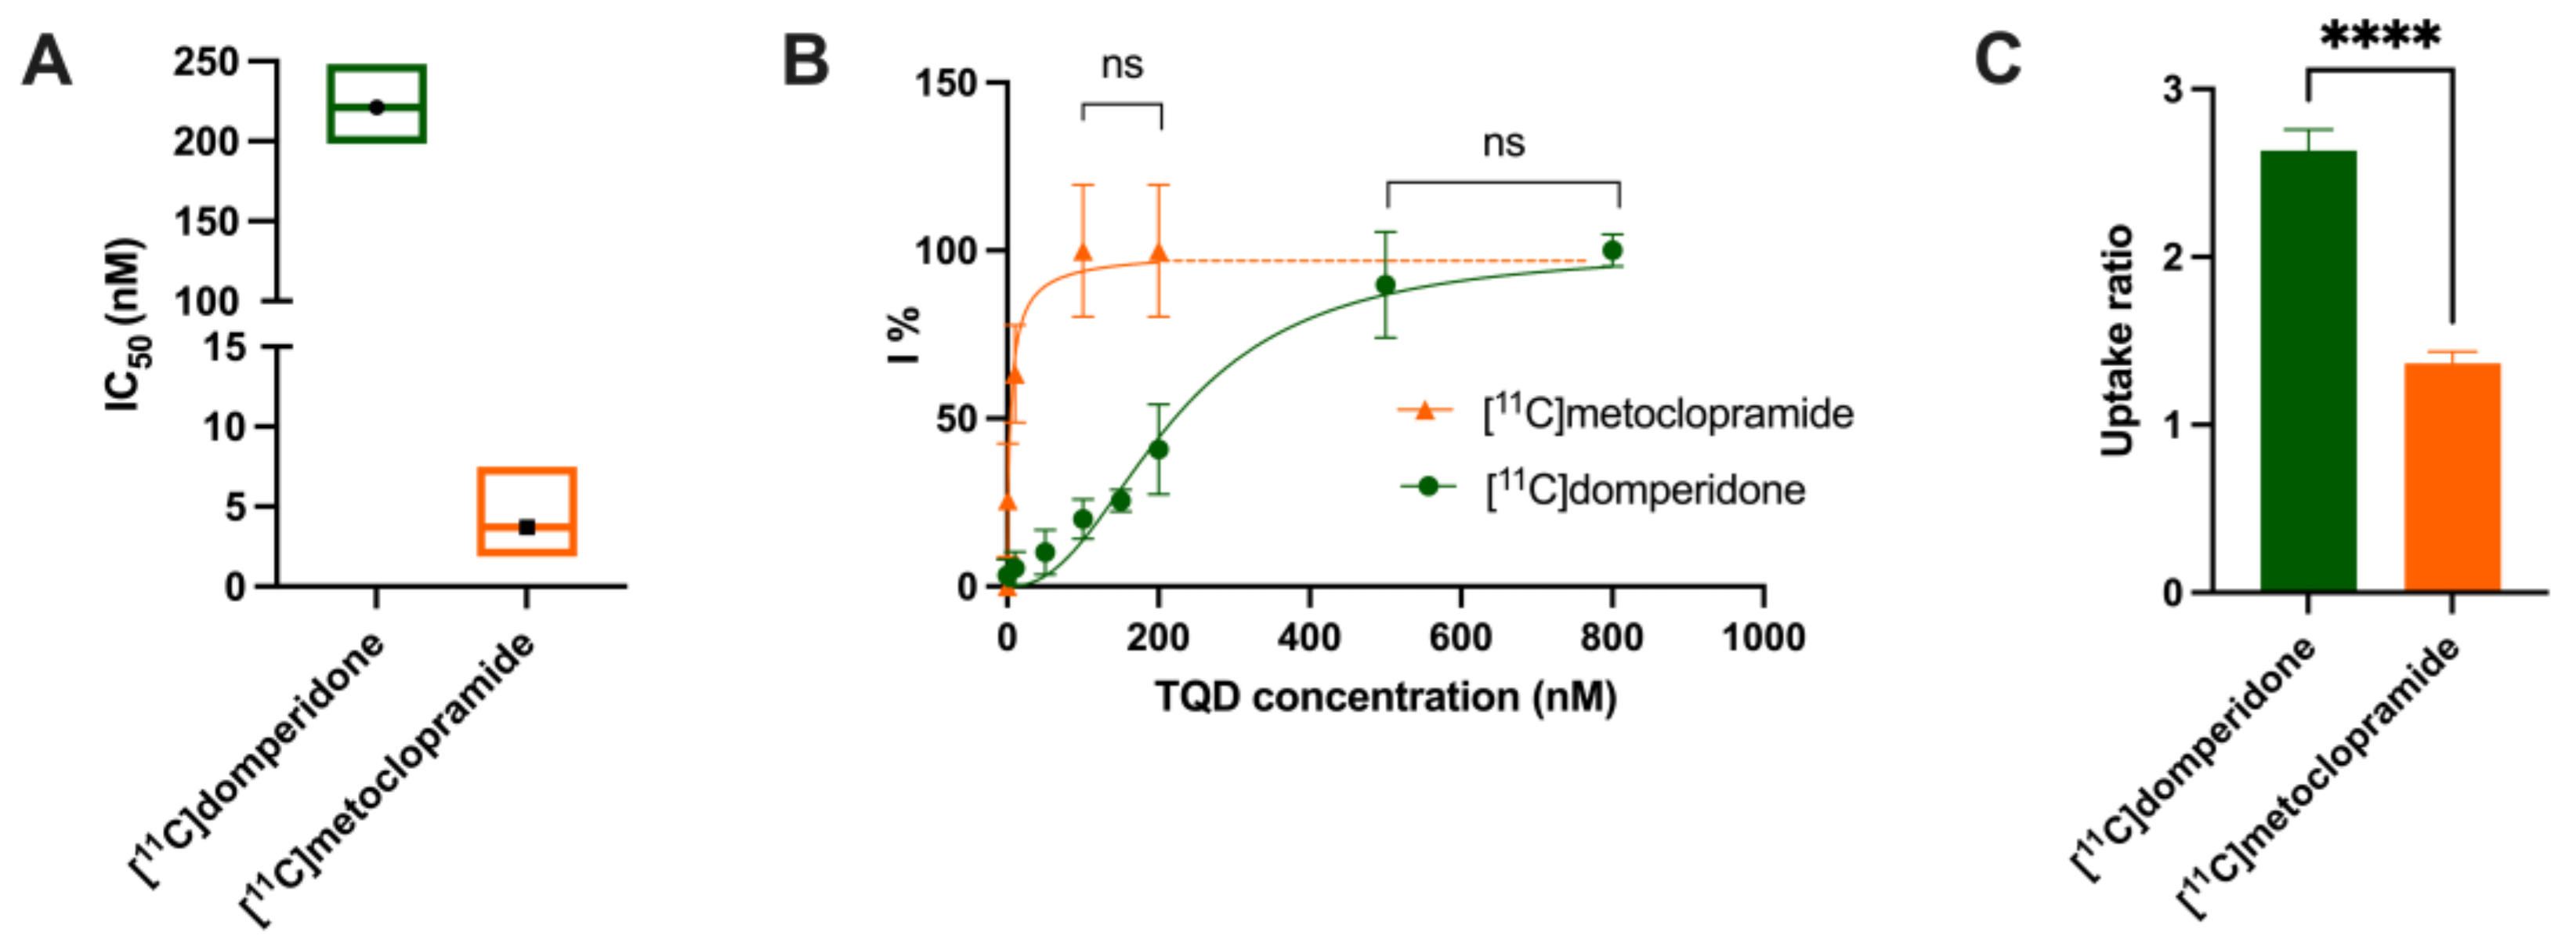
Then the importance of P-gp function at the BBB on the brain kinetics of [
11C]domperidone was tested. First, the P-gp-mediated transport of [
11C]domperidone was tested in vitro using human MDR1 gene-transfected cells. The maximal response to inhibition using TQD was 2-fold higher for domperidone compared with metoclopramide. Using a standardized method, this confirmed that domperidone is a more avid substrate of the P-gp than metoclopramide. Interestingly, testing an extensive range of concentrations of TQD, we show that high concentrations of TQD are needed to achieve maximal inhibition of P-gp in vitro. Indeed, the IC
50 of TQD using [
11C]domperidone as a substrate probe was 221 nM, whereas it was 4 nM when using [
11C]metoclopramide as a probe. This IC
50 value can be directly compared with other PET probes such as [
11C]verapamil (45 nM) and [
11C]N-desmethyl-loperramide (19 nM), estimated using the same experimental conditions [
24]. This suggests that domperidone is refractory to P-gp inhibition in vitro and consequently that inhibition of the P-gp-mediated transport of domperidone may be challenging to achieve in vivo.
Consistently, the maximal dose of TQD used for the [
11C]metoclopramide study (8 mg/kg) did not impact the brain kinetics and BBB penetration of [
11C]domperidone in rats (
n = 1). A higher dose was therefore tested (15 mg/kg,
n = 4) and did not either enhance the brain penetration of [
11C]domperidone in vivo (
p > 0.05). Using in situ brain perfusion, Dagenais and colleagues reported a 3.1-fold higher passage of domperidone in P-gp-deficient mice than in wild-type animals [
38]. Moreover, a massive dose of the P-gp inhibitor cyclosporine (2.5 µM in brain perfusion) increased the brain penetration of [
11C]domperidone by 1.87-fold in mice, which enhanced the catalepsy induced by a pharmacological dose of domperidone [
19]. Although species differences in the P-gp-mediated substrates between mice and rats may occur [
39], it is likely that the high dose of TQD administered in our study was insufficient to achieve complete inhibition of the P-gp-mediated transport of domperidone in rats.
An explanation for how P-gp can maintain the interaction with domperidone after blocked activity by TQD is the interaction of domperidone with a different biding site of P-gp than TQD. However, TQD seems to have an action on the P-gp conformation and the ATPase activity [
40] in a fixation site-independent manner even if a biding site interaction cannot be totally excluded without further investigations [
41]. Another possibility is the interaction of domperidone with other efflux transporters at the BBB other than P-gp.
From a clinical perspective, complete P-gp inhibition leading to the situation of knockout animals is rarely achieved [
42]. This especially holds for domperidone, which behaves as an inhibition-refractory substrate compared with metoclopramide or other substrates [
24]. This suggests that domperidone shows a limited passage across the BBB compared with metoclopramide. Moreover, our in vitro assay using cells expressing the human P-gp and in vivo PET experiments performed in rats suggest that inhibition of the P-gp mediated transport of domperidone at the BBB is very unlikely. This supports the use of domperidone for pathological conditions where CNS effects of D2 antagonists have to be avoided, such as the prevention of emesis induced by DOPA therapy. Moreover, our study does not support a risk for DDIs involving P-gp at the BBB between domperidone and co-administered drugs.


 ,
, 


