
Simultaneous Determination of Glibenclamide and Silymarin Released from Chitosan Microparticles by HPLC-ESI-MS Technique: Method Development and Validation


 , , , and
Abstract
1. Introduction
2. Materials and Methods
2.1. Materials
2.2. CS-Gli-Sil Microparticle Synthesis
2.3. Morphological Characterization of CS-Gli-Sil Microparticles
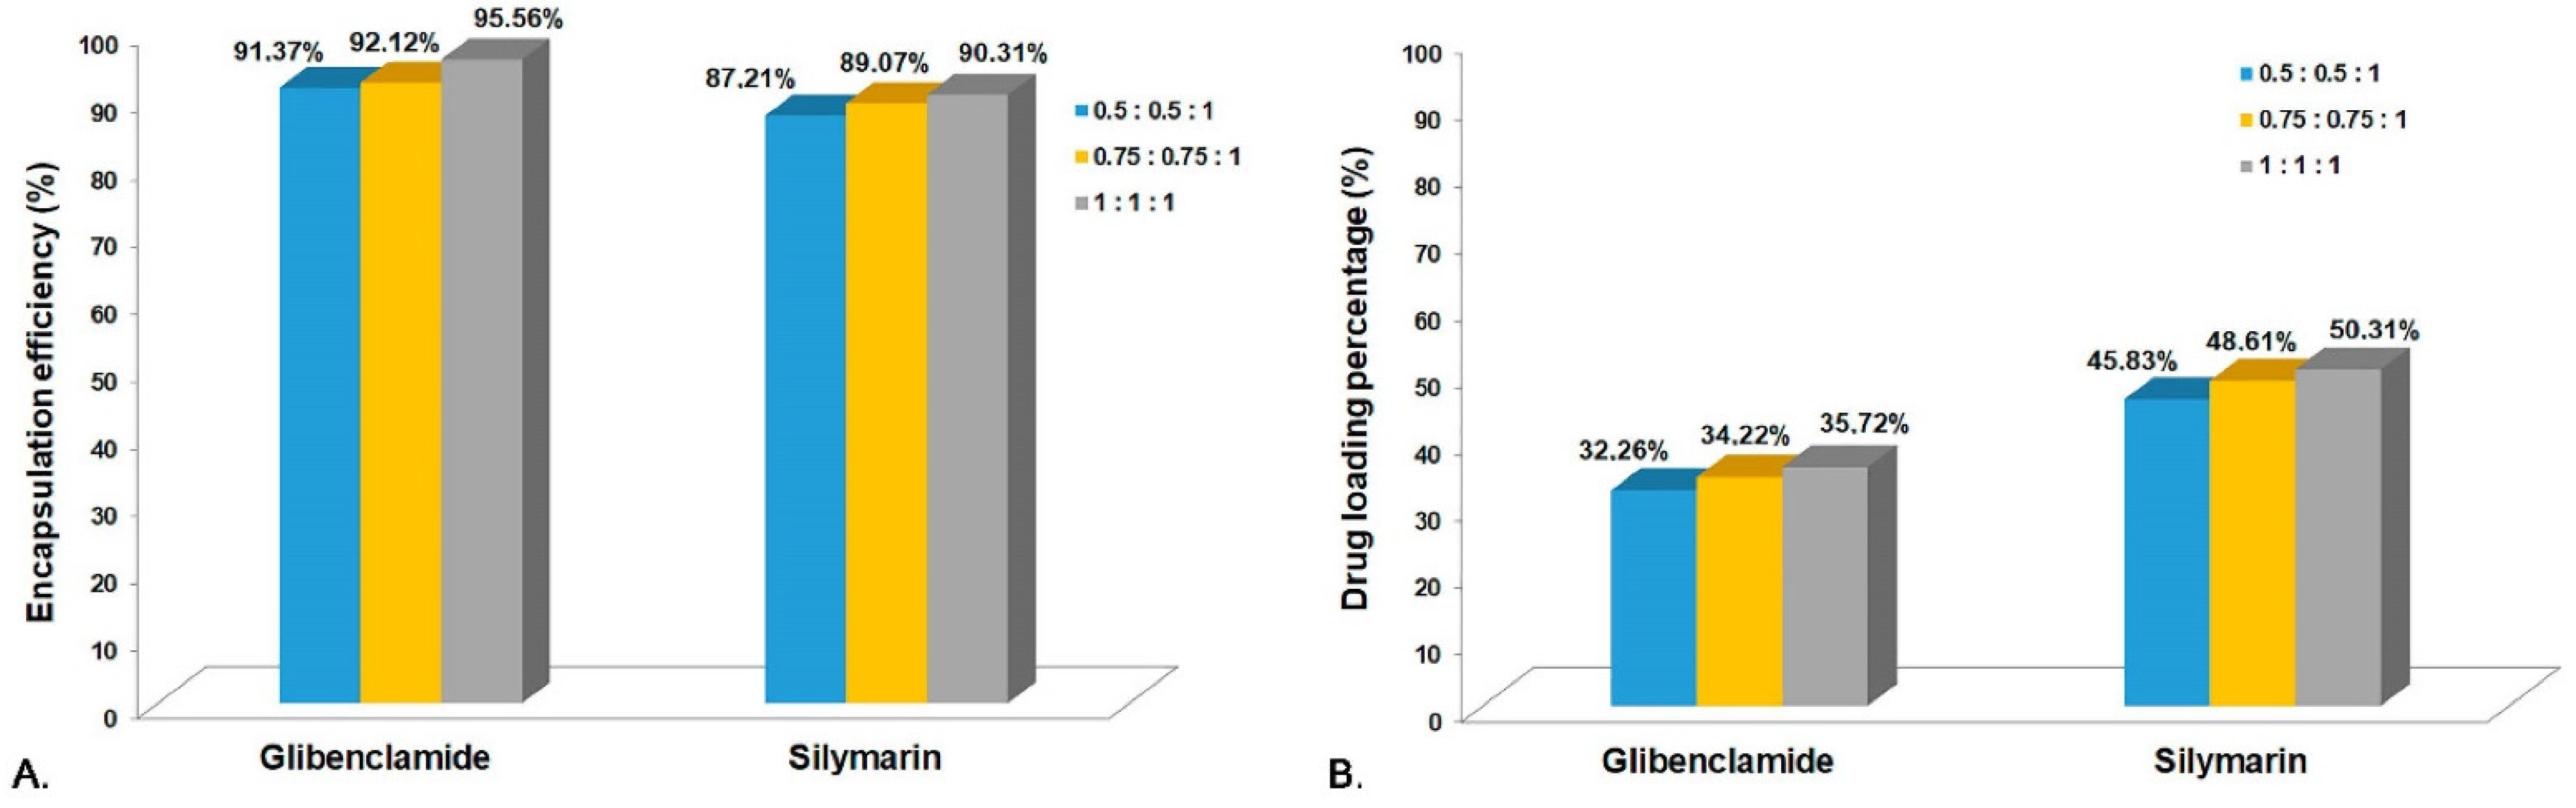
2.4. Encapsulation Efficiency (EE%) and Drug Loading Percentage (DL%)
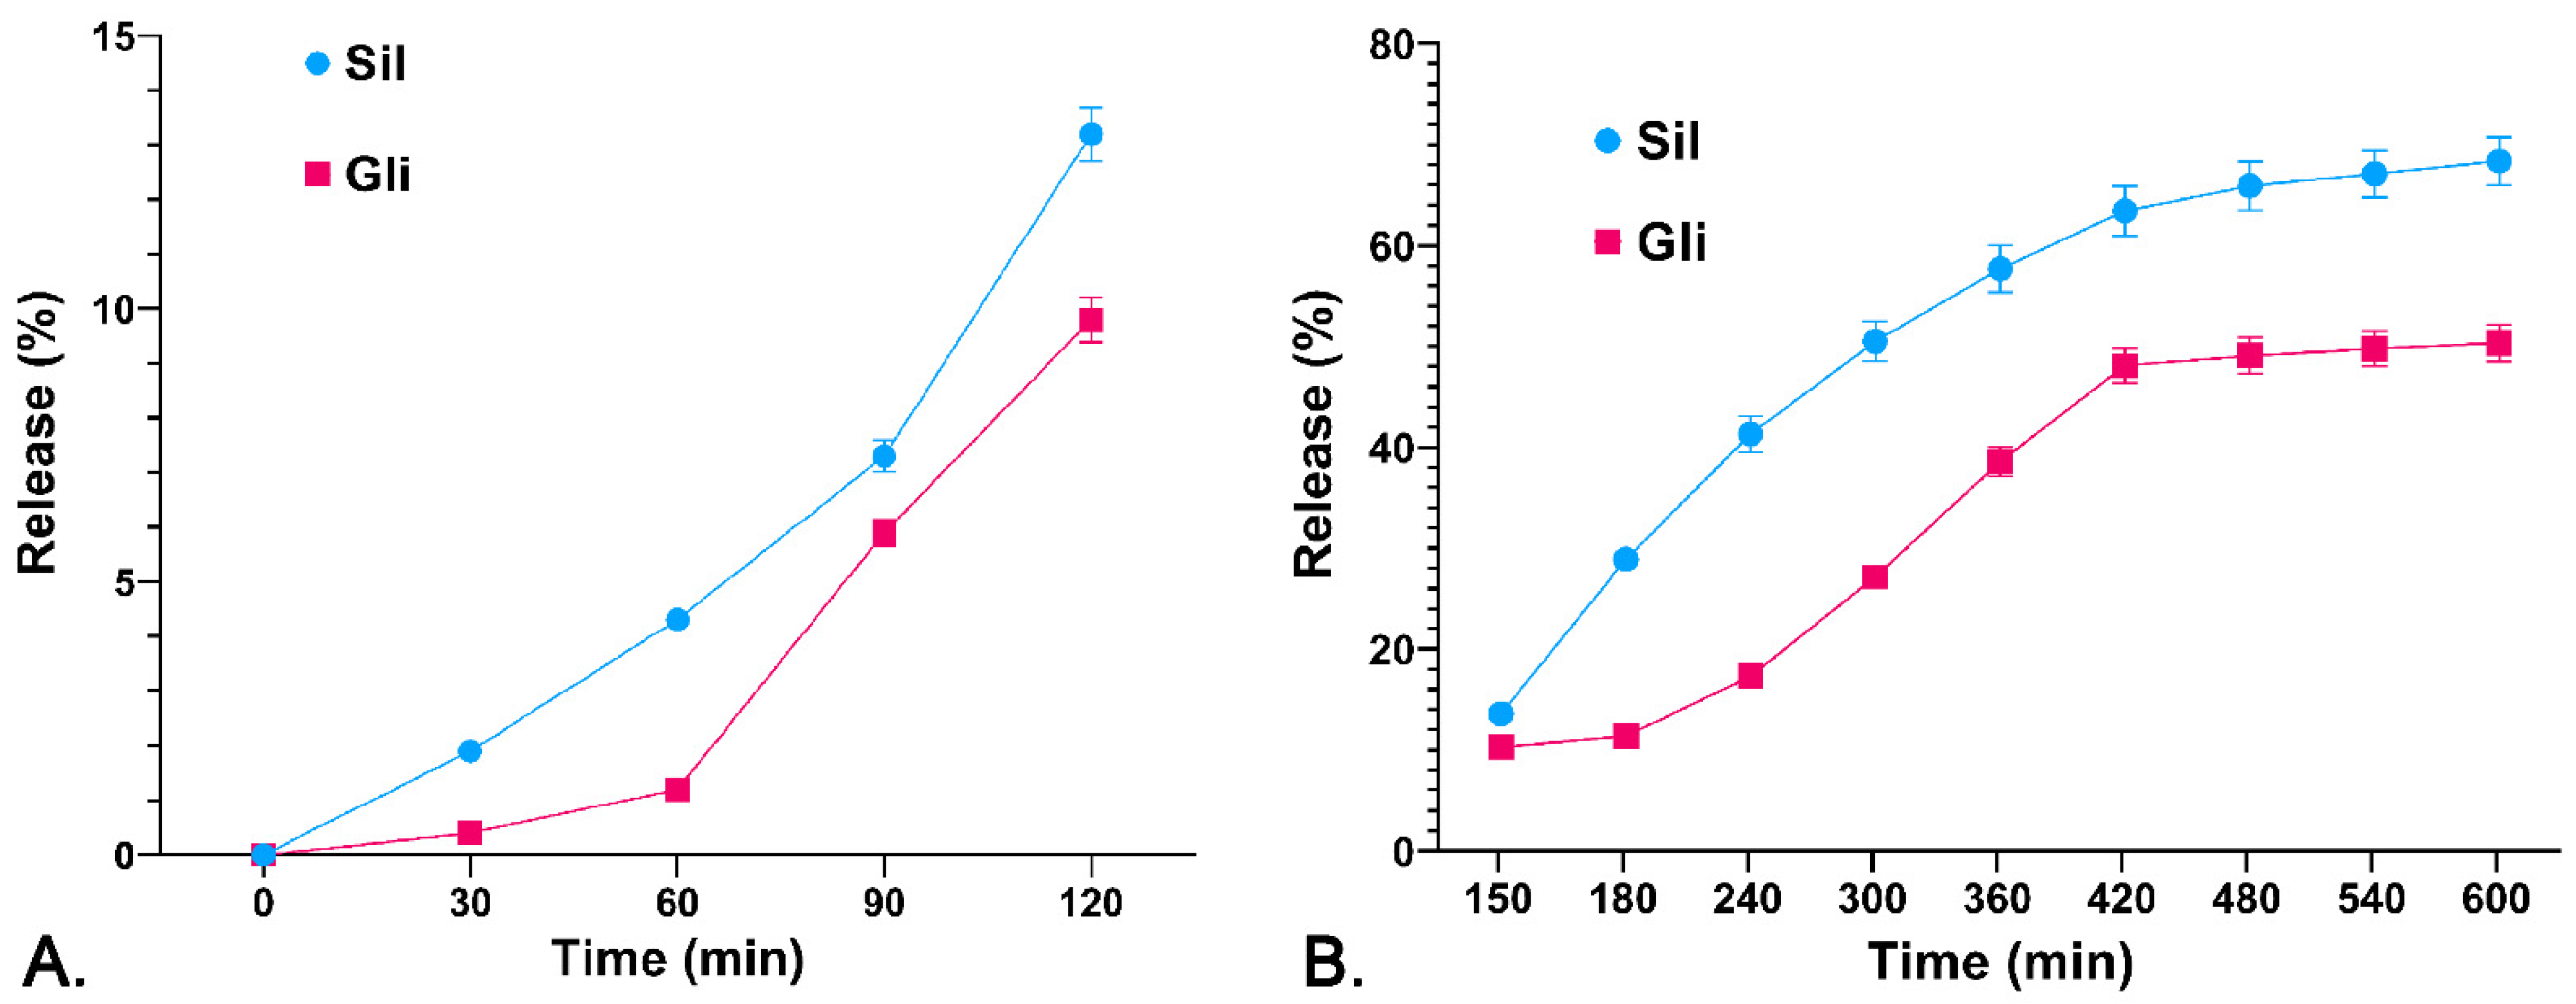
2.5. The Drug Releasing Degree DR (%) from the Polymer Matrix
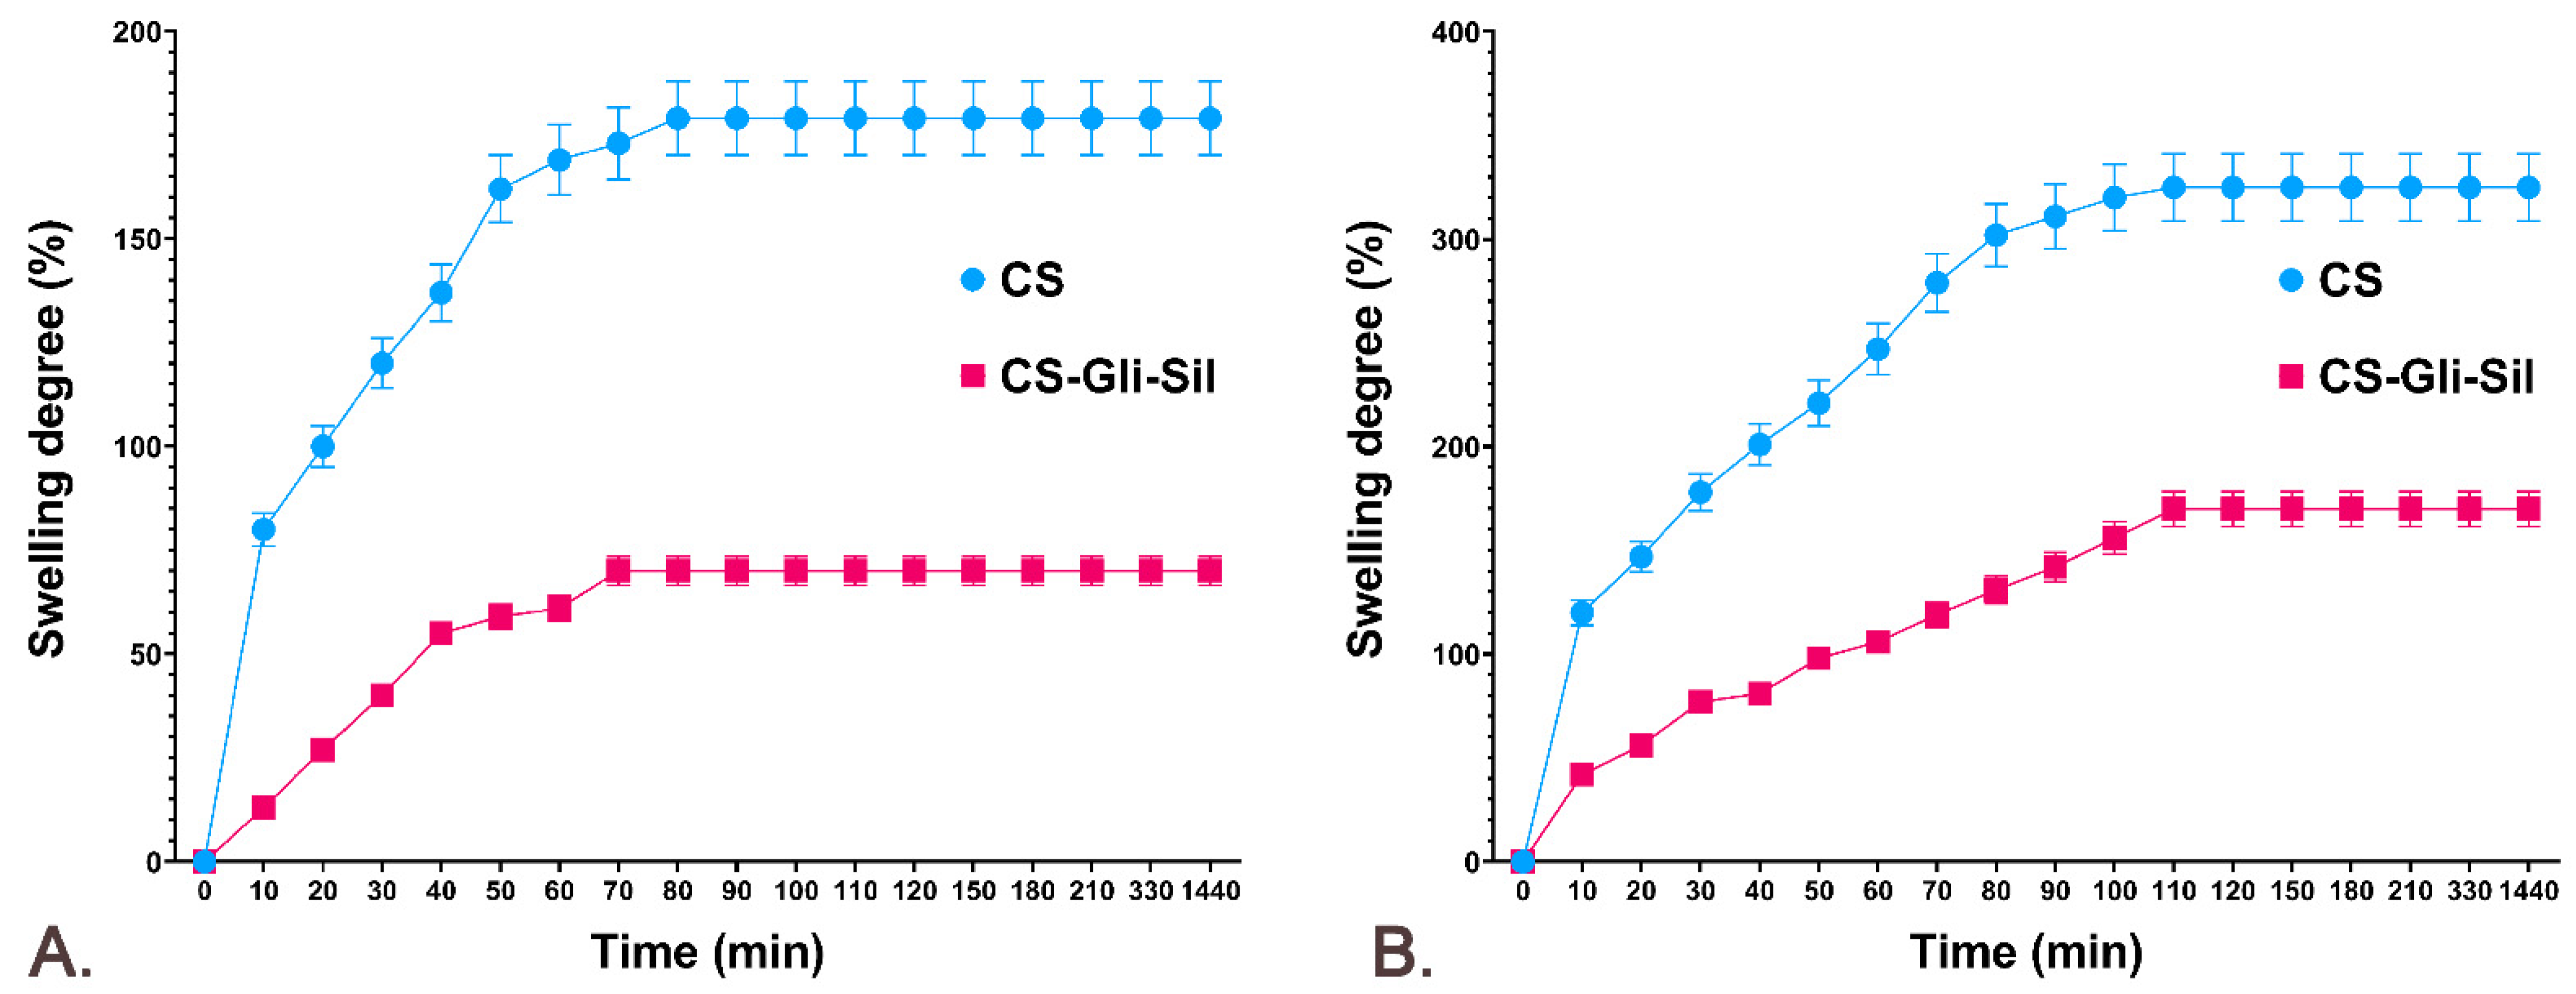
2.6. The CS and CS-Gli-Sil Microparticle Swelling Degree (SD%)
2.6.1. The CS and CS-Gli-Sil Microparticle SD% in Distilled Water
2.6.2. The CS and CS-Gli-Sil Microparticle SD% in Simulated Gastric Fluid
2.7. HPLC-ESI-MS Method Development
Preparation of Standard Solutions
2.8. HPLC Method Development and Optimization
2.9. HPLC Method Validation
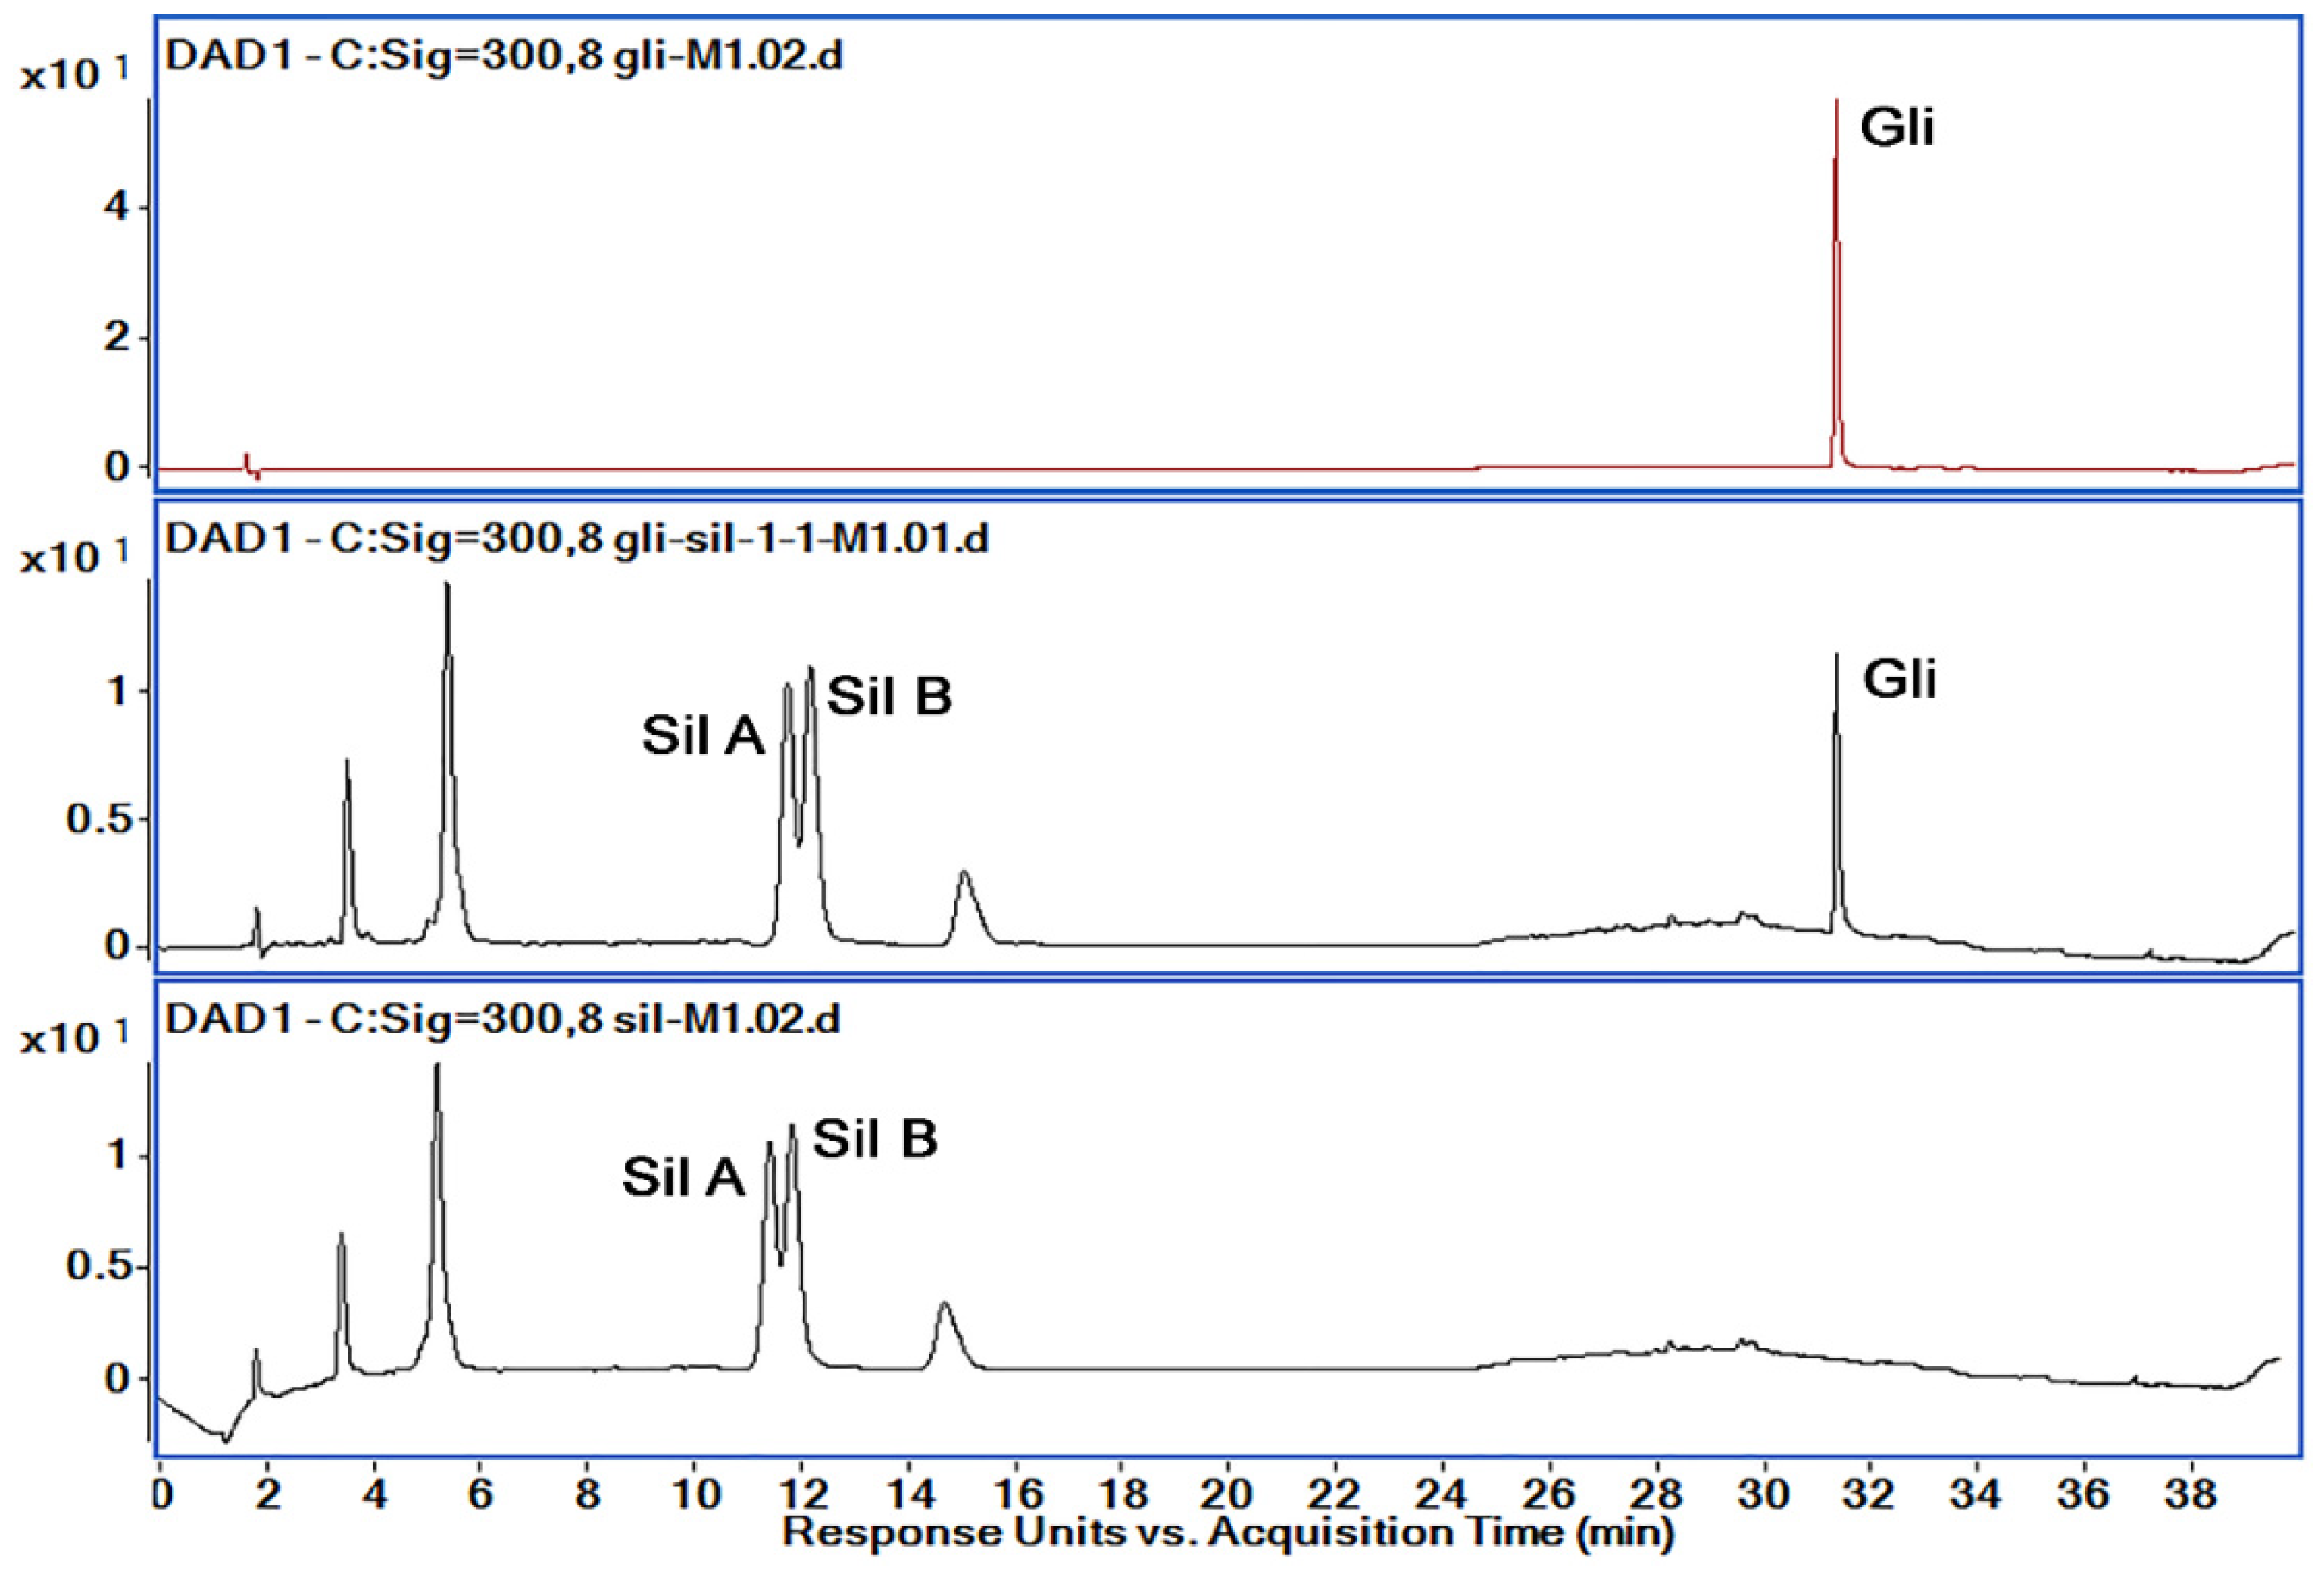
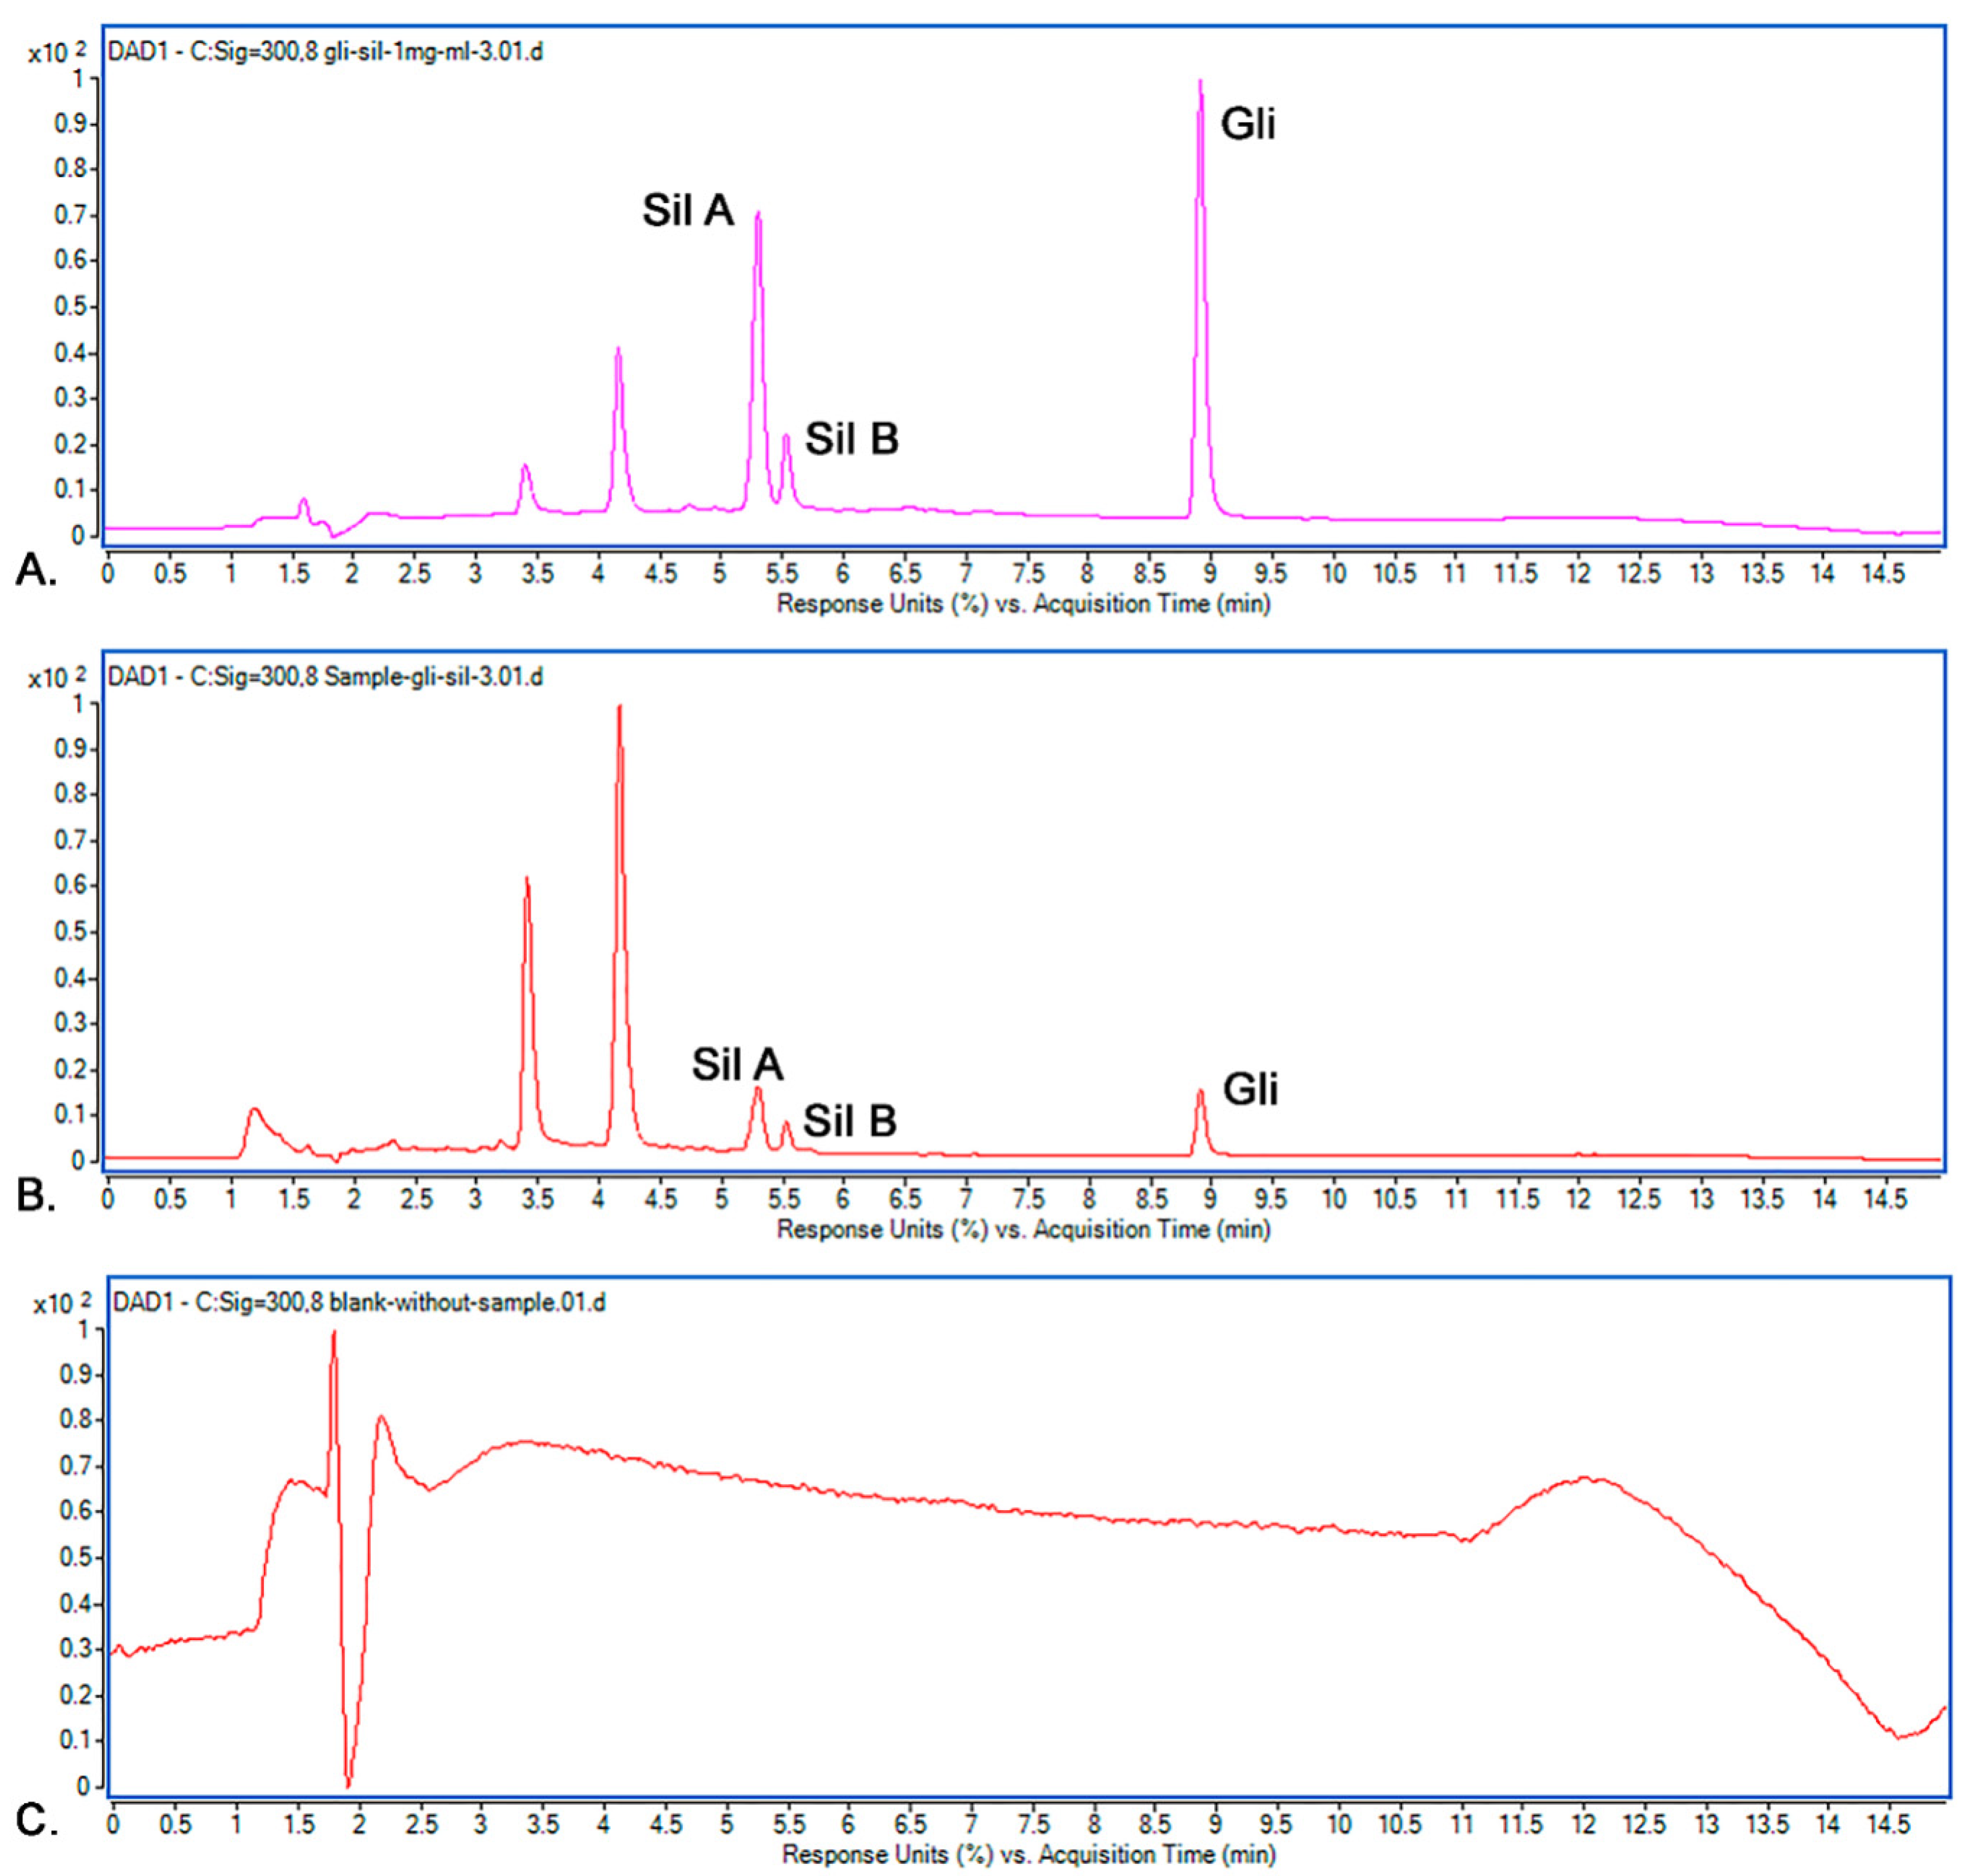
2.9.1. Selectivity
2.9.2. Precision
2.9.3. Accuracy
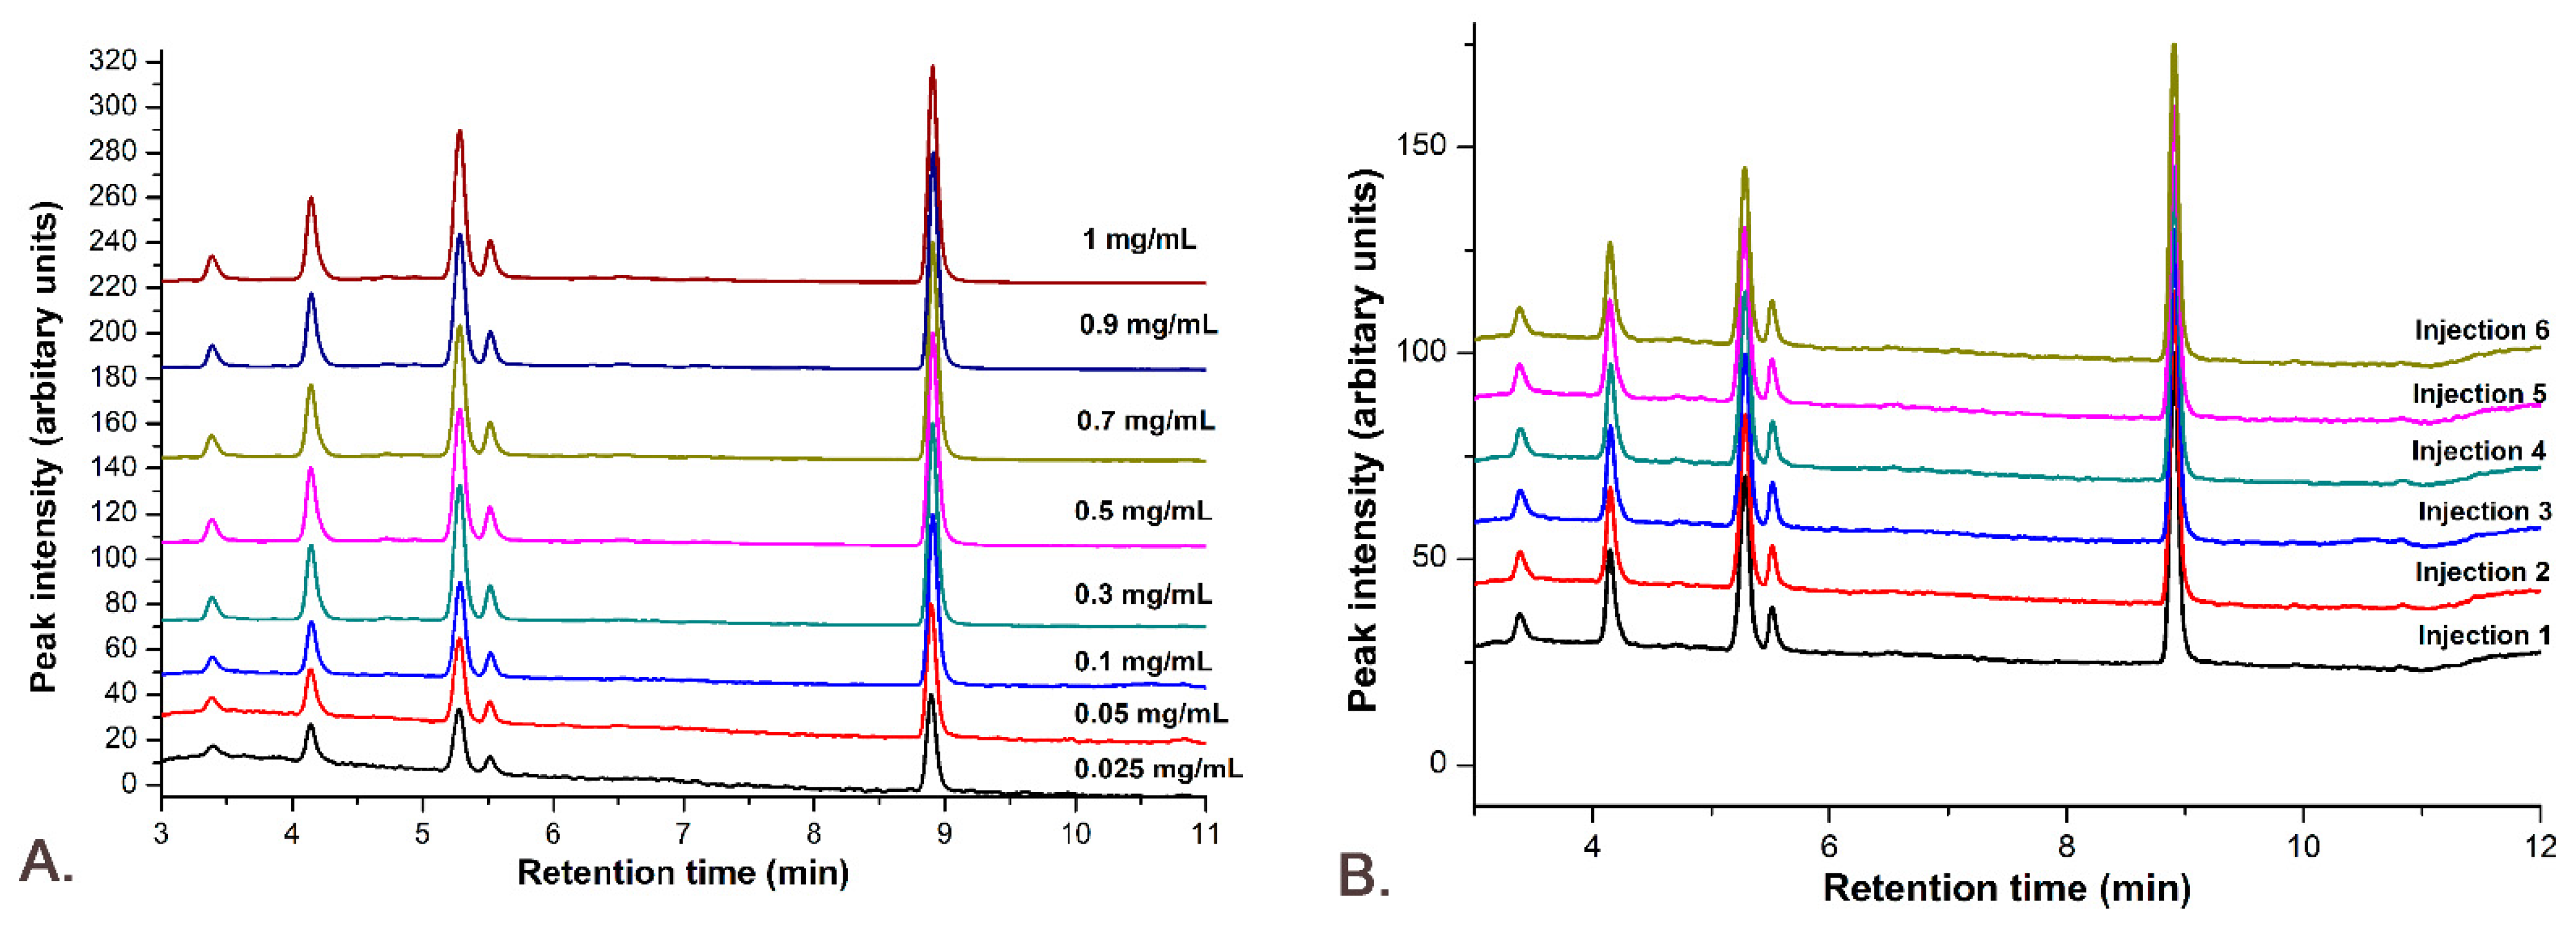
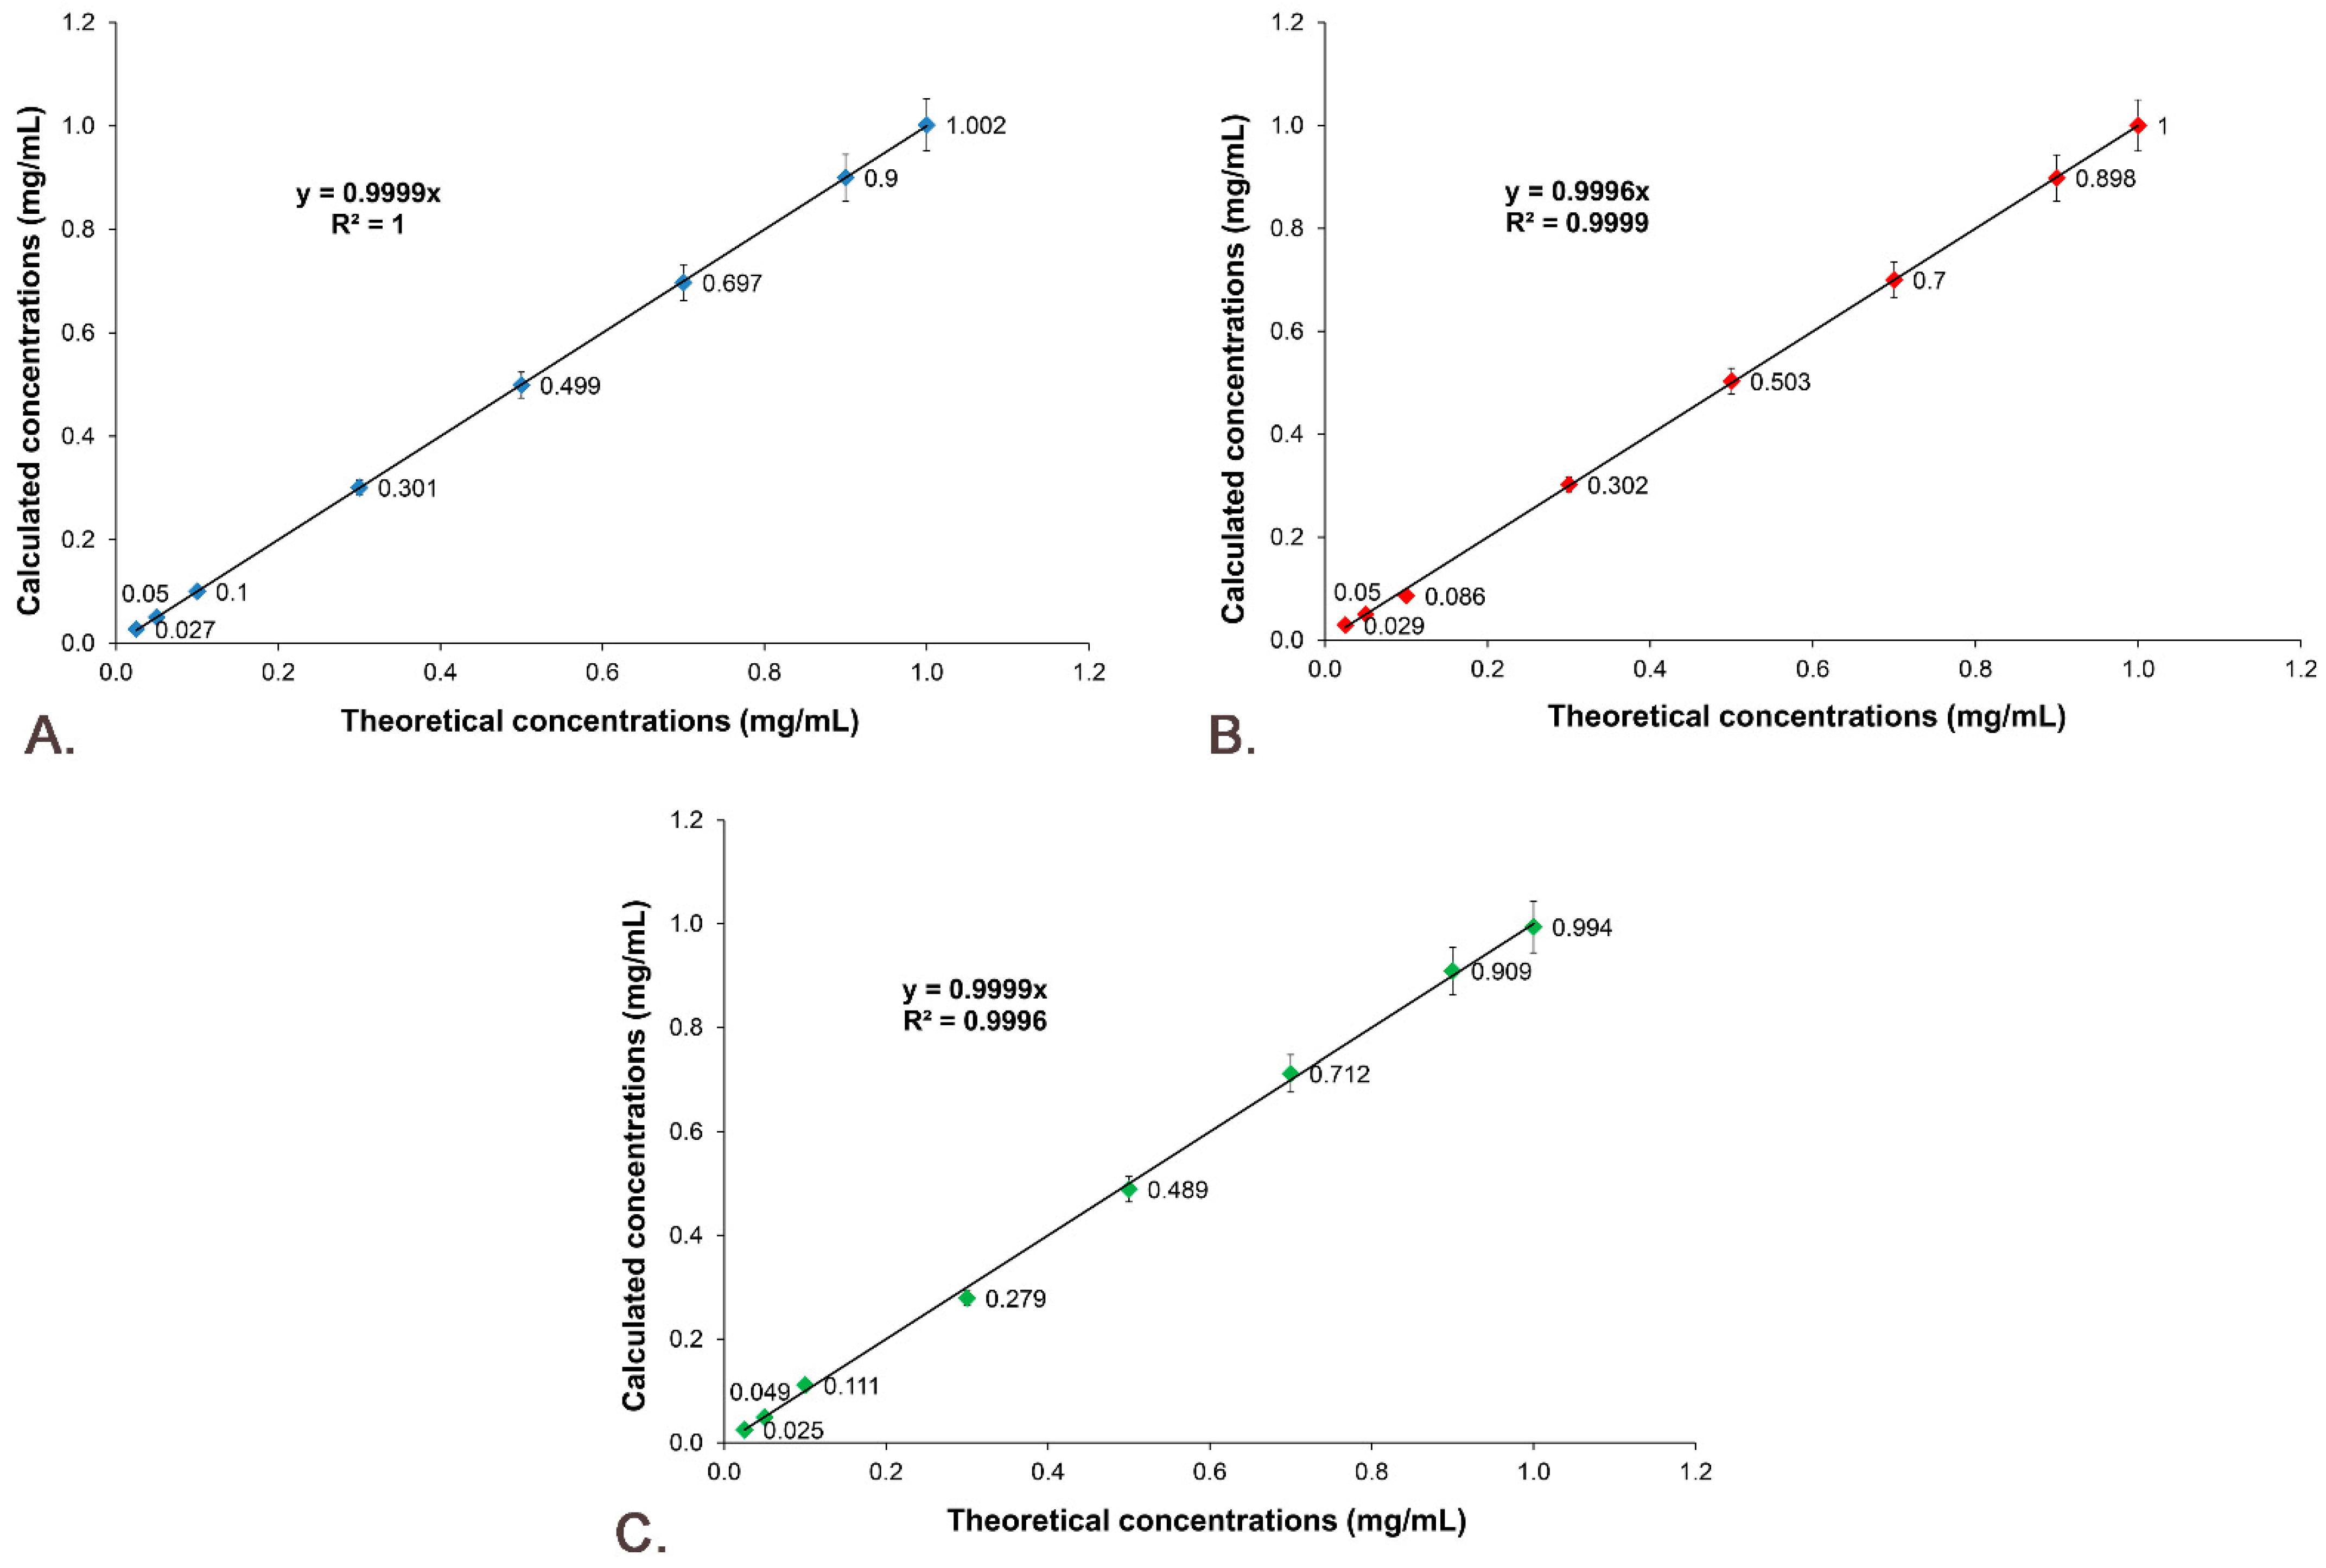
2.9.4. Linearity
2.9.5. Signal-to-Noise Ratio
2.9.6. Limit of Detection (LOD) and Limit of Quantification (LOQ)
3. Results
3.1. CS-Gli-Sil Microparticles’ Synthesis
3.2. Encapsulation Efficiency (EE%) and Drug Loading Percentage (DL%)
3.3. The Drug Releasing Degree DR (%) from the Polymer Matrix
3.4. The Swelling Degree (SD%) of CS-Gli-Sil Microparticles
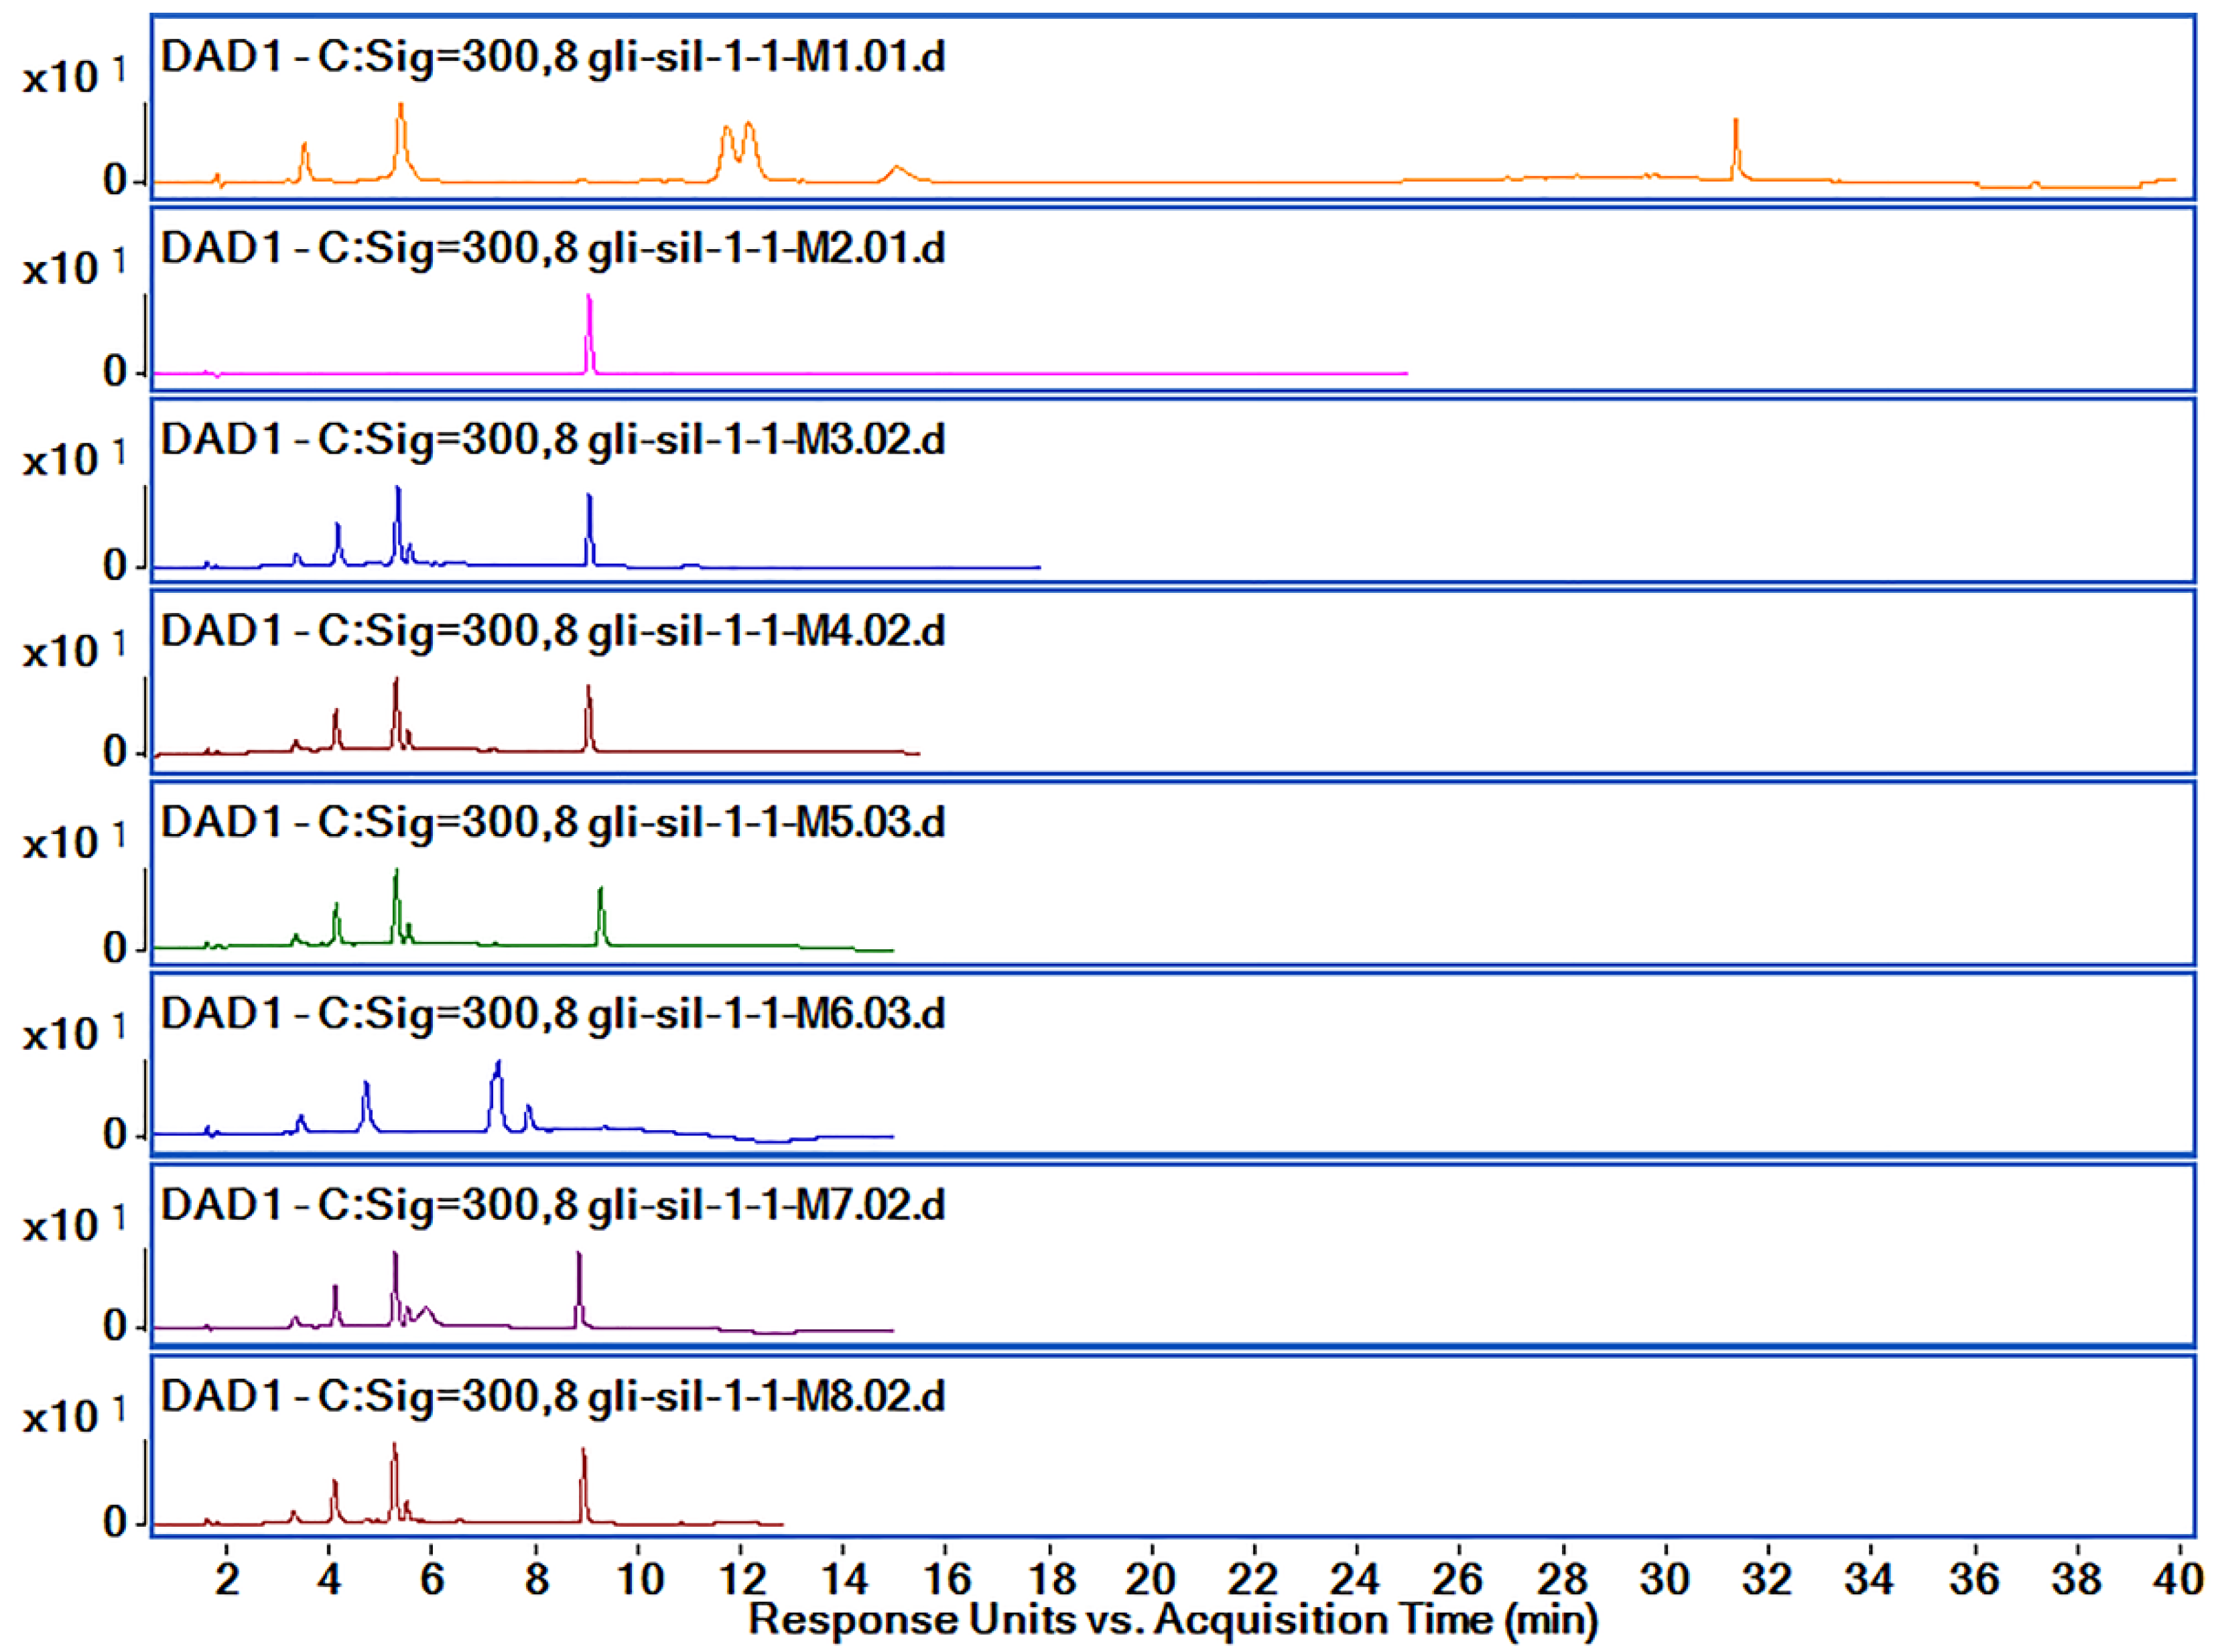
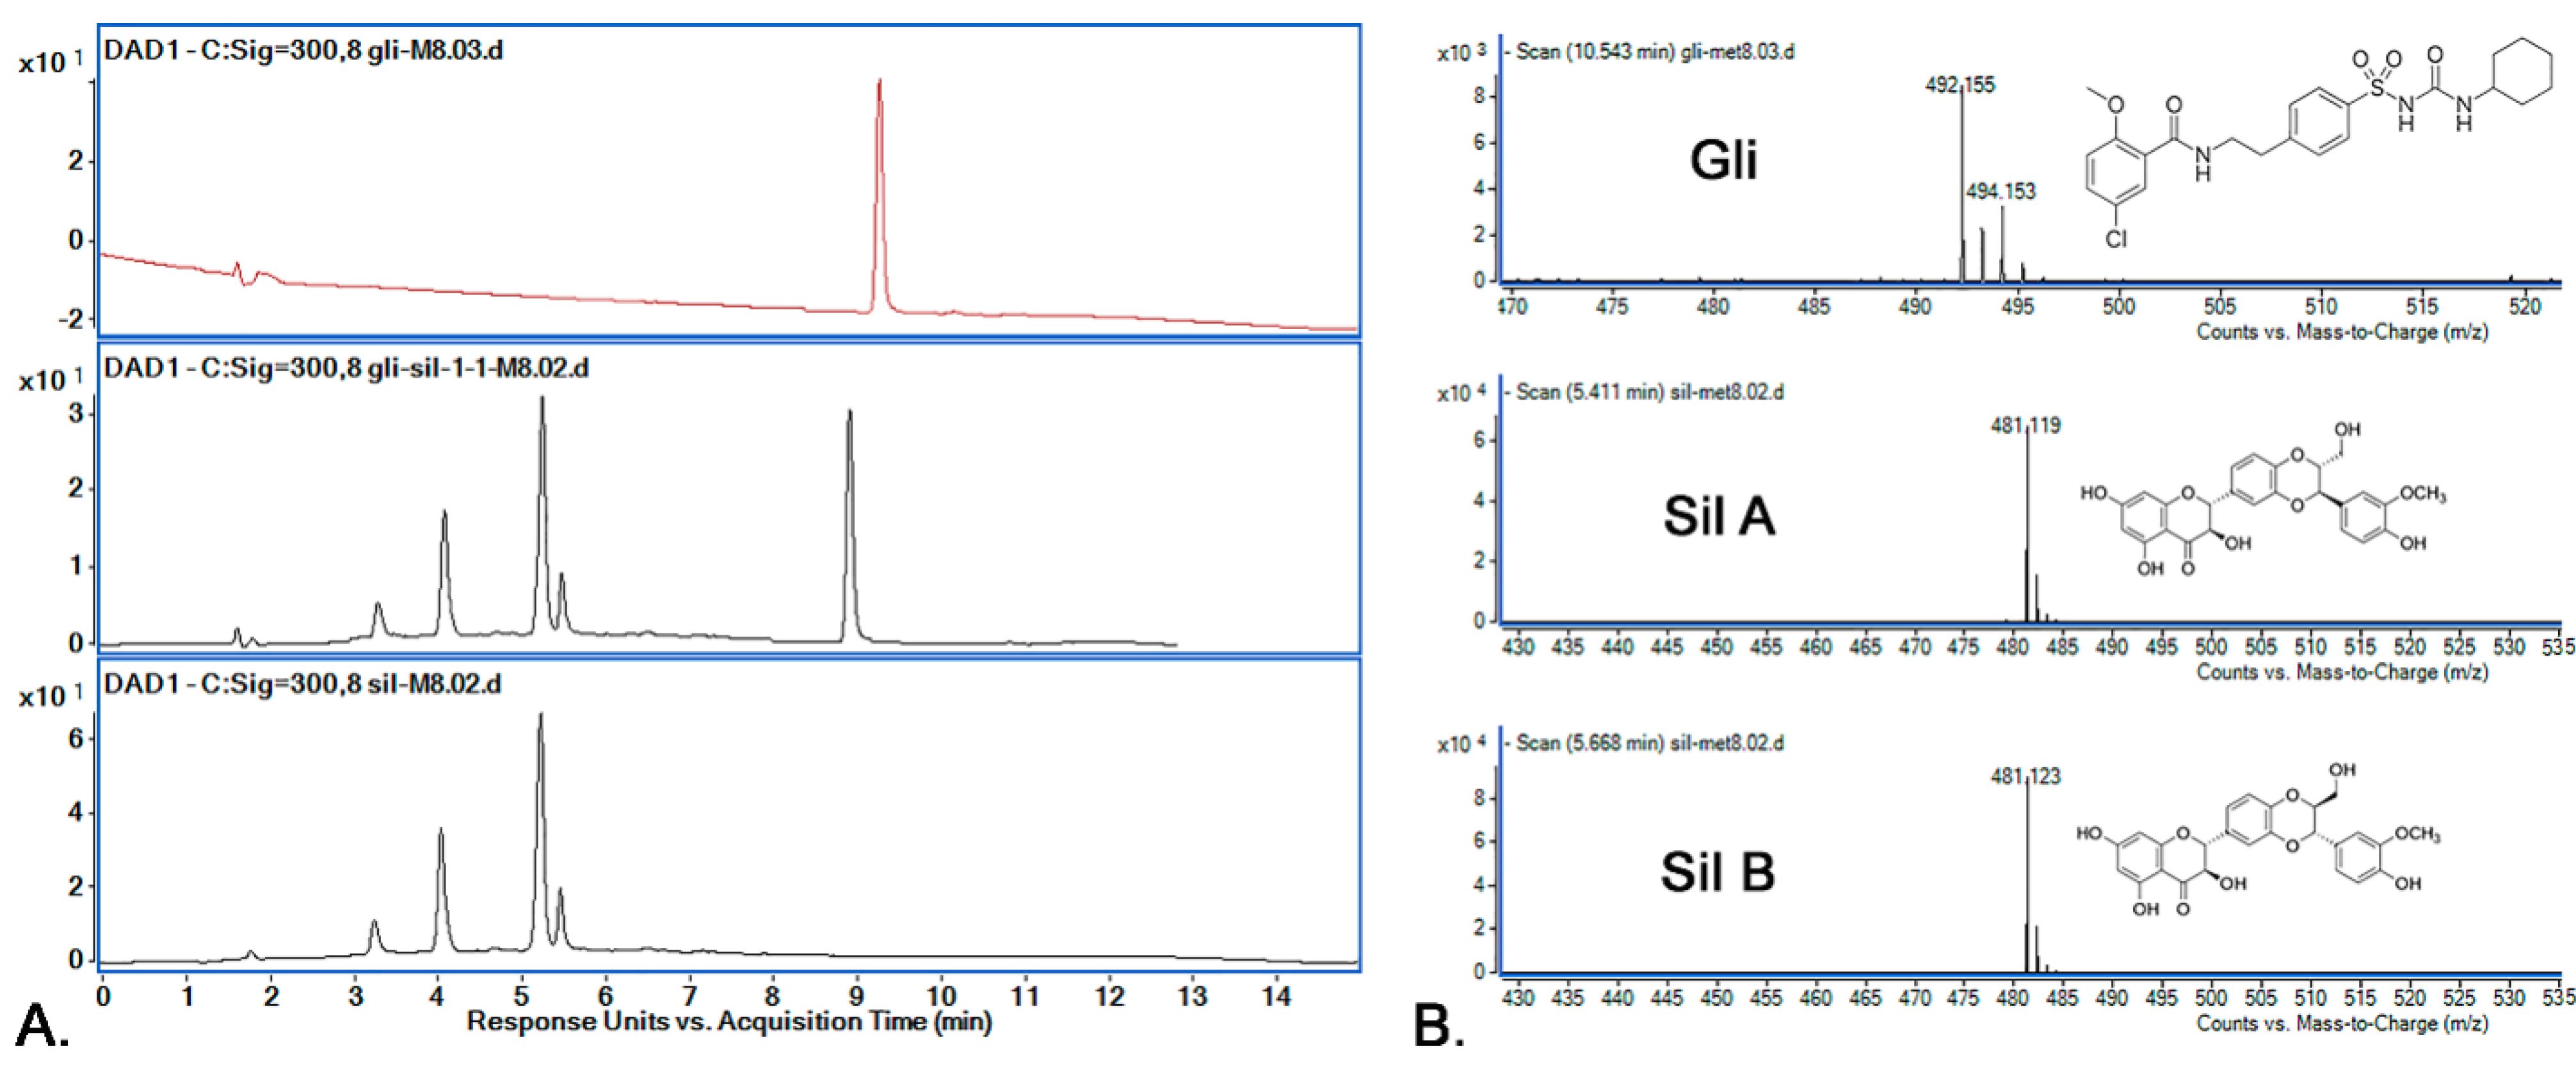
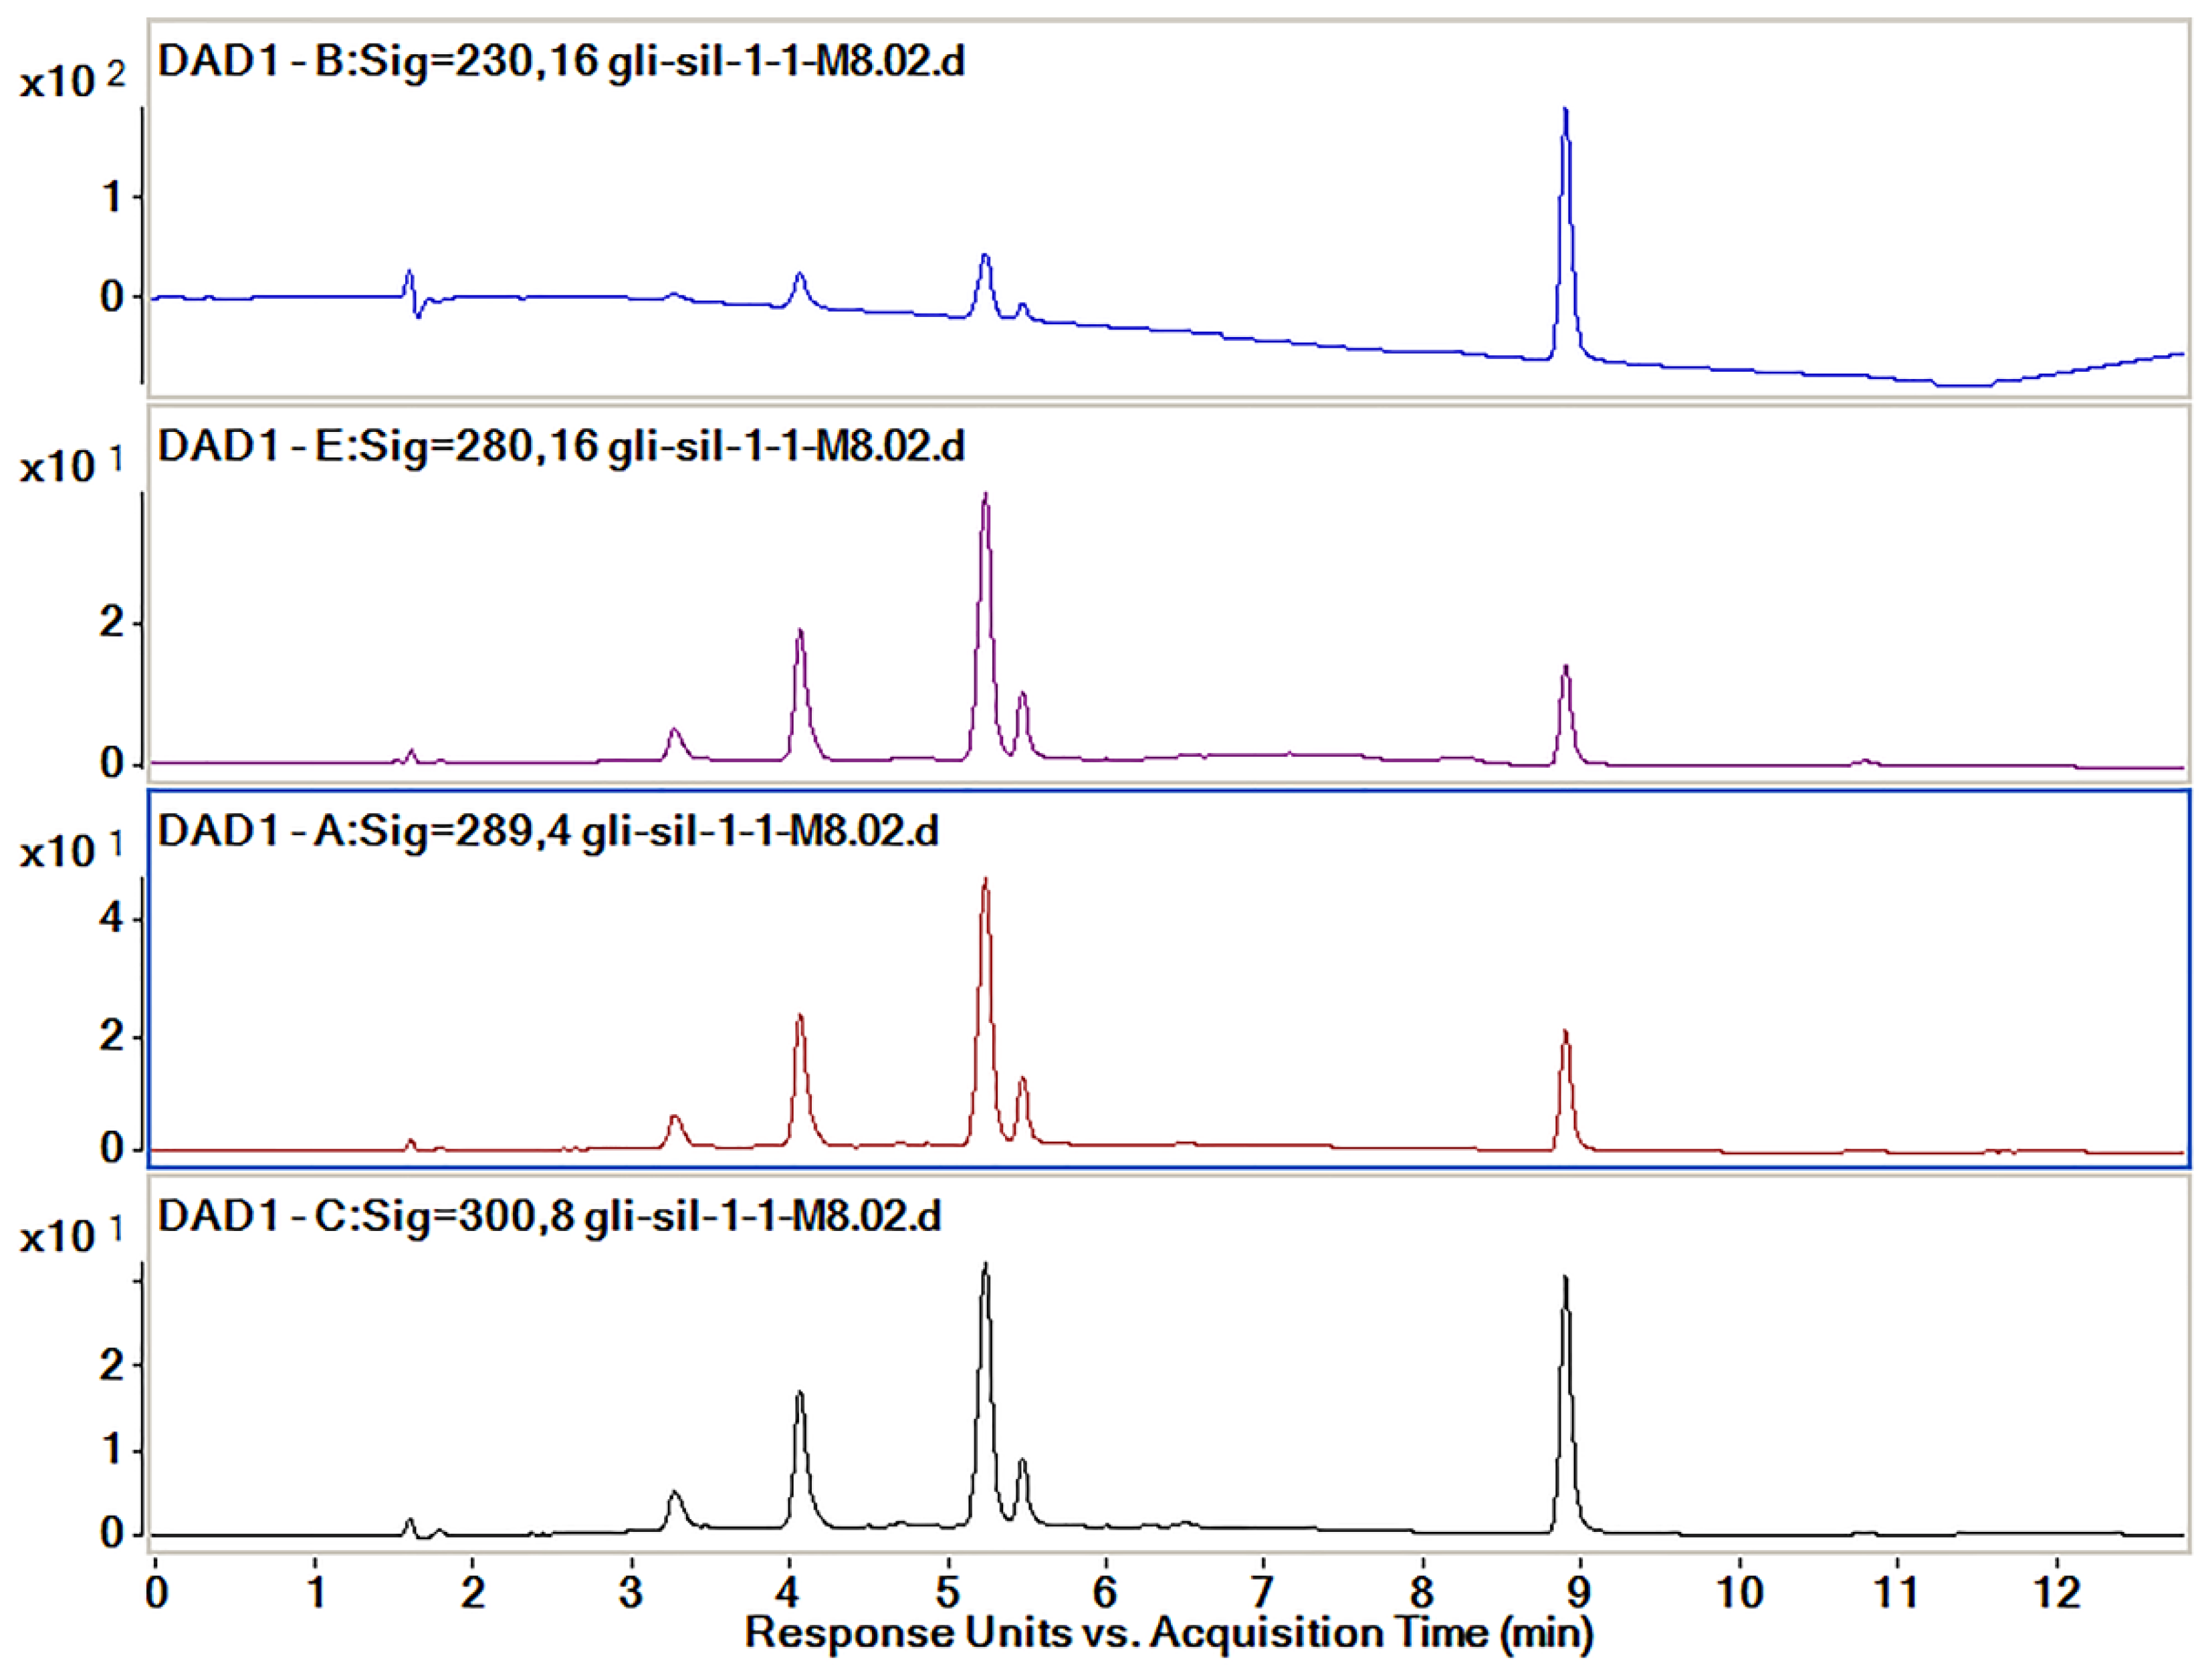
3.5. HPLC-ESI-MS Method Development and Optimization
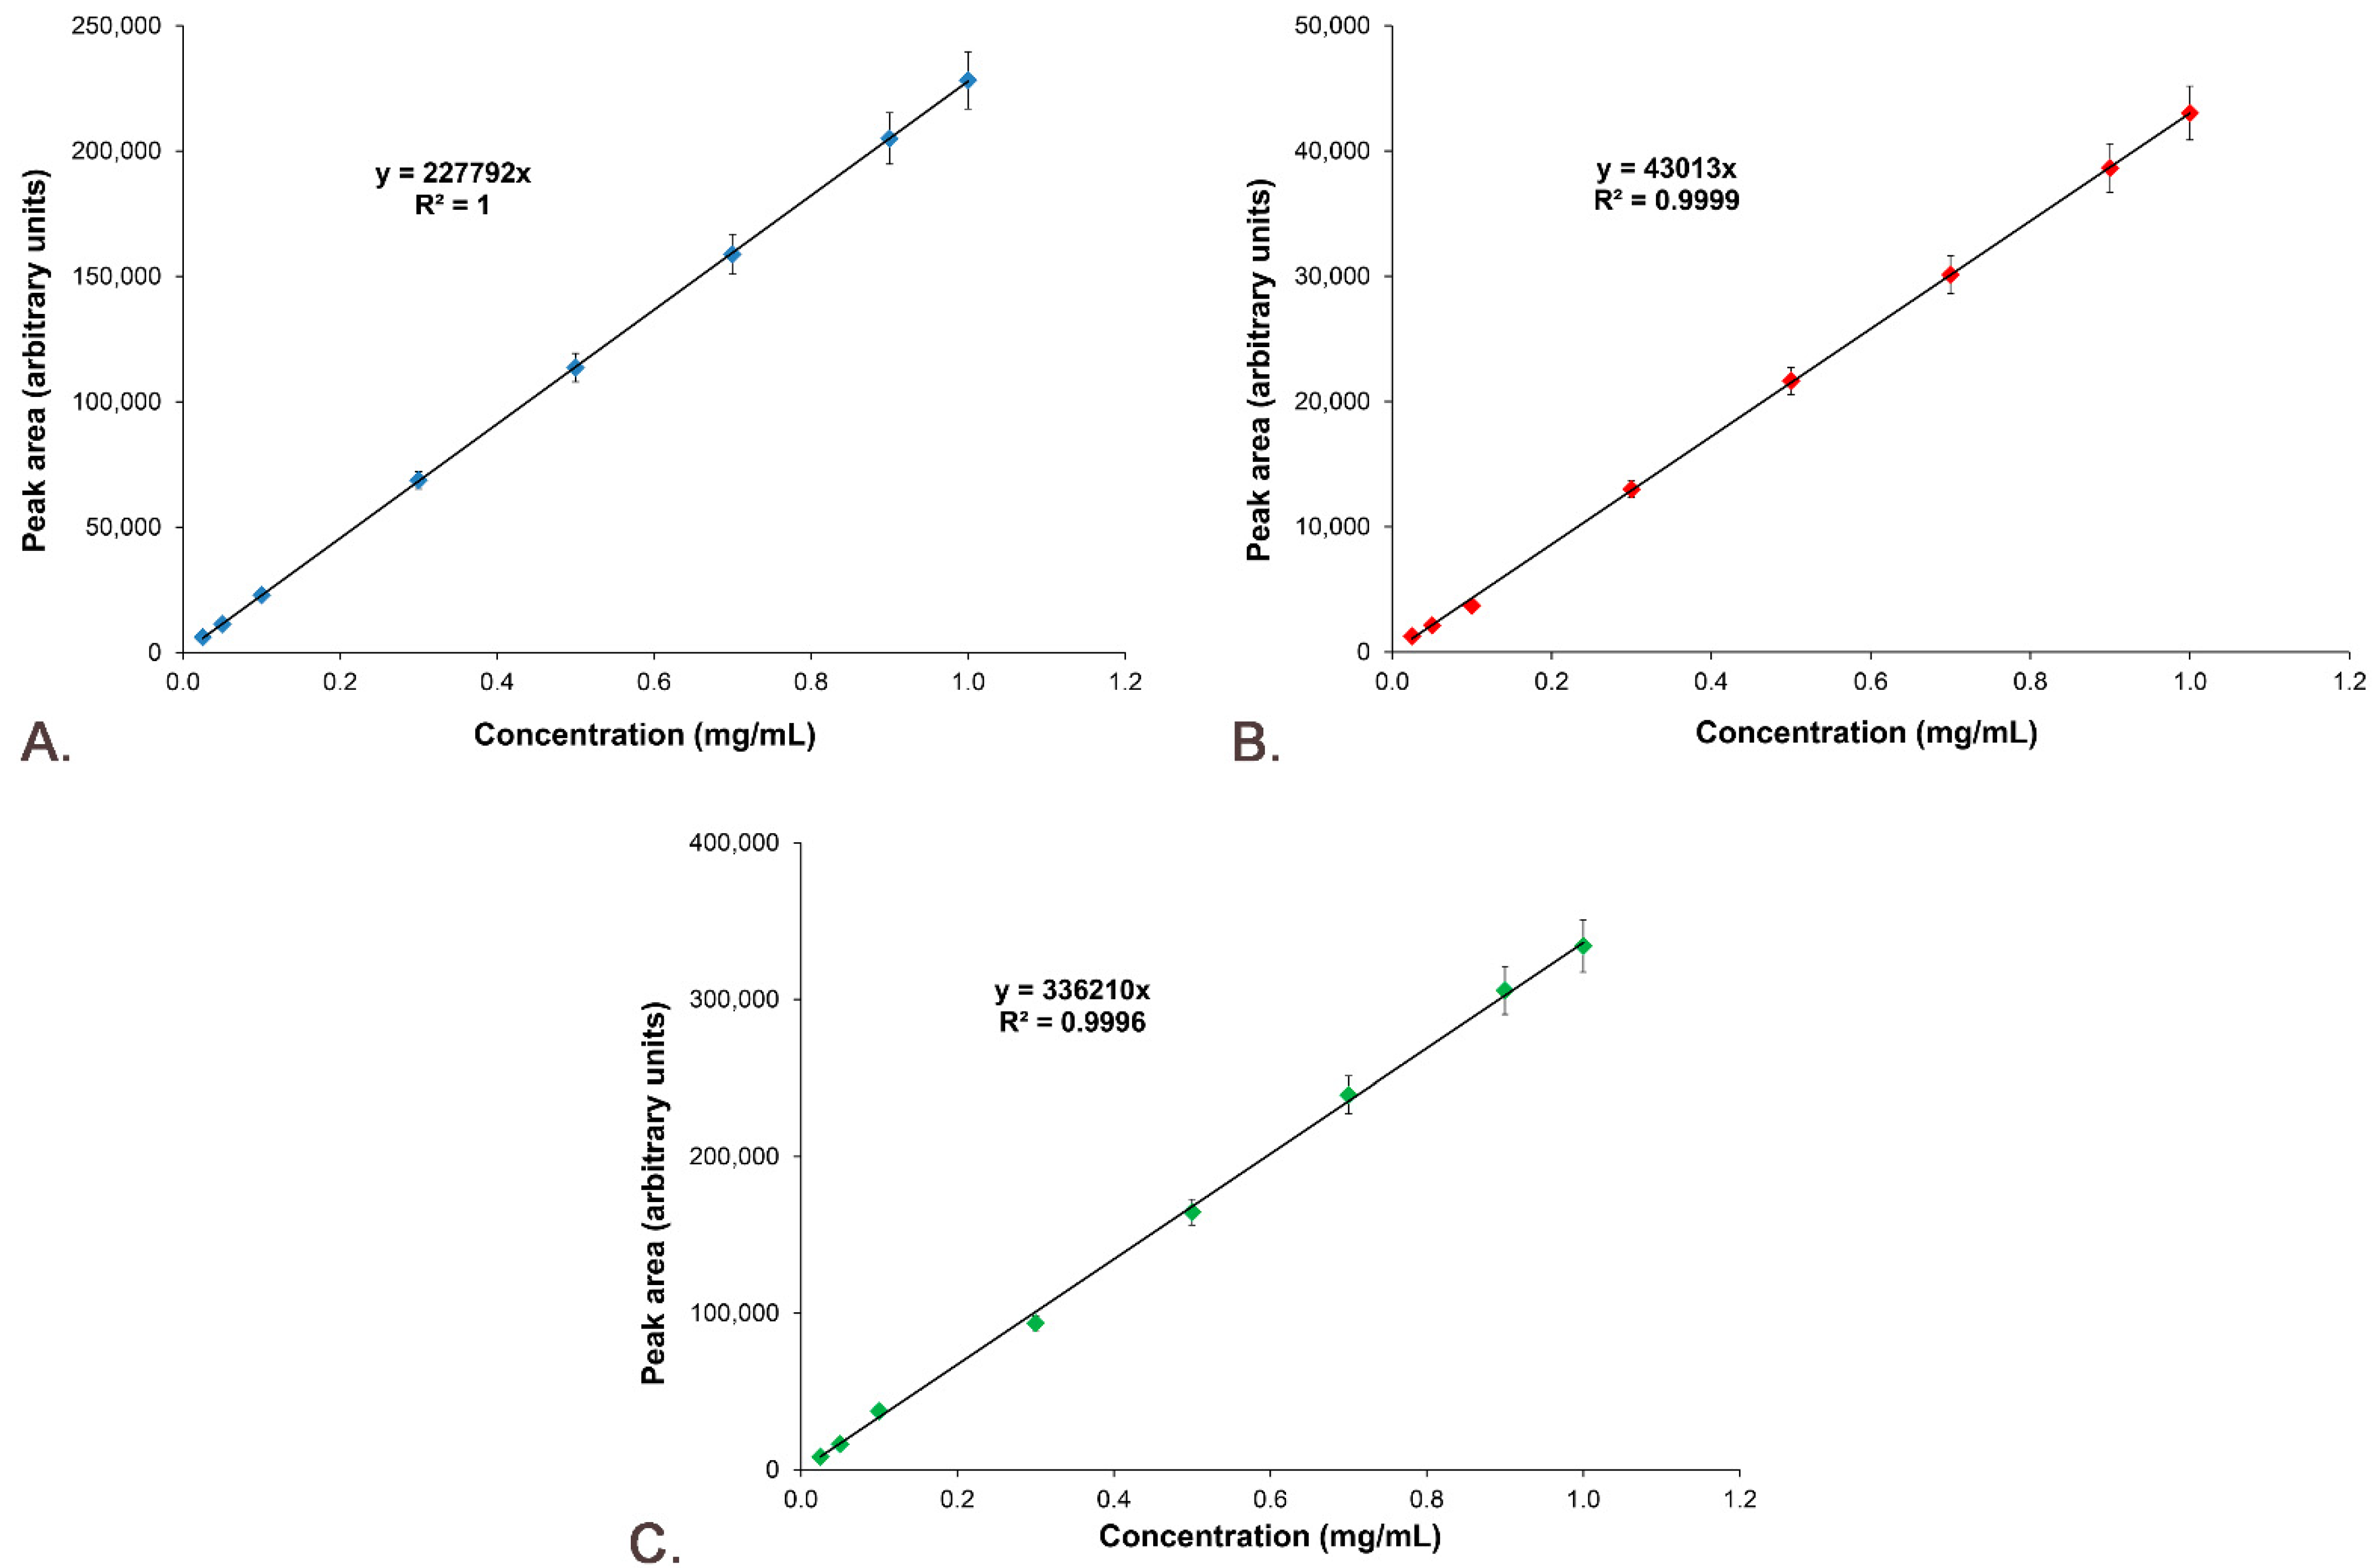
3.6. Active Substances’ Calibration Curves
3.7. M8 Method Validation
3.7.1. Selectivity
3.7.2. Precision
3.7.3. Accuracy
3.7.4. Linearity
3.7.5. Signal-to-Noise Ratio
3.7.6. Limit of Detection and Limit of Quantification
4. Conclusions
Author Contributions
Funding
Institutional Review Board Statement
Informed Consent Statement
Data Availability Statement
Acknowledgments
Conflicts of Interest
References
- Zimmet, P.; Alberti, K.G.; Magliano, D.J.; Bennett, P.H. Diabetes mellitus statistics on prevalence and mortality: Facts and fallacies. Nat. Rev. Endocrinol. 2016, 12, 616–622. [Google Scholar] [CrossRef]
- Saeedi, P.; Petersohn, I.; Salpea, P.; Malanda, B.; Karuranga, S.; Unwin, N.; Colagiuri, S.; Guariguata, L.; Motala, A.A.; Ogurtsova, K.; et al. Global and regional diabetes prevalence estimates for 2019 and projections for 2030 and 2045: Results from the International Diabetes Federation Diabetes Atlas, 9th edition. Diabetes Res. Clin. Pract. 2019, 157, 107843. [Google Scholar] [CrossRef]
- Punthakee, Z.; Goldenberg, R.; Katz, P. Definition, Classification and Diagnosis of Diabetes, Prediabetes and Metabolic Syndrome. Can. J. Diabetes 2018, 42, S10–S15. [Google Scholar] [CrossRef]
- Gomes, L.P.; Andrade, C.T.; Del Aguila, E.M.; Alexander, C.; Paschoalin, V.M.F. Assessing the Antimicrobial Activity of Chitosan Nanoparticles by Fluorescence-Labeling. Int. J. Biol. Life Agric. Sci. 2018, 12, 112–117. [Google Scholar] [CrossRef]
- Javeed, N.; Matveyenko, A.V. Circadian etiology of type 2 diabetes mellitus. Physiology 2018, 33, 138–150. [Google Scholar] [CrossRef]
- Avogaro, A.; Fadini, G.P. Microvascular complications in diabetes: A growing concern for cardiologists. Int. J. Cardiol. 2019, 291, 29–35. [Google Scholar] [CrossRef]
- Dewi, F.; Hinchliffe, R.J. Foot complications in patients with diabetes. Surgery 2019, 37, 106–111. [Google Scholar] [CrossRef]
- Kautzky-Willer, A.; Harreiter, J.; Pacini, G. Sex and Gender Differences in Risk, Pathophysiology and Complications of Type 2 Diabetes Mellitus. Endocr. Rev. 2016, 37, 278–316. [Google Scholar] [CrossRef]
- Landgraf, R.; Aberle, J.; Birkenfeld, A.L.; Gallwitz, B.; Kellerer, M.; Klein, H.; Müller-Wieland, D.; Nauck, M.A.; Reuter, H.M.; Siegel, E. Therapy of Type 2 Diabetes. Exp. Clin. Endocrinol. Diabetes 2019, 127, S73–S92. [Google Scholar] [CrossRef] [PubMed]
- Derosa, G.; Maffioli, P. Mini-Special Issue paper Management of diabetic patients with hypoglycemic agents α-Glucosidase inhibitors and their use in clinical practice. Arch. Med. Sci. 2012, 8, 899–906. [Google Scholar] [CrossRef] [PubMed]
- Derosa, G.; Maffioli, P. Thiazolidinediones plus metformin association on body weight in patients with type 2 diabetes. Diabetes Res. Clin. Pract. 2011, 91, 265–270. [Google Scholar] [CrossRef] [PubMed]
- Hinnen, D.; Hinnen, D.A. Therapeutic Options for the Management of Postprandial Glucose in Patients With Type 2 Diabetes on Basal Insulin. Clin. Diabetes 2015, 33, 175–180. [Google Scholar] [CrossRef] [PubMed]
- Derosa, G.; Maffioli, P. GLP-1 agonists exenatide and liraglutide: A review about their safety and efficacy. Curr. Clin. Pharmacol. 2012, 7, 214–228. [Google Scholar] [CrossRef] [PubMed]
- Bays, H. Sodium glucose co-transporter type 2 (SGLT2) inhibitors: Targeting the kidney to improve glycemic control in diabetes mellitus. Diabetes Ther. 2013, 4, 195–220. [Google Scholar] [CrossRef] [PubMed]
- Zhu, S.; Gao, X.; Huang, K.; Gu, Y.; Hu, Y.; Wu, Y.; Ji, Z.; Wang, Q.; Pan, S. Glibenclamide enhances the therapeutic benefits of early hypothermia after severe stroke in rats. Aging Dis. 2018, 9, 685–695. [Google Scholar] [CrossRef]
- Sinha, P.; Ubaidulla, U.; Nayak, A.K. Okra (Hibiscus esculentus) gum-alginate blend mucoadhesive beads for controlled glibenclamide release. Int. J. Biol. Macromol. 2015, 72, 1069–1075. [Google Scholar] [CrossRef]
- Sola, D.; Rossi, L.; Schianca, G.P.C.; Maffioli, P.; Bigliocca, M.; Mella, R.; Corlianò, F.; Paolo Fra, G.; Bartoli, E.; Derosa, G. State of the art paper Sulfonylureas and their use in clinical practice. Arch. Med. Sci. 2015, 11, 840–848. [Google Scholar] [CrossRef]
- Bester, K.; Ton, J.; Korownyk, C. Sulfonylurea treatment in type 2 diabetes. Can. Fam. Phys. 2018, 64, 295. [Google Scholar]
- Federico, A.; Dallio, M.; Loguercio, C. Silymarin/Silybin and Chronic Liver Disease: A Marriage of Many Years. Molecules 2017, 22, 191. [Google Scholar] [CrossRef]
- Hussain, S.A.R. Silymarin as an Adjunct to Glibenclamide Therapy Improves Long-Term and Postprandial Glycemic Control and Body Mass Index in Type 2 Diabetes. J. Med. Food 2007, 10, 543–547. [Google Scholar] [CrossRef]
- Liu, C.H.; Jassey, A.; Hsu, H.Y.; Lin, L.T. Antiviral Activities of Silymarin and Derivatives. Molecules 2019, 24, 1552. [Google Scholar] [CrossRef]
- Gillessen, A.; Schmidt, H.H.J. Silymarin as Supportive Treatment in Liver Diseases: A Narrative Review. Adv. Ther. 2020, 37, 1279–1301. [Google Scholar] [CrossRef] [PubMed]
- De Avelar, C.R.; Pereira, E.M.; De Farias Costa, P.R.; De Jesus, R.P.; De Oliveira, L.P.M. Effect of silymarin on biochemical indicators in patients with liver disease: Systematic review with meta-analysis. World J. Gastroenterol. 2017, 23, 5004–5017. [Google Scholar] [CrossRef] [PubMed]
- Hembach, L.; Cord-Landwehr, S.; Moerschbacher, B.M. Enzymatic production of all fourteen partially acetylated chitosan tetramers using different chitin deacetylases acting in forward or reverse mode. Sci. Rep. 2017, 7, 17692. [Google Scholar] [CrossRef]
- Kim, S.H.; Yeon, Y.K.; Lee, J.M.; Chao, J.R.; Lee, Y.J.; Seo, Y.B.; Sultan, M.T.; Lee, O.J.; Lee, J.S.; Yoon, S.-I.; et al. Precisely printable and biocompatible silk fibroin bioink for digital light processing 3D printing. Nat. Commun. 2018, 9, 1620. [Google Scholar] [CrossRef]
- Karadeniz, F.; Kim, S.K. Antidiabetic Activities of Chitosan and Its Derivatives: A Mini Review. Adv. Food Nutr. Res. 2014, 73, 33–44. [Google Scholar] [CrossRef] [PubMed]
- Aranaz, I.; Alcántara, A.R.; Civera, M.C.; Arias, C.; Elorza, B.; Caballero, A.H.; Acosta, N.; Velasco, H.; Mecerreyes, D.; Antonio, R.; et al. Chitosan: An Overview of Its Properties and Applications. Polymers 2021, 13, 3256. [Google Scholar] [CrossRef] [PubMed]
- Affes, S.; Aranaz, I.; Acosta, N.; Heras, Á.; Nasri, M.; Maalej, H. Chitosan derivatives-based films as pH-sensitive drug delivery systems with enhanced antioxidant and antibacterial properties. Int. J. Biol. Macromol. 2021, 182, 730–742. [Google Scholar] [CrossRef]
- Porwal, P.K.; Talele, G.S. Development of validated HPLC-UV method for simultaneous determination of Metformin, Amlodipine, Glibenclamide and Atorvastatin in human plasma and application to protein binding studies. Bull. Fac. Pharm. Cairo Univ. 2017, 55, 129–139. [Google Scholar] [CrossRef][Green Version]
- Korany, M.A.; Haggag, R.S.; Ragab, M.A.A.; Elmallah, O.A. A validated stability-indicating HPLC method for simultaneous determination of Silymarin and Curcumin in various dosage forms. Arab. J. Chem. 2017, 10, S1711–S1725. [Google Scholar] [CrossRef]
- Confederat, L.G.; Motrescu, I.; Condurache, M.I.; Constantin, S.; Bujor, A.; Tuchilus, C.G.; Profire, L. Chitosan-Based Delivery Systems Loaded with Glibenclamide and Lipoic Acid: Formulation, Characterization, and Kinetic Release Studies. Appl. Sci. 2020, 10, 7532. [Google Scholar] [CrossRef]
- Constantin, S.M.; Buron, F.; Routier, S.; Vasincu, I.M.; Apotrosoaei, M.; Lupaşcu, F.; Confederat, L.; Tuchilus, C.; Constantin, M.T.; Sava, A.; et al. Formulation and Characterization of New Polymeric Systems Based on Chitosan and Xanthine Derivatives with Thiazolidin-4-One Scaffold. Materials 2019, 12, 558. [Google Scholar] [CrossRef] [PubMed]
- Rao, T.N. Validation of Analytical Methods. In Calibration and Validation of Analytical Methods—A Sampling of Current Approaches; InTechOpen: London, UK, 2018. [Google Scholar]
- Petrovici, A.-R.; Silion, M.; Simionescu, N.; Kallala, R.; Pinteala, M.; Maier, S.S. Quantification of Low Amounts of Zoledronic Acid by HPLC-ESI-MS Analysis: Method Development and Validation. Int. J. Mol. Sci. 2022, 23, 5944. [Google Scholar] [CrossRef] [PubMed]
- Hanafy, N.A.N.; El-Kemary, M.A. Silymarin/curcumin loaded albumin nanoparticles coated by chitosan as muco-inhalable delivery system observing anti-inflammatory and anti COVID-19 characterizations in oleic acid triggered lung injury and in vitro COVID-19 experiment. Int. J. Biol. Macromol. 2022, 198, 101–110. [Google Scholar] [CrossRef] [PubMed]
- Jose, M.A.; Abraham, A.; Narmadha, M.P. Effect of silymarin in diabetes mellitus patients with liver diseases. J. Pharmacol. Pharmacother. 2011, 2, 287–289. [Google Scholar] [CrossRef] [PubMed]
- Maiti, S.; Mukherjee, S.; Datta, R. Core–shell nano-biomaterials for controlled oral delivery and pharmacodynamic activity of glibenclamide. Int. J. Biol. Macromol. 2014, 70, 20–25. [Google Scholar] [CrossRef] [PubMed]


| Method | Gradient (% B) | Method Run Time |
|---|---|---|
| M1 | 0′–25; 12′–27; 22′–30; 26′–45; 31′–70; 37′–75; 40′–25 | 40 |
| M2 | 0′–25; 5′–45; 10′–55; 15′–75; 20′–25; 25′–25 | 25 |
| M3 | 0′–25; 5′–55; 10′–70; 20′–25 | 20 |
| M4 | 0′–25; 5′–55; 10′–70; 12′–45; 15′–25 | 15 |
| M5 | 0′–25; 5′–55; 10′–60; 12′–30; 15′–25 | 15 |
| M6 | 0′–25; 5′–35; 8′–60; 10′–30; 15′–25 | 15 |
| M7 | 0′–25; 5′–55; 8′–70; 10′–30; 15′–25 | 15 |
| M8 | 0′–25; 5′–55; 9′–70; 12′–30; 15′–25 | 15 |
| Method | Sil Rt (Min) | Gli Rt (Min) | Observations | ||||
|---|---|---|---|---|---|---|---|
| Sil A | Sil B | ||||||
| Rt | Peak Area | Rt | Peak Area | Rt | Peak Area | ||
| M1 | 11.69 | 105.4 | 12.12 | 117.7 | 31.36 | 61.8 | Sil A and Sil B peaks are partially overlapping |
| M2 | - | - | 9.08 | 297.8 | Sil is not separated at all | ||
| M3 | 5.29 | 180.2 | 5.52 | 30.9 | 9.0 | 151.5 | poor separation of Sil B |
| M4 | 5.25 | 179.4 | 5.49 | 30.9 | 8.99 | 152.3 | good peak separation |
| M5 | 5.25 | 178.2 | 5.49 | 31.0 | 9.23 | 150.3 | separation of Sil A and Sil B peaks is not very good |
| M6 | 7.24 | 182.4 | 7.83 | 39 | - | - | Gli peak is not separated |
| M7 | 5.23 | 176.5 | 5.47 | 28.4 | 8.81 | 149.8 | individual peaks; efficient separation |
| M8 | 5.22 | 179.8 | 5.46 | 31.7 | 8.9 | 154.3 | good peak separation and bigger peak area for all compounds |
| Absorbance, nm | Sil Rt (Min) | Gli Rt (Min) | Observations | ||||
|---|---|---|---|---|---|---|---|
| Sil A | Sil B | ||||||
| Peak Proportion, % | Peak Area | Peak Proportion, % | Peak Area | Peak Proportion, % | Peak Area | ||
| 230 | 21.5 | 372.6 | 3.7 | 65.1 | 74.8 | 1312.1 | Sil A and Sil B peaks are partially overlapping |
| 280 | 66.1 | 223.5 | 12.2 | 41.1 | 21.7 | 73.5 | Sil is not separated at all |
| 289 | 63.1 | 271.8 | 11.6 | 50.1 | 25.3 | 108.9 | Poor separation of Sil B |
| 300 | 48.9 | 180.8 | 8.9 | 32.9 | 42.2 | 155.8 | Equilibrated peak proportions |
| Sample | Rt (Min) | Peak Area | Asymmetry | Resolution | Selectivity | Start Rt (Min) | End Rt (Min) | S/N |
|---|---|---|---|---|---|---|---|---|
| Gli-Sil 0.025 mg/mL | 5.28 | 6079.4 | 0.866 | 1.833 | 1.068 | 5.11 | 5.43 | 3.8 |
| 5.51 | 1254.4 | 1.248 | 25.237 | 1.935 | 5.43 | 5.70 | 0.6 | |
| 8.90 | 8266.8 | 1.023 | 7.339 | 1.139 | 8.77 | 9.11 | 5.1 | |
| Gli-Sil 0.05 mg/mL | 5.28 | 11,337.9 | 0.916 | 1.790 | 1.068 | 5.10 | 5.43 | 3.5 |
| 5.52 | 2132.2 | 1.142 | 26.896 | 1.930 | 5.41 | 5.67 | 0.5 | |
| 8.90 | 16,414.7 | 1.125 | 4.433 | 1.073 | 8.73 | 9.11 | 5.1 | |
| Gli-Sil 0.1 mg/mL | 5.29 | 22,878.9 | 0.893 | 1.790 | 1.048 | 5.12 | 5.43 | 3.3 |
| 5.51 | 3690.3 | 1.100 | 27.349 | 1.676 | 5.43 | 5.67 | 0.5 | |
| 8.90 | 37,369.6 | 1.169 | 6.532 | 1.092 | 8.76 | 9.13 | 5.3 | |
| Gli-Sil 0.3 mg/mL | 5.28 | 68,636.9 | 0.850 | 1.822 | 1.064 | 5.09 | 5.43 | 4.0 |
| 5.51 | 12,994.7 | 1.153 | 26.690 | 1.880 | 5.43 | 5.70 | 0.7 | |
| 8.90 | 93,664.2 | 1.093 | 7.397 | 1.120 | 8.76 | 9.16 | 5.3 | |
| Gli-Sil 0.5 mg/mL | 5.28 | 113,633.6 | 0.858 | 1.834 | 1.072 | 5.06 | 5.43 | 3.7 |
| 5.51 | 21,644.3 | 1.194 | 26.327 | 1.935 | 5.43 | 5.70 | 0.6 | |
| 8.90 | 164,515.4 | 1.081 | 5.918 | 1.096 | 8.76 | 9.12 | 5.3 | |
| Gli-Sil 0.7 mg/mL | 5.28 | 158,843.5 | 0.832 | 1.843 | 1.067 | 5.06 | 5.43 | 3.6 |
| 5.51 | 30,121.0 | 1.192 | 26.627 | 1.939 | 5.43 | 5.69 | 0.6 | |
| 8.90 | 239,245.5 | 1.099 | 5.618 | 1.097 | 8.77 | 9.11 | 5.3 | |
| Gli-Sil 0.9 mg/mL | 5.28 | 205,027.6 | 1.247 | 1.754 | 1.068 | 5.07 | 5.43 | 4.0 |
| 5.51 | 38,642.8 | 1.212 | 26.364 | 1.919 | 5.43 | 5.71 | 0.7 | |
| 8.91 | 305,778.9 | 1.086 | 7.745 | 1.115 | 8.77 | 9.13 | 5.6 | |
| Gli-Sil 1 mg/mL | 5.29 | 228,231.2 | 0.819 | 1.851 | 1.065 | 5.09 | 5.43 | 4.3 |
| 5.51 | 43,027.7 | 1.222 | 26.347 | 1.917 | 5.43 | 5.70 | 0.7 | |
| 8.91 | 334,214.0 | 1.097 | 6.698 | 1.146 | 8.77 | 9.12 | 5.6 |
| Sample | Rt (Min) | Peak Area | Asymmetry | Resolution | Selectivity | Start Rt (Min) | End Rt (Min) | S/N | SD% | RSD% |
|---|---|---|---|---|---|---|---|---|---|---|
| Gli-Sil (0.5 mg/mL) (1) | 5.28 | 113,386 | 0.979 | 1.749 | 1.069 | 5.05 | 5.43 | 3.8 | 0.017 | 0.154 |
| 5.52 | 21,514.42 | 1.063 | 26.162 | 1.934 | 5.43 | 5.69 | 0.5 | 0.009 | 0.424 | |
| 8.91 | 163,446.6 | 0.947 | 4.732 | 1.07 | 8.77 | 9.1 | 5.4 | 0.075 | 0.459 | |
| Gli-Sil (0.5 mg/mL) (2) | 5.2 | 113,515.5 | 0.975 | 1.881 | 1.095 | 5.06 | 5.43 | 3.7 | 0.008 | 0.073 |
| 5.51 | 21,716.1 | 1.05 | 26.604 | 1.936 | 5.43 | 5.68 | 0.5 | 0.005 | 0.234 | |
| 8.9 | 163,444.7 | 1.006 | 2.516 | 1.075 | 8.753 | 9.106 | 5.2 | 0.075 | 0.460 | |
| Gli-Sil (0.5 mg/mL) (3) | 5.29 | 113,633.8 | 0.788 | 1.856 | 1.067 | 5.08 | 5.43 | 3.7 | 0.001 | 0.001 |
| 5.51 | 21,912.46 | 1.189 | 26.596 | 1.934 | 5.43 | 5.71 | 0.6 | 0.018 | 0.876 | |
| 8.91 | 166,850.12 | 1.121 | 7.803 | 1.117 | 8.73 | 9.18 | 5.3 | 0.165 | 1.003 | |
| Gli-Sil (0.5 mg/mL) (4) | 5.28 | 113,677.68 | 0.91 | 1.844 | 1.067 | 5.05 | 5.43 | 3.7 | 0.003 | 0.027 |
| 5.51 | 21,592.6 | 1.402 | 26.021 | 1.936 | 5.43 | 5.72 | 0.5 | 0.003 | 0.168 | |
| 8.9 | 164,387.06 | 1.205 | 7.079 | 1.111 | 8.77 | 9.12 | 5.2 | 0.009 | 0.055 | |
| Gli-Sil (0.5 mg/mL) (5) | 5.28 | 113,729.7 | 0.798 | 1.862 | 1.067 | 5.05 | 5.43 | 3.6 | 0.006 | 0.059 |
| 5.51 | 21,781.51 | 1.224 | 26.303 | 1.934 | 5.43 | 5.74 | 0.6 | 0.009 | 0.448 | |
| 8.9 | 164,049.2 | 1.102 | 7.46 | 1.107 | 8.77 | 9.11 | 5.3 | 0.032 | 0.200 | |
| Gli-Sil (0.5 mg/mL) (6) | 5.28 | 113,858.7 | 0.814 | 1.857 | 1.067 | 5.05 | 5.43 | 3.7 | 0.015 | 0.140 |
| 5.51 | 21,348.5 | 1.237 | 26.278 | 1.936 | 5.43 | 5.67 | 0.6 | 0.020 | 0.966 | |
| 8.9 | 164,914.8 | 1.107 | 5.916 | 1.098 | 8.771 | 9.11 | 5.2 | 0.028 | 0.171 |
| Samples | Samples Concentrations, mg/mL | ||
|---|---|---|---|
| Sil A | Sil B | Gli | |
| 80% | 0.41 | 0.39 | 0.40 |
| 100% | 0.49 | 0.49 | 0.50 |
| 120% | 0.60 | 0.60 | 0.59 |
Publisher’s Note: MDPI stays neutral with regard to jurisdictional claims in published maps and institutional affiliations. |
© 2022 by the authors. Licensee MDPI, Basel, Switzerland. This article is an open access article distributed under the terms and conditions of the Creative Commons Attribution (CC BY) license (https://creativecommons.org/licenses/by/4.0/).
Share and Cite
Condurache, M.-I.; Petrovici, A.-R.; Simionescu, N.; Profire, B.-S.; Confederat, L.-G.; Bujor, A.; Miron, A.; Profire, L. Simultaneous Determination of Glibenclamide and Silymarin Released from Chitosan Microparticles by HPLC-ESI-MS Technique: Method Development and Validation. Pharmaceutics 2022, 14, 2164. https://doi.org/10.3390/pharmaceutics14102164
Condurache M-I, Petrovici A-R, Simionescu N, Profire B-S, Confederat L-G, Bujor A, Miron A, Profire L. Simultaneous Determination of Glibenclamide and Silymarin Released from Chitosan Microparticles by HPLC-ESI-MS Technique: Method Development and Validation. Pharmaceutics. 2022; 14(10):2164. https://doi.org/10.3390/pharmaceutics14102164
Chicago/Turabian StyleCondurache, Mihaela-Iustina, Anca-Roxana Petrovici, Natalia Simionescu, Bianca-Stefania Profire, Luminita-Georgeta Confederat, Alexandra Bujor, Anca Miron, and Lenuta Profire. 2022. "Simultaneous Determination of Glibenclamide and Silymarin Released from Chitosan Microparticles by HPLC-ESI-MS Technique: Method Development and Validation" Pharmaceutics 14, no. 10: 2164. https://doi.org/10.3390/pharmaceutics14102164
APA StyleCondurache, M.-I., Petrovici, A.-R., Simionescu, N., Profire, B.-S., Confederat, L.-G., Bujor, A., Miron, A., & Profire, L. (2022). Simultaneous Determination of Glibenclamide and Silymarin Released from Chitosan Microparticles by HPLC-ESI-MS Technique: Method Development and Validation. Pharmaceutics, 14(10), 2164. https://doi.org/10.3390/pharmaceutics14102164