
Native Cyclodextrins as Complexation Agents for Pterostilbene: Complex Preparation and Characterization in Solution and in the Solid State

 ,
, 
 ,
,  and
and 
Abstract
:1. Introduction
2. Materials and Methods
2.1. Materials
2.2. Methods
2.2.1. Sample Preparation
2.2.2. Thermal Analysis
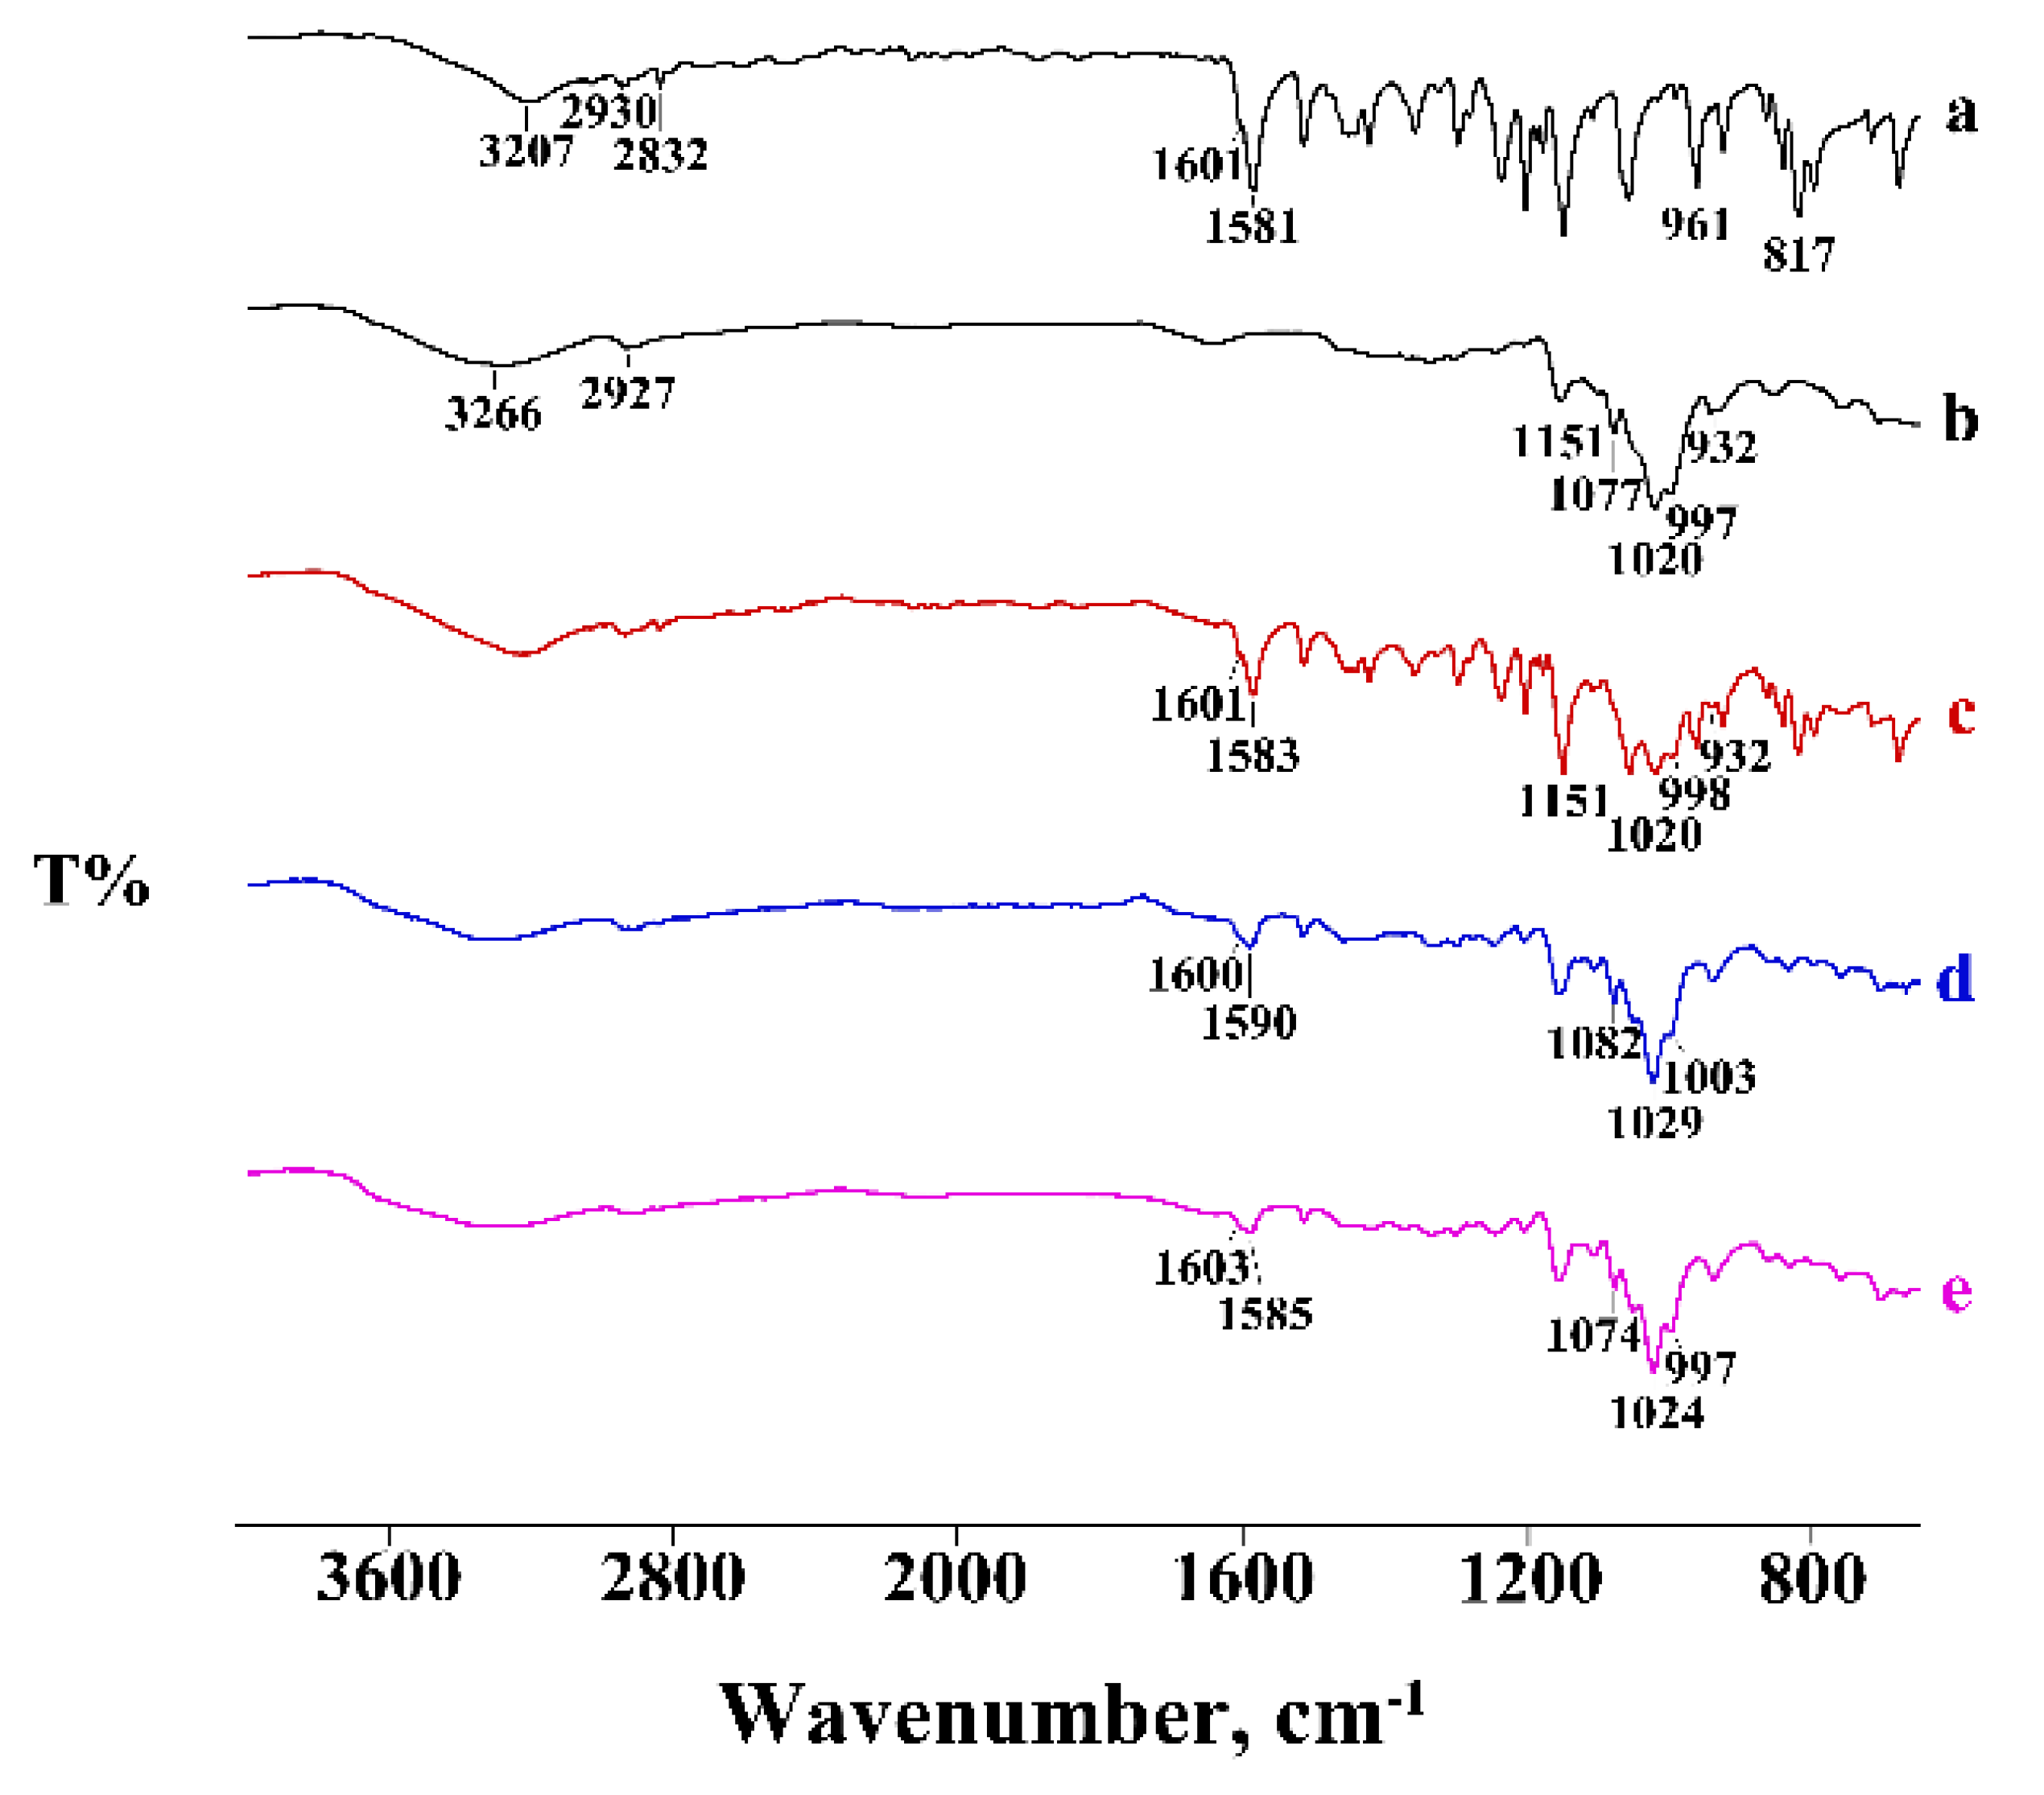
2.2.3. Fourier Transform Infrared Spectroscopy
2.2.4. Nuclear Magnetic Resonance Spectroscopy
2.2.5. X-ray Diffraction
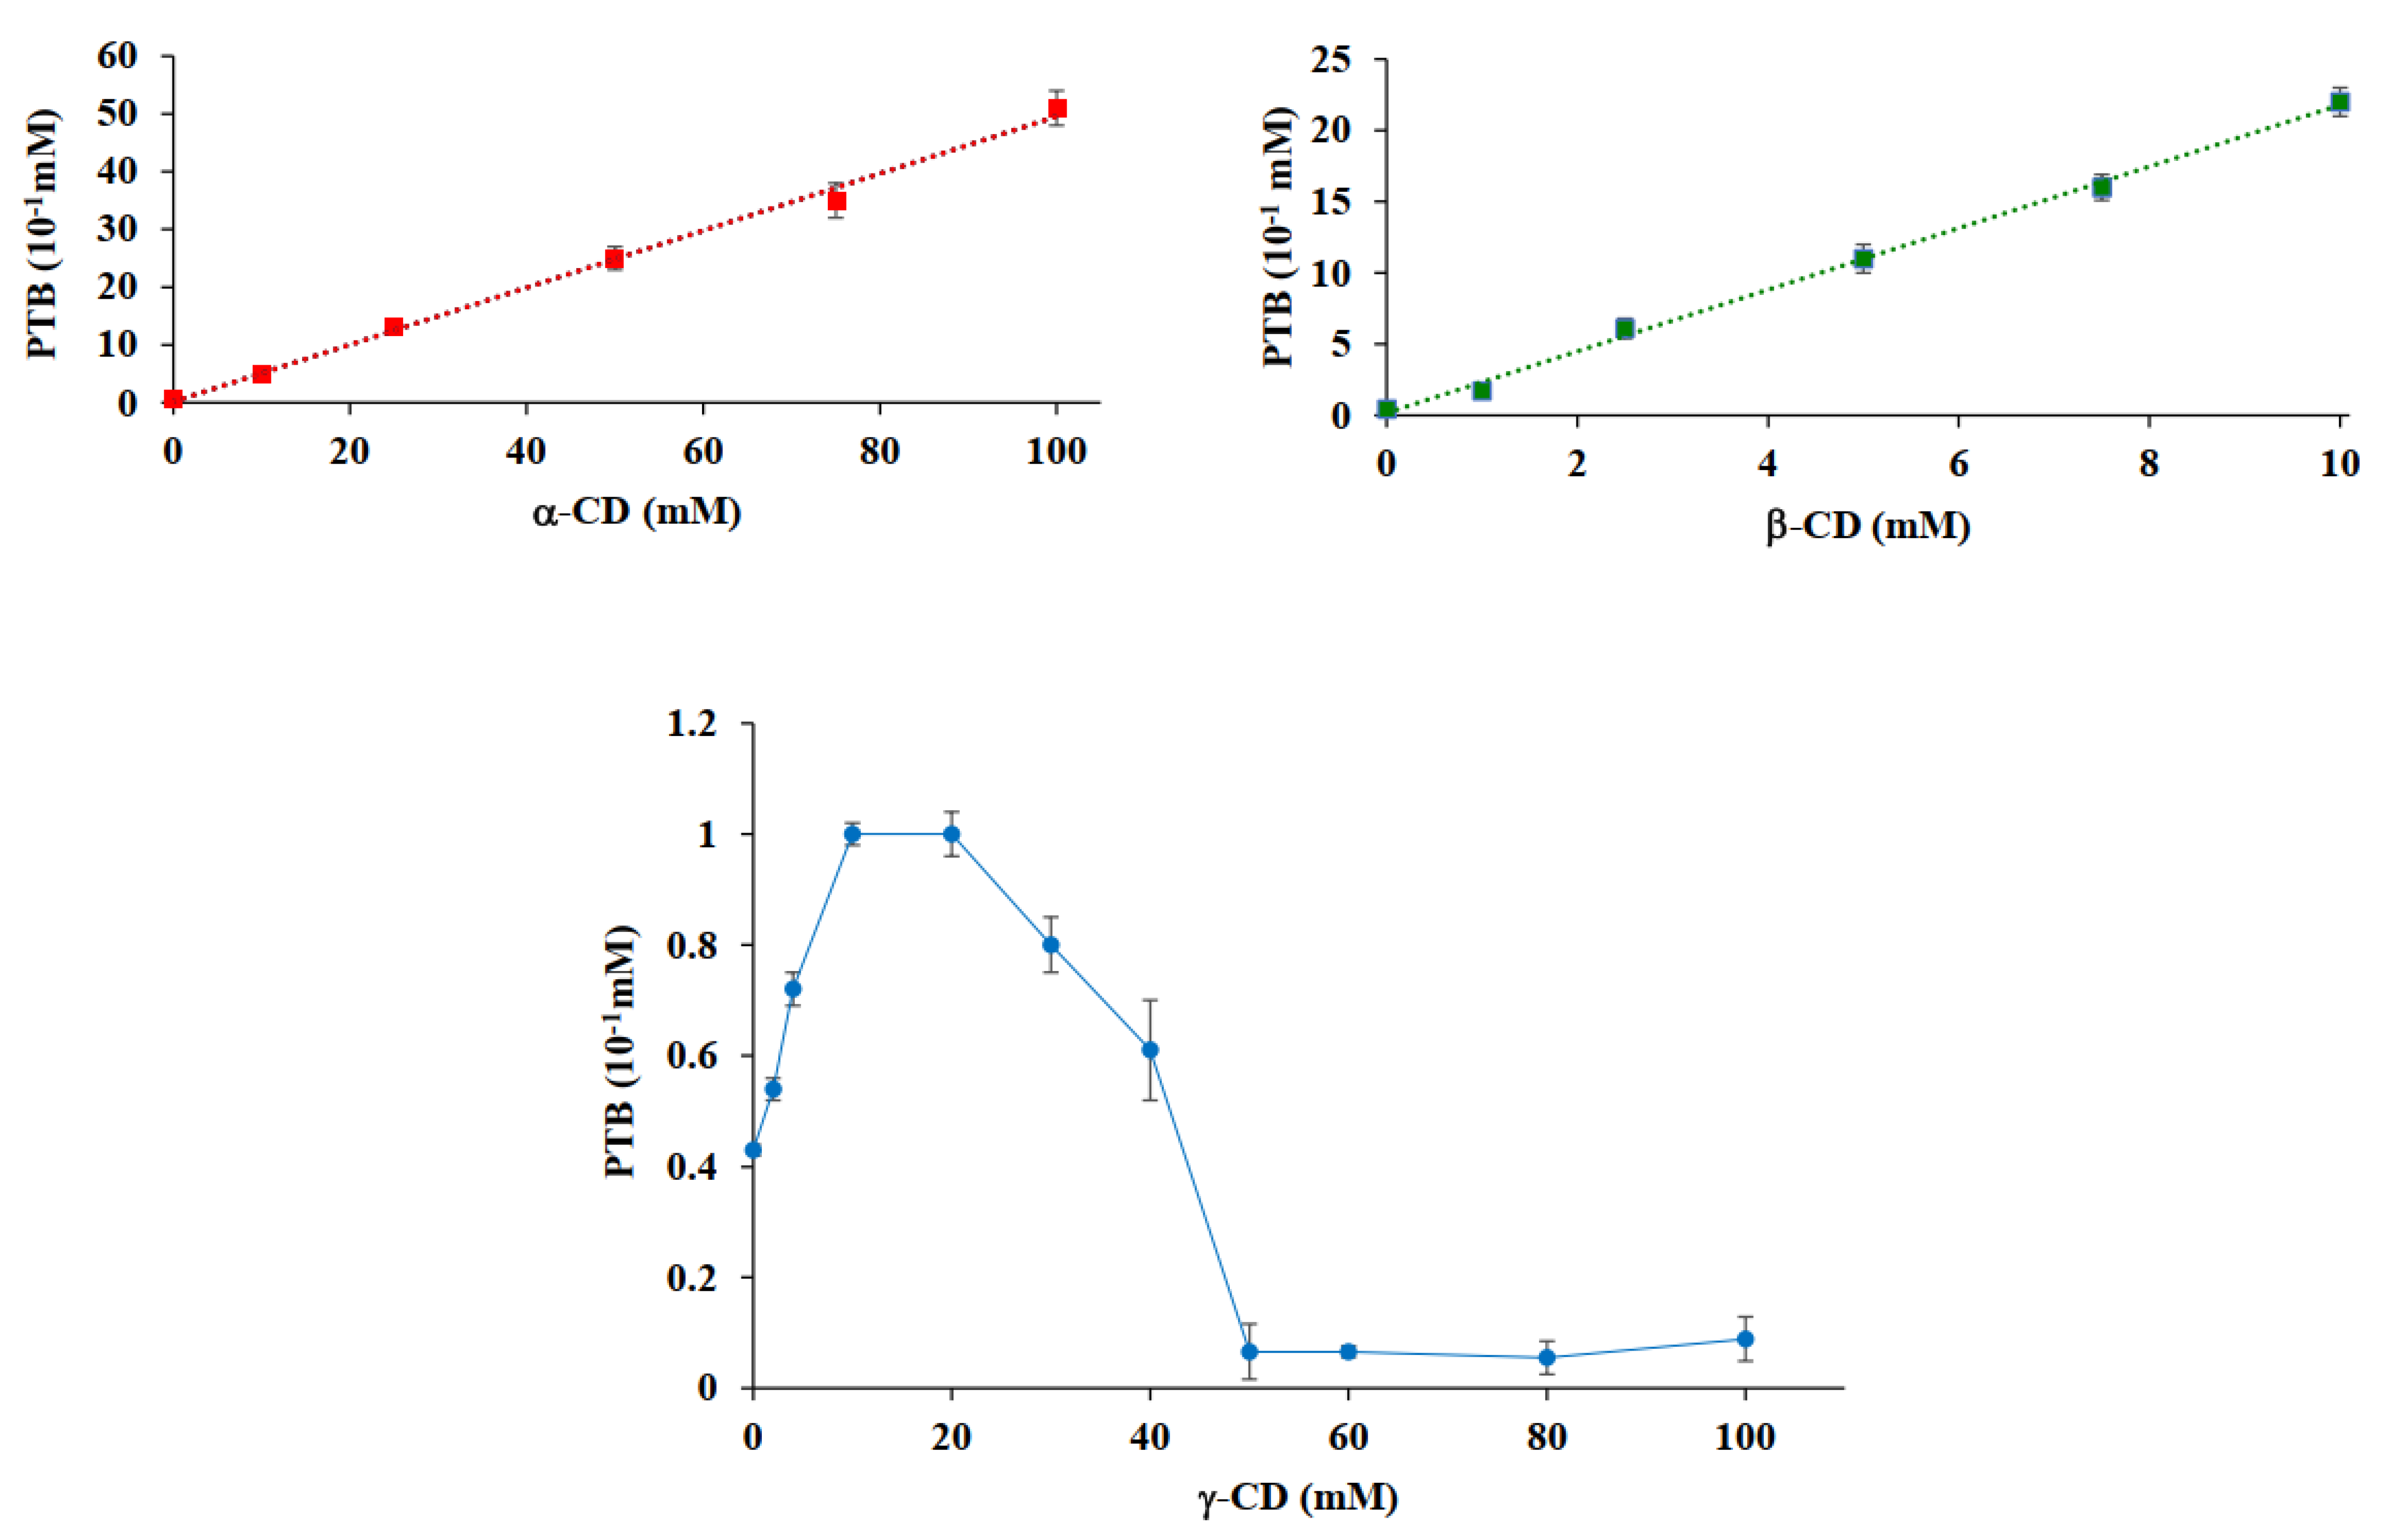
2.2.6. Phase-Solubility Analysis
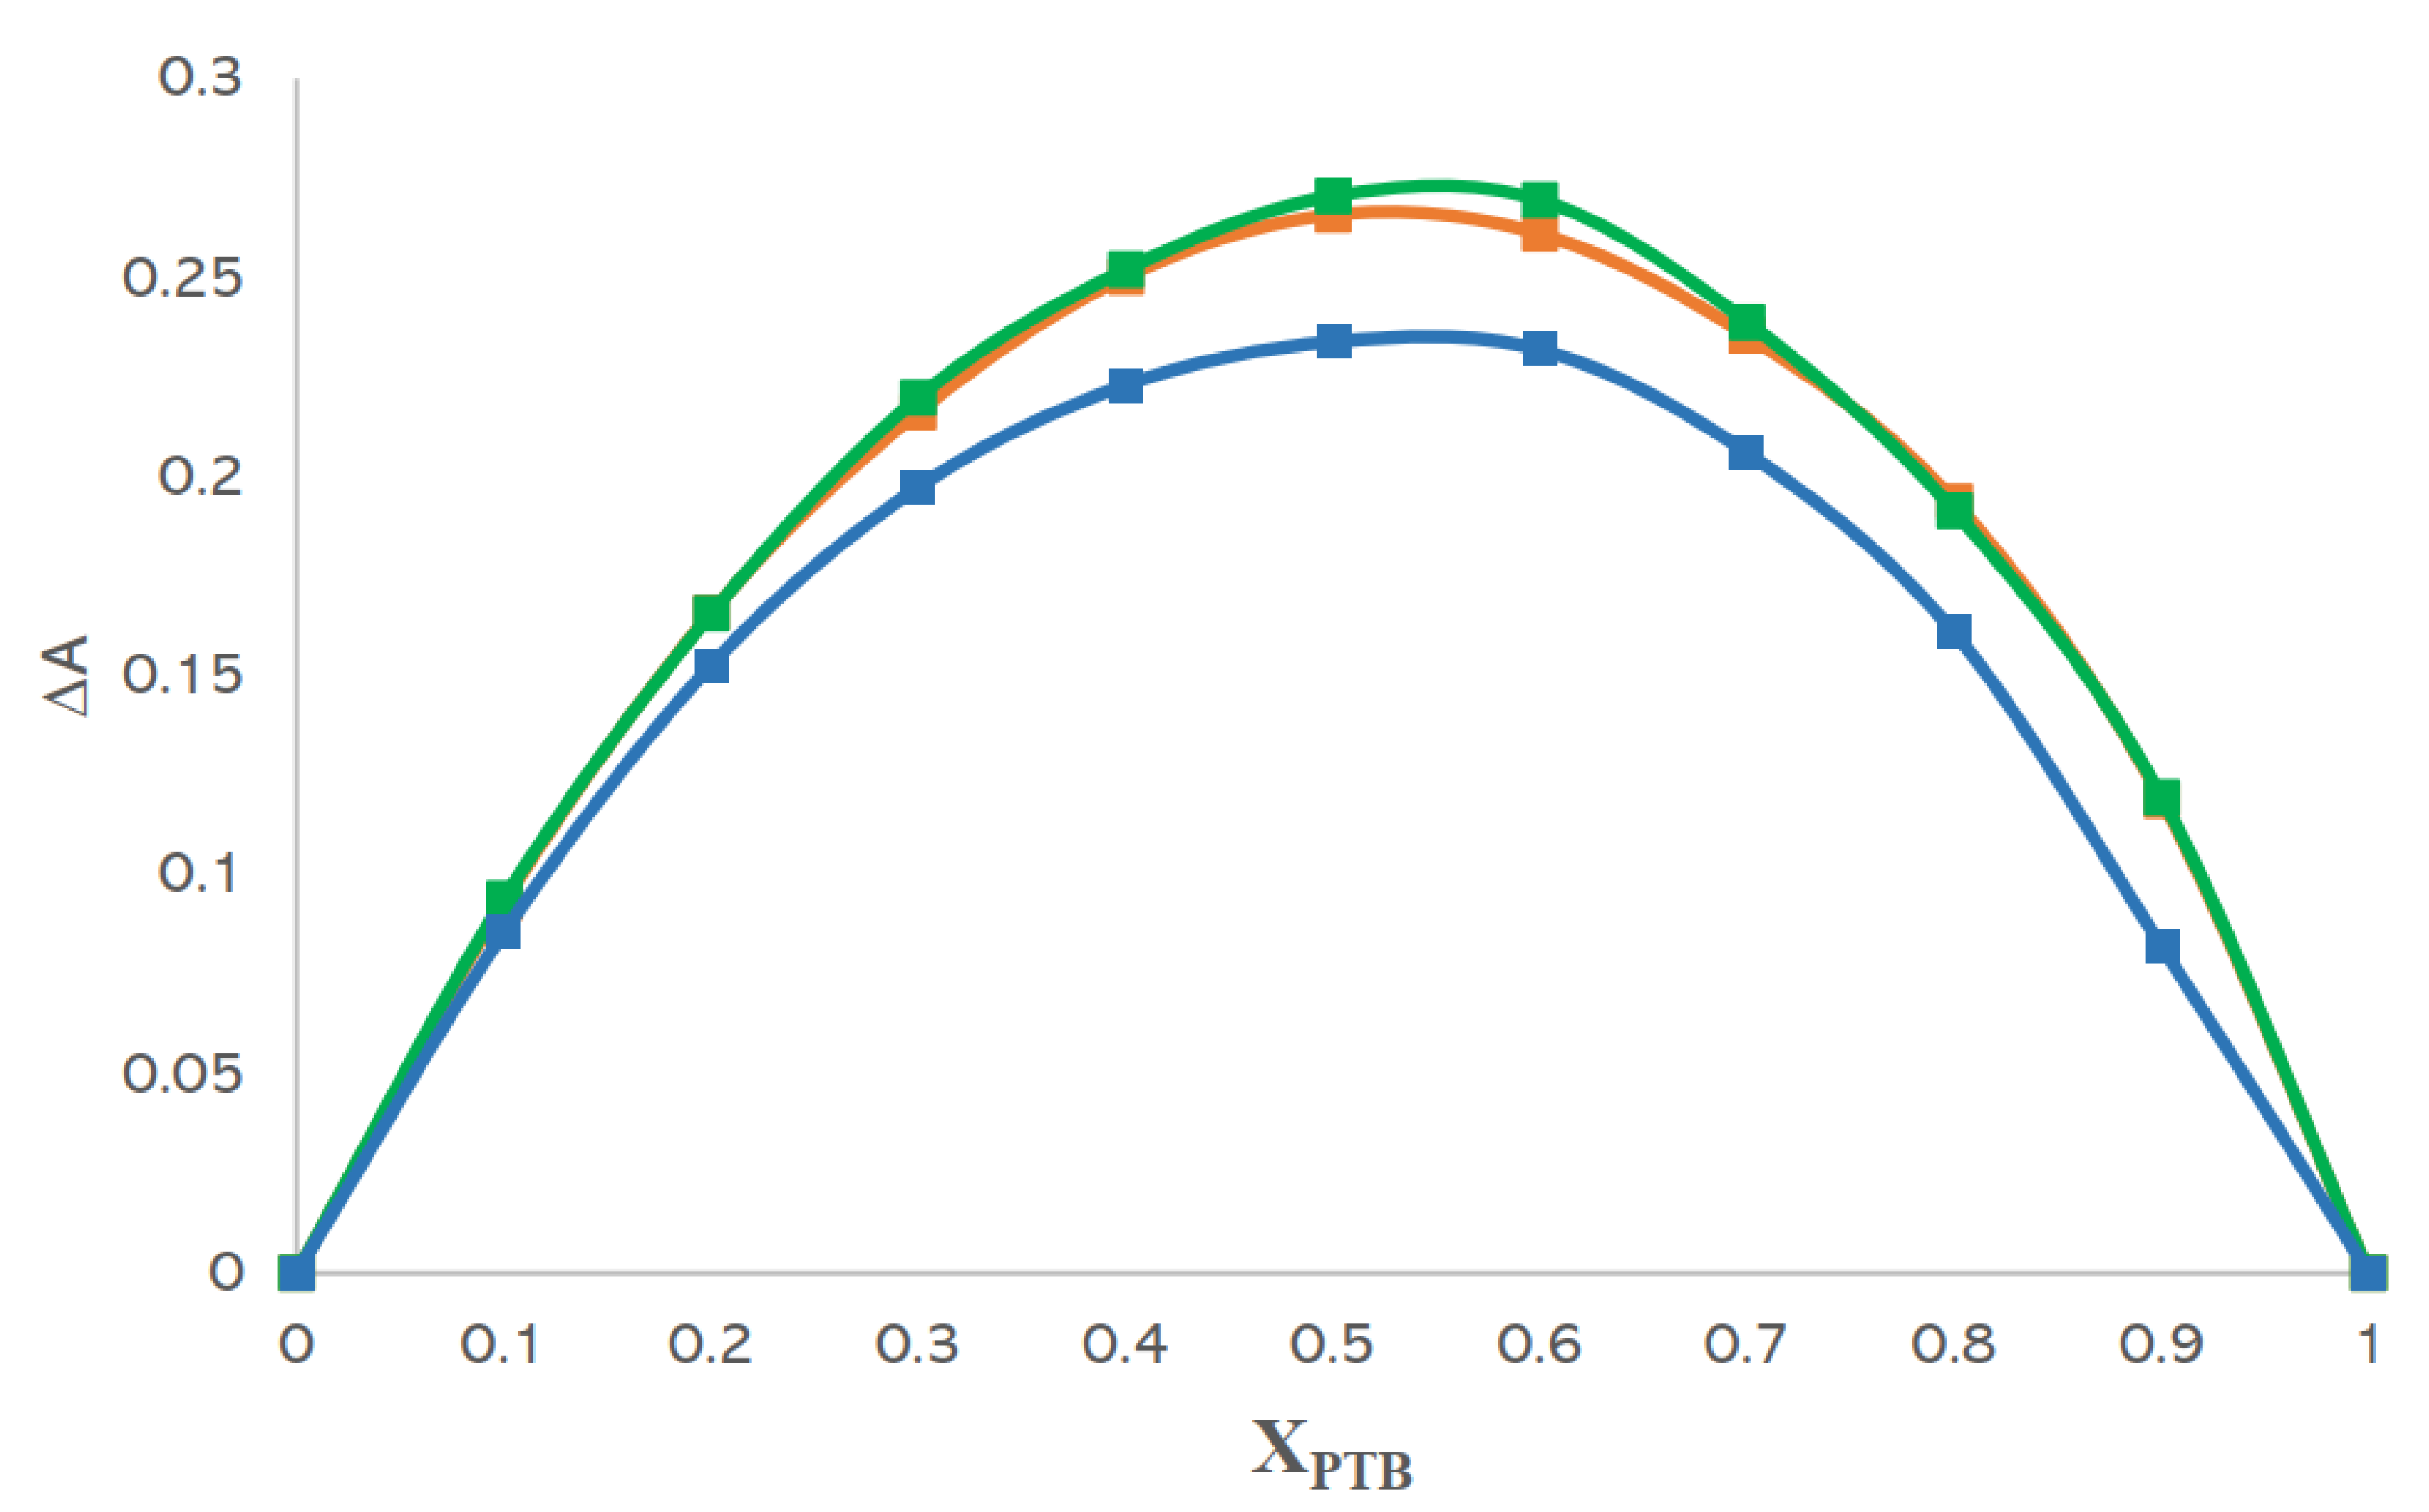
2.2.7. Job’s Method
2.2.8. Dissolution Studies
3. Results
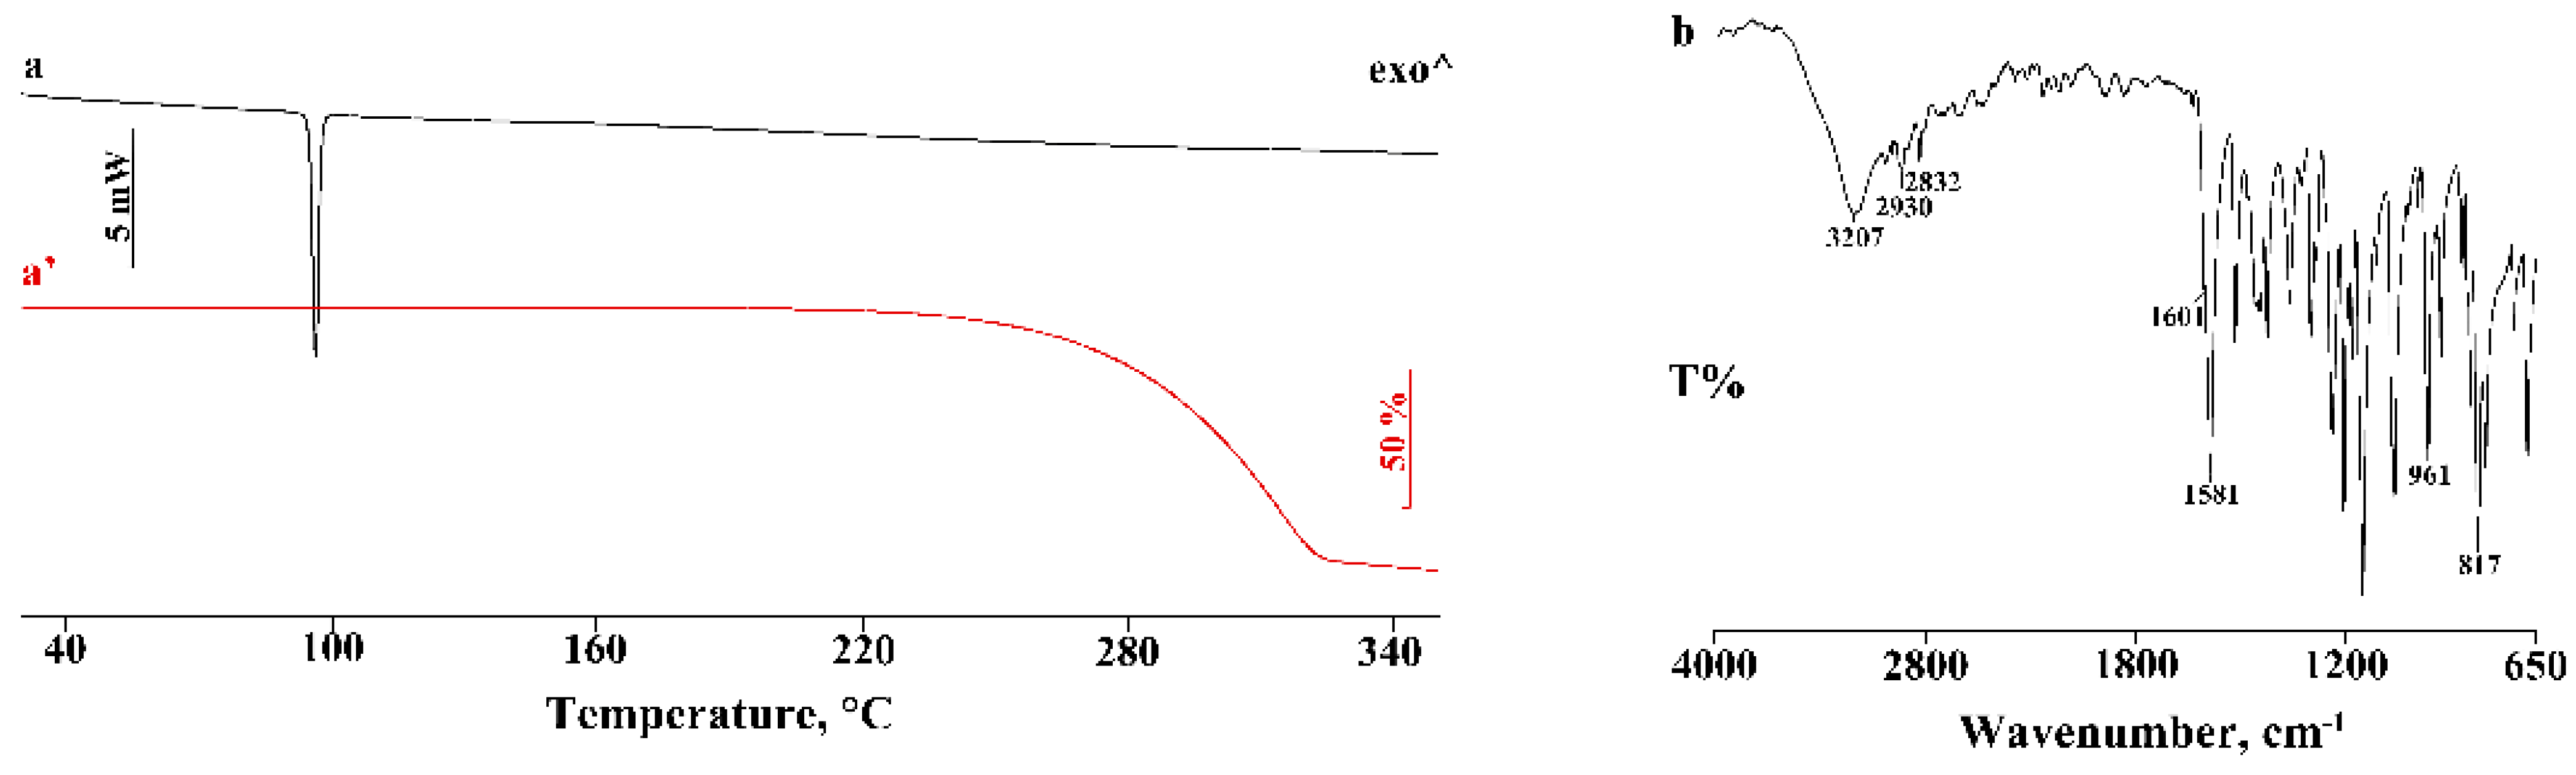
3.1. Thermal and FT-IR Characterization of the Commercial Product
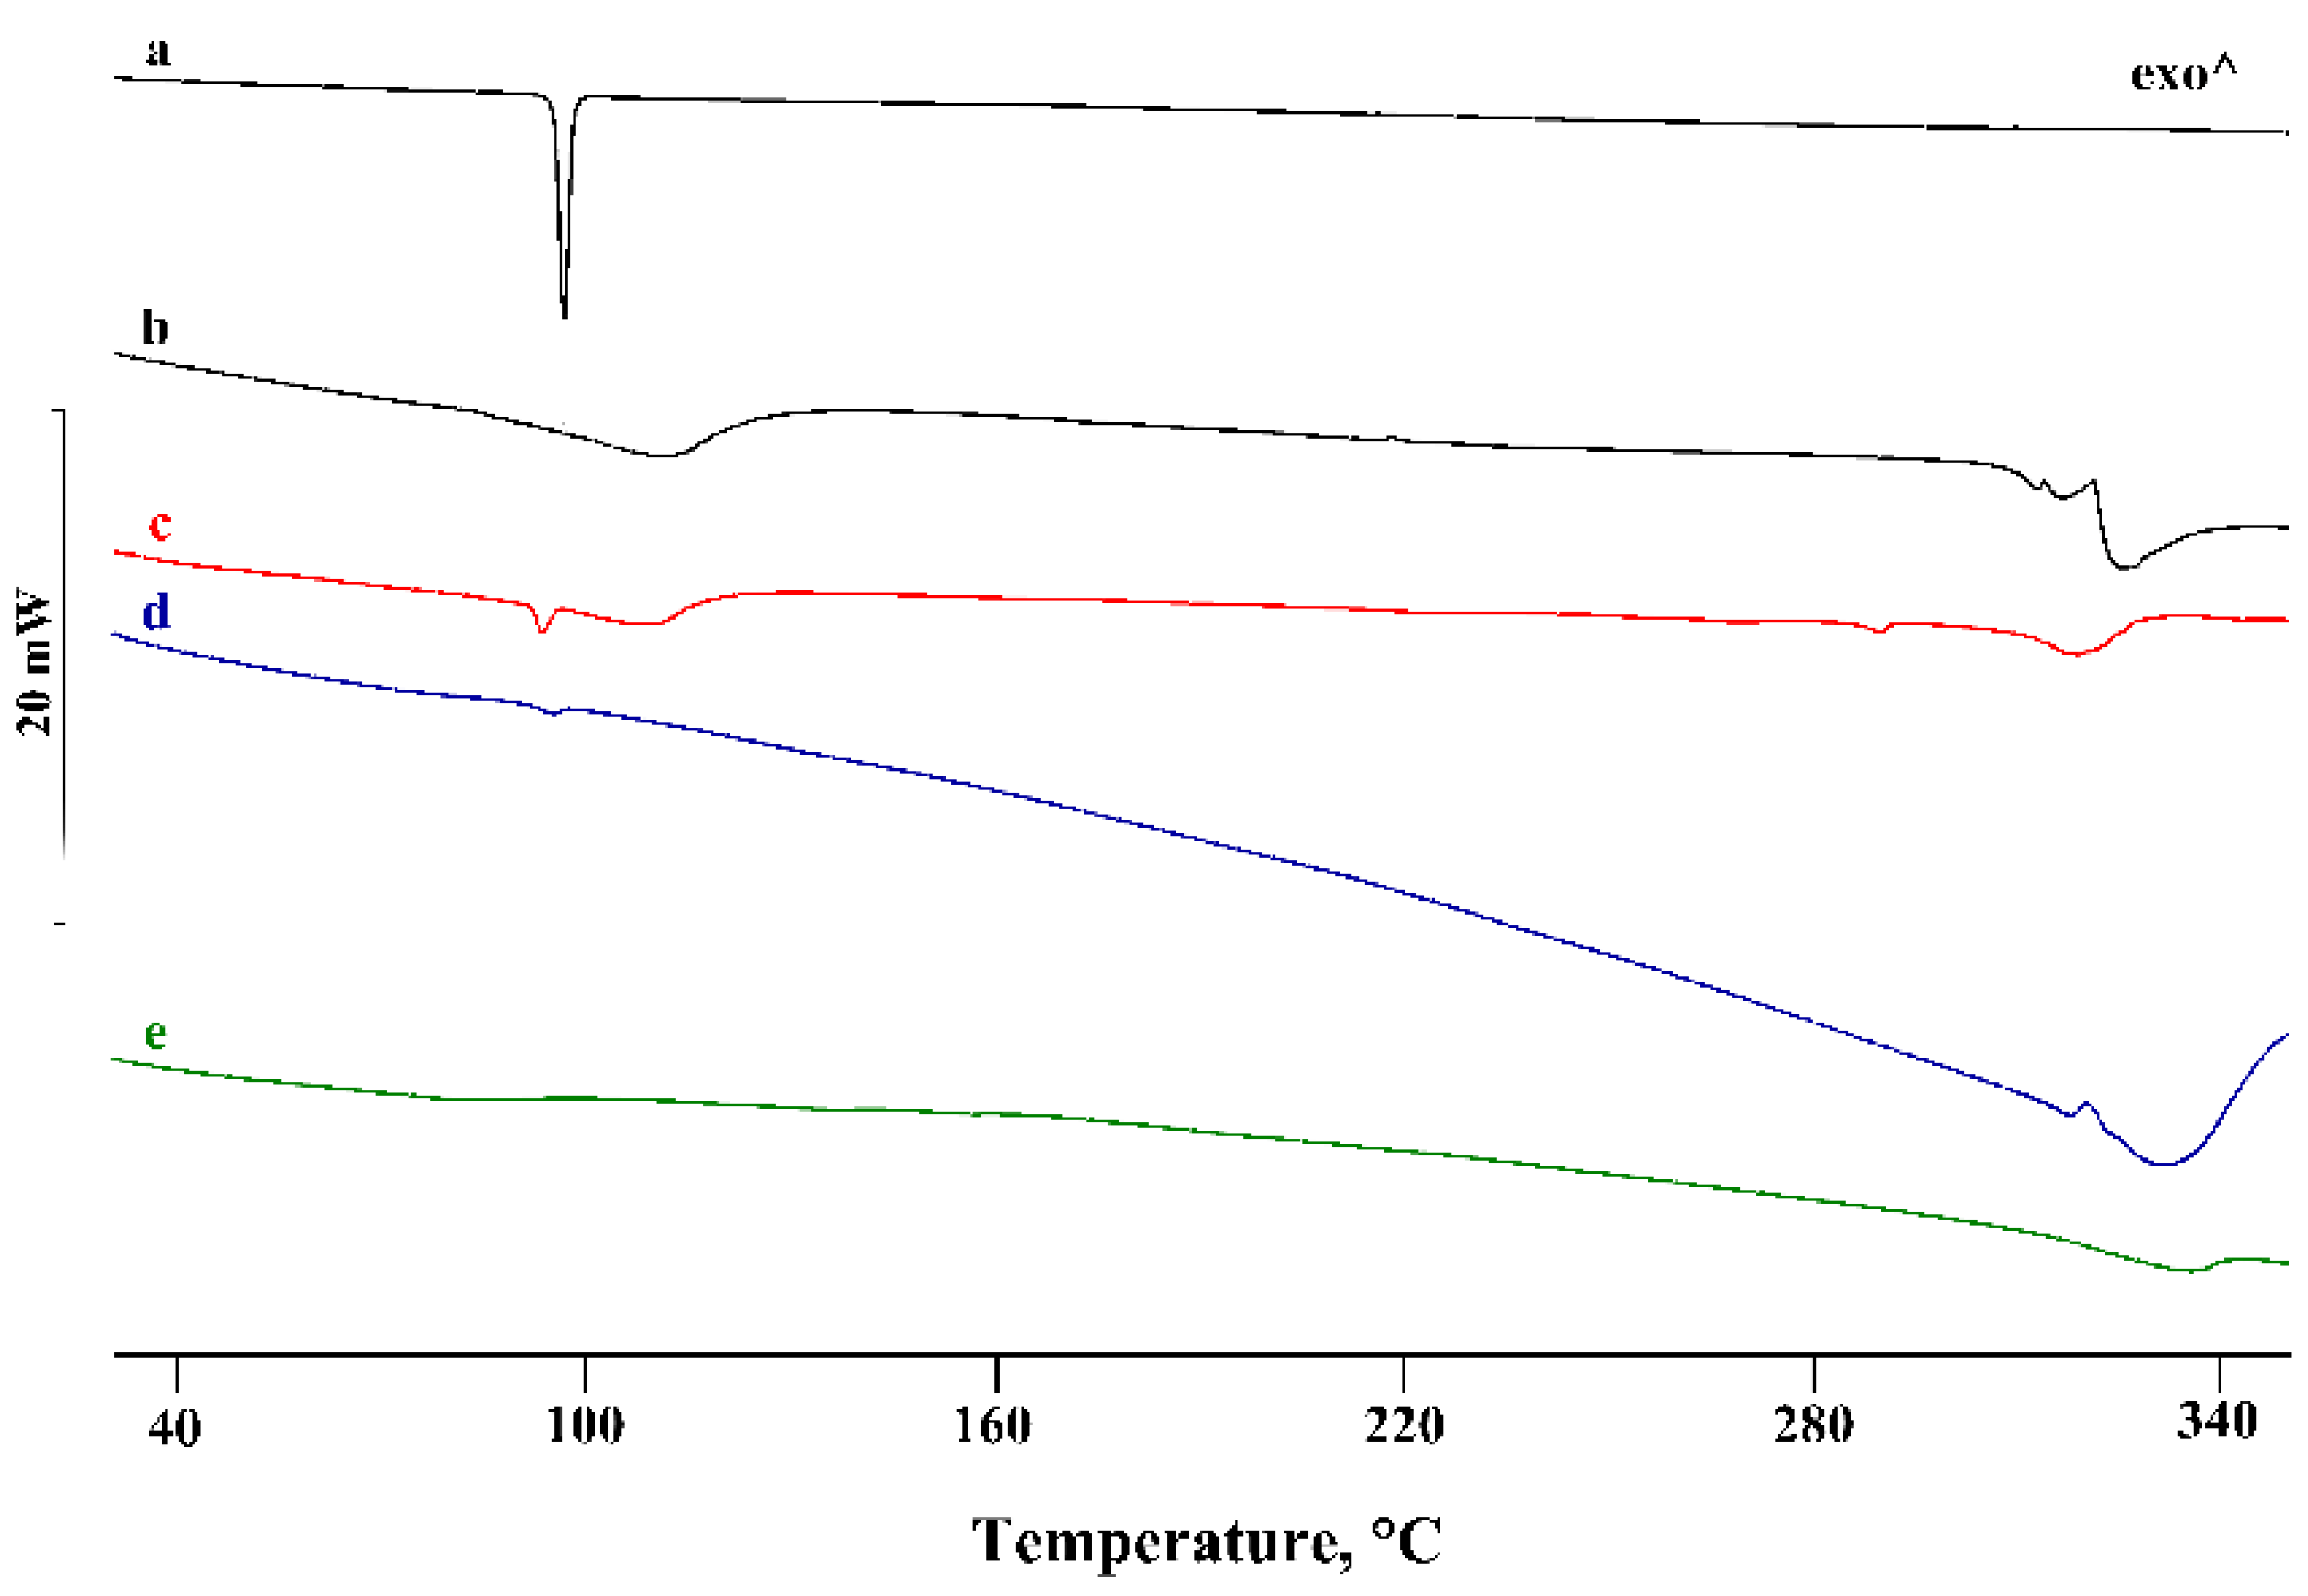
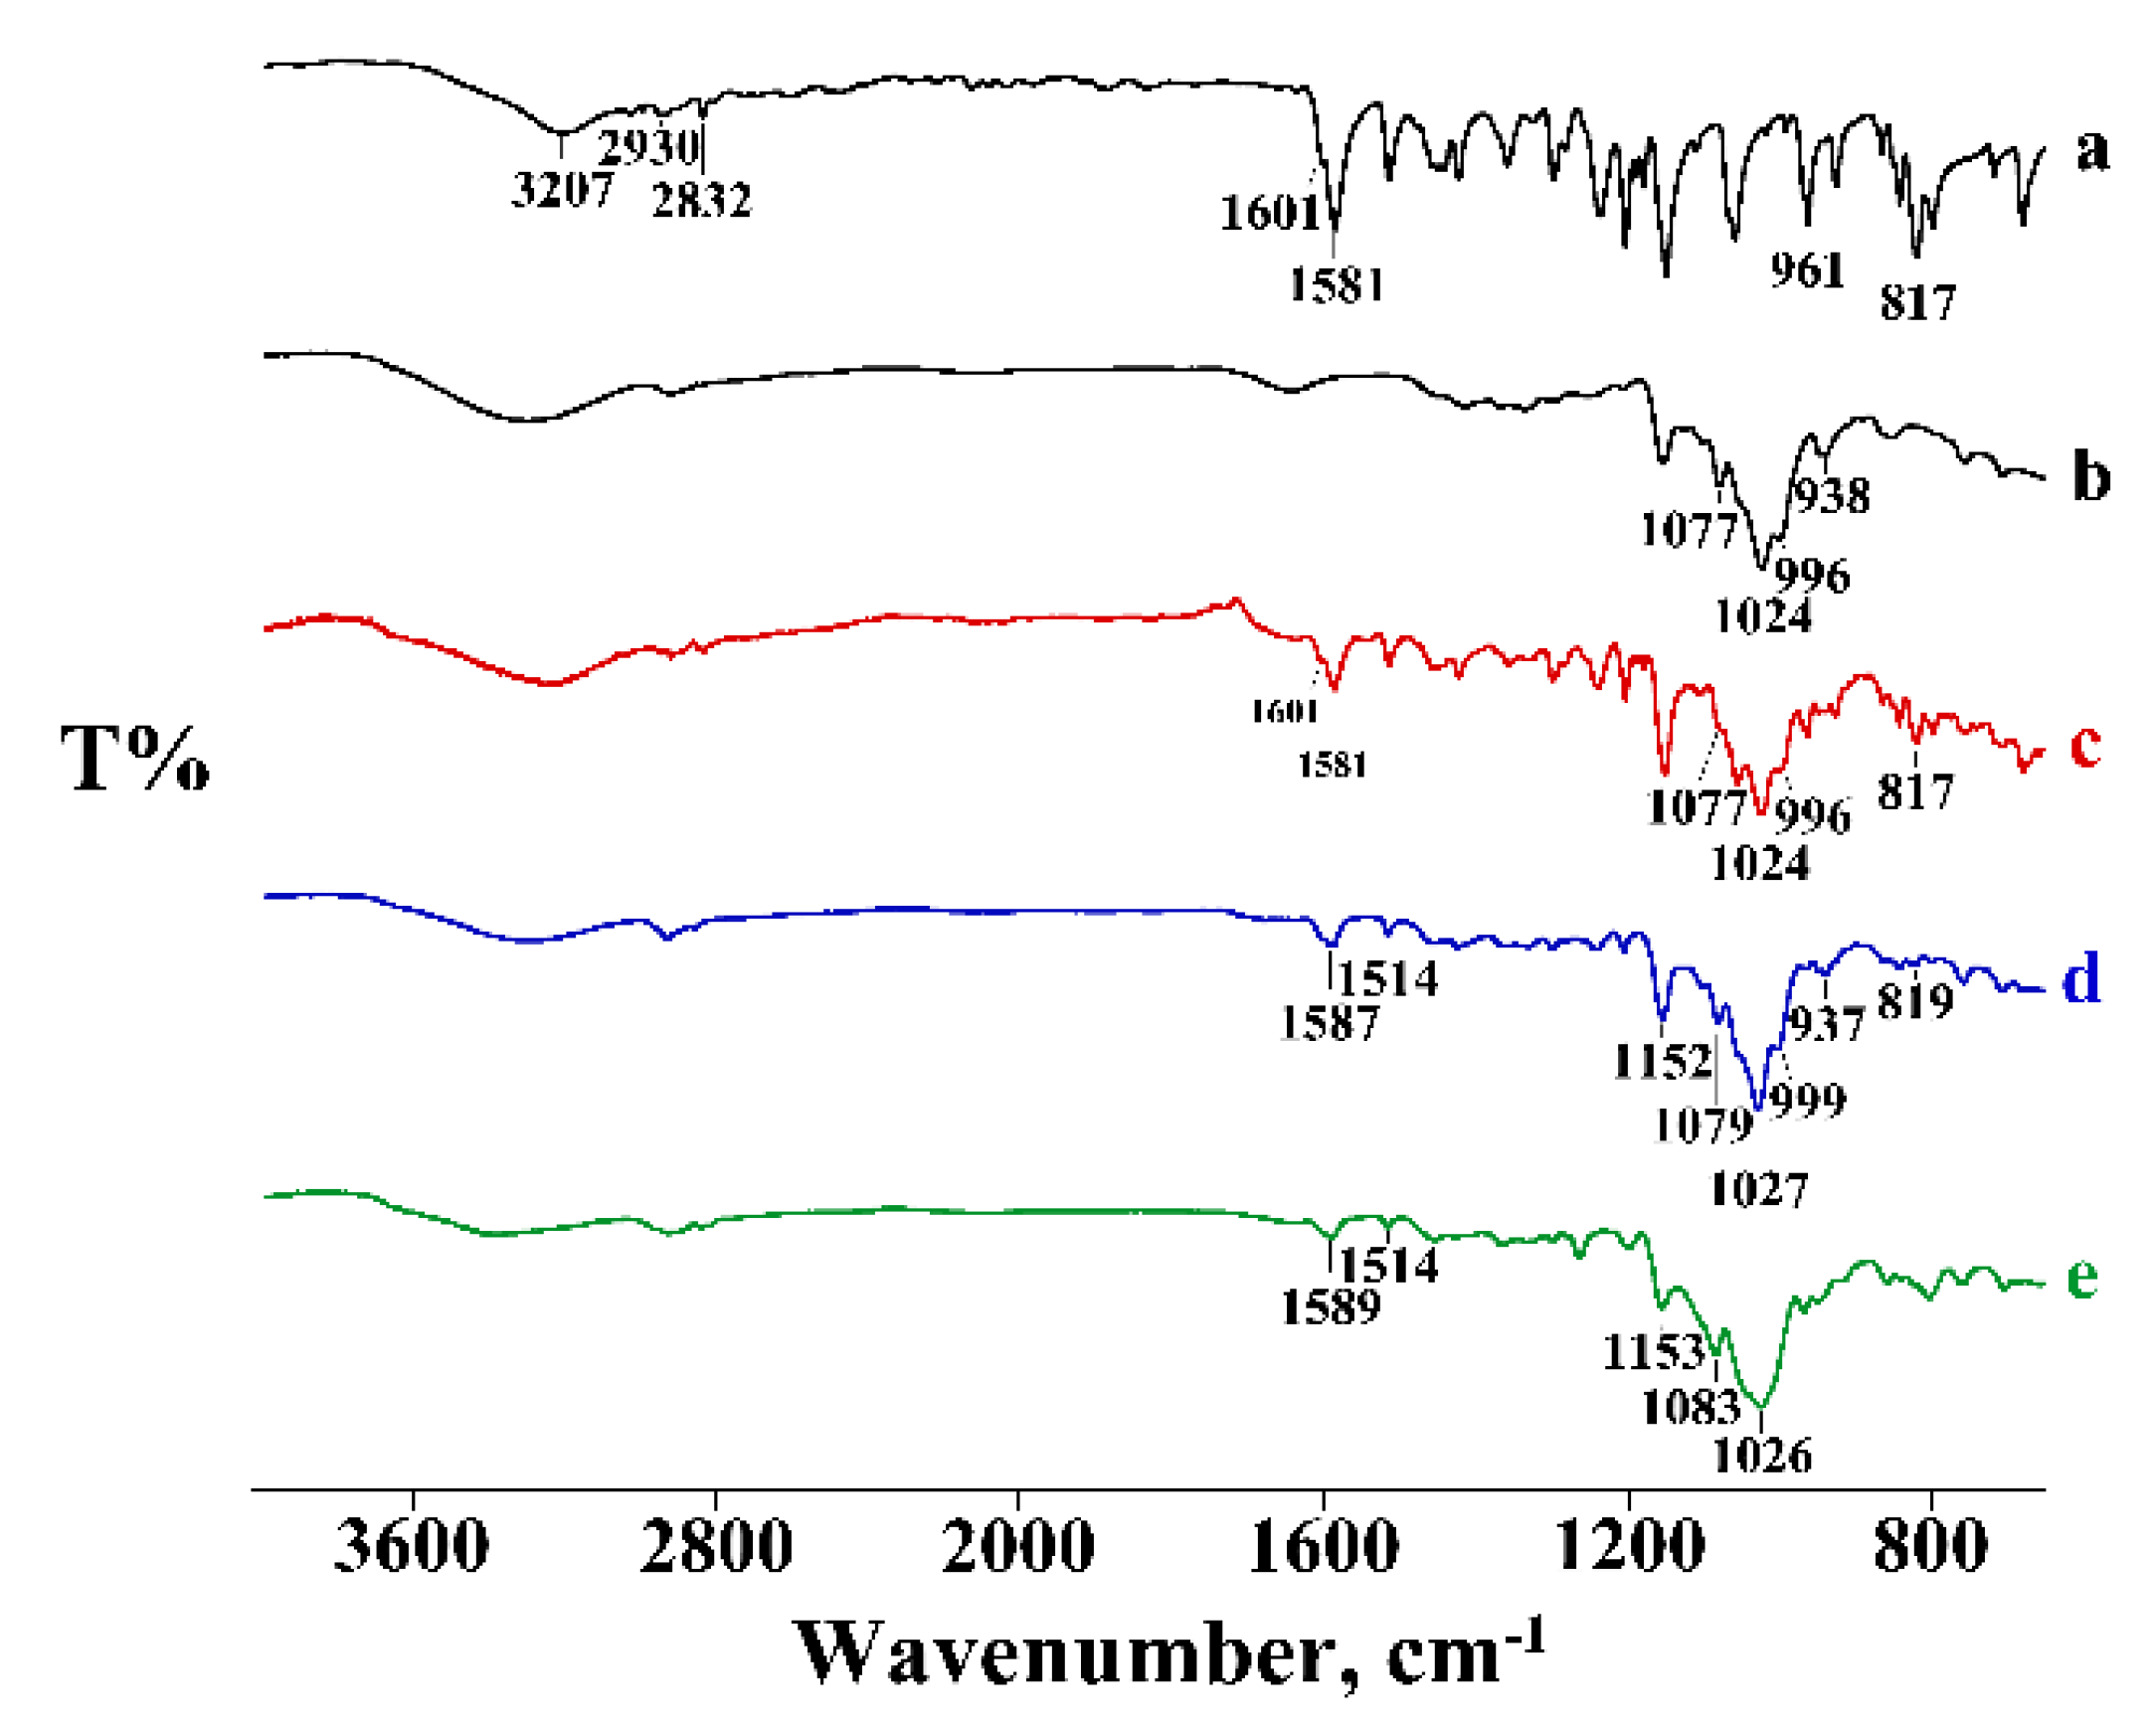
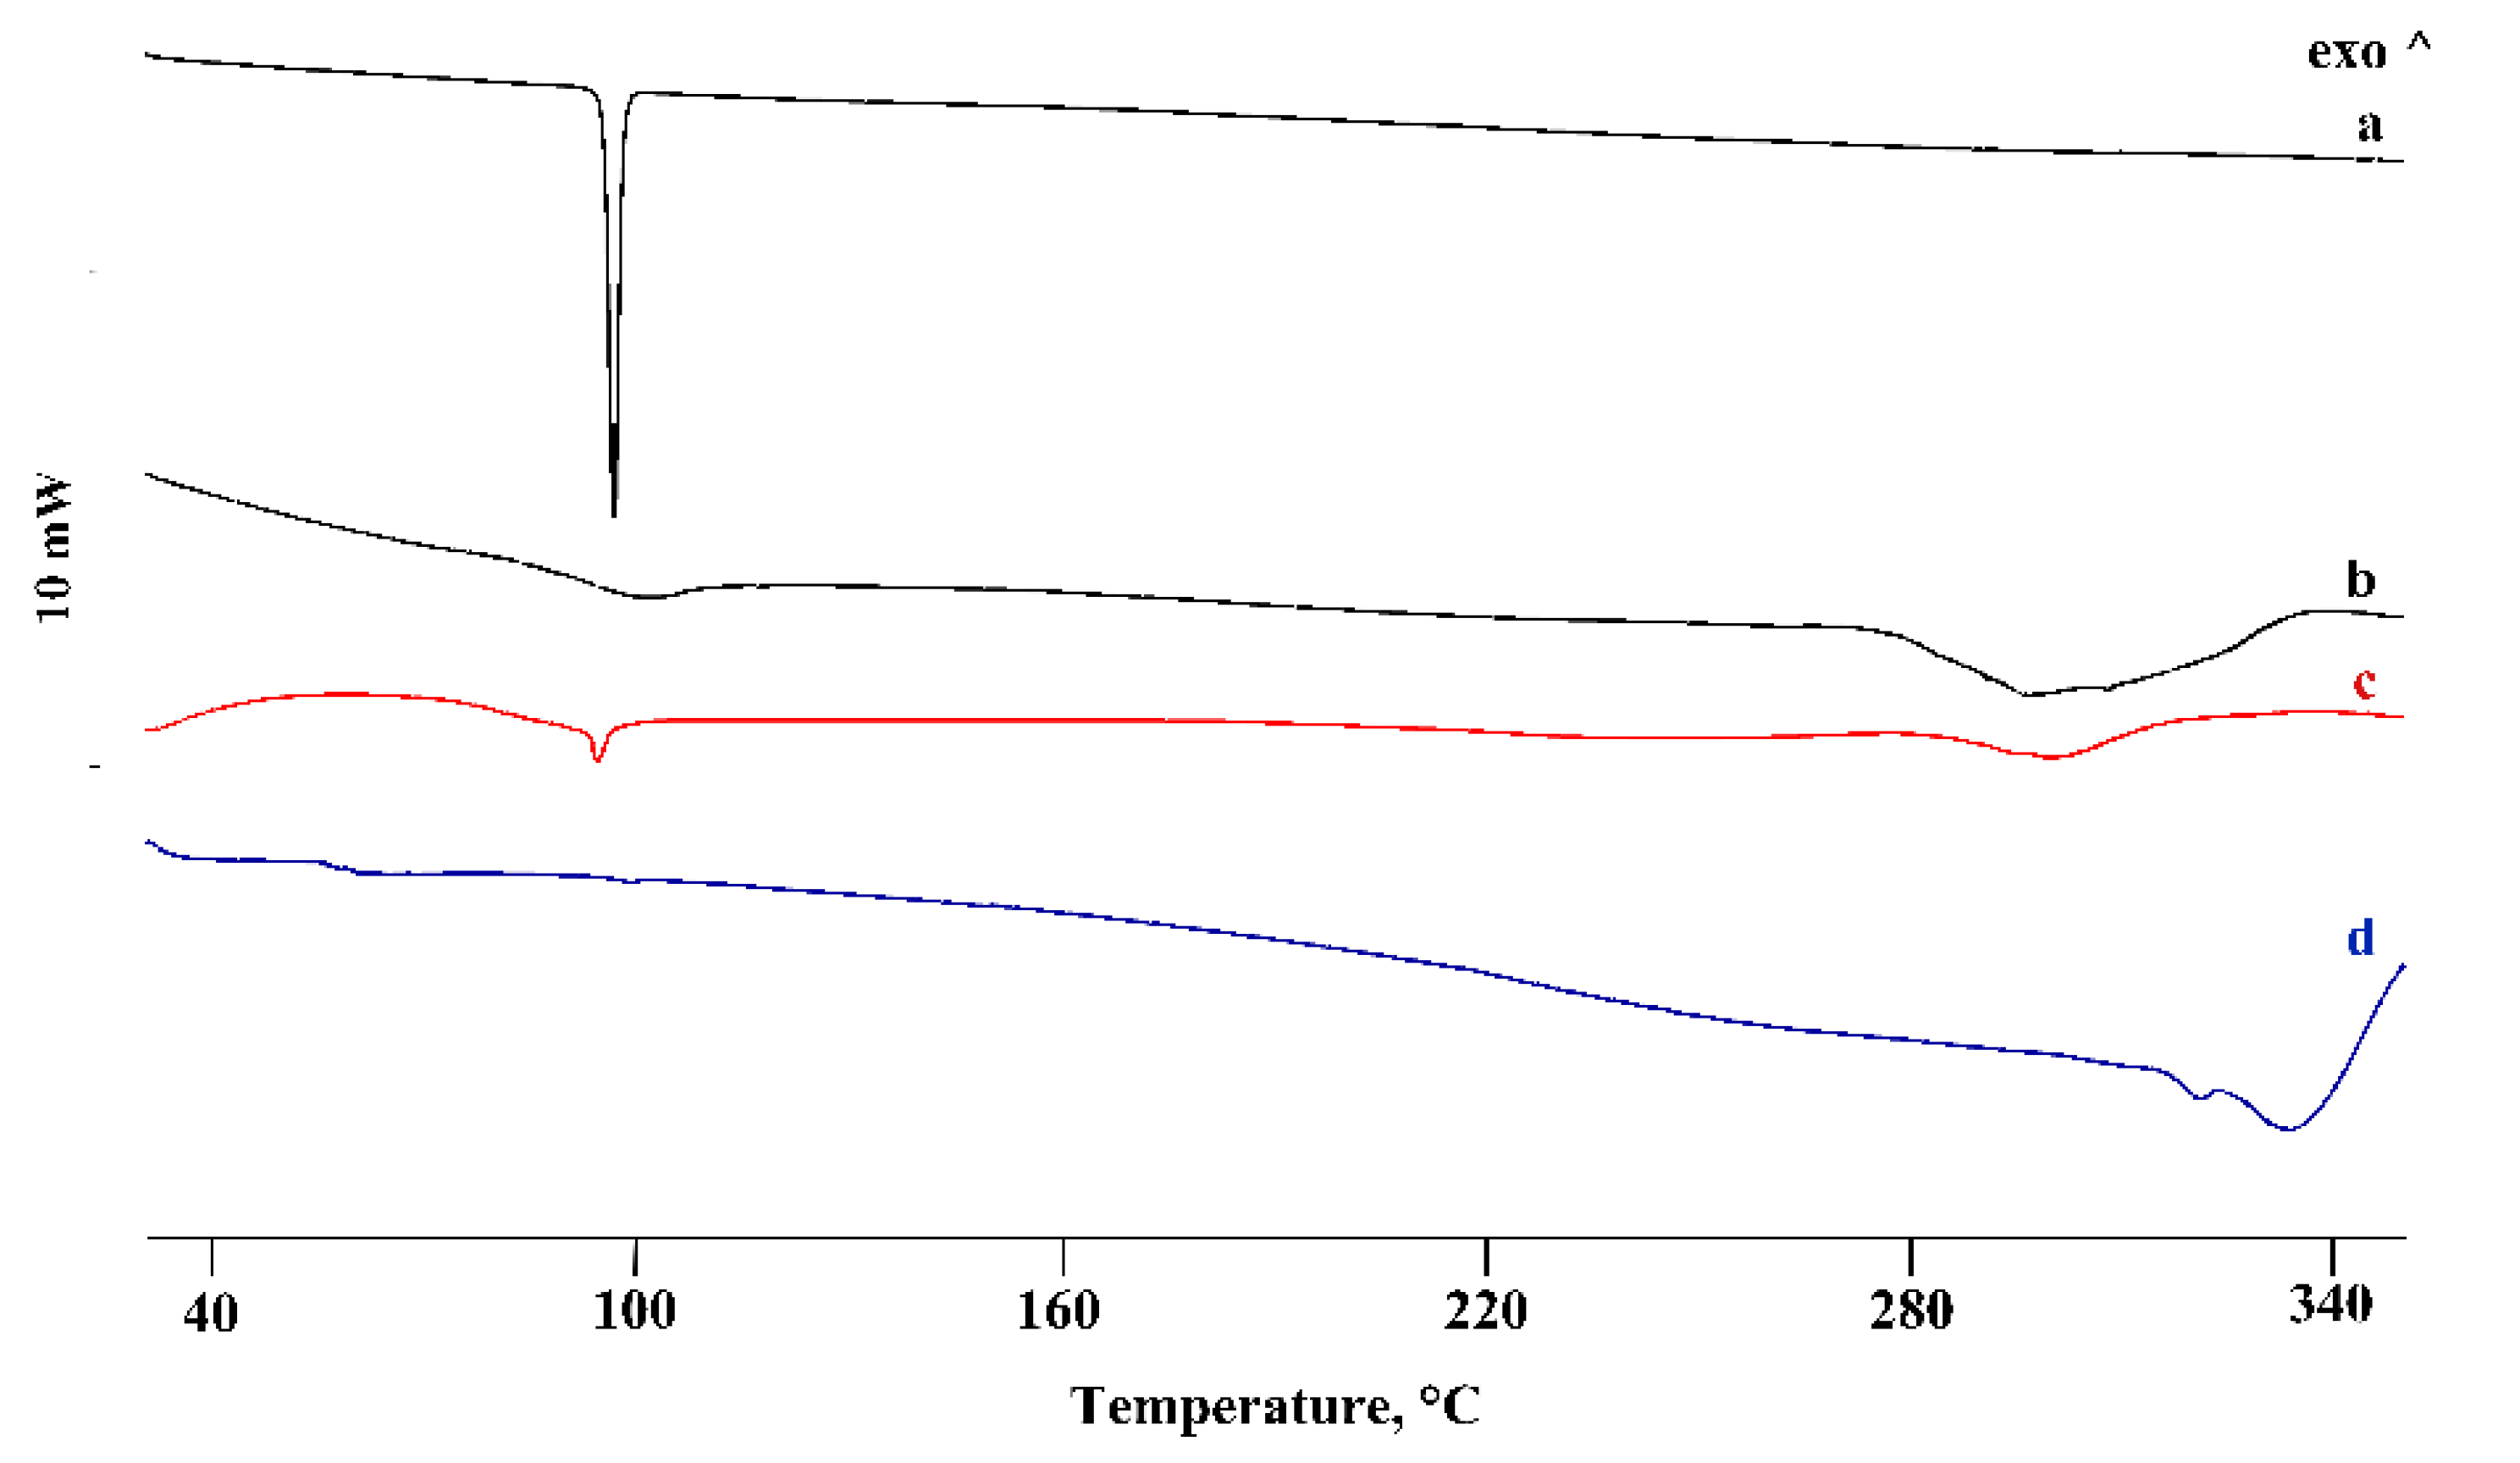
3.2. Thermal and FT-IR Characterization of the PTB-CD Binary Systems
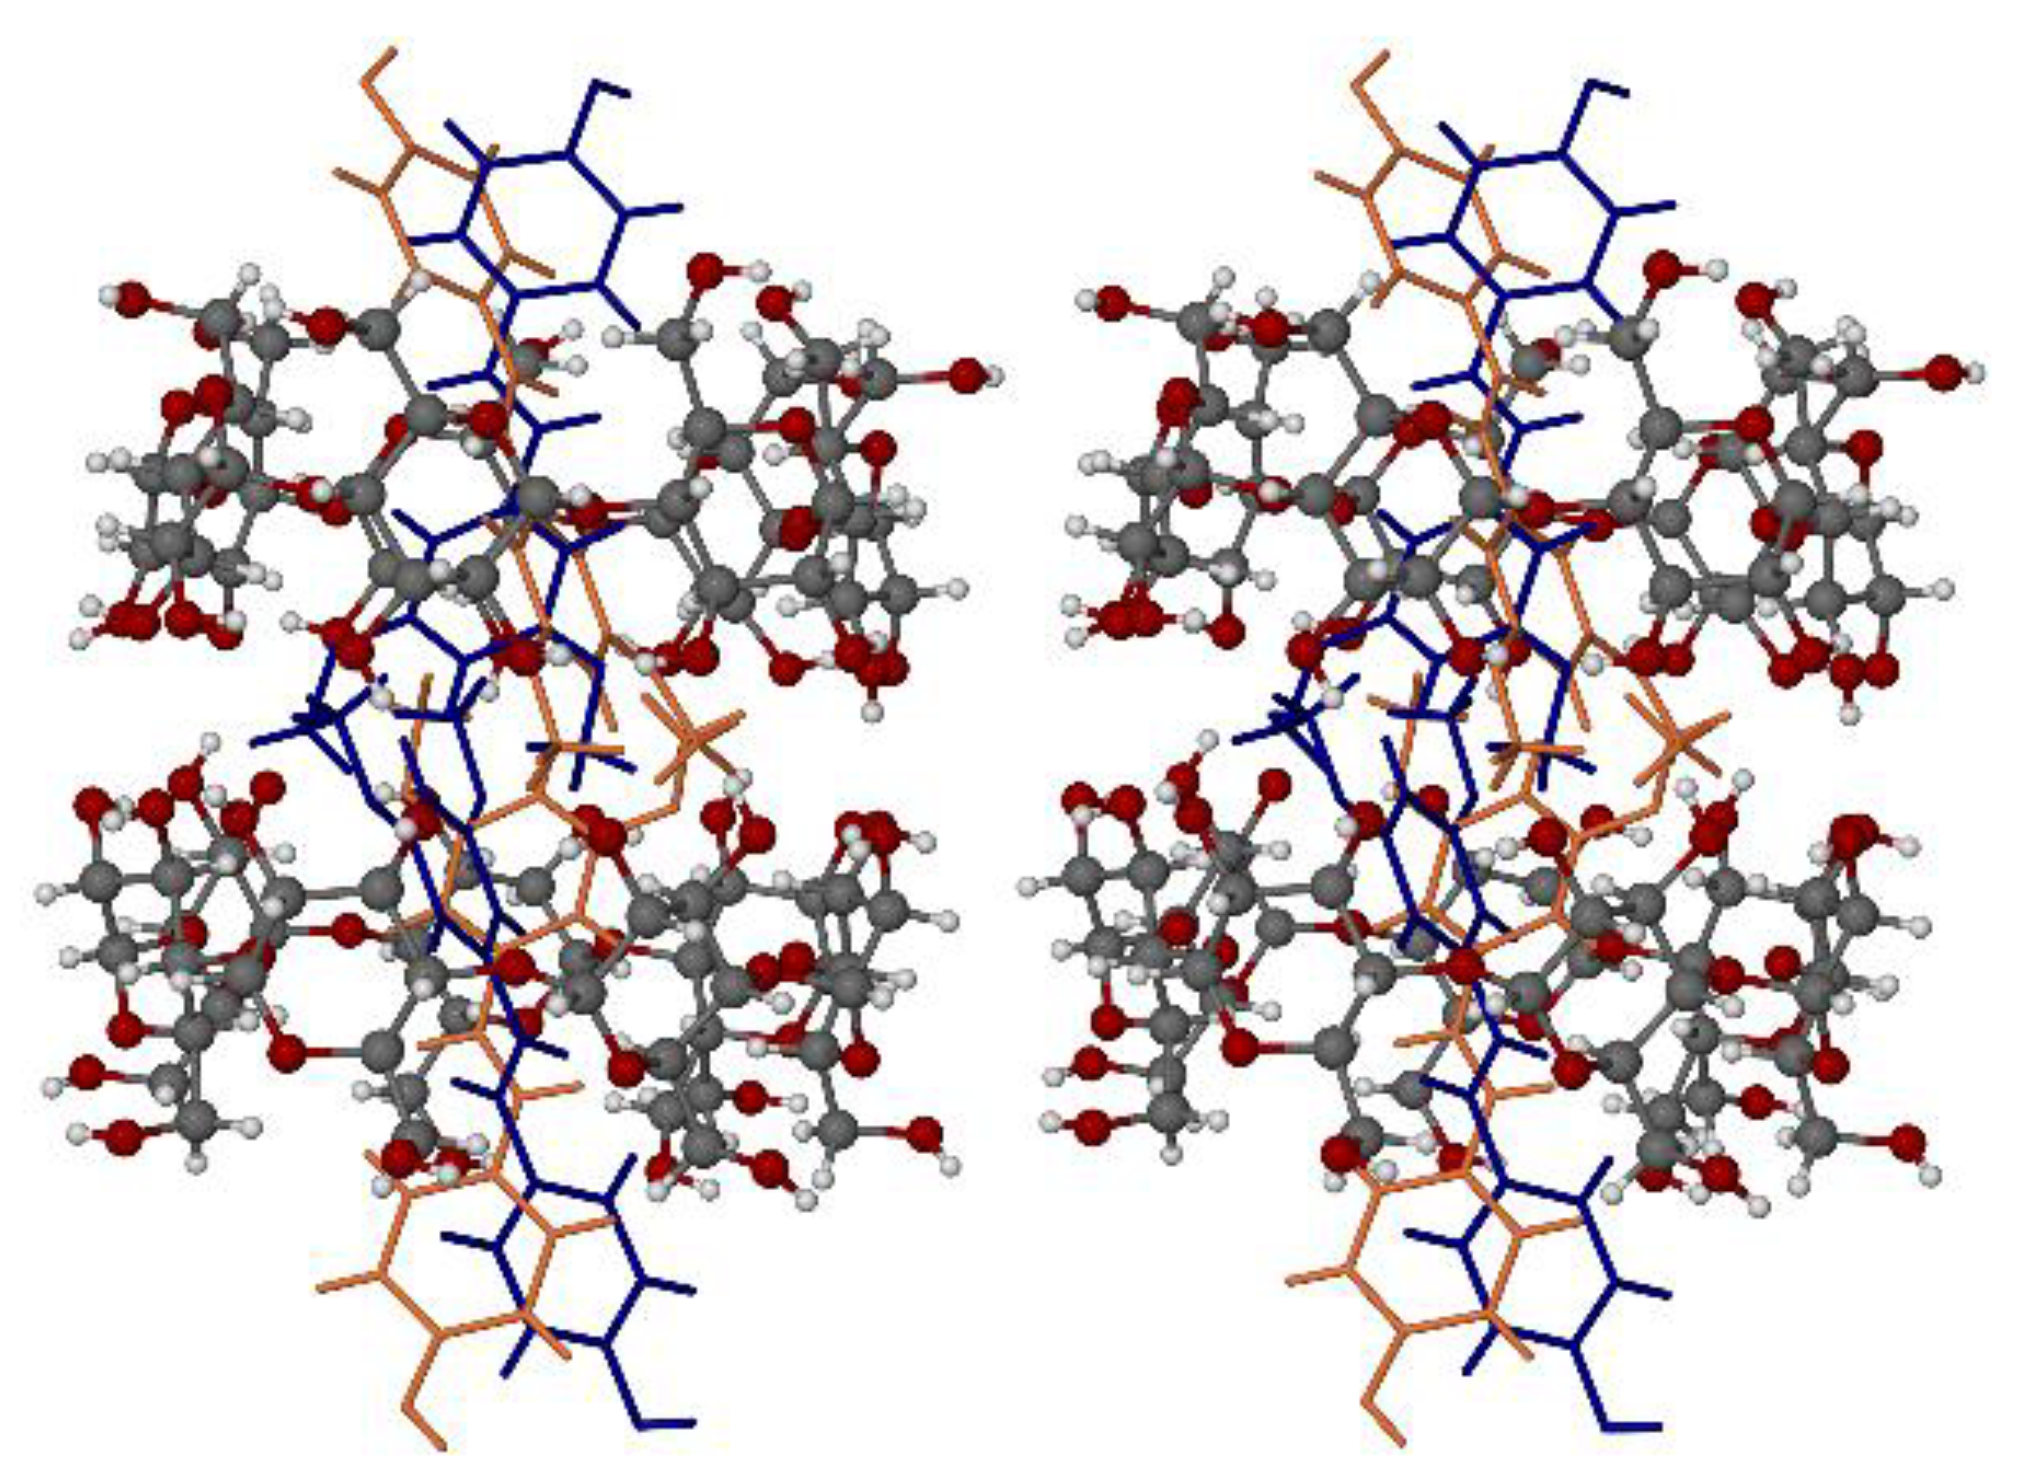
3.3. X-ray Structure of the Hydrated β-CD Complex of PTB
3.4. Phase-Solubility Analysis
3.5. Analyses Based on Job’s Method
3.6. Dissolution Studies
4. Discussion
5. Conclusions
Supplementary Materials
Author Contributions
Funding
Institutional Review Board Statement
Informed Consent Statement
Data Availability Statement
Acknowledgments
Conflicts of Interest
References and Note
- Savjani, K.T.; Gajjar, A.K.; Savjani, J.K. Drug Solubility: Importance and enhancement techniques. ISRN Pharm. 2012, 2012, 1–10. [Google Scholar] [CrossRef] [Green Version]
- Kumar, R.; Thakur, A.K.; Chaudhari, P.; Banerjee, N. Particle size reduction techniques of pharmaceutical compounds for the enhancement of their dissolution rate and bioavailability. J. Pharm. Innov. 2021, 20, 1–20. [Google Scholar] [CrossRef]
- Al-Kassas, R.; Bansal, M.; Shaw, J. Nanosizing techniques for improving bioavailability of drugs. J. Control. Release 2017, 260, 202–212. [Google Scholar] [CrossRef] [PubMed]
- Li, J.; Zhou, Y.; Aisha, M.; Wu, J.; Wang, H.; Huang, F.; Sun, M. Preparation of loratadine nanocrystal tablets to improve the solubility and dissolution for enhanced oral bioavailability. J. Pharm. Pharmacol. 2021, 73, 937–946. [Google Scholar] [CrossRef]
- Gong, W.; Mondal, P.K.; Ahmadi, S.; Wu, Y.; Rohani, S. Cocrystals, salts, and salt-solvates of olanzapine; selection of coformers and improved solubility. Int. J. Pharm. 2021, 608, 121063. [Google Scholar] [CrossRef] [PubMed]
- Alshehri, S.; Imam, S.S.; Hussain, A.; Altamimi, M.A.; Alruwaili, N.K.; Alotaibi, F.; Alanazi, A.; Shakeel, F. Potential of solid dispersions to enhance solubility, bioavailability, and therapeutic efficacy of poorly water-soluble drugs: Newer formulation techniques, current marketed scenario and patents. Drug Deliv. 2020, 27, 1625–1643. [Google Scholar] [CrossRef]
- Trollope, L.; Cruickshank, D.L.; Noonan, T.; Bourne, S.A.; Sorrenti, M.; Catenacci, L.; Caira, M.R. Inclusion of trans-resveratrol in methylated cyclodextrins: Synthesis and solid-state structures. Beilstein J. Org. Chem. 2014, 10, 3136–3151. [Google Scholar] [CrossRef]
- Ismail, A.; Kerdpol, K.; Rungrotmongkol, T.; Tananuwong, K.; Ueno, T.; Ekasit, S.; Muangsin, N.; Krusong, K. Solubility enhancement of poorly water soluble domperidone by complexation with the large ring cyclodextrin. Int. J. Pharm. 2021, 606, 120909. [Google Scholar] [CrossRef] [PubMed]
- McCormack, D.; McFadden, D. A review of pterostilbene antioxidant activity and disease modification. Oxidative Med. Cell. Longev. 2013, 2013, 1–15. [Google Scholar] [CrossRef] [Green Version]
- Poulose, S.M.; Thangthaeng, N.; Miller, M.; Shukitt-Hale, B. Effects of pterostilbene and resveratrol on brain and behavior. Neurochem. Int. 2015, 89, 227–233. [Google Scholar] [CrossRef]
- Gómez-Zorita, S.; Milton-Laskíbar, I.; Aguirre, L.; Fernández-Quintela, A.; Xiao, J.; Portillo, M.P. Effects of pterostilbene on diabetes, liver steatosis and serum lipids. Curr. Med. Chem. 2020, 28, 238–252. [Google Scholar] [CrossRef]
- De Morais, J.M.B.; Cruz, E.M.S.; da Rosa, C.V.D.; Cesário, R.C.; Comar, J.F.; Moreira, C.C.L.; Chuffa, L.G.D.A.; Seiva, F.R.F. Pterostilbene influences glycemia and lipidemia and enhances antioxidant status in the liver of rats that consumed sucrose solution. Life Sci. 2021, 269, 119048. [Google Scholar] [CrossRef] [PubMed]
- Lacerda, D.D.S.; Türck, P.; De Lima-Seolin, B.G.; Colombo, R.; Ortiz, V.D.; Bonetto, J.H.P.; Campos, C.; Bianchi, S.E.; Belló-Klein, A.; Bassani, V.; et al. Pterostilbene reduces oxidative stress, prevents hypertrophy and preserves systolic function of right ventricle incor pulmonalemodel. Br. J. Pharmacol. 2017, 174, 3302–3314. [Google Scholar] [CrossRef] [PubMed]
- Lin, W.-S.; Leland, J.V.; Ho, C.-T.; Pan, M.-H. Occurrence, Bioavailability, anti-inflammatory, and anticancer effects of pterostilbene. J. Agric. Food Chem. 2020, 68, 12788–12799. [Google Scholar] [CrossRef]
- Obrador, E.; Salvador-Palmer, R.; Jihad-Jebbar, A.; López-Blanch, R.; Dellinger, T.; Dellinger, R.; Estrela, J. Pterostilbene in cancer therapy. Antioxidants 2021, 10, 492. [Google Scholar] [CrossRef] [PubMed]
- Patel, M.; Hirlekar, R. Multicomponent cyclodextrin system for improvement of solubility and dissolution rate of poorly water soluble drug. Asian J. Pharm. Sci. 2019, 14, 104–115. [Google Scholar] [CrossRef] [PubMed]
- Pinho, E.; Grootveld, M.; Soares, G.; Henriques, M. Cyclodextrins as encapsulation agents for plant bioactive compounds. Carbohydr. Polym. 2014, 101, 121–135. [Google Scholar] [CrossRef] [Green Version]
- Jacob, S.; Nair, A.B. Cyclodextrin complexes: Perspective from drug delivery and formulation. Drug Dev. Res. 2018, 79, 201–217. [Google Scholar] [CrossRef]
- Rassu, G.; Sorrenti, M.; Catenacci, L.; Pavan, B.; Ferraro, L.; Gavini, E.; Bonferoni, M.; Giunchedi, P.; Dalpiaz, A. Versatile nasal application of cyclodextrins: Excipients and/or actives? Pharmaceutics 2021, 13, 1180. [Google Scholar] [CrossRef]
- Groom, C.R.; Bruno, I.J.; Lightfoot, M.P.; Ward, S.C. The Cambridge structural database. Acta Crystallogr. Sect. B Struct. Sci. Cryst. Eng. Mater. 2016, 72, 171–179. [Google Scholar] [CrossRef]
- Saokham, P.; Muankaew, C.; Jansook, P.; Loftsson, T. Solubility of cyclodextrins and drug/cyclodextrin complexes. Molecules 2018, 23, 1161. [Google Scholar] [CrossRef] [PubMed] [Green Version]
- Tablet, C.; Matei, I.; Hillebrand, M. The Determination of the Stoichiometry of Cyclodextrin Inclusion Complexes by Spectral Methods: Possibilities and Limitations. In Stoichiometry and Research—The Importance of Quantity in Biomedicine; InTech Open: Rijeka, Croatia, 2013; Volume 44, pp. 47–76. [Google Scholar] [CrossRef]
- Council of Europe. European Pharmacopoeia, 10th ed.; Council of Europe: Strasbourg, France, 2019. [Google Scholar]
- Crystal data for 2(β-CD)∙2(PTB)∙23.2H2O: 2(C42H70O35)∙2(C16H16O3)∙23.2H2O, M = 3200.49, colourless plate, 0.210 × 0.180 × 0.100 mm3, monoclinic, space group C2 (No. 5), a = 19.484(3), b = 24.244(4), c = 16.674(3) Å, β =103.044(3)°, V = 7673(2) Å3, Z = 2, Dc= 1.385 g cm-3, F000 = 3416, Bruker Apex Duo diffractometer, MoKα radiation, λ = 0.71073 Å, T = 100(2) K, 2 θmax = 51.4°, 40393 reflections collected, 14322 unique (Rint = 0.0576). Final GooF = 1.034, R1 = 0.0986, wR2 = 0.2537, R indices based on 9788 reflections with I > 2 σ(I) (refinement on F2), 871 parameters, 22 restraints. Lp and absorption corrections applied, m = 0.122 mm-1. CCDC number: 2123743.
- Higuchi, T.; Connors, K.A. Phase solubility techniques. Adv. Anal. Chem. Instrum. 1965, 4, 117–212. [Google Scholar]
- Mahesh, M.; Subbaraju, G.V.; Ivanisevic, I.; Andres, M.; Stephens, K. Solid forms of Pterostilbene. International Patent WO 2010/141107 A1, 27 January 2010. [Google Scholar]
- Bofill, L.; de Sande, D.; Barbas, R.; Prohens, R. Hydrogen bond polarization overcomes unfavorable packing in the most stable high Z′ polymorph of pterostilbene. Cryst. Growth Des. 2019, 19, 2552–2556. [Google Scholar] [CrossRef]
- Lacerda, D.S.; Bianchi, S.E.; Pinós, W.L.; Campos-Carraro, C.; Türck, P.; Hickmann, A.R.; Pittol, V.; Teixeira, R.B.; Belló-Klein, A.; Bassani, V.; et al. Effect of pterostilbene complexed with cyclodextrin on rat liver: Potential reduction of oxidative damage and modulation redox-sensitive proteins. Med. Chem. Res. 2018, 27, 2265–2278. [Google Scholar] [CrossRef]
- Spek, A.L. PLATON SQUEEZE: A tool for the calculation of the disordered solvent contribution to the calculated structure factors. Acta Crystallogr. Sect. C Struct. Chem. 2015, 71, 9–18. [Google Scholar] [CrossRef] [PubMed] [Green Version]
- Caira, M.R. On the isostructurality of cyclodextrin inclusion complexes and its practical utility. Rev. Roum. Chim. 2001, 46, 371–386. [Google Scholar]


Publisher’s Note: MDPI stays neutral with regard to jurisdictional claims in published maps and institutional affiliations. |
© 2021 by the authors. Licensee MDPI, Basel, Switzerland. This article is an open access article distributed under the terms and conditions of the Creative Commons Attribution (CC BY) license (https://creativecommons.org/licenses/by/4.0/).
Share and Cite
Catenacci, L.; Vicatos, A.I.; Sorrenti, M.; Bonferoni, M.C.; Caira, M.R. Native Cyclodextrins as Complexation Agents for Pterostilbene: Complex Preparation and Characterization in Solution and in the Solid State. Pharmaceutics 2022, 14, 8. https://doi.org/10.3390/pharmaceutics14010008
Catenacci L, Vicatos AI, Sorrenti M, Bonferoni MC, Caira MR. Native Cyclodextrins as Complexation Agents for Pterostilbene: Complex Preparation and Characterization in Solution and in the Solid State. Pharmaceutics. 2022; 14(1):8. https://doi.org/10.3390/pharmaceutics14010008
Chicago/Turabian StyleCatenacci, Laura, Alexios I. Vicatos, Milena Sorrenti, Maria Cristina Bonferoni, and Mino R. Caira. 2022. "Native Cyclodextrins as Complexation Agents for Pterostilbene: Complex Preparation and Characterization in Solution and in the Solid State" Pharmaceutics 14, no. 1: 8. https://doi.org/10.3390/pharmaceutics14010008
APA StyleCatenacci, L., Vicatos, A. I., Sorrenti, M., Bonferoni, M. C., & Caira, M. R. (2022). Native Cyclodextrins as Complexation Agents for Pterostilbene: Complex Preparation and Characterization in Solution and in the Solid State. Pharmaceutics, 14(1), 8. https://doi.org/10.3390/pharmaceutics14010008