
Determining the Anticancer Activity of Sphingosine Kinase Inhibitors Containing Heteroatoms in Their Tail Structure

 , ,
, ,  , and
, and
Abstract
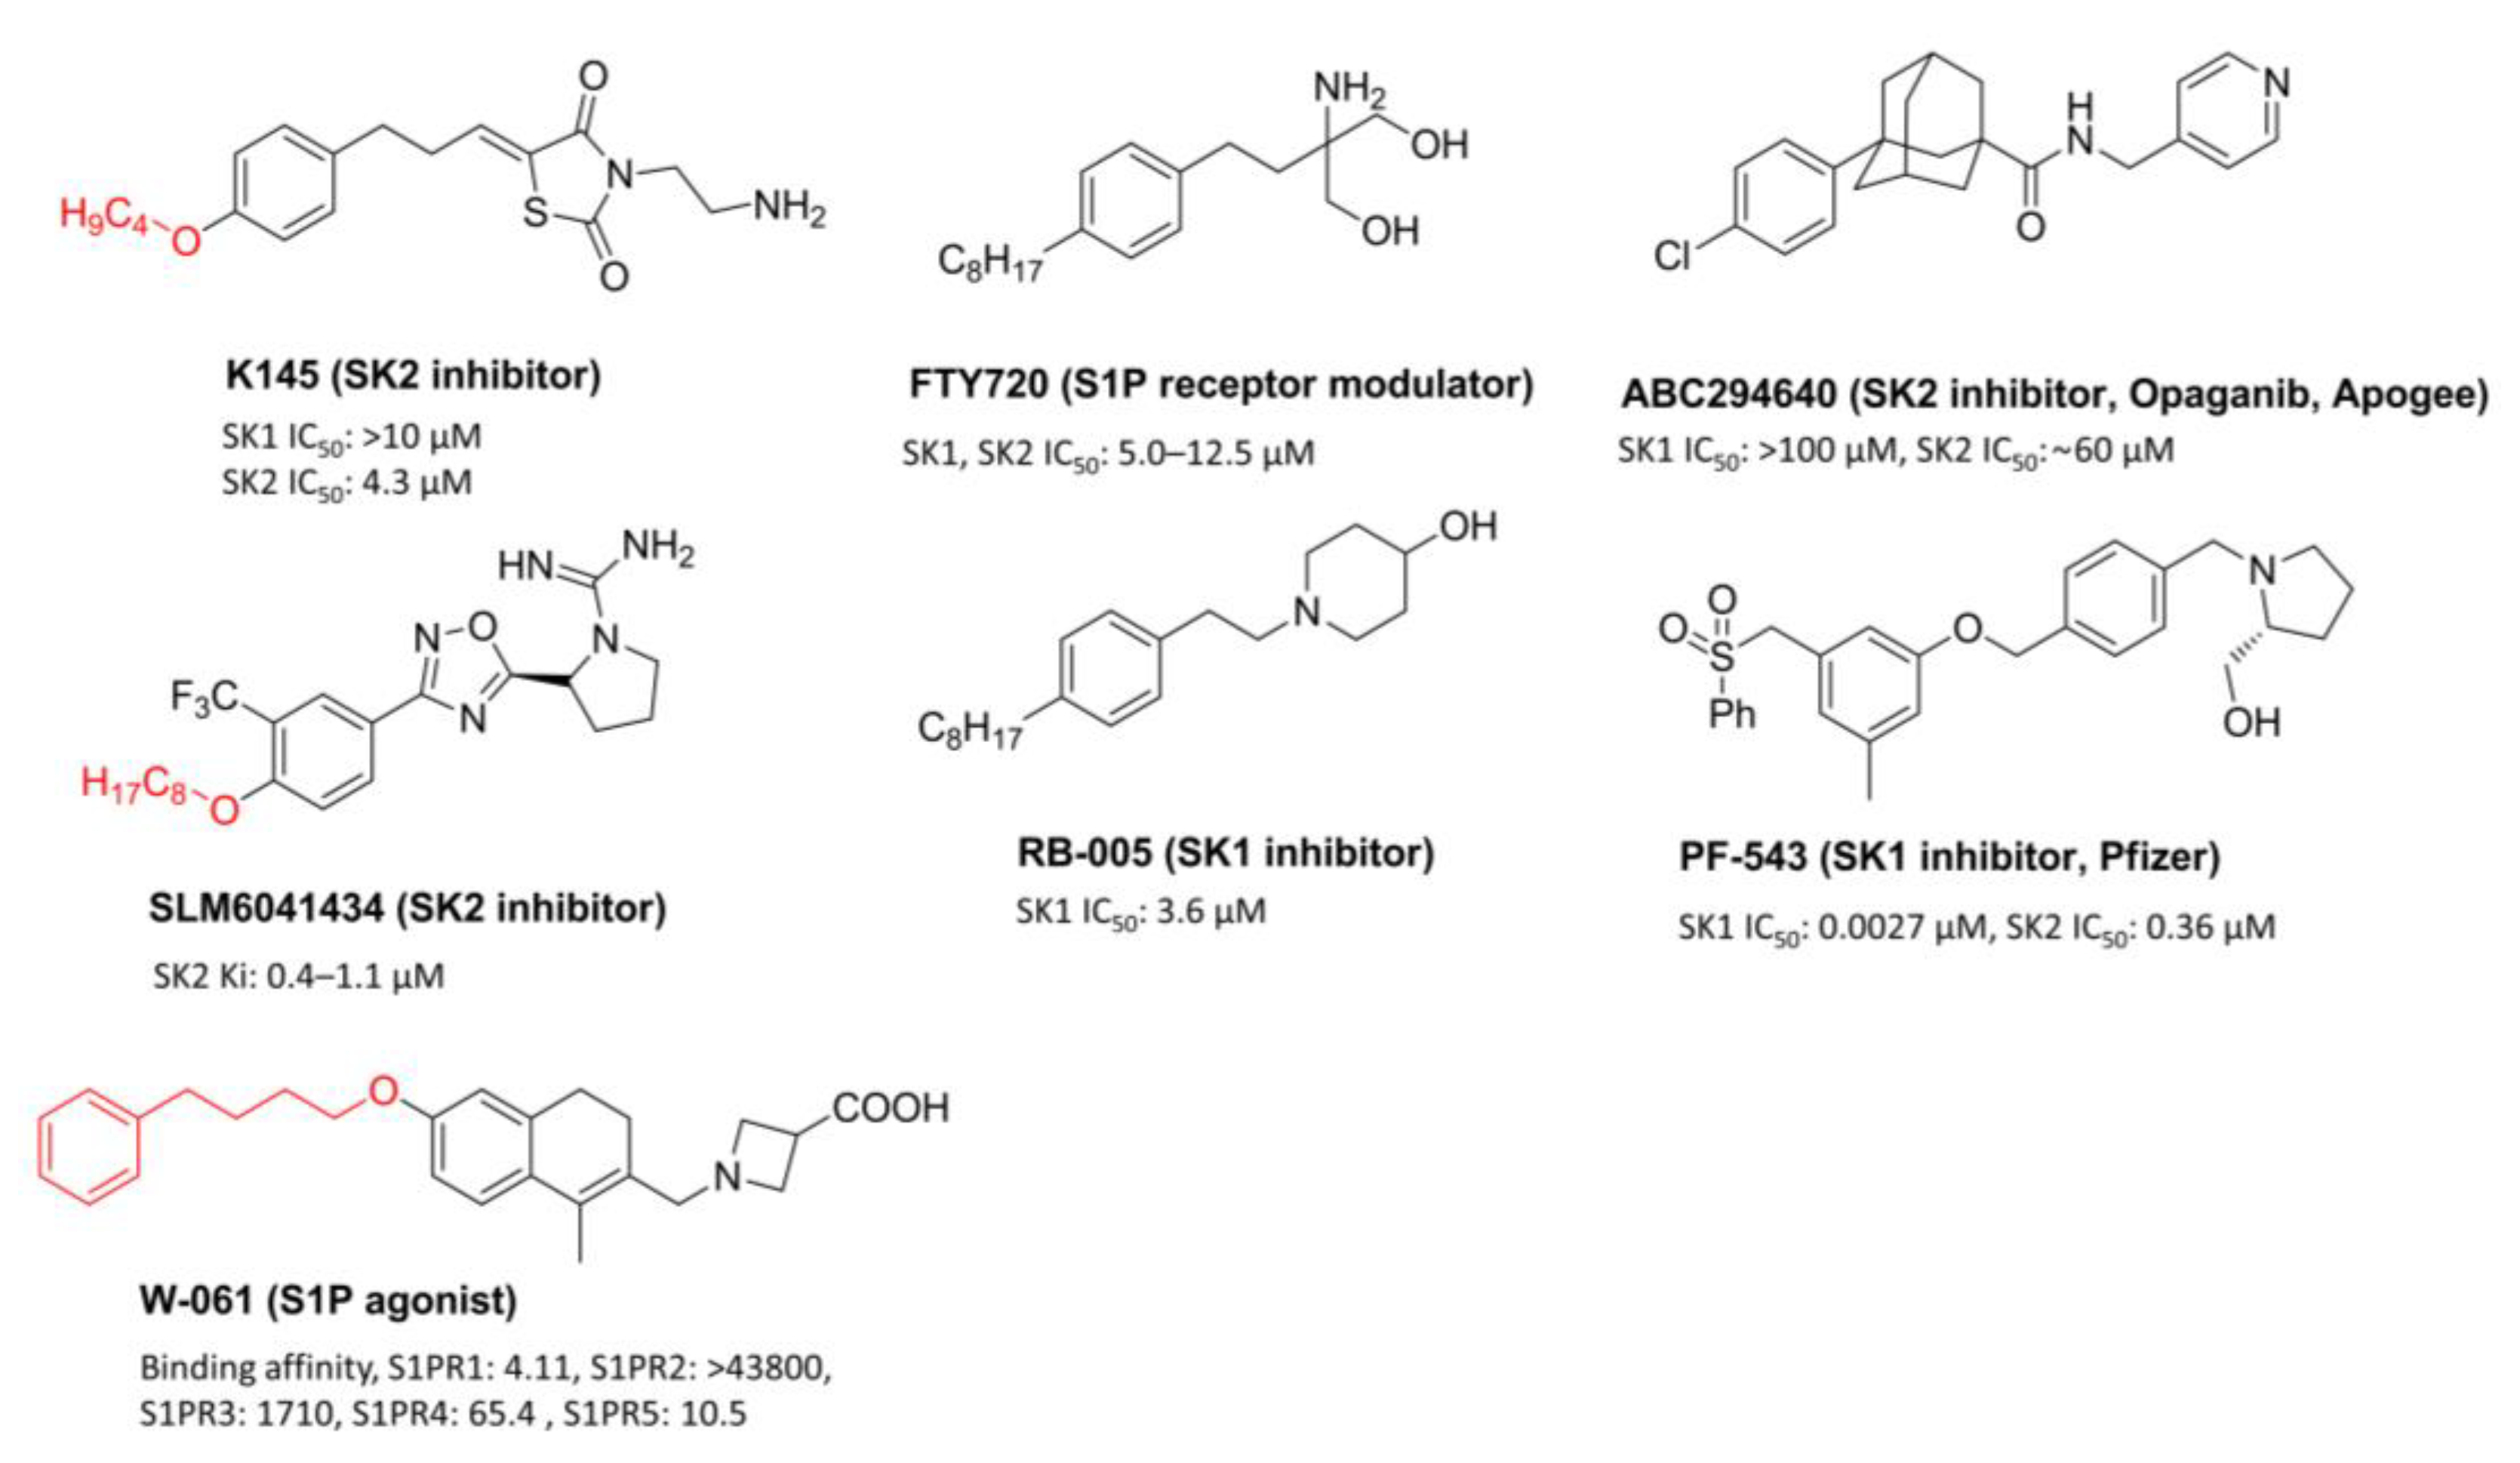
:1. Introduction
2. Materials and Methods
2.1. Chemistry
2.1.1. Synthesis in General
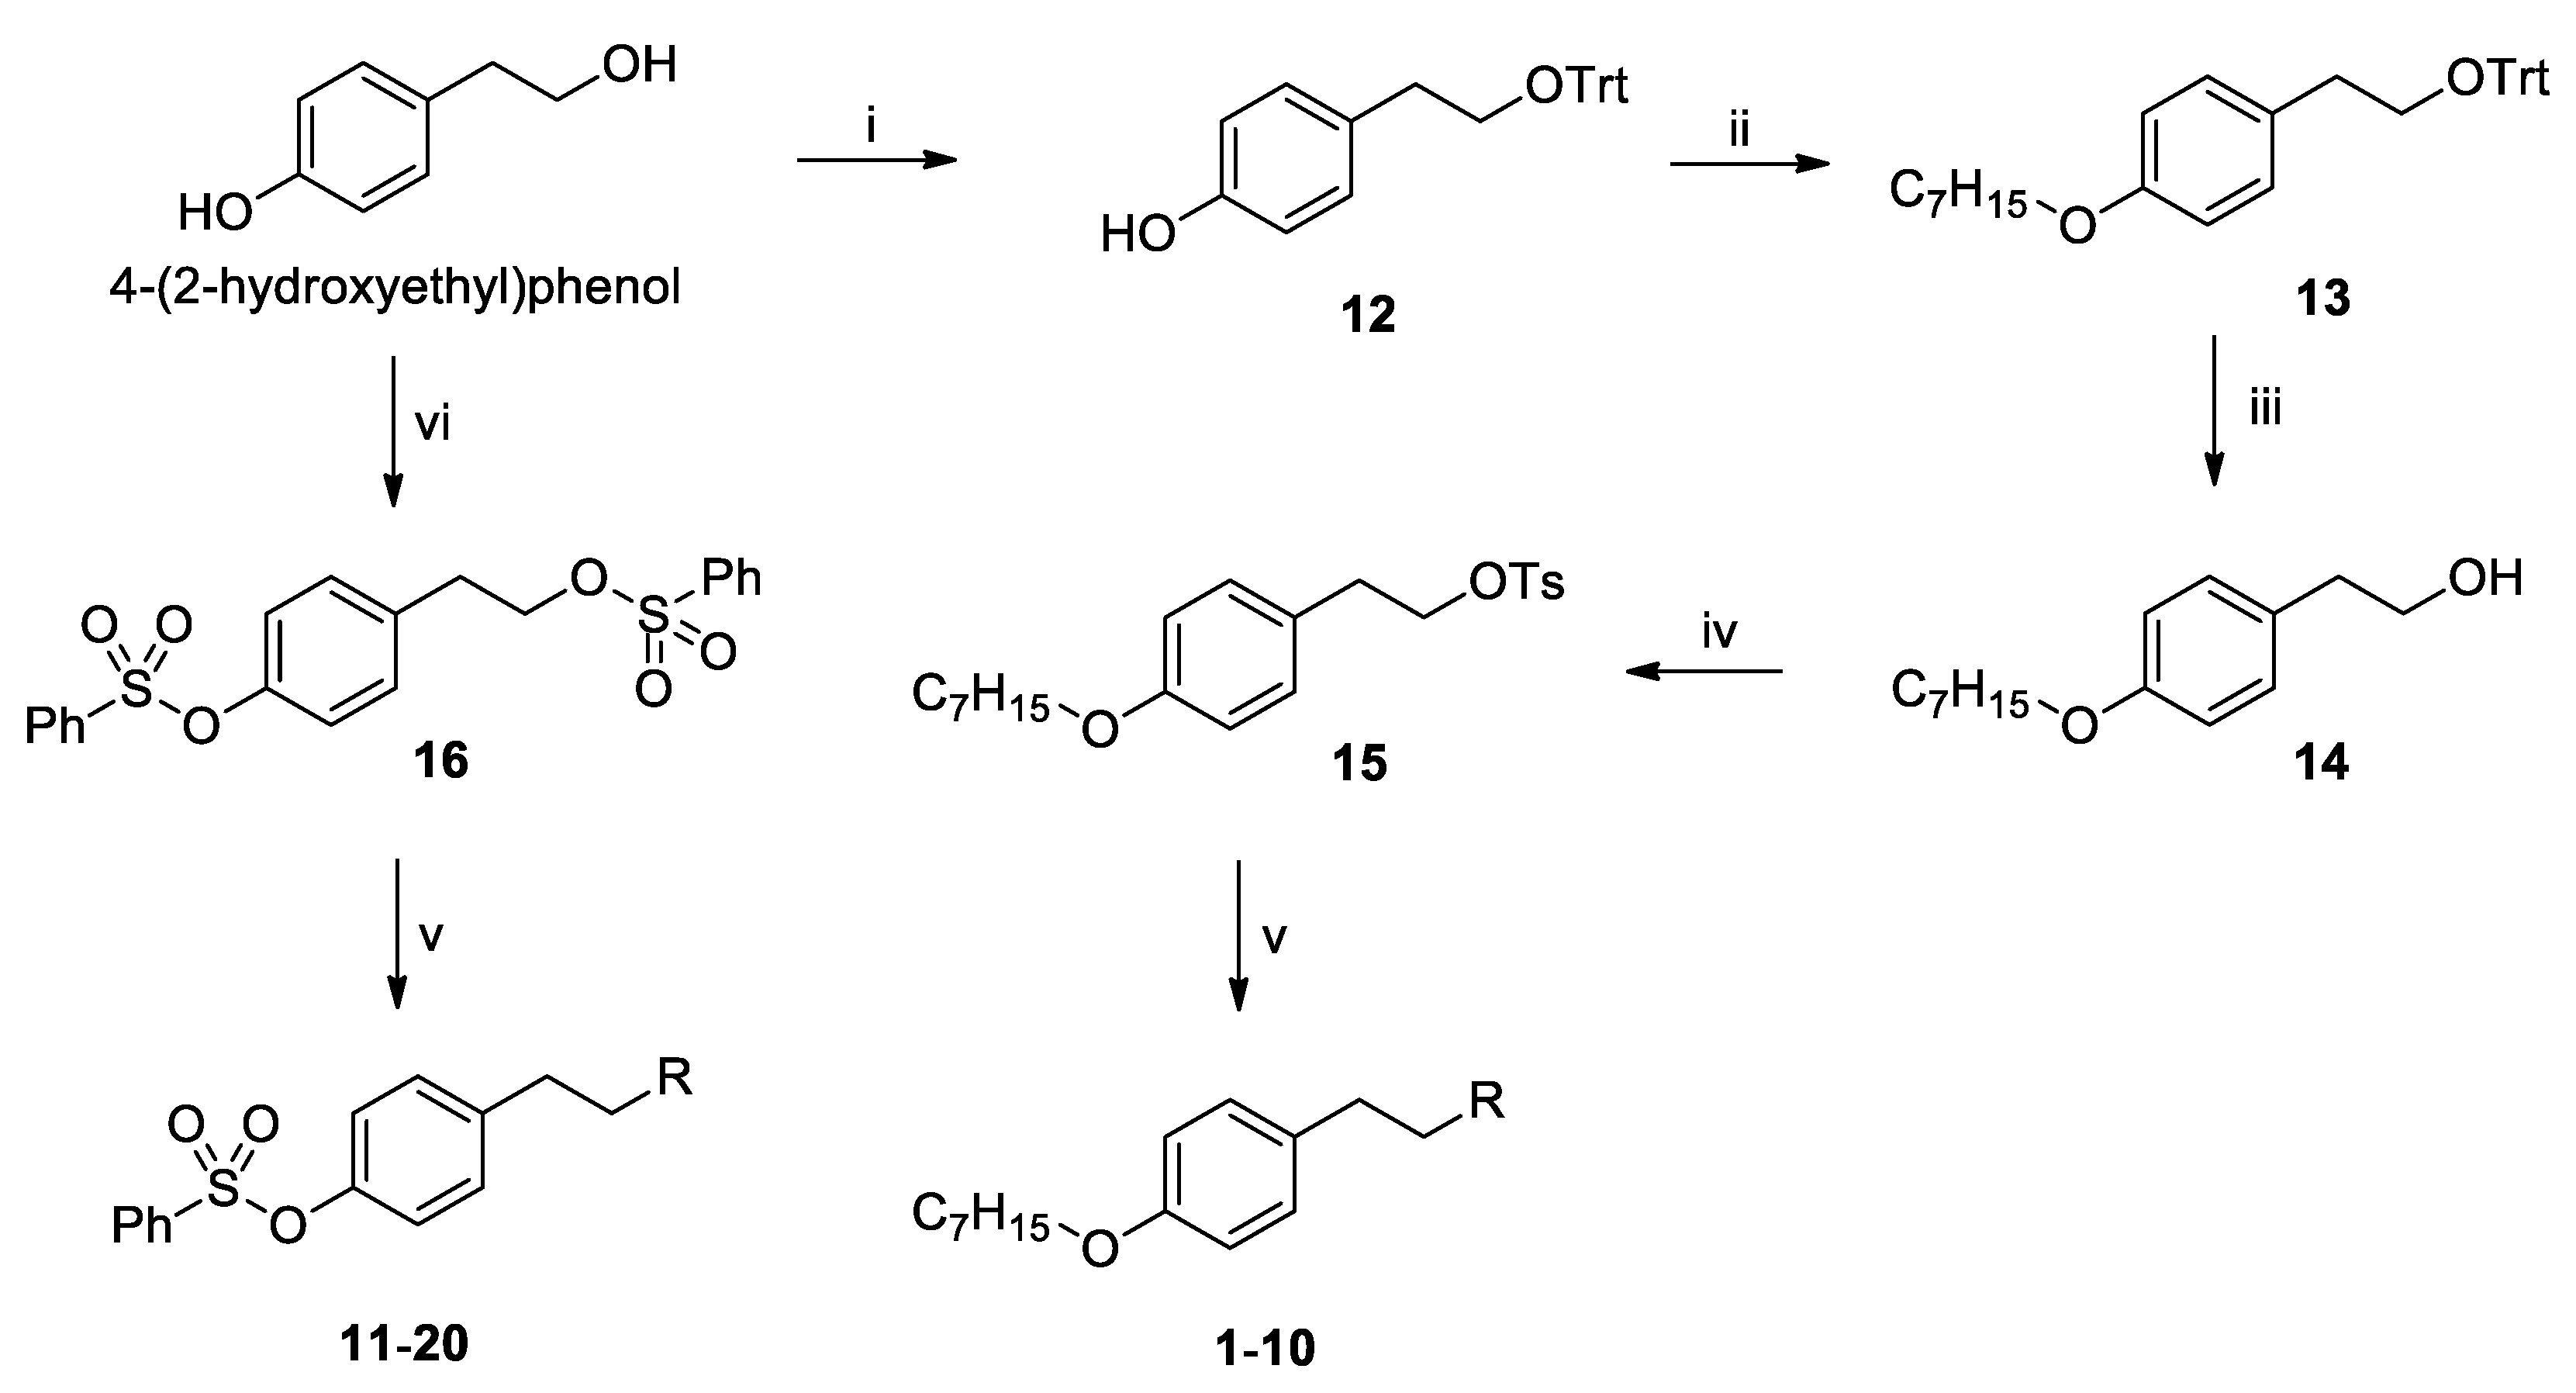
2.1.2. Chemical Synthesis (12–16)
4-(2-(Trityloxy)ethyl)phenol (12)
(4-(Heptyloxy)phenethoxy)methanetriyl)tribenzene (13)
4-(Heptyloxy)phenethyl 4-methylbenzenesulfonate (15)
4-(2-((Phenylsulfonyl)oxy)ethyl)phenyl benzenesulfonate (16)
2.1.3. Synthesis of Compounds 1–20
2.2. Biology
2.2.1. Chemicals and Reagents
2.2.2. Cell Culture and MTT Cell Viability Assay
2.2.3. Clonogenic Assay
2.2.4. Annexin V-FITC Staining
2.2.5. Mitochondrial Outer Membrane Potential (MOMP) Determination by JC-10 Staining
2.2.6. Western Blotting
2.2.7. SK Activity Assay
2.2.8. S1P, Sphingosine and Ceramide ELISA
2.2.9. PP2A Assay
2.2.10. Inhibition of CYP Enzymes Activity by FTY720, PF-543, and Compound 10
2.2.11. In Vitro Metabolic Stability of Compound 10, FTY720 and PF-543
2.2.12. Statistical Analysis
3. Results
3.1. Chemistry
3.2. Biological Evaluations
3.2.1. Cytotoxic Effects of Compounds 1–10 in Human Colon Cancer Cells
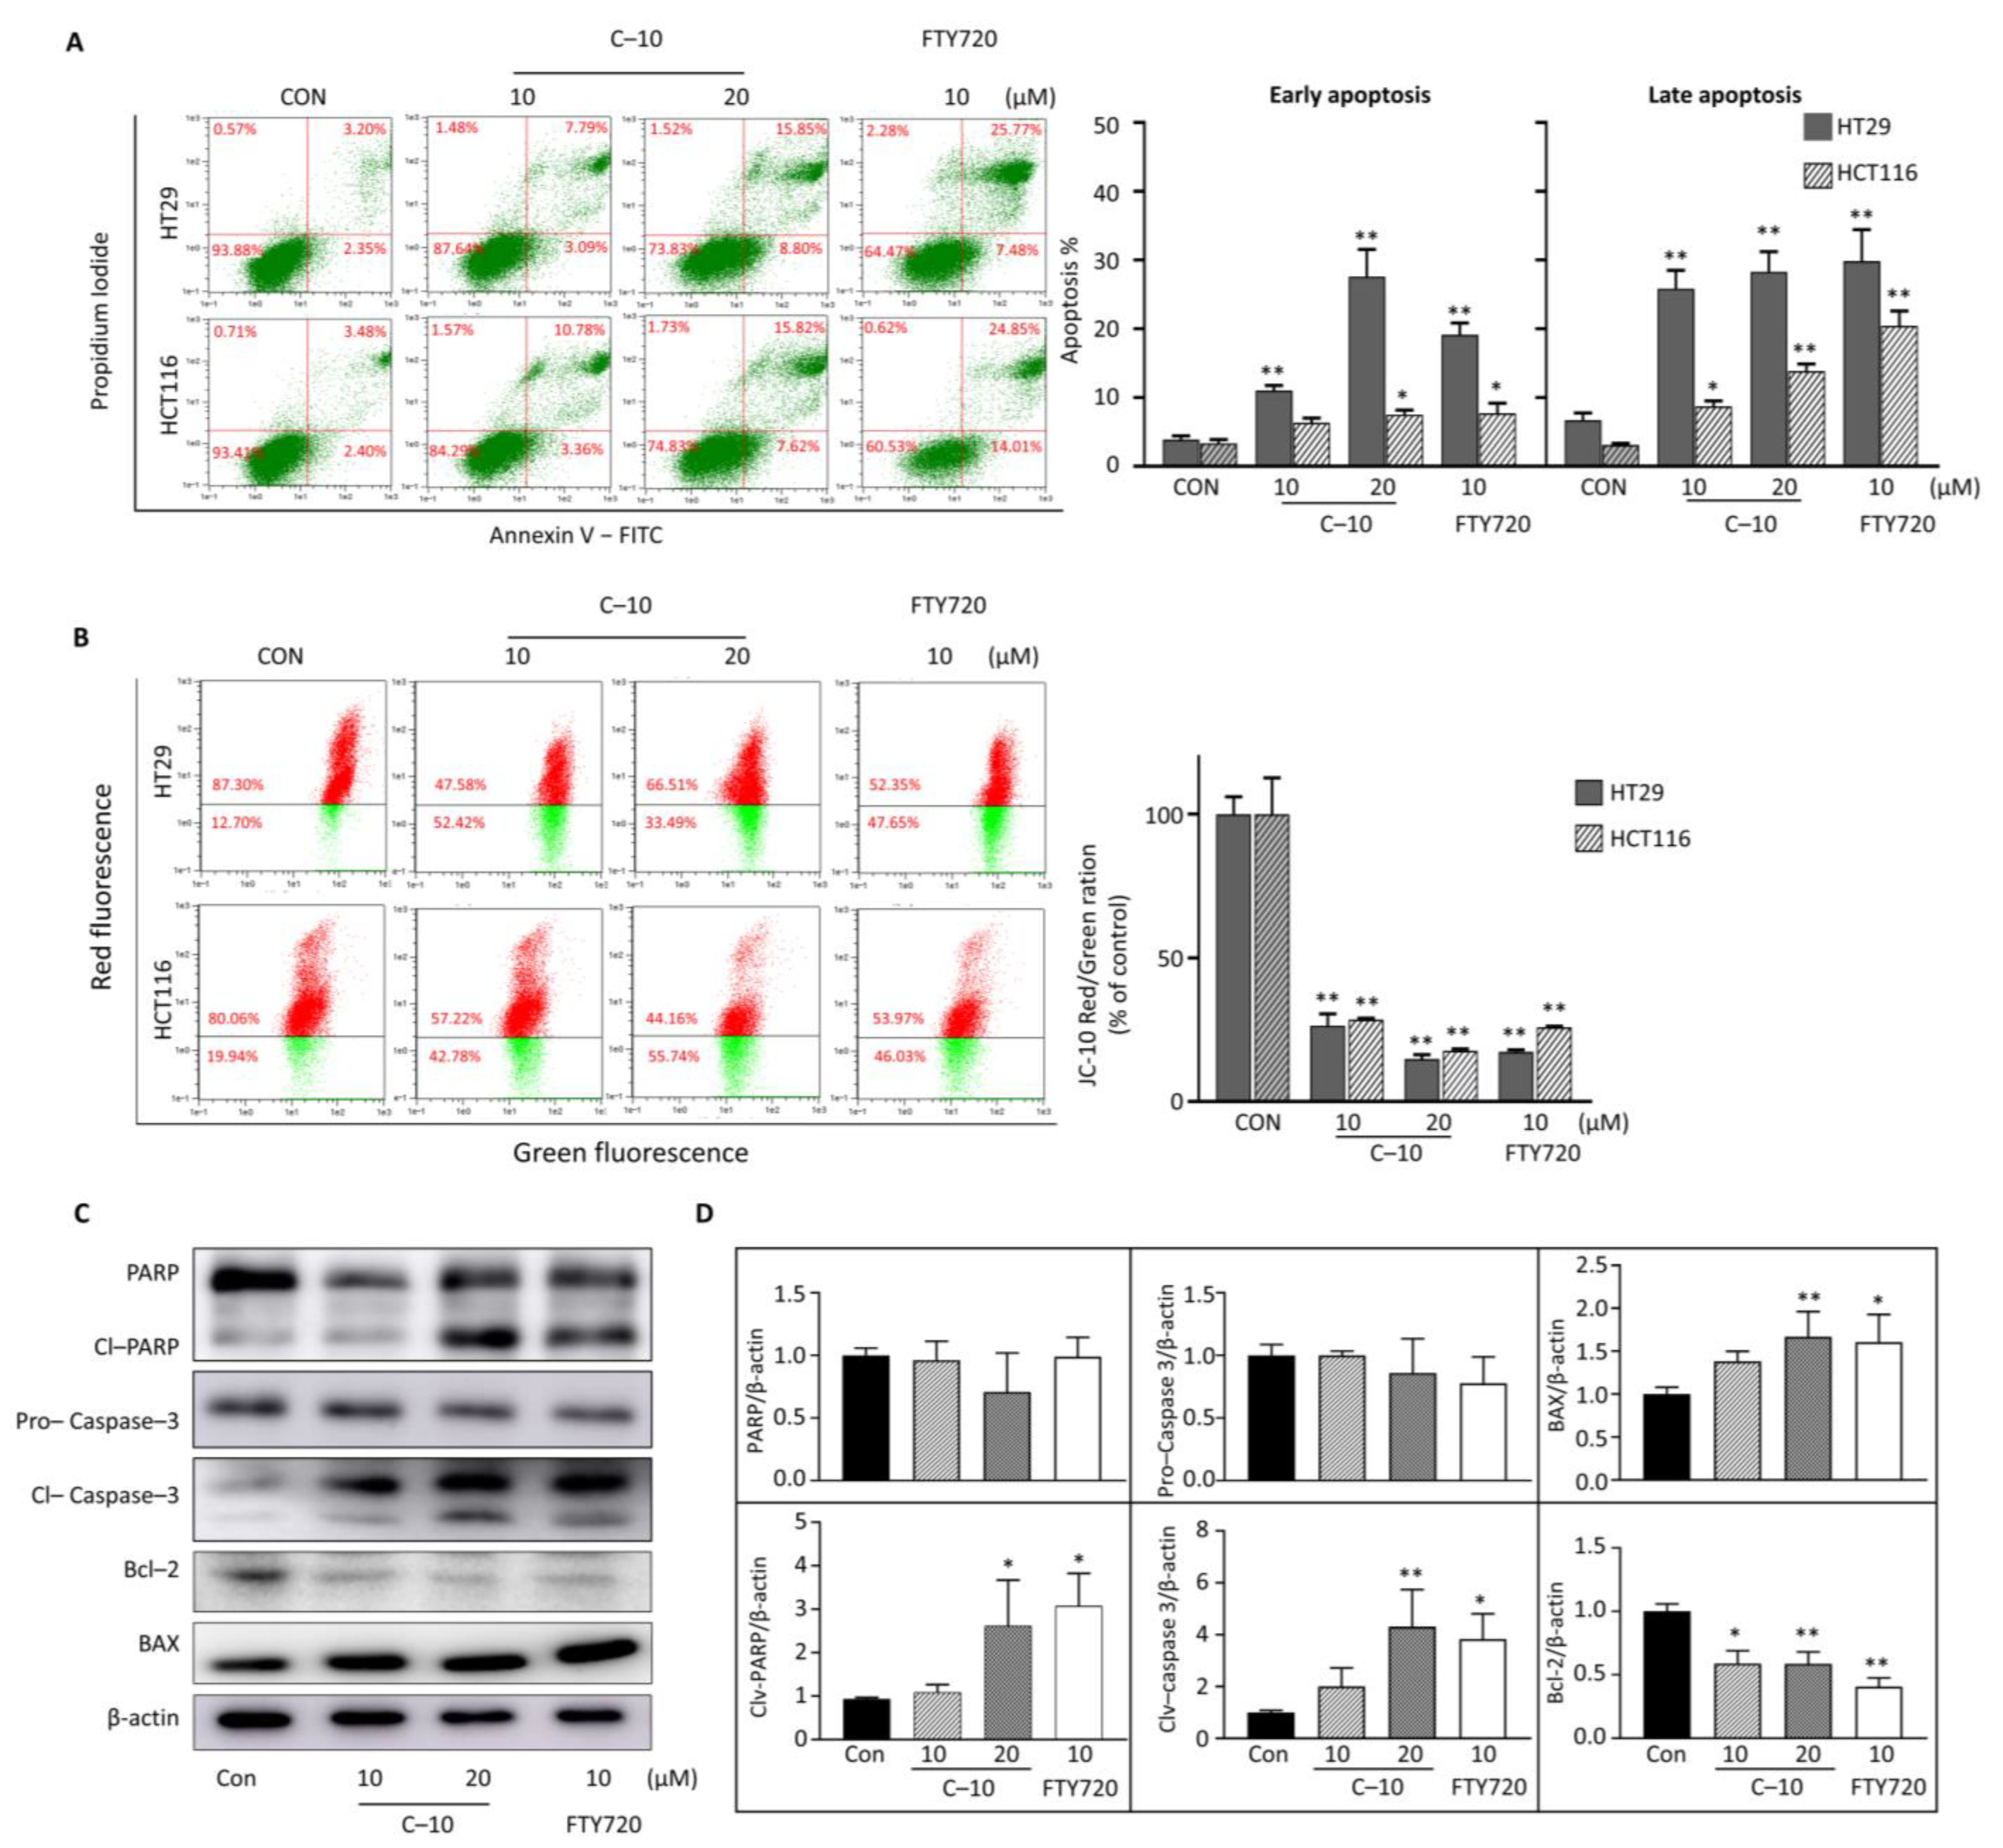
3.2.2. Compound 10 Induced Apoptosis of Colorectal Cancer Cells through the Intrinsic Mitochondrial Pathway
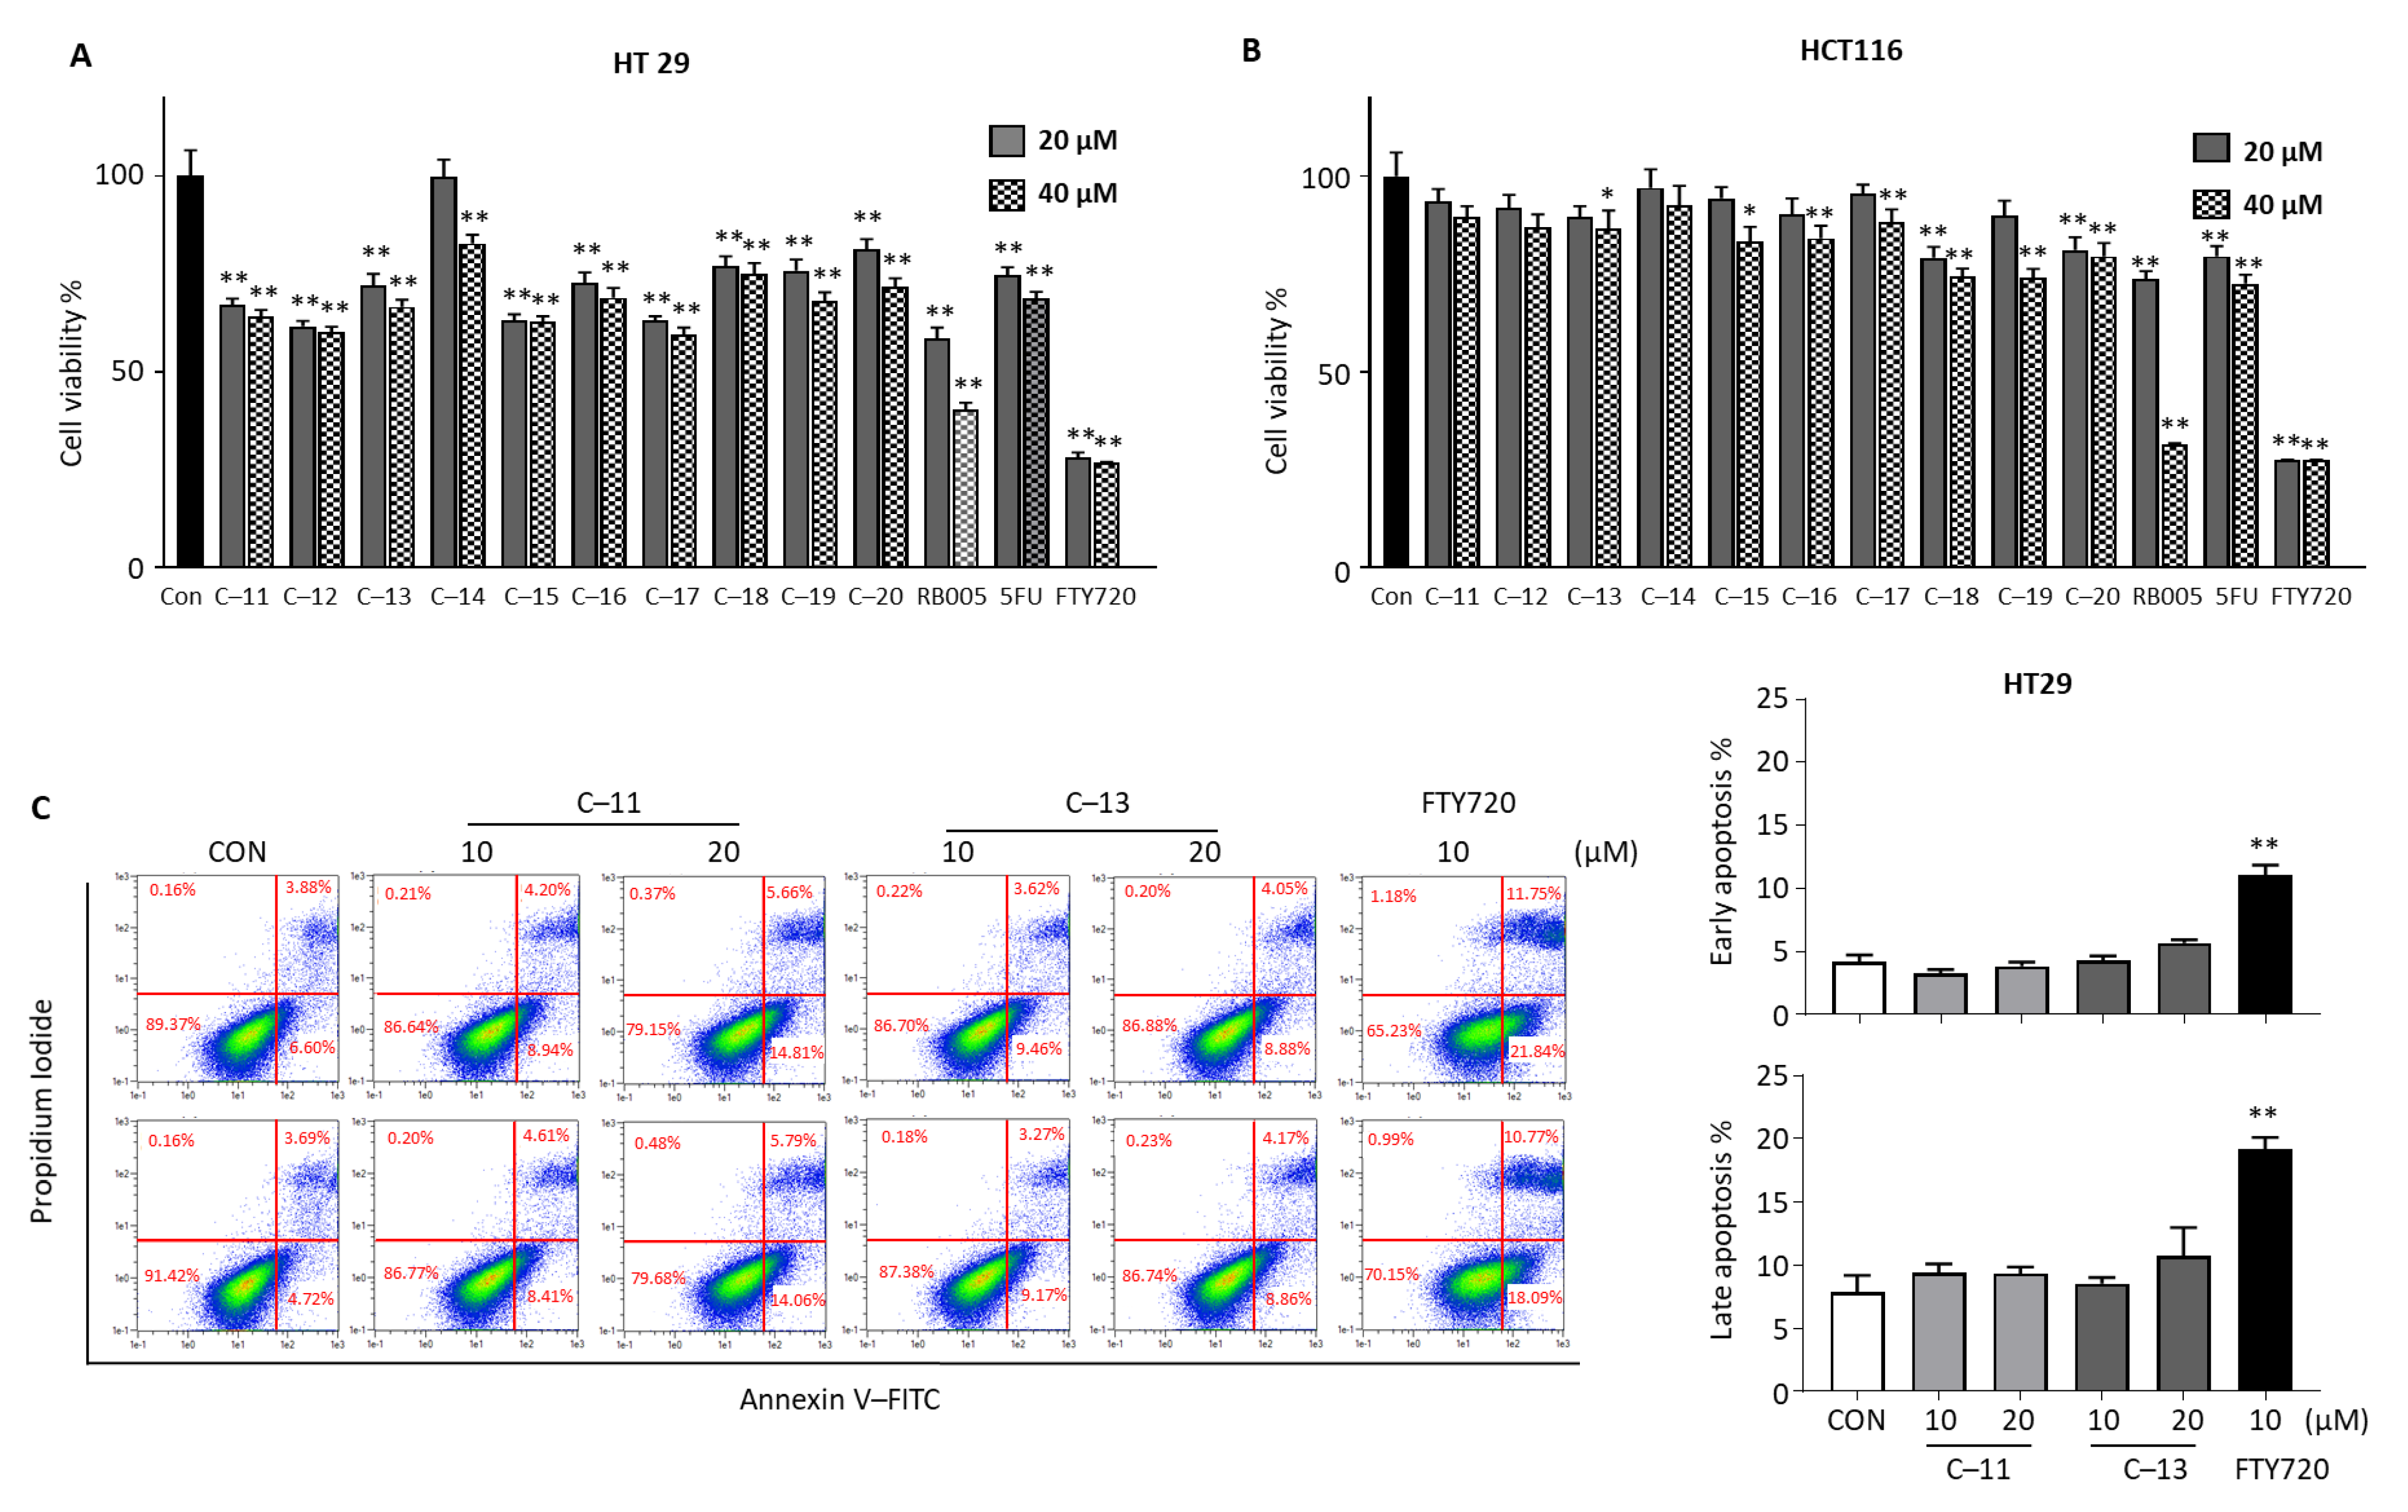
3.2.3. Cytotoxic Effects of Compounds 11–20 in Colorectal Cancer Cells
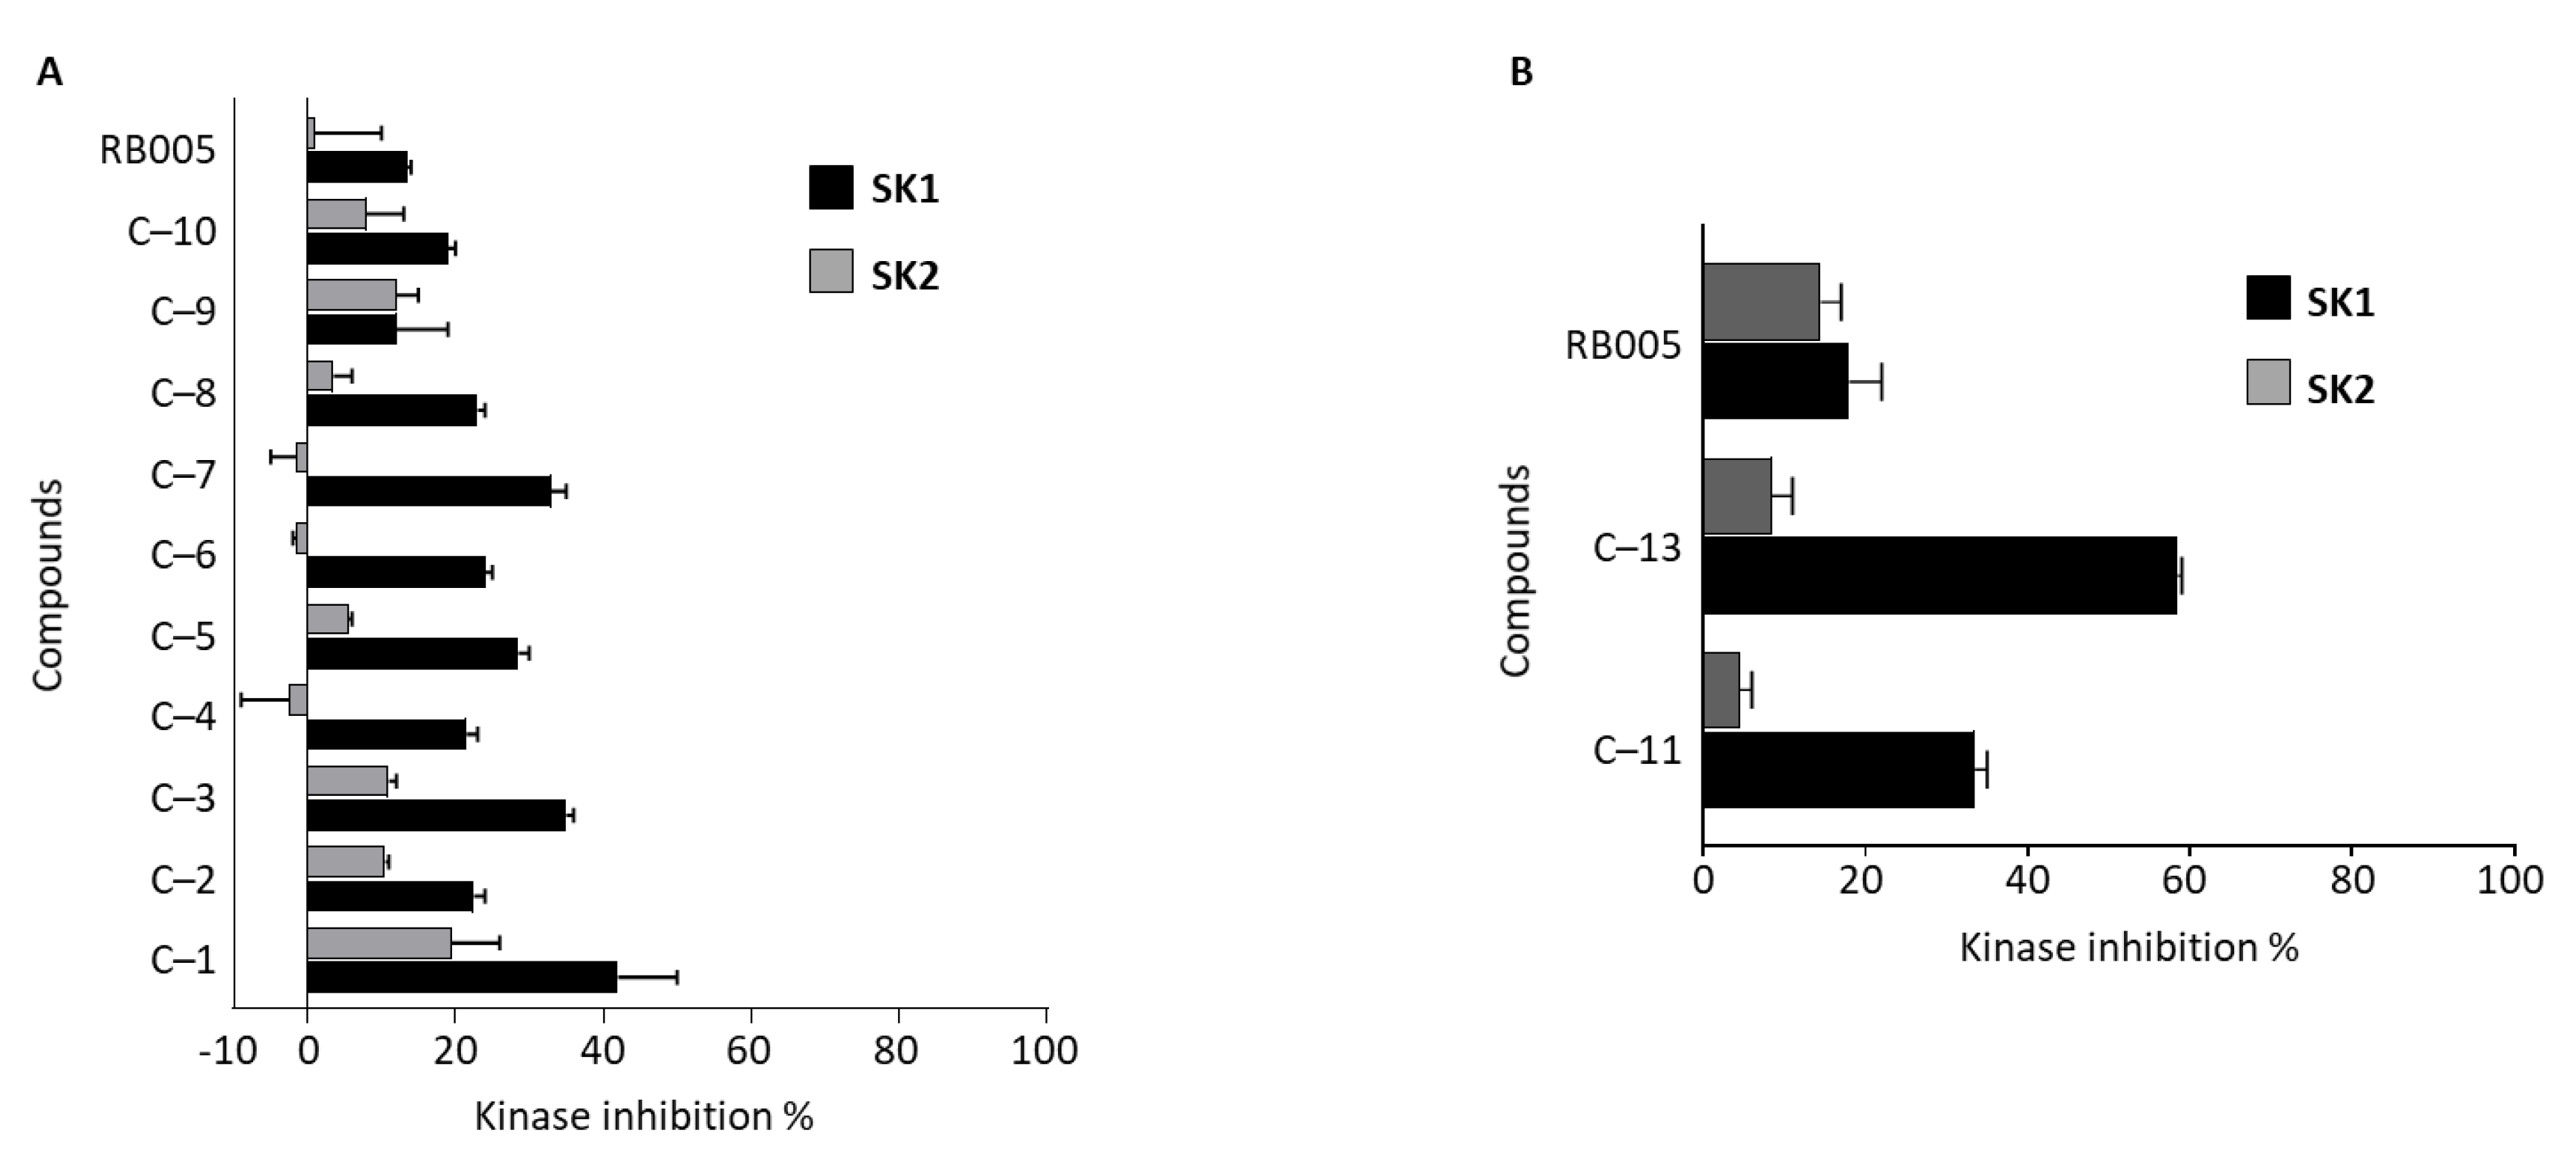
3.2.4. SK 1/2 Assay of Compounds
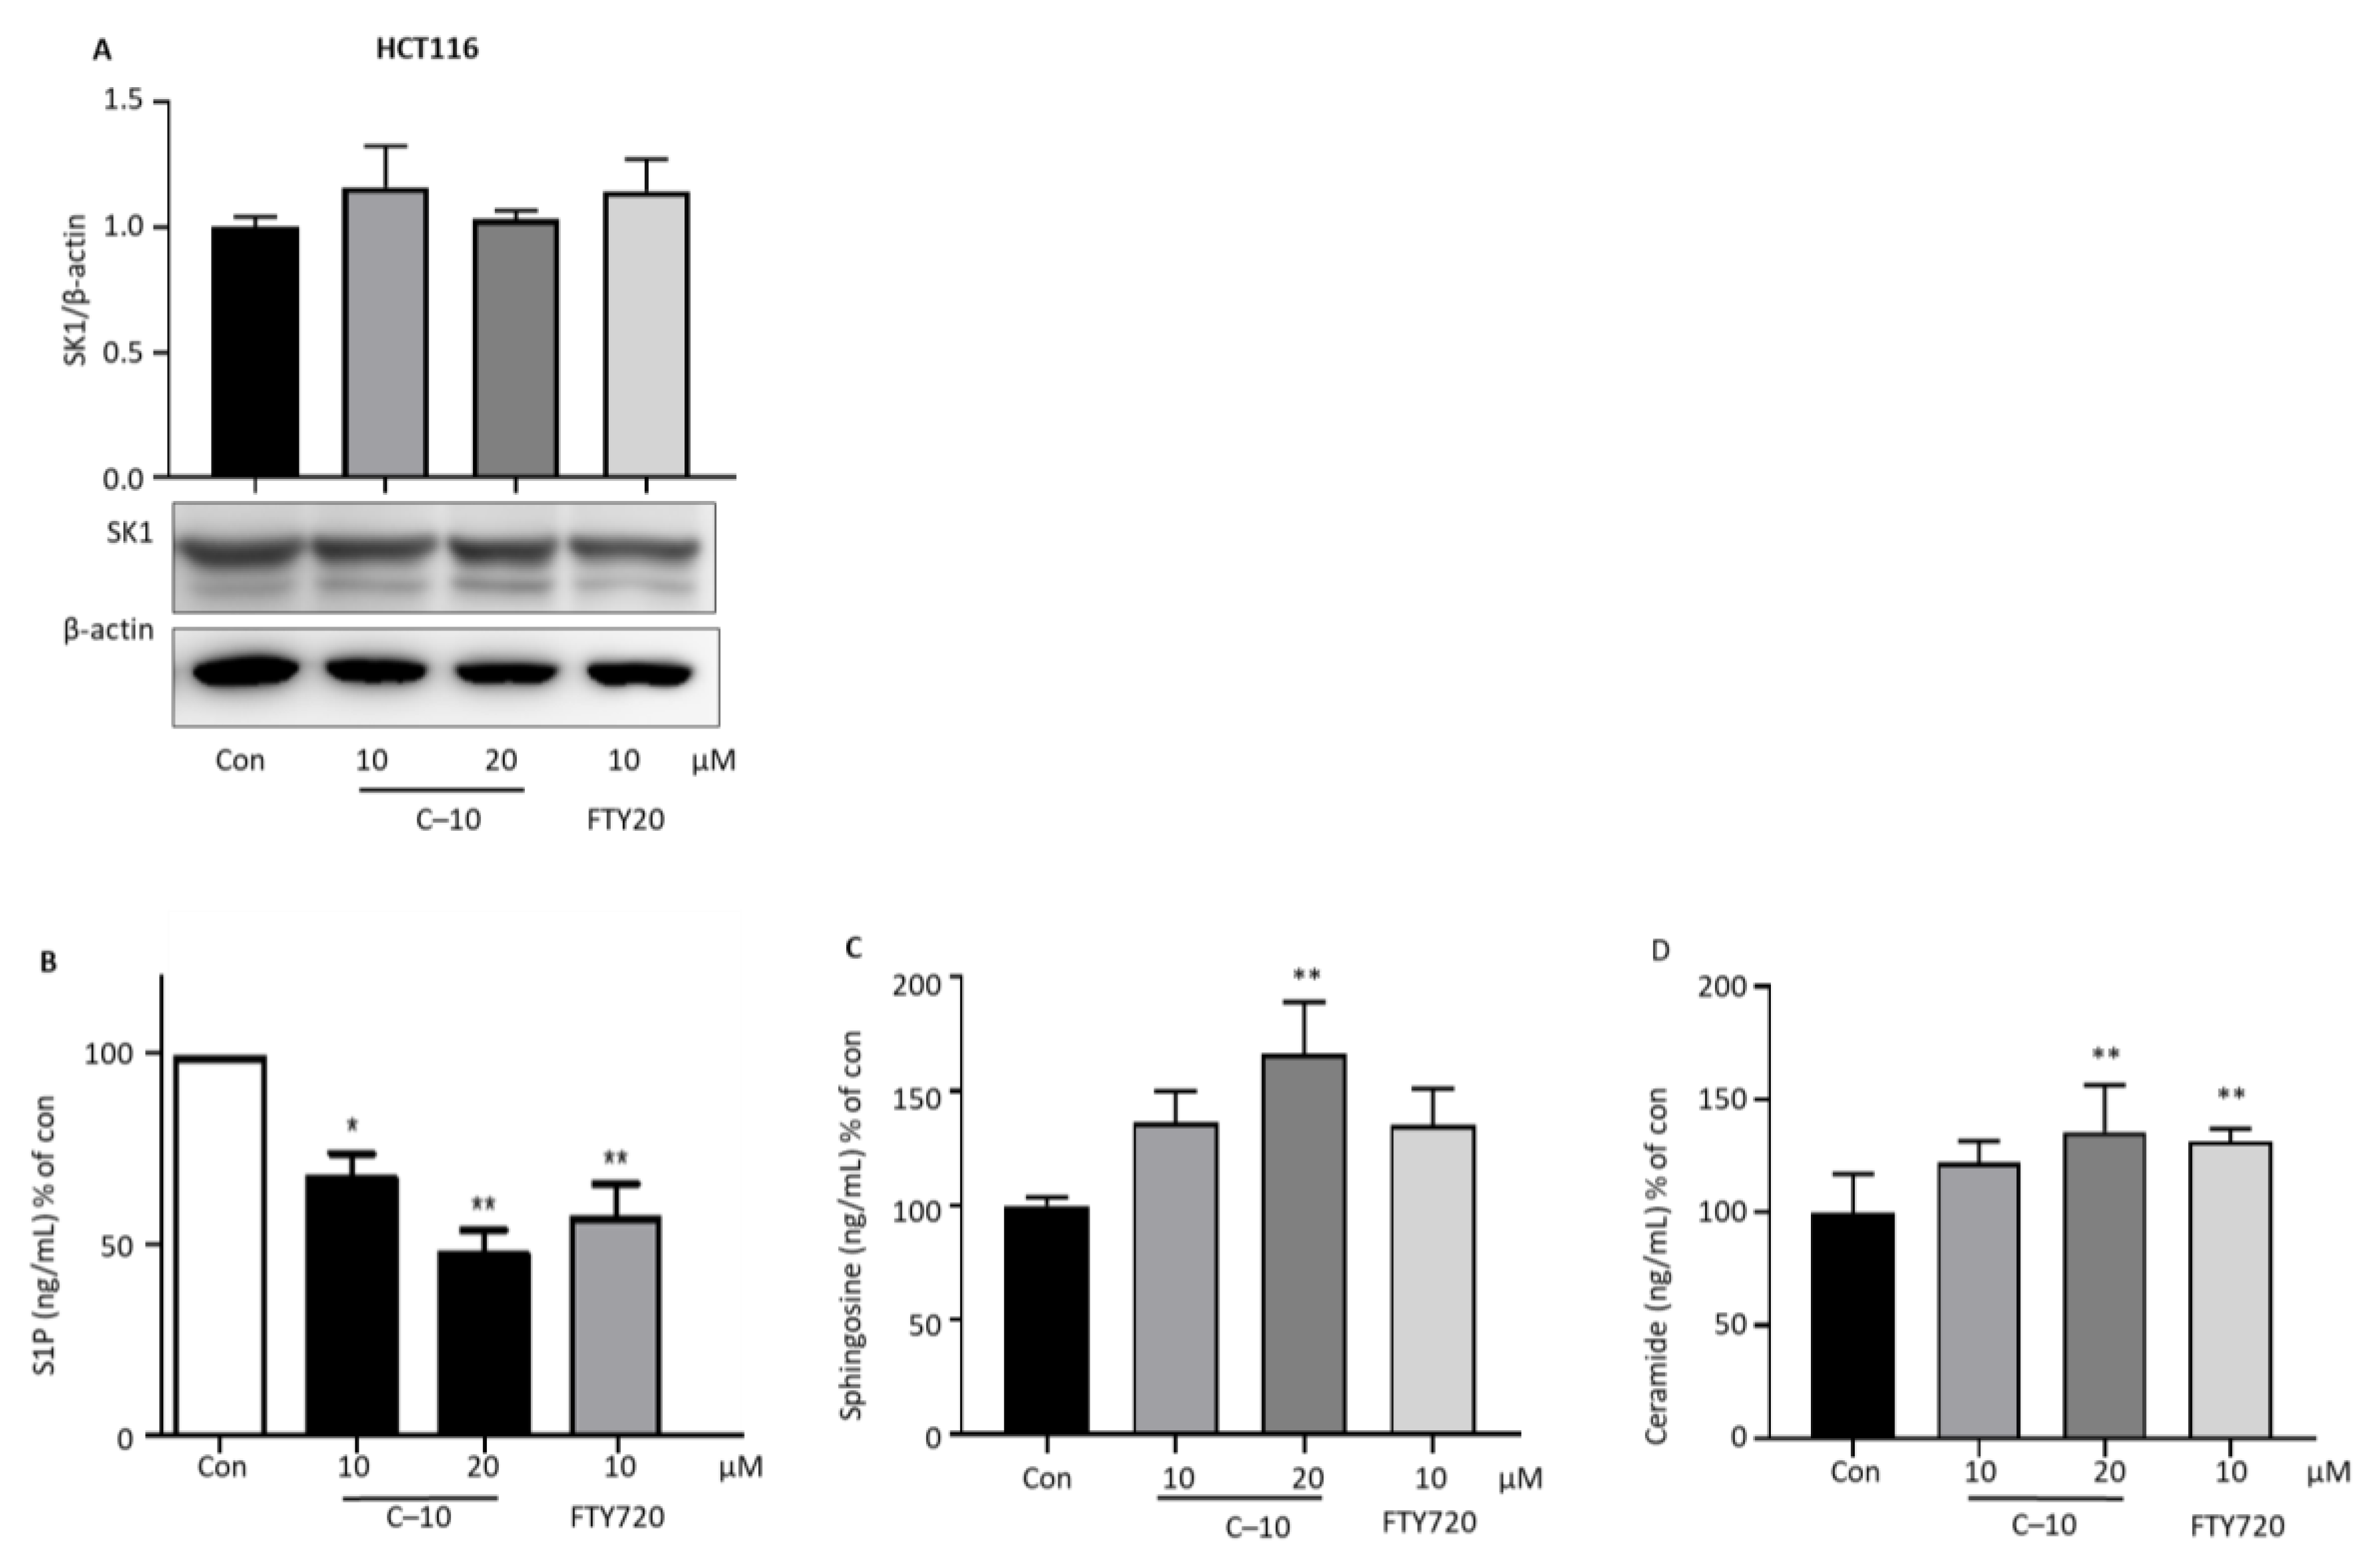
3.2.5. Compound 10 Inhibits Intracellular S1P Production and Increases Proapoptotic Sphingolipids
3.2.6. PP2A Activation Is an Additional Pathway Followed by Compound 10 for Advanced Anticancer Effect
3.2.7. Inhibition of CYP Coenzyme Activity and Metabolic Stability by Compound 10, FTY720, and PF-543
4. Discussion
5. Conclusions
Supplementary Materials
Author Contributions
Funding
Conflicts of Interest
References
- Kohama, T.; Olivera, A.; Edsall, L.; Nagiec, M.M.; Dickson, R.; Spiegel, S. Molecular cloning and functional characterization of murine sphingosine kinase. J. Bio. Chem. 1998, 273, 23722–23728. [Google Scholar] [CrossRef] [Green Version]
- Wang, P.; Yuan, Y.; Lin, W.; Zhong, H.; Xu, K.; Qi, X. Roles of sphingosine-1-phosphate signaling in cancer. Cancer Cell Int. 2019, 19, 295. [Google Scholar] [CrossRef]
- Neubauer, H.A.; Pham, D.H.; Zebol, J.R.; Moretti, P.A.; Peterson, A.L.; Leclercq, T.M.; Chan, H.; Powell, J.A.; Pitman, M.R.; Samuel, M.S.; et al. An oncogenic role for sphingosine kinase 2. Oncotarget 2016, 7, 64886–64899. [Google Scholar] [CrossRef]
- Wang, X.; Sun, Y.; Peng, X.; Naqvi, S.M.A.S.; Yang, Y.; Zhang, J.; Chen, M.; Chen, Y.; Chen, H.; Yan, H.; et al. The Tumorigenic Effect of Sphingosine Kinase 1 and Its Potential Therapeutic Target. Cancer Control 2020, 27, 1073274820976664. [Google Scholar] [CrossRef]
- French, K.J.; Schrecengost, R.S.; Lee, B.D.; Zhuang, Y.; Smith, S.N.; Eberly, J.L.; Yun, J.K.; Smith, C.D. Discovery and evaluation of inhibitors of human sphingosine kinase. Cancer Res. 2003, 63, 5962–5969. [Google Scholar] [PubMed]
- Guan, H.; Liu, L.; Cai, J.; Liu, J.; Ye, C.; Li, M.; Li, Y. Sphingosine kinase 1 is overexpressed and promotes proliferation in human thyroid cancer. Mol. Endocrinol. 2011, 25, 1858–1866. [Google Scholar] [CrossRef] [Green Version]
- Shrestha, J.; Ki, S.H.; Shin, S.M.; Kim, S.W.; Lee, J.-Y.; Jun, H.-S.; Lee, T.; Kim, S.; Baek, D.J.; Park, E.-Y. Synthesis of novel FTY720 analogs with anticancer activity through PP2A activation. Molecules 2018, 23, 2750. [Google Scholar] [CrossRef] [PubMed] [Green Version]
- Britten, C.D.; Garrett-Mayer, E.; Chin, S.H.; Shirai, K.; Ogretmen, B.; Bentz, T.A.; Brisendine, A.; Anderton, K.; Cusack, S.L.; Maines, L.W. A phase I study of ABC294640, a first-in-class sphingosine kinase-2 inhibitor, in patients with advanced solid tumors. Clin. Cancer Res. 2017, 23, 4642–4650. [Google Scholar] [CrossRef] [PubMed] [Green Version]
- Schnute, M.E.; McReynolds, M.D.; Kasten, T.; Yates, M.; Jerome, G.; Rains, J.W.; Hall, T.; Chrencik, J.; Kraus, M.; Cronin, C.N.; et al. Modulation of cellular S1P levels with a novel, potent and specific inhibitor of sphingosine kinase-1. Biochem. J. 2012, 444, 79–88. [Google Scholar] [CrossRef] [Green Version]
- Pitman, M.R.; Costabile, M.; Pitson, S.M. Recent advances in the development of sphingosine kinase inhibitors. Cell. Signal. 2016, 28, 1349–1363. [Google Scholar] [CrossRef]
- Schnute, M.E.; McReynolds, M.D.; Carroll, J.; Chrencik, J.; Highkin, M.K.; Iyanar, K.; Jerome, G.; Rains, J.W.; Saabye, M.; Scholten, J.A.; et al. Discovery of a potent and selective sphingosine kinase 1 inhibitor through the molecular combination of chemotype-distinct screening hits. J. Med. Chem. 2017, 60, 2562–2572. [Google Scholar] [CrossRef]
- Kim, S.W.; Lee, T.; Oh, Y.S.; Shin, S.M.; Lee, J.-Y.; Kim, S.; Baek, D.J.; Park, E.-Y. Synthesis and biological evaluation of PF-543 derivative containing aliphatic side chain. Chem. Pharm. Bull. 2019, 67, 599–603. [Google Scholar] [CrossRef] [PubMed]
- Shrestha, J.; Shamshiddinova, M.; Lee, Y.-M.; Oh, Y.S.; Baek, D.J.; Park, E.-Y. SK1 inhibitor RB005 Induces Apoptosis in Colorectal Cancer Cells through SK1 Inhibition Dependent and Independent Pathway. Curr. Mol. Pharmacol. 2021, 14, 1. [Google Scholar] [CrossRef]
- Grbčić, P.; Sedić, M. Sphingosine 1-phosphate signaling and metabolism in chemoprevention and chemoresistance in colon cancer. Molecules 2020, 25, 2436. [Google Scholar] [CrossRef]
- Baek, D.J.; MacRitchie, N.; Pyne, N.J.; Pyne, S.; Bittman, R. Synthesis of selective inhibitors of sphingosine kinase 1. Chem. Commun. 2013, 49, 2136–2138. [Google Scholar] [CrossRef] [PubMed] [Green Version]
- Shrestha, J.; Hwang, G.T.; Lee, T.; Kim, S.W.; Oh, Y.S.; Kwon, Y.; Hong, S.W.; Kim, S.; Moon, H.S.; Baek, D.J.; et al. Synthesis and Biological Evaluation of BODIPY-PF-543. Molecules 2019, 24, 4408. [Google Scholar] [CrossRef] [Green Version]
- Shrestha, J.; Lee, J.-Y.; Park, E.-Y.; Baek, D.J. Synthesis of PF-543 Derivatives Using Simple Synthetic Methods and Their Biological Effect Analysis for the Development of Anticolorectal Cancer Agents. Lett. Drug Des. Discov. 2021, 18, 85–92. [Google Scholar] [CrossRef]
- Park, E.-Y.; Lee, T.; Oh, Y.S.; Lee, J.-Y.; Shrestha, J.; Hong, S.W.; Jin, Y.J.; Jo, G.; Kim, S.; Hwang, G.T.; et al. Synthesis of dansyl labeled sphingosine kinase 1 inhibitor. Chem. Phys. Lipids 2018, 215, 29–33. [Google Scholar] [CrossRef] [PubMed]
- Cristóbal, I.; Manso, R.; Rincón, R.; Caramés, C.; Senin, C.; Borrero, A.; Martínez-Useros, J.; Rodriguez, M.; Zazo, S.; Aguilera, O.; et al. PP2A inhibition is a common event in colorectal cancer and its restoration using FTY720 shows promising therapeutic potential. Mol. Cancer Ther. 2014, 13, 938–947. [Google Scholar] [CrossRef] [Green Version]
- Zhang, L.; Wang, H.-D.; Ji, X.-J.; Cong, Z.-X.; Zhu, J.-H.; Zhou, Y. FTY720 for cancer therapy. Oncol. Rep. 2013, 30, 2571–2578. [Google Scholar] [CrossRef] [Green Version]
- Lynch, T.; Price, A.L. The effect of cytochrome P450 metabolism on drug response, interactions, and adverse effects. Am. Fam. Physician 2007, 76, 391–396. [Google Scholar] [PubMed]
- Zanger, U.M.; Schwab, M. Cytochrome P450 enzymes in drug metabolism: Regulation of gene expression, enzyme activities, and impact of genetic variation. Pharmacol. Ther. 2013, 138, 103–141. [Google Scholar] [CrossRef] [PubMed]
- Masimirembwa, C.M.; Bredberg, U.; Andersson, T.B. Metabolic stability for drug discovery and development. Clin. Pharmacokinet. 2003, 42, 515–528. [Google Scholar] [CrossRef] [PubMed]


| Time (min) | Flow (mL/min) | % A | % B |
|---|---|---|---|
| 0 | 0.3 | 100 | 0 |
| 1.0 | 0.3 | 60 | 40 |
| 4.0 | 0.3 | 50 | 50 |
| 4.1 | 0.3 | 100 | 0 |
| 7.0 | 0.3 | 100 | 0 |
| Head Group (R) | Compound No. | Compound No. |
|---|---|---|
 | 1 | 11 |
 | 2 | 12 |
 | 3 | 13 |
 | 4 | 14 |
 | 5 | 15 |
 | 6 | 16 |
 | 7 | 17 |
 | 8 | 18 |
 | 9 | 19 |
 | 10 | 20 |
| CYP1A2 | CYP2C9 | CYP2C19 | CYP2D6 | CYP3A4 | |
|---|---|---|---|---|---|
| Compound 10 | >100 | >100 | 96.5 | 87.4 | >100 |
| FTY720 | 86.5 | 96.8 | 86.8 | 92.0 | >100 |
| PF543 | 80.9 | 9.3 | 31.0 | 63.9 | 16.8 |
| Ketoconazole | >100 | >100 | >100 | >100 | 32.5 |
| Compound | Human (%) | Rat (%) | Mouse (%) |
|---|---|---|---|
| Compound 10 | 70.3 | 10.2 | 44.7 |
| FTY720 | 90.5 | 77.0 | 89.9 |
| PF543 | 13.5 | 8.1 | 6.5 |
| Verapamil (Reference) | 14.4 | – | – |
Publisher’s Note: MDPI stays neutral with regard to jurisdictional claims in published maps and institutional affiliations. |
© 2022 by the authors. Licensee MDPI, Basel, Switzerland. This article is an open access article distributed under the terms and conditions of the Creative Commons Attribution (CC BY) license (https://creativecommons.org/licenses/by/4.0/).
Share and Cite
Shrestha, J.; Kim, S.W.; Kim, S.-B.; Oh, Y.S.; Ki, S.H.; Lee, T.; Kim, S.-B.; Park, T.; Baek, D.J.; Park, E.-Y. Determining the Anticancer Activity of Sphingosine Kinase Inhibitors Containing Heteroatoms in Their Tail Structure. Pharmaceutics 2022, 14, 157. https://doi.org/10.3390/pharmaceutics14010157
Shrestha J, Kim SW, Kim S-B, Oh YS, Ki SH, Lee T, Kim S-B, Park T, Baek DJ, Park E-Y. Determining the Anticancer Activity of Sphingosine Kinase Inhibitors Containing Heteroatoms in Their Tail Structure. Pharmaceutics. 2022; 14(1):157. https://doi.org/10.3390/pharmaceutics14010157
Chicago/Turabian StyleShrestha, Jitendra, Seong Woong Kim, Su-Bin Kim, Yoon Sin Oh, Sung Hwan Ki, Taeho Lee, Sang-Bum Kim, Taeuk Park, Dong Jae Baek, and Eun-Young Park. 2022. "Determining the Anticancer Activity of Sphingosine Kinase Inhibitors Containing Heteroatoms in Their Tail Structure" Pharmaceutics 14, no. 1: 157. https://doi.org/10.3390/pharmaceutics14010157
APA StyleShrestha, J., Kim, S. W., Kim, S.-B., Oh, Y. S., Ki, S. H., Lee, T., Kim, S.-B., Park, T., Baek, D. J., & Park, E.-Y. (2022). Determining the Anticancer Activity of Sphingosine Kinase Inhibitors Containing Heteroatoms in Their Tail Structure. Pharmaceutics, 14(1), 157. https://doi.org/10.3390/pharmaceutics14010157