
No Time Dependence of Ciprofloxacin Pharmacokinetics in Critically Ill Adults: Comparison of Individual and Population Analyses

 , , , , ,
Abstract
:1. Introduction
2. Materials and Methods
2.1. Study Design
2.2. Bioanalytical Assay
2.3. Primary PK Analysis
2.4. Population PK Analysis
- (1)
- Development of structural and statistical model
- (2)
- Covariate analysis
- Body weight, height, LBM, BSA, serum level of bilirubin, CLCR, age, daily fluid balance, and doses of concomitantly used drugs (noradrenalin and furosemide) were tested as continuous covariates;
- Smoking status (smoker/non-smoker), concomitant therapy with continuous veno-venous hemodialysis—CVVHD (on CVVHD/off CVVHD) and sex were tested as categorical covariates.
- (3)
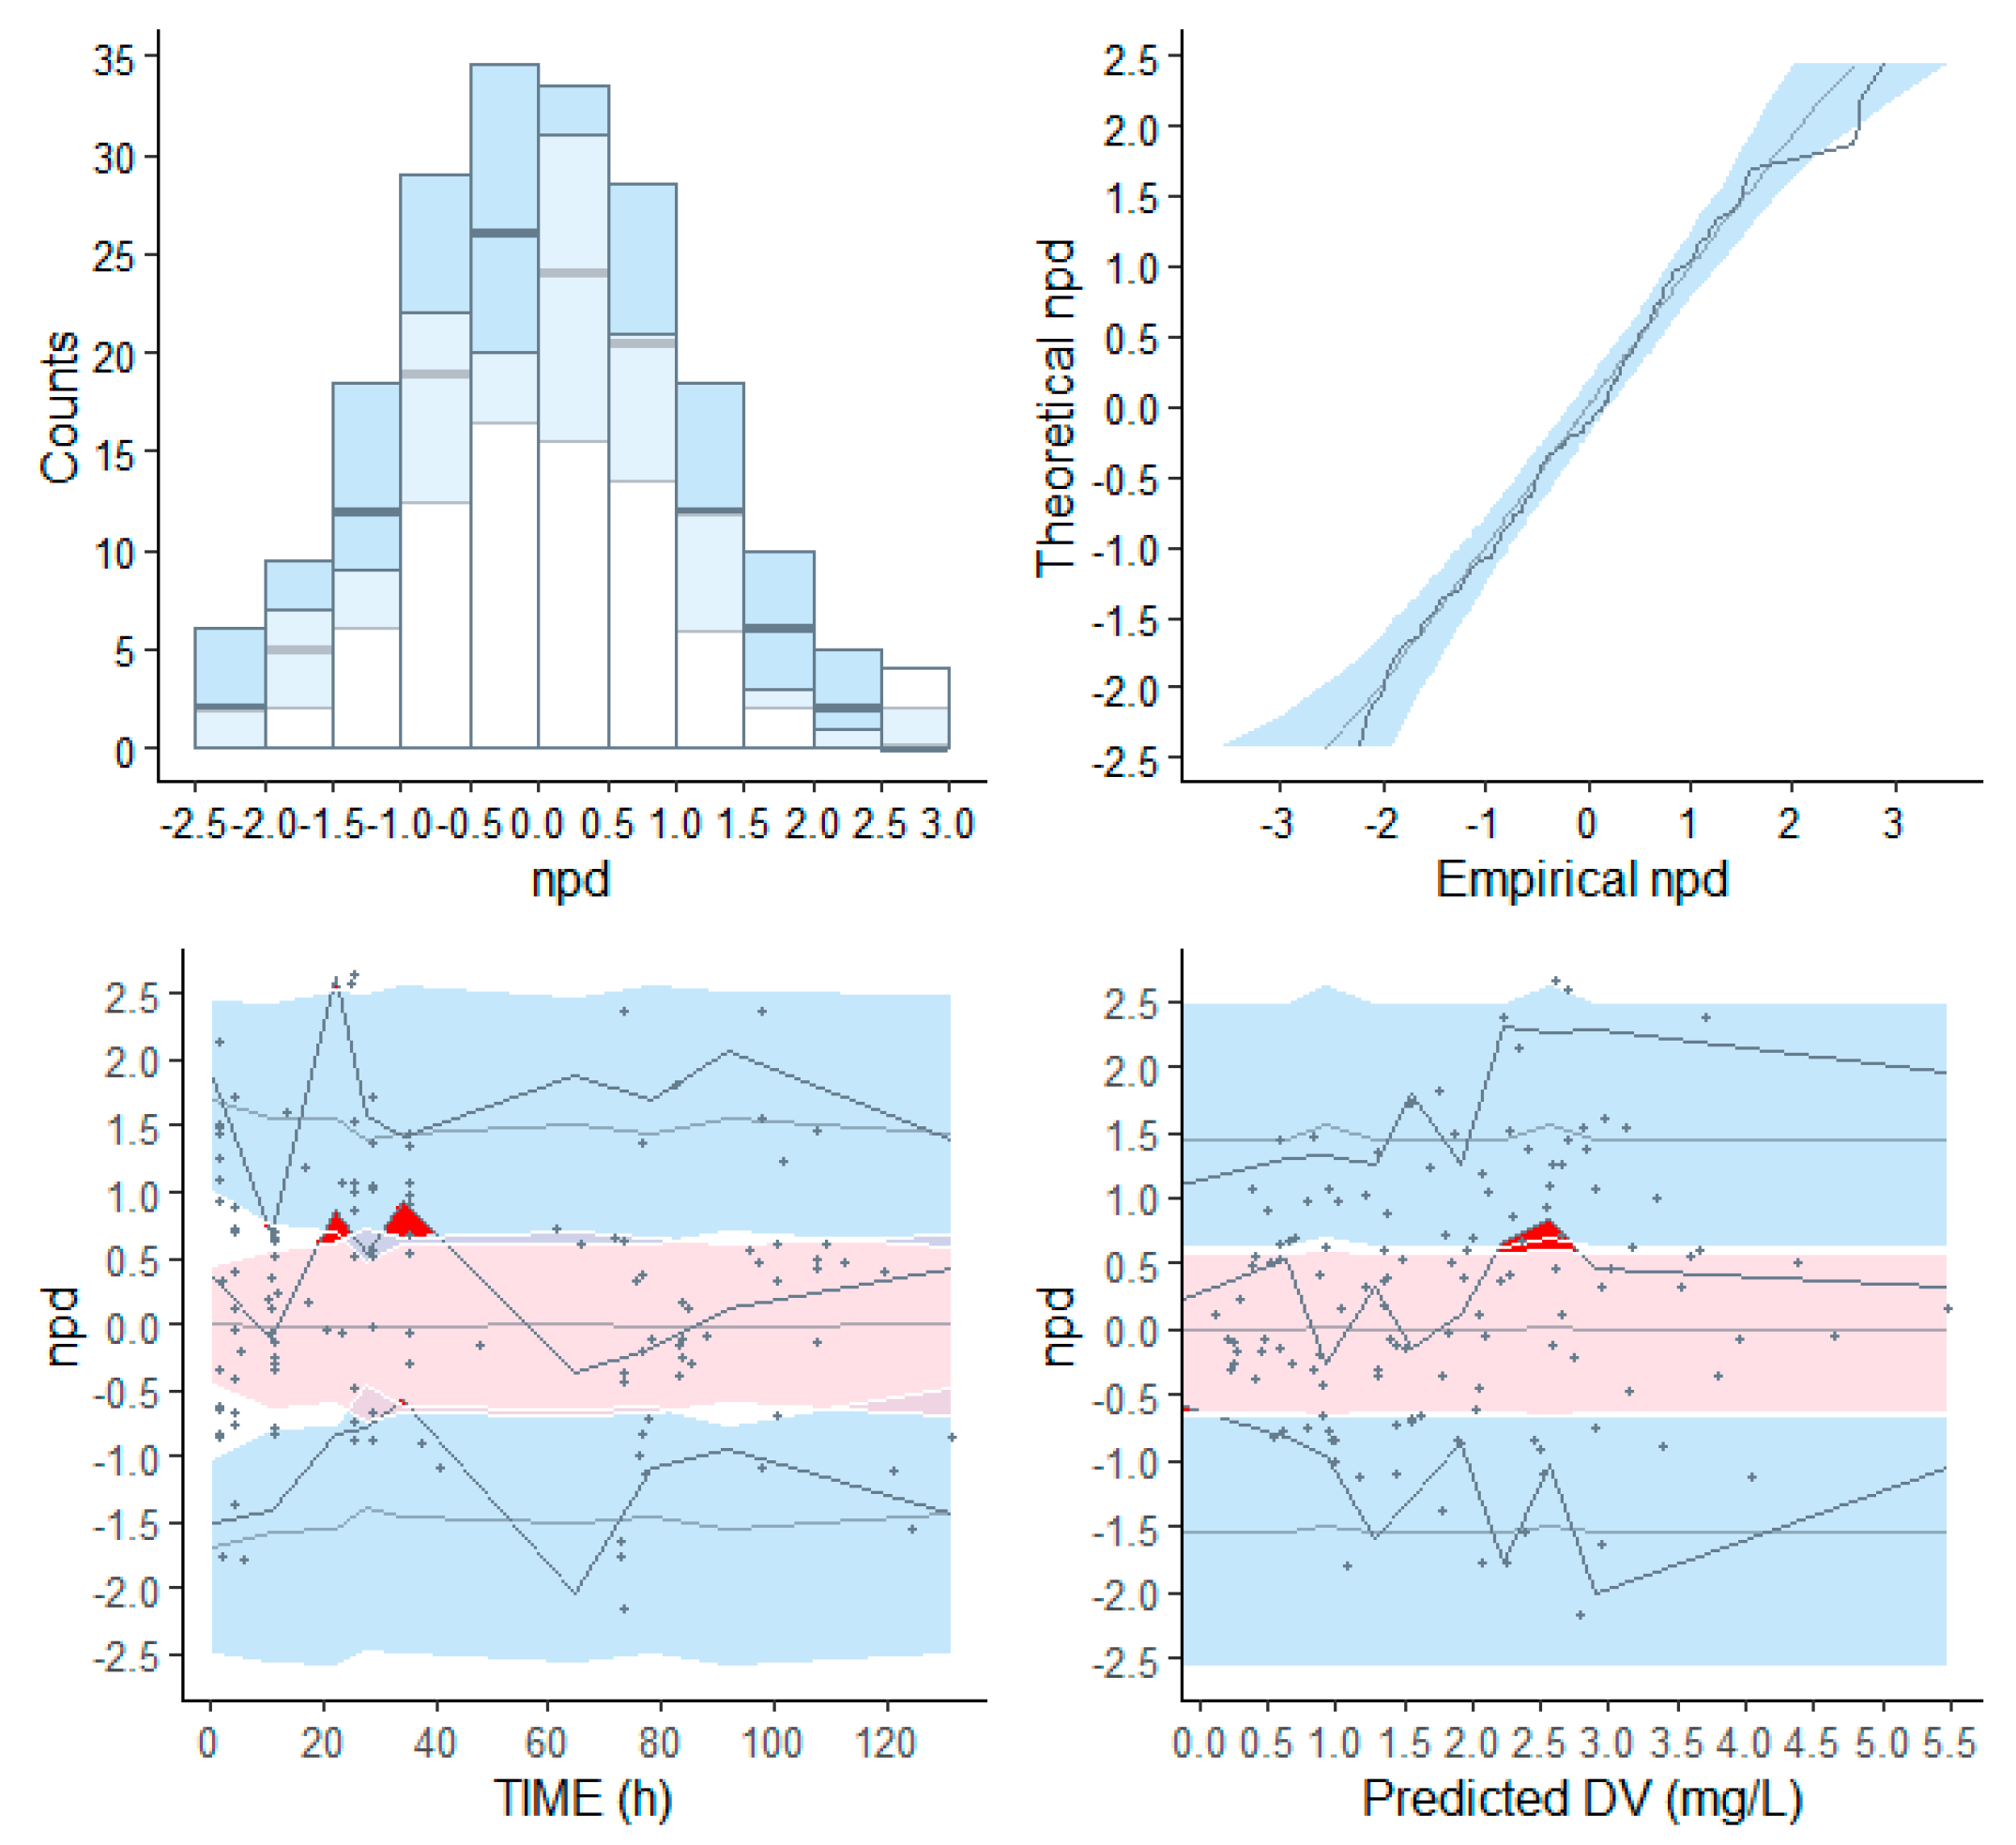
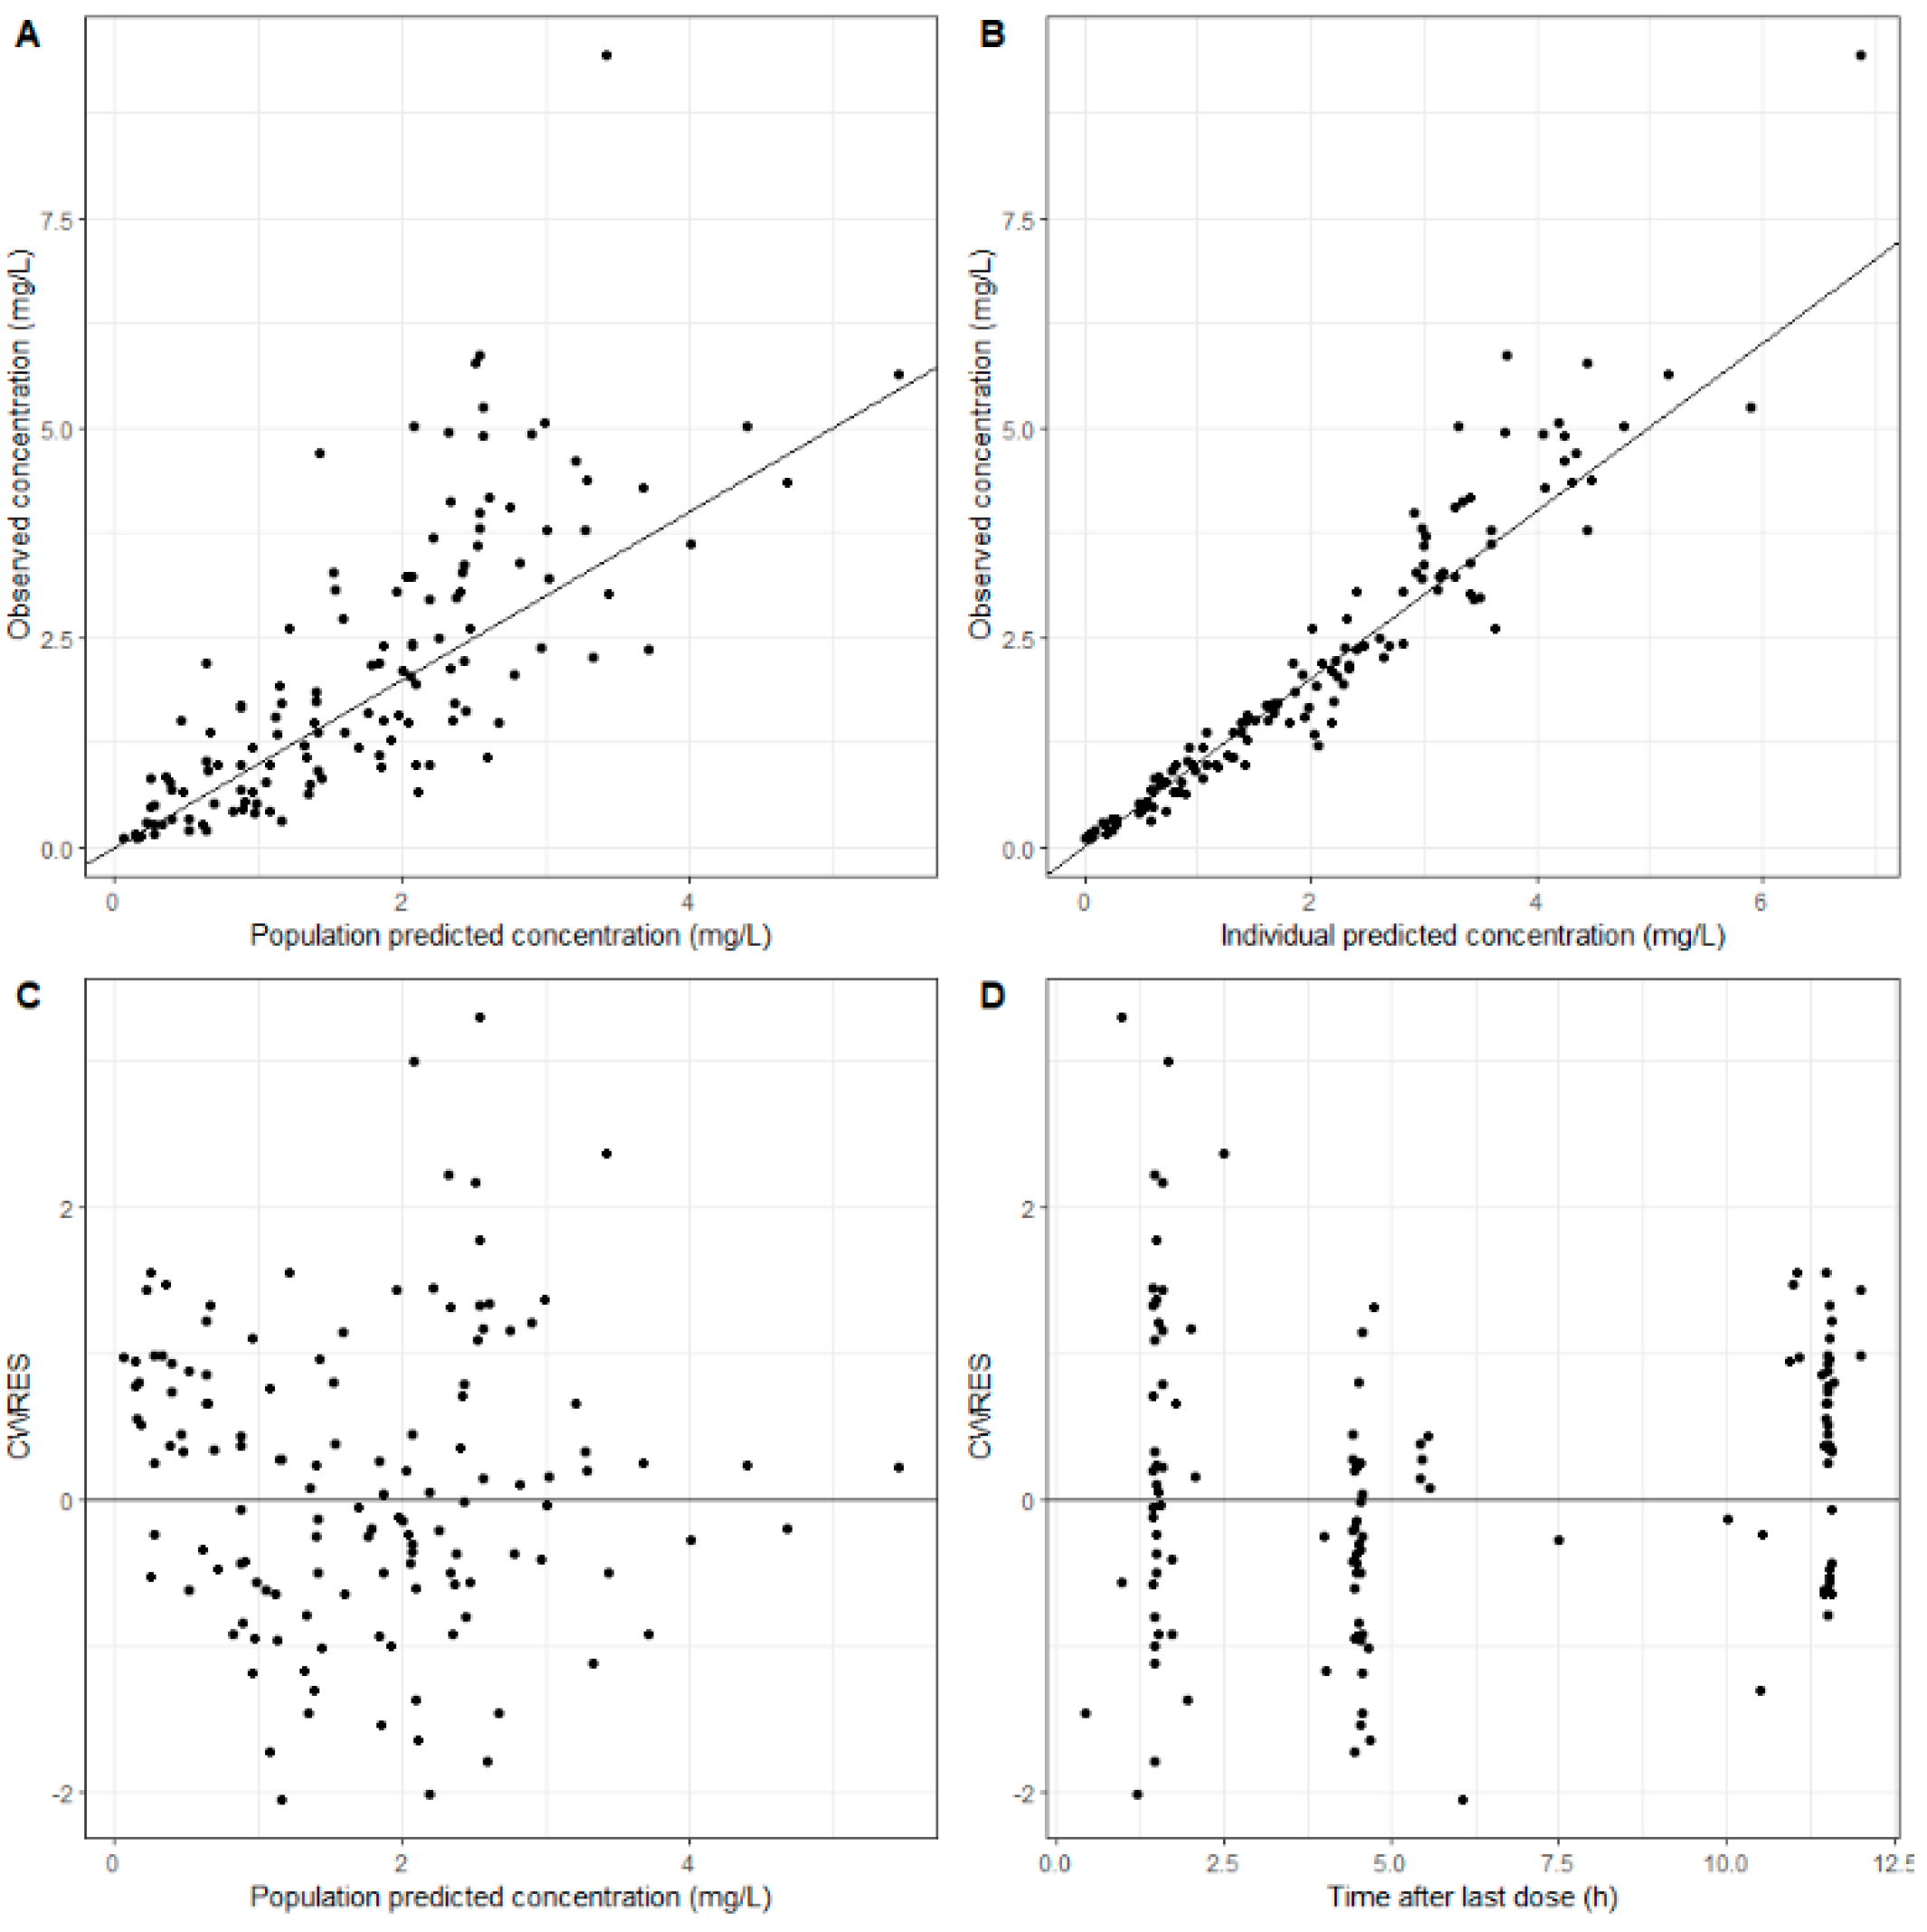
- Validation of the final model
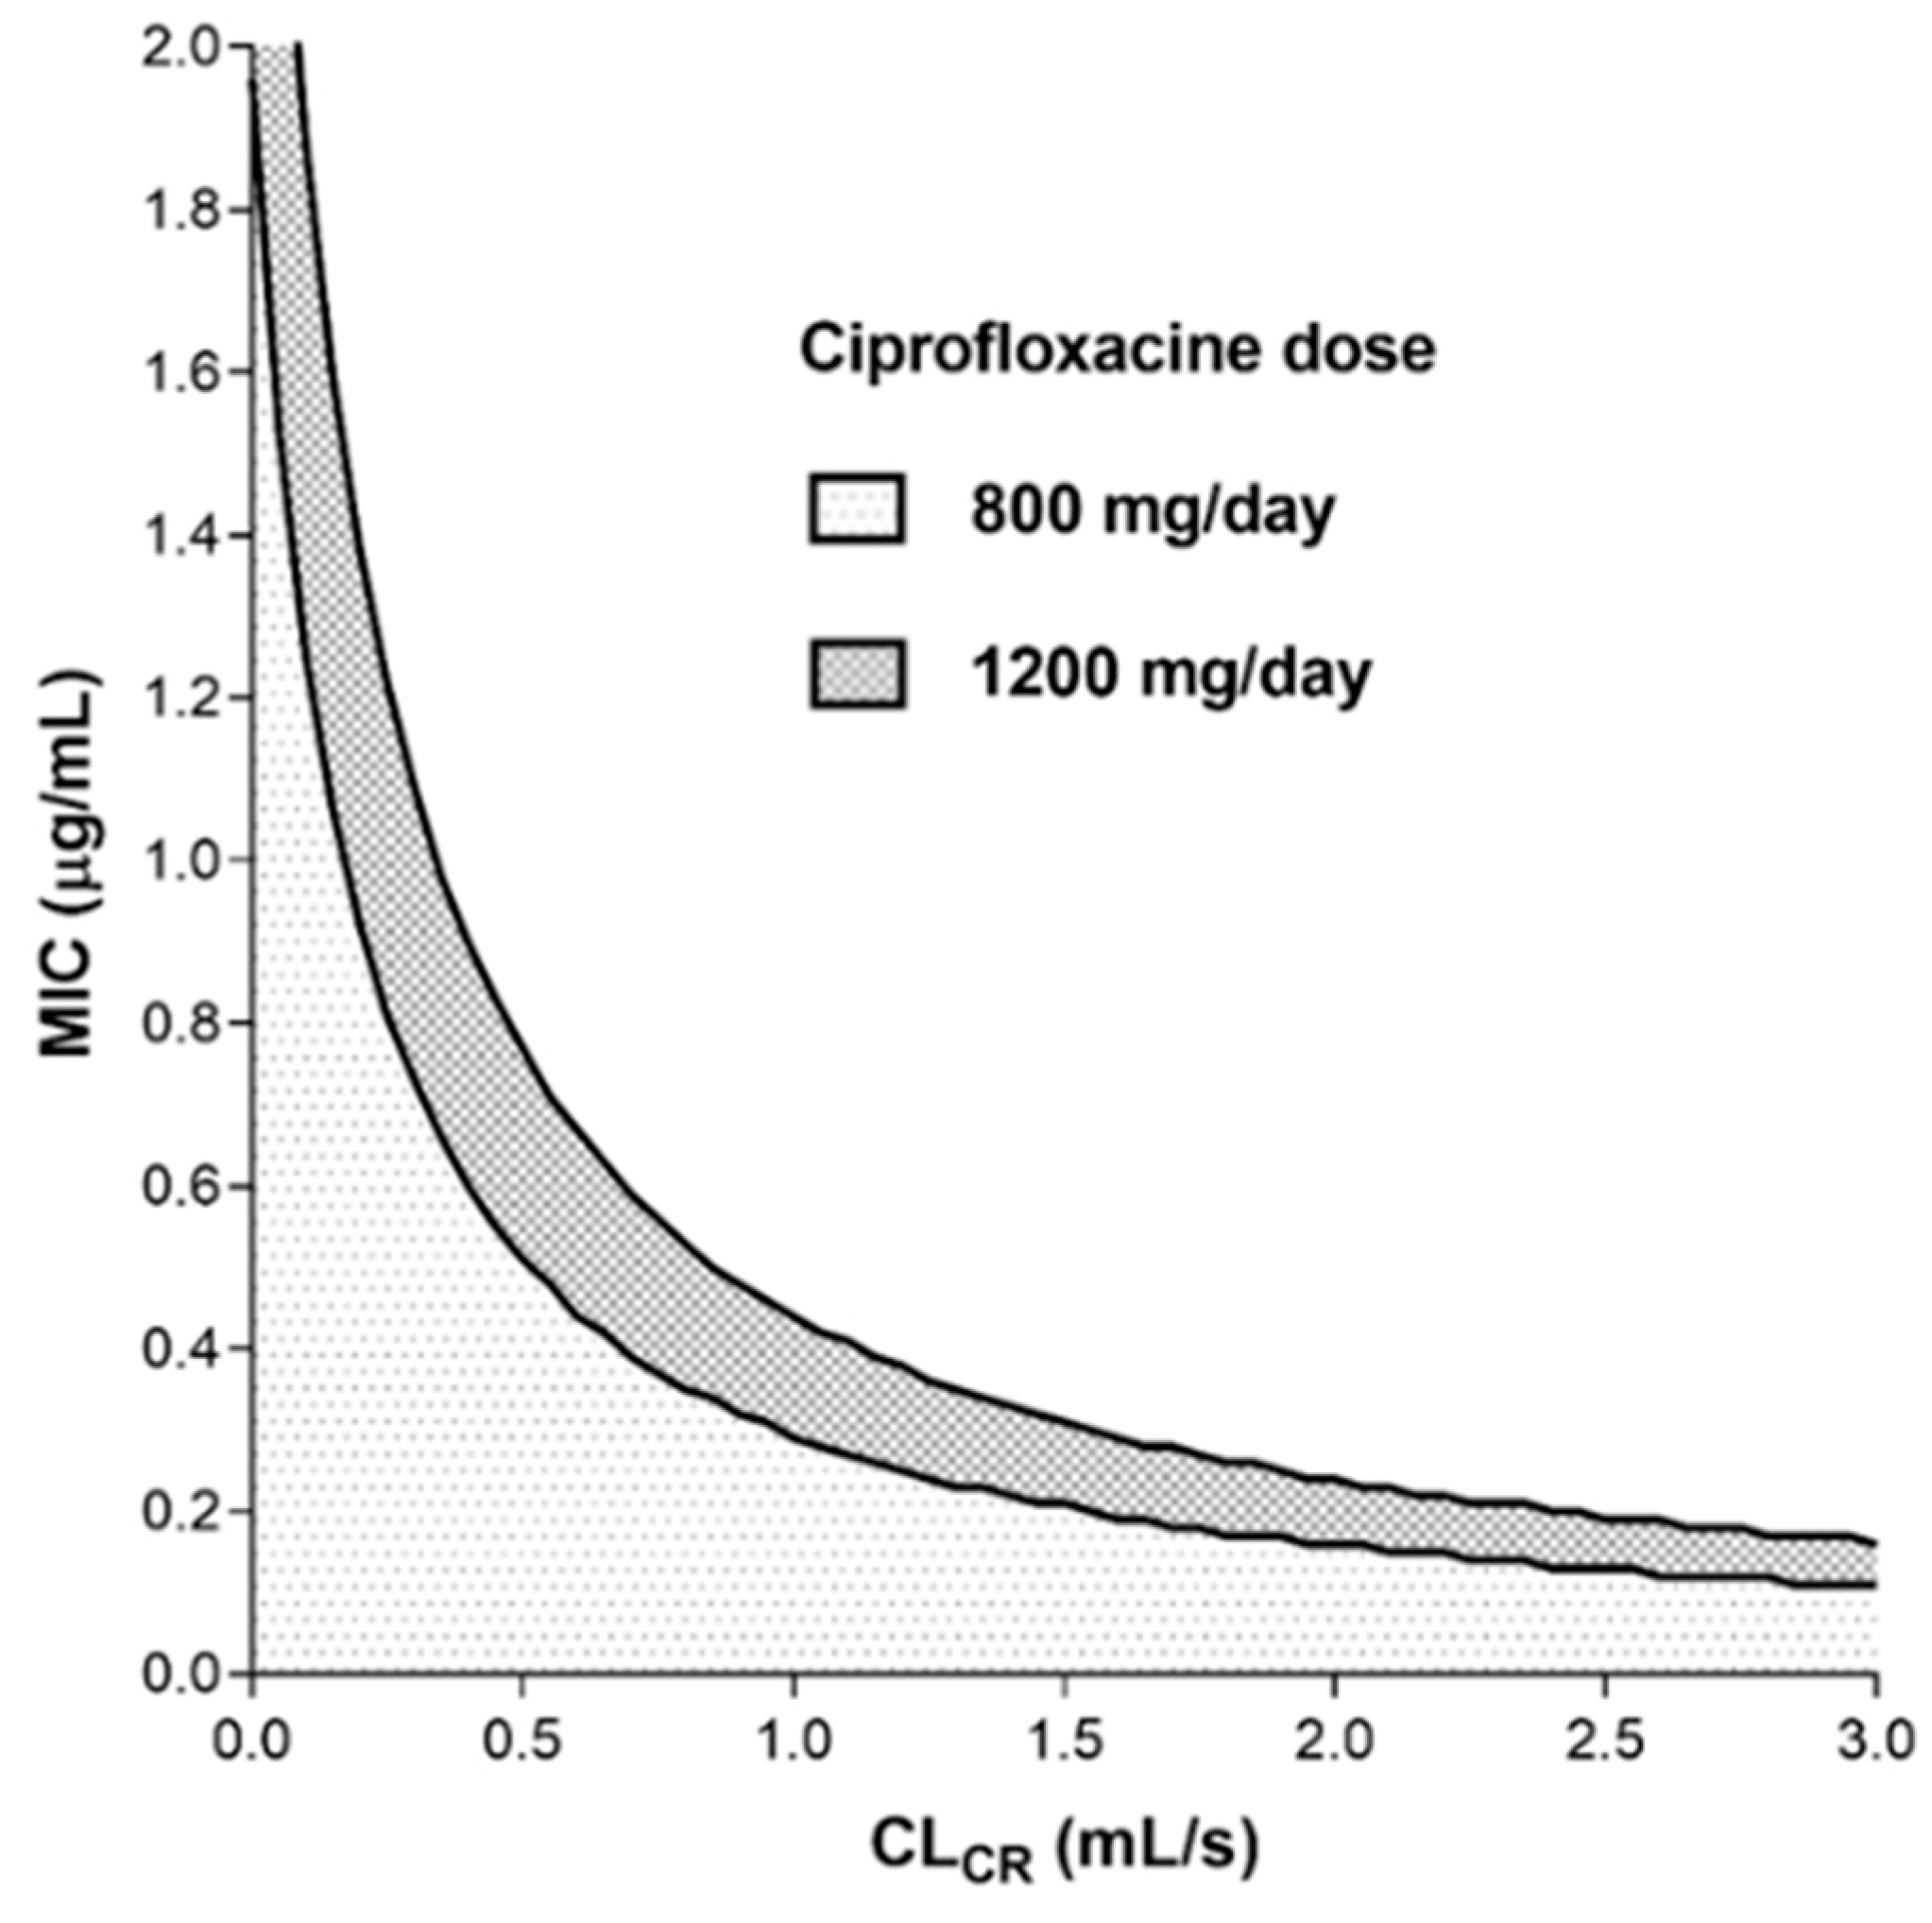
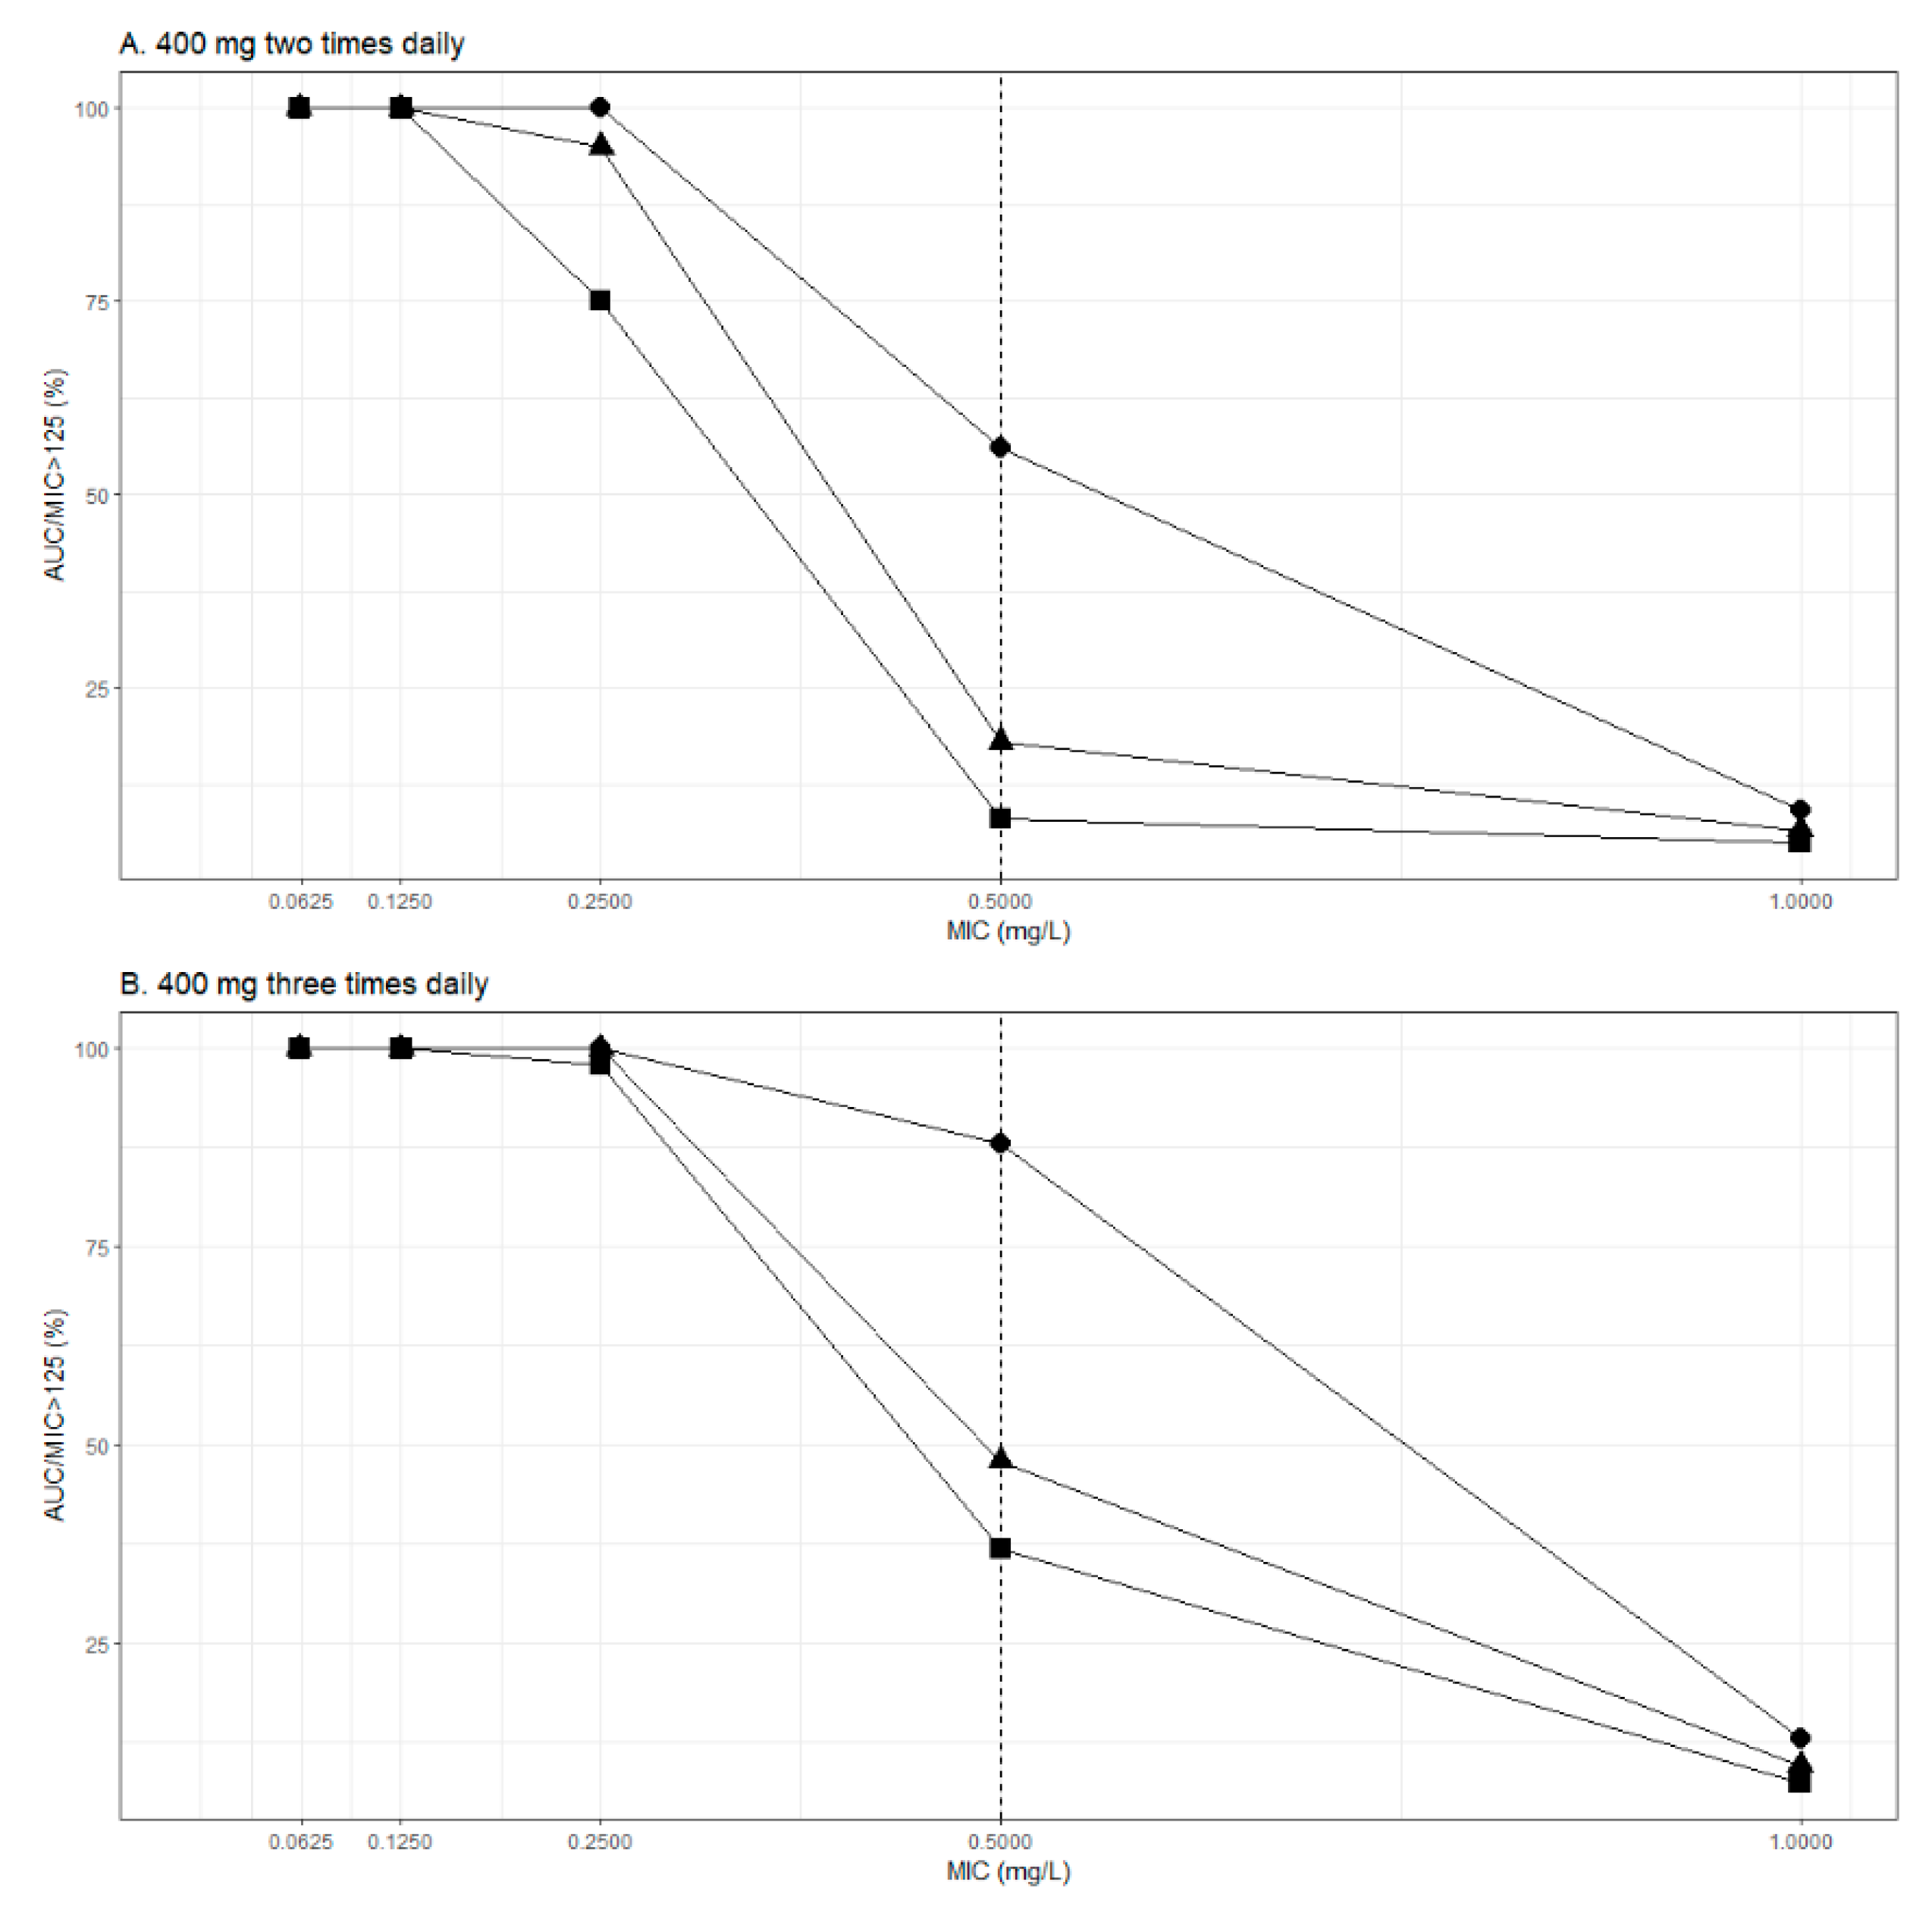
Monte Carlo Simulations
3. Results
3.1. Study Population
3.2. Primary PK Analysis
3.3. Population PK Analysis
Monte Carlo Simulations
4. Discussion
5. Conclusions
Supplementary Materials
Author Contributions
Funding
Institutional Review Board Statement
Informed Consent Statement
Data Availability Statement
Acknowledgments
Conflicts of Interest
References
- Dalhoff, A. Global Fluoroquinolone Resistance Epidemiology and Implictions for Clinical use. Interdiscip. Perspect. Infect Dis. 2012, 2012. [Google Scholar] [CrossRef] [PubMed]
- Cruciani, M.; Bassetti, D. The Fluoroquinolones as Treatment for Infections Caused by Gram-positive Bacteria. J. Antimicrob. Chemother. 1994, 33, 403–417. [Google Scholar] [CrossRef] [PubMed]
- Mouton, J.W.; Muller, A.E.; Canton, R.; Giske, C.G.; Kahlmeter, G.; Turnidge, J. MIC-based Dose Adjustment: Facts and Fables. J. Antimicrob. Chemother. 2018, 73, 564–568. [Google Scholar] [CrossRef]
- Abdulla, A.; Rogouti, O.; Hunfeld, N.G.; Endeman, H.; Dijkstra, A.; van Gelder, T.; Muller, A.E.; de Winter, B.C.; Koch, B.C. Population Pharmacokinetics and Target Attainment of Ciprofloxacin in Critically Ill Patients. Eur. J. Clin. Pharmacol. 2020, 76, 957–967. [Google Scholar] [CrossRef] [PubMed]
- Khachman, D.; Conil, J.-M.; Georges, B.; Saivin, S.; Houin, G.; Toutain, P.-L.; Laffont, C.M. Optimizing Ciprofloxacin Dosing in Intensive Care Unit Patients through the Use of Population Pharmacokinetic–pharmacodynamic Analysis and Monte Carlo Simulations. J. Antimicrob. Chemother. 2011, 66, 1798–1809. [Google Scholar] [CrossRef]
- Van Zanten, A.R.; Polderman, K.H.; van Geijlswijk, I.M.; van der Meer, G.Y.; Schouten, M.A.; Girbes, A.R. Ciprofloxacin Pharmacokinetics in Critically Ill Patients: A Prospective Cohort Study. J. Crit. Care 2008, 23, 422–430. [Google Scholar] [CrossRef] [PubMed]
- De Cock, R.F.; Piana, C.; Krekels, E.H.; Danhof, M.; Allegaert, K.; Knibbe, C.A. The Role of Population PK-PD Modelling in Paediatric Clinical Research. Eur. J. Clin. Pharmacol. 2011, 67, 5–16. [Google Scholar] [CrossRef]
- Leligdowicz, A.; Matthay, M.A. Heterogeneity in Sepsis: New Biological Evidence with Clinical Applications. Crit. Care 2019, 23, 1–8. [Google Scholar] [CrossRef] [PubMed]
- Roberts, J.A.; Paul, S.K.; Akova, M.; Bassetti, M.; De Waele, J.J.; Dimopoulos, G.; Kaukonen, K.-M.; Koulenti, D.; Martin, C.; Montravers, P. DALI: Defining Antibiotic Levels in Intensive Care Unit Patients: Are Current β-Lactam Antibiotic Doses Sufficient for Critically Ill Patients? Clin. Infect. Dis. 2014, 58, 1072–1083. [Google Scholar] [CrossRef]
- Blot, S.I.; Pea, F.; Lipman, J. The Effect of Pathophysiology on Pharmacokinetics in The Critically Ill Patient—Concepts Appraised by the Example of Antimicrobial Agents. Adv. Drug Deliv. Rev. 2014, 77, 3–11. [Google Scholar] [CrossRef]
- Traynor, J.; Mactier, R.; Geddes, C.C.; Fox, J.G. How to Measure Renal Function in Clinical Practice. BMJ 2006, 333, 733–737. [Google Scholar] [CrossRef]
- Cockcroft, D.W.; Gault, M.H. Prediction of Creatinine Clearance from Serum Creatinine. Nephron 1976, 16, 31–41. [Google Scholar] [CrossRef] [PubMed]
- Levey, A.S.; Stevens, L.A.; Schmid, C.H.; Zhang, Y.L.; Castro, A.F.; Feldman, H.I., III; Kusek, J.W.; Eggers, P.; Van Lente, F.; Greene, T.; et al. A New Equation to Estimate Glomerular Filtration Rate. Ann. Intern. Med. 2009, 150, 604–612. [Google Scholar] [CrossRef] [PubMed]
- Levey, A.S.; Bosch, J.P.; Lewis, J.B.; Greene, T.; Rogers, N.; Roth, D. A More Accurate Method to Estimate Glomerular Filtration Rate from Serum Creatinine: A New Prediction Equation. Modification of Diet in Renal Disease Study Group. Ann. Intern. Med. 1999, 130, 461–470. [Google Scholar] [CrossRef] [PubMed]
- Nyman, U.; Grubb, A.; Larsson, A.; Hansson, L.O.; Flodin, M.; Nordin, G.; Lindstrom, V.; Bjork, J. The Revised Lund-Malmo GFR Estimating Equation Outperforms MDRD and CKD-EPI Across GFR, Age and BMI Intervals in a Large Swedish Population. Clin. Chem. Lab. Med. 2014, 52, 815–824. [Google Scholar] [CrossRef] [PubMed]
- Dubois, D.; Dubois, E.F. Nutrition Metabolism Classic–A Formula to Estimate the Approximate Surface-Area If Height and Weight Be Known (Reprinted from Archives Internal Medicine, Vol 17, Pg 863, 1916). Nutrition 1989, 5, 303–313. [Google Scholar]
- Boer, P. Estimated Lean Body Mass as an Index for Normalization of Body Fluid Volumes in Humans. Am. J. Physiol. 1984, 247, F632–F636. [Google Scholar] [CrossRef] [PubMed]
- Drusano, G.L.; Weir, M.; Forrest, A.; Plaisance, K.; Emm, T.; Standiford, H.C. Pharmacokinetics of Intravenously Administered Ciprofloxacin in Patients with Various Degrees of Renal Function. Antimicrob. Agents Chemother. 1987, 31, 860–864. [Google Scholar] [CrossRef] [PubMed]
- Lindbom, L.; Pihlgren, P.; Jonsson, E.N. PsN-Toolkit--A Collection of Computer Intensive Statistical Methods for Non-Linear Mixed Effect Modeling using NONMEM. Comput. Methods Programs Biomed. 2005, 79, 241–257. [Google Scholar] [CrossRef] [PubMed]
- Lindbom, L.; Ribbing, J.; Jonsson, E.N. Perl-speaks-NONMEM (PsN)--A Perl Module for NONMEM Related Programming. Comput. Methods Programs Biomed. 2004, 75, 85–94. [Google Scholar] [CrossRef]
- Keizer, R.J.; van Benten, M.; Beijnen, J.H.; Schellens, J.H.; Huitema, A.D. Pirana and PCluster: A Modeling Environment and Cluster Infrastructure for NONMEM. Comput. Methods Programs Biomed. 2011, 101, 72–79. [Google Scholar] [CrossRef] [PubMed]
- Comets, E.; Brendel, K.; Mentré, F. Computing Normalised Prediction Distribution Errors to Evaluate Nonlinear Mixed-effect Models: The Npde Add-on Package for R. Comput. Methods Programs Biomed. 2008, 90, 154–166. [Google Scholar] [CrossRef] [PubMed]
- Byon, W.; Smith, M.K.; Chan, P.; Tortorici, M.A.; Riley, S.; Dai, H.; Dong, J.; Ruiz-Garcia, A.; Sweeney, K.; Cronenberger, C. Establishing Best Practices and Guidance in Population Modeling: An Experience with an Internal Population Pharmacokinetic Analysis Guidance. CPT Pharmacomet. Syst. Pharmacol. 2013, 2, e51. [Google Scholar] [CrossRef]
- Boucher, B.A.; Wood, G.C.; Swanson, J.M. Pharmacokinetic Changes in Critical Illness. Crit. Care Clin. 2006, 22, 255–271. [Google Scholar] [CrossRef] [PubMed]
- Abdul-Aziz, M.H.; Alffenaar, J.C.; Bassetti, M.; Bracht, H.; Dimopoulos, G.; Marriott, D.; Neely, M.N.; Paiva, J.A.; Pea, F.; Sjovall, F.; et al. Antimicrobial Therapeutic Drug Monitoring in Critically Ill Adult Patients: A Position Paper. Intensive Care Med. 2020, 46, 1127–1153. [Google Scholar] [CrossRef] [PubMed]
- Roberts, J.A.; Alobaid, A.S.; Wallis, S.C.; Perner, A.; Lipman, J.; Sjövall, F. Defining Optimal Dosing of Ciprofloxacin in Patients with Septic Shock. J. Antimicrob. Chemother. 2019, 74, 1662–1669. [Google Scholar] [CrossRef]
- De Velde, F.; Mouton, J.W.; de Winter, B.C.M.; van Gelder, T.; Koch, B.C.P. Clinical Applications of Population Pharmacokinetic Models of Antibiotics: Challenges and Perspectives. Pharmacol Res 2018, 134, 280–288. [Google Scholar] [CrossRef]
- Alobaid, A.S.; Hites, M.; Lipman, J.; Taccone, F.S.; Roberts, J.A. Effect of Obesity on The Pharmacokinetics of Antimicrobials in Critically Ill Patients: A Structured Review. Int. J. Antimicrob. Agents 2016, 47, 259–268. [Google Scholar] [CrossRef] [PubMed]
- Sima, M.; Hartinger, J.; Cikankova, T.; Slanar, O. Estimation of Once-daily Amikacin Dose in Critically Ill Adults. J. Chemother. 2018, 30, 37–43. [Google Scholar] [CrossRef]
- Sima, M.; Hartinger, J.; Stenglova Netikova, I.; Slanar, O. Creatinine Clearance Estimations for Vancomycin Maintenance Dose Adjustments. Am. J. Ther. 2018, 25, e602–e604. [Google Scholar] [CrossRef] [PubMed]
- Fabre, D.; Bressolle, F.; Gomeni, R.; Arich, C.; Lemesle, F.; Beziau, H.; Galtier, M. Steady-state Pharmacokinetics of Ciprofloxacin in Plasma from Patients with Nosocomial Pneumonia: Penetration of The Bronchial Mucosa. Antimicrob. Agents Chemother. 1991, 35, 2521–2525. [Google Scholar] [CrossRef] [PubMed]
- Gasser, T.C.; Ebert, S.C.; Graversen, P.H.; Madsen, P.O. Ciprofloxacin Pharmacokinetics in Patients with Normal and Impaired Renal Function. Antimicrob. Agents Chemother. 1987, 31, 709–712. [Google Scholar] [CrossRef] [PubMed]
- Webb, D.B.; Roberts, D.E.; Williams, J.D.; Asscher, A.W. Pharmacokinetics of Ciprofloxacin in Healthy Volunteers and Patients with Impaired Kidney Function. J. Antimicrob. Chemother. 1986, 18, 83–87. [Google Scholar] [CrossRef] [PubMed]
- Wingender, W.; Graefe, K.H.; Gau, W.; Forster, D.; Beermann, D.; Schacht, P. Pharmacokinetics of Ciprofloxacin After Oral and Intravenous Administration in Healthy Volunteers. Eur. J. Clin. Microbiol. 1984, 3, 355–359. [Google Scholar] [CrossRef] [PubMed]


| Characteristics | Early Phase (n = 29) | Delayed Phase (n = 15) |
|---|---|---|
| Sex (M/F) | 21/8 | 11/4 |
| Age (years) | 58 (35–85) | 57 (35–85) |
| Body weight (kg) | 90 (56–140) | 90 (58–130) |
| Height (cm) | 175 (150–196) | 175 (160–190) |
| BSA (m2) | 2.09 (1.60–2.65) | 2.09 (1.60–2.45) |
| LBM (kg) | 63 (44–81) | 63 (44–76) |
| Smoking status (Y/N/NA) | 15/6/8 | 9/3/3 |
| CLCR (mL/s) | 1.16 (0.12–3.32) | 1.36 (0.66–2.49) |
| CKD-EPI (mL/s) | 1.60 (0.16–2.98) | 1.24 (0.76–2.37) |
| MDRD (mL/s) | 1.70 (0.18–4.26) | 1.99 (0.94–4.95) |
| C–G (mL/s) | 1.77 (0.25–4.96) | 2.10 (0.72–5.31) |
| L–M (mL/s) | 1.45 (0.20–2.81) | 1.76 (0.82–2.95) |
| Total bilirubin (µmol/L) | 11.3 (3.5–90.3) | 11.0 (4.4–46.4) |
| Fluid balance (mL/day) | −490 (−4000–4300) | −500 (−3502–1900) |
| Norepinephrine (mg/day) | 17 (0–61) | 5 (0–60) |
| Furosemide (mg/day) | 5 (0–320) | 19 (0–148) |
| PK Parameter | Early Phase (n = 29) | Delayed Phase (n = 15) |
|---|---|---|
| Vd (L) | 136.9 (76.6–322.6) | 158.3 (98.0–386.6) |
| Vd (L/kg) | 1.73 (0.76–3.83) | 1.98 (0.75–4.55) |
| CL (L/h) | 18.59 (8.13–74.94) | 20.57 (6.20–74.63) |
| CL (L/h/kg) | 0.209 (0.068–0.906) | 0.291 (0.107–0.878) |
| t1/2 (h) | 5.6 (2.3–11.7) | 4.7 (2.8–11.6) |
| Parameter (Units) | Final Model (RSE %) | Bootstrap Method (95% CI) |
|---|---|---|
| Fixed effects | ||
| CL (L/h) = CLp + θCLCR × (CLCR/1.25) | ||
| CLp (L/h) | 5.4 (28%) | 5.33 (2.21–8.50) |
| θCLCR | 16.1 (16%) | 16 (11.3–21.8) |
| Vd (L) = Vdp | ||
| Vdp (L) | 143 (9%) | 142 (112–168) |
| Inter-individual variability | ||
| CL (%) | 44.9% (3%) | 43.6% (34.9–52.4) |
| Vd (%) | 34.8% (17%) | 43.6% (34.9–52.4) |
| Residual variability | ||
| Additive (%) | 0.981 (34%) | 1.05 (0.6–2.1) |
| Proportional (%) | 4.78 (26%) | 4.5 (2.3–7.5) |
Publisher’s Note: MDPI stays neutral with regard to jurisdictional claims in published maps and institutional affiliations. |
© 2021 by the authors. Licensee MDPI, Basel, Switzerland. This article is an open access article distributed under the terms and conditions of the Creative Commons Attribution (CC BY) license (https://creativecommons.org/licenses/by/4.0/).
Share and Cite
Šíma, M.; Michaličková, D.; Ryšánek, P.; Cihlářová, P.; Kuchař, M.; Lžičařová, D.; Beroušek, J.; Hartinger, J.M.; Vymazal, T.; Slanař, O. No Time Dependence of Ciprofloxacin Pharmacokinetics in Critically Ill Adults: Comparison of Individual and Population Analyses. Pharmaceutics 2021, 13, 1156. https://doi.org/10.3390/pharmaceutics13081156
Šíma M, Michaličková D, Ryšánek P, Cihlářová P, Kuchař M, Lžičařová D, Beroušek J, Hartinger JM, Vymazal T, Slanař O. No Time Dependence of Ciprofloxacin Pharmacokinetics in Critically Ill Adults: Comparison of Individual and Population Analyses. Pharmaceutics. 2021; 13(8):1156. https://doi.org/10.3390/pharmaceutics13081156
Chicago/Turabian StyleŠíma, Martin, Danica Michaličková, Pavel Ryšánek, Petra Cihlářová, Martin Kuchař, Daniela Lžičařová, Jan Beroušek, Jan Miroslav Hartinger, Tomáš Vymazal, and Ondřej Slanař. 2021. "No Time Dependence of Ciprofloxacin Pharmacokinetics in Critically Ill Adults: Comparison of Individual and Population Analyses" Pharmaceutics 13, no. 8: 1156. https://doi.org/10.3390/pharmaceutics13081156
APA StyleŠíma, M., Michaličková, D., Ryšánek, P., Cihlářová, P., Kuchař, M., Lžičařová, D., Beroušek, J., Hartinger, J. M., Vymazal, T., & Slanař, O. (2021). No Time Dependence of Ciprofloxacin Pharmacokinetics in Critically Ill Adults: Comparison of Individual and Population Analyses. Pharmaceutics, 13(8), 1156. https://doi.org/10.3390/pharmaceutics13081156