
Light- and Melanin Nanoparticle-Induced Cytotoxicity in Metastatic Cancer Cells

 , , ,
, , ,  , , and
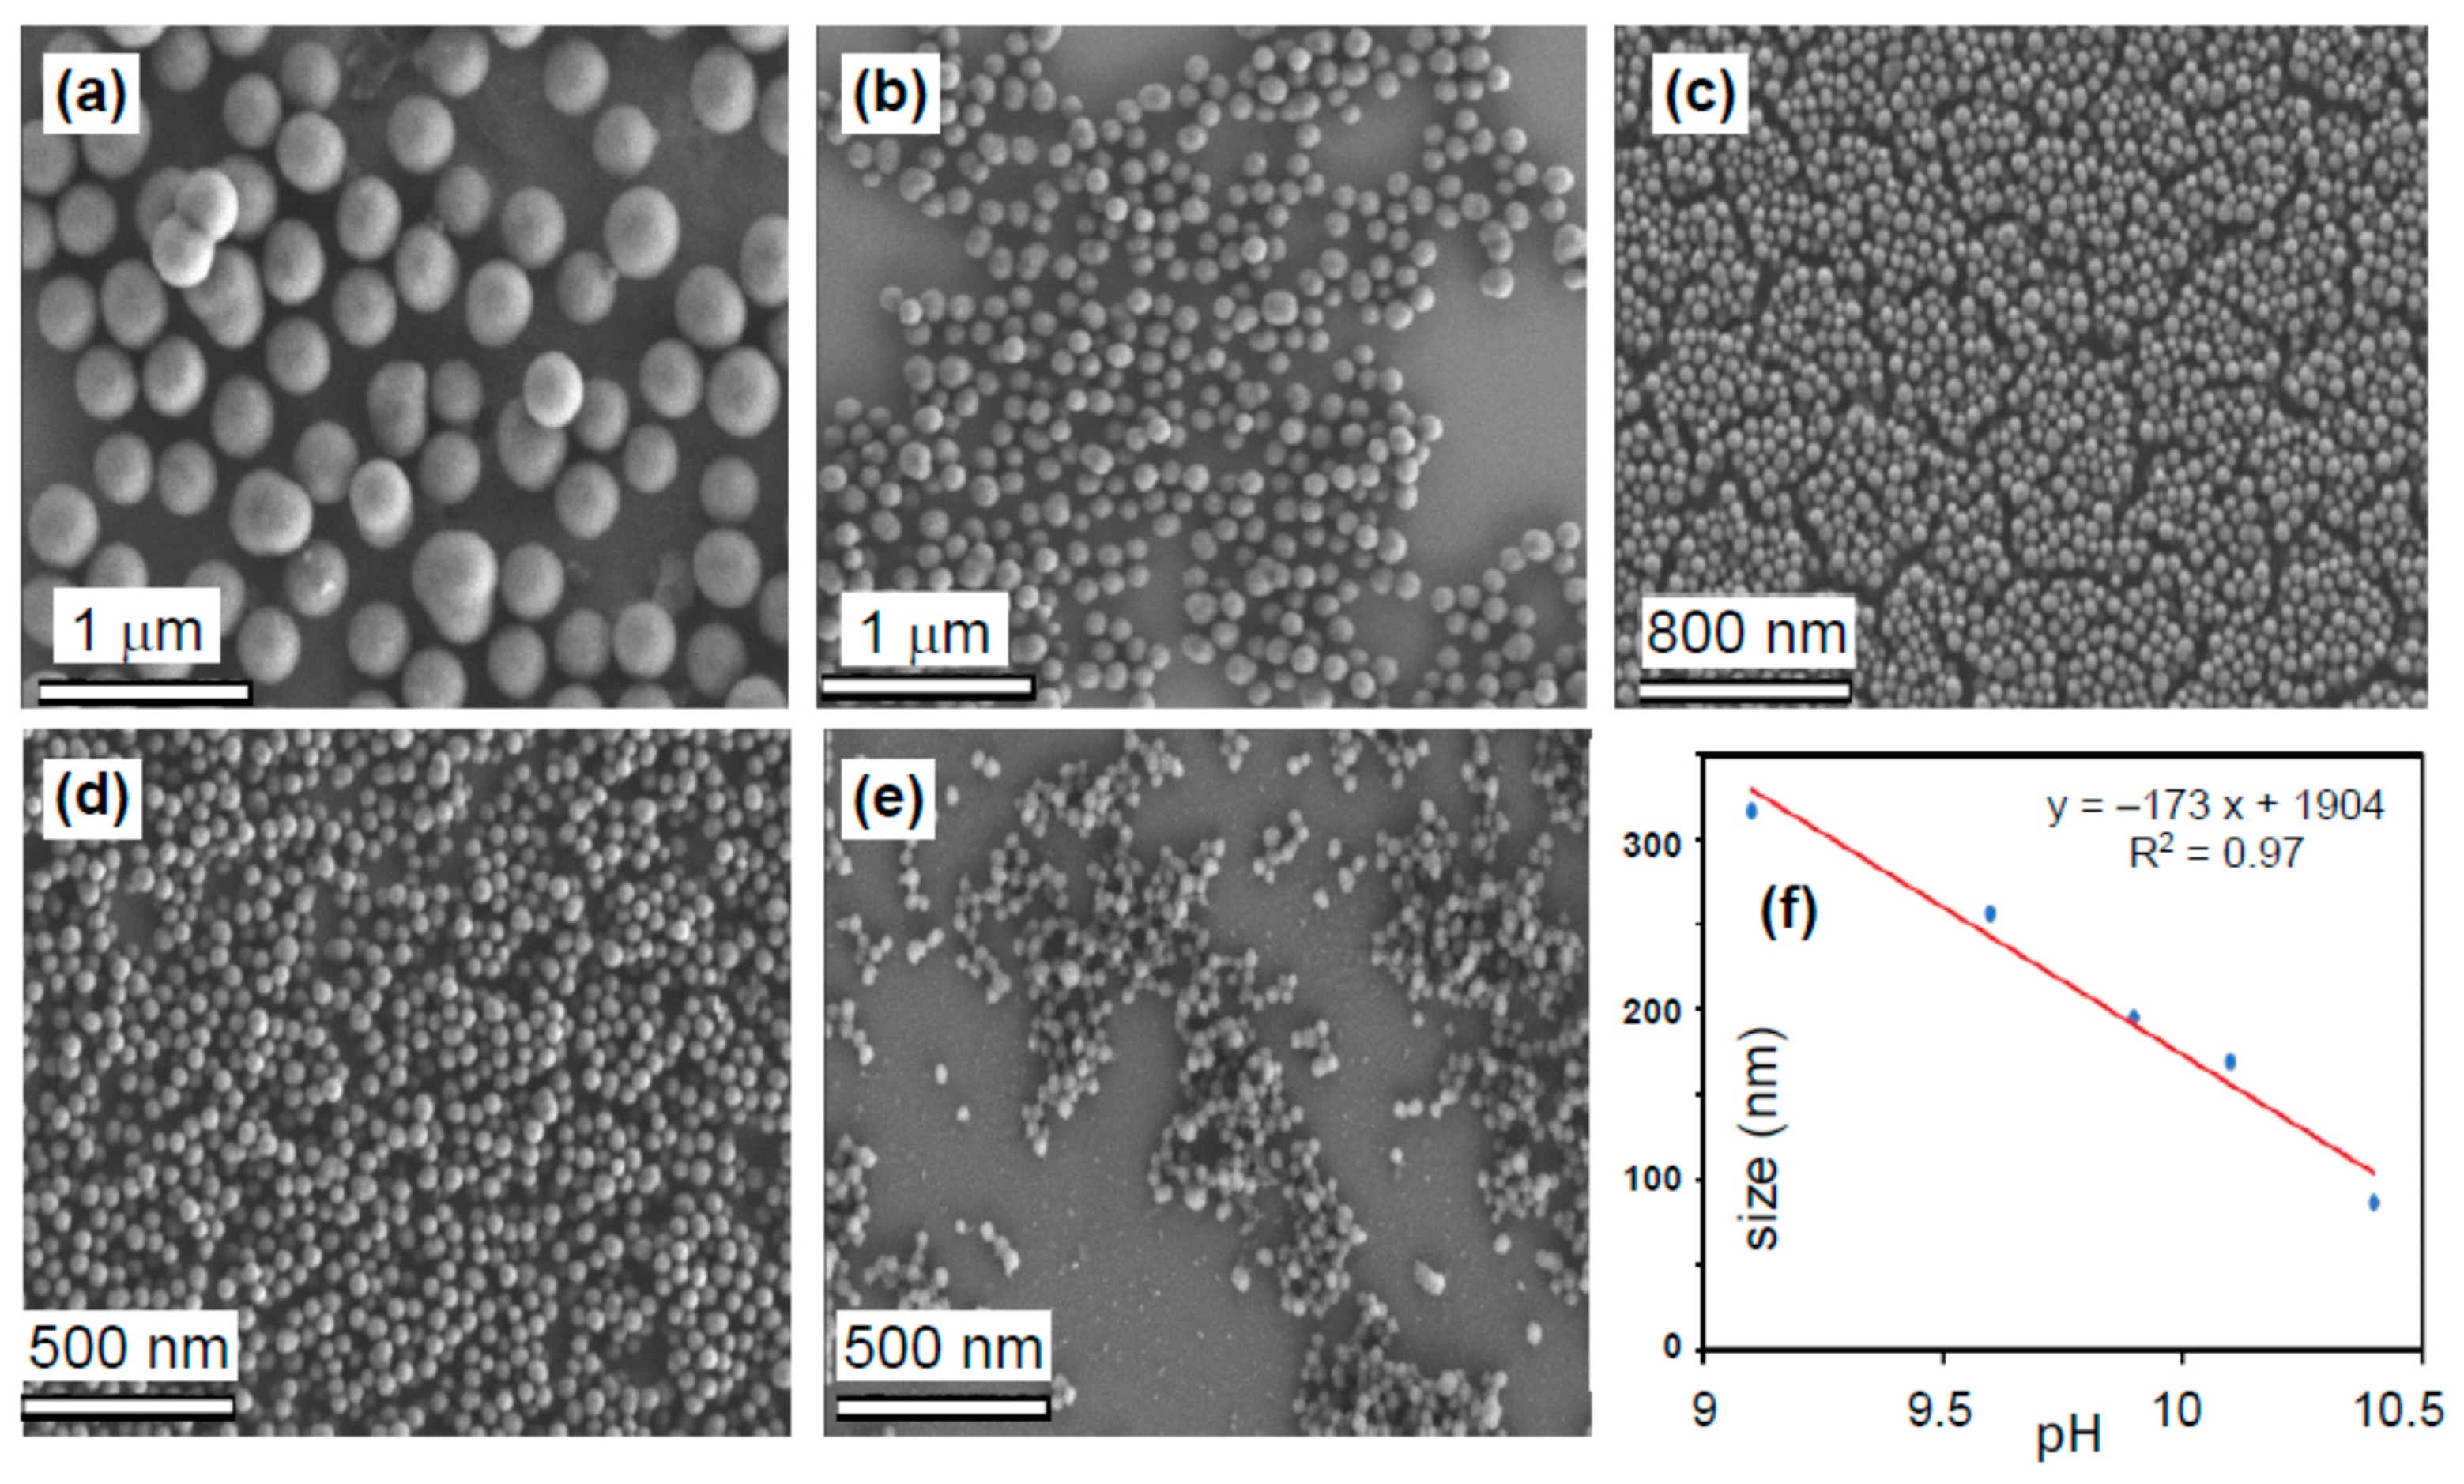
Abstract
:1. Introduction
2. Materials and Methods
2.1. Reagents
2.2. Synthesis of Melanin Nanoparticles, mNP
2.3. Preparation of Glucose-Coated Melanin Nanoparticles, mNP@G
2.4. Cell Viability Measurements
2.5. Biocompatibility and Cytotoxicity Measurements
2.6. Theoretical Estimate of the Thermal Effects
3. Results and Discussion
3.1. Characterization of mNP@G
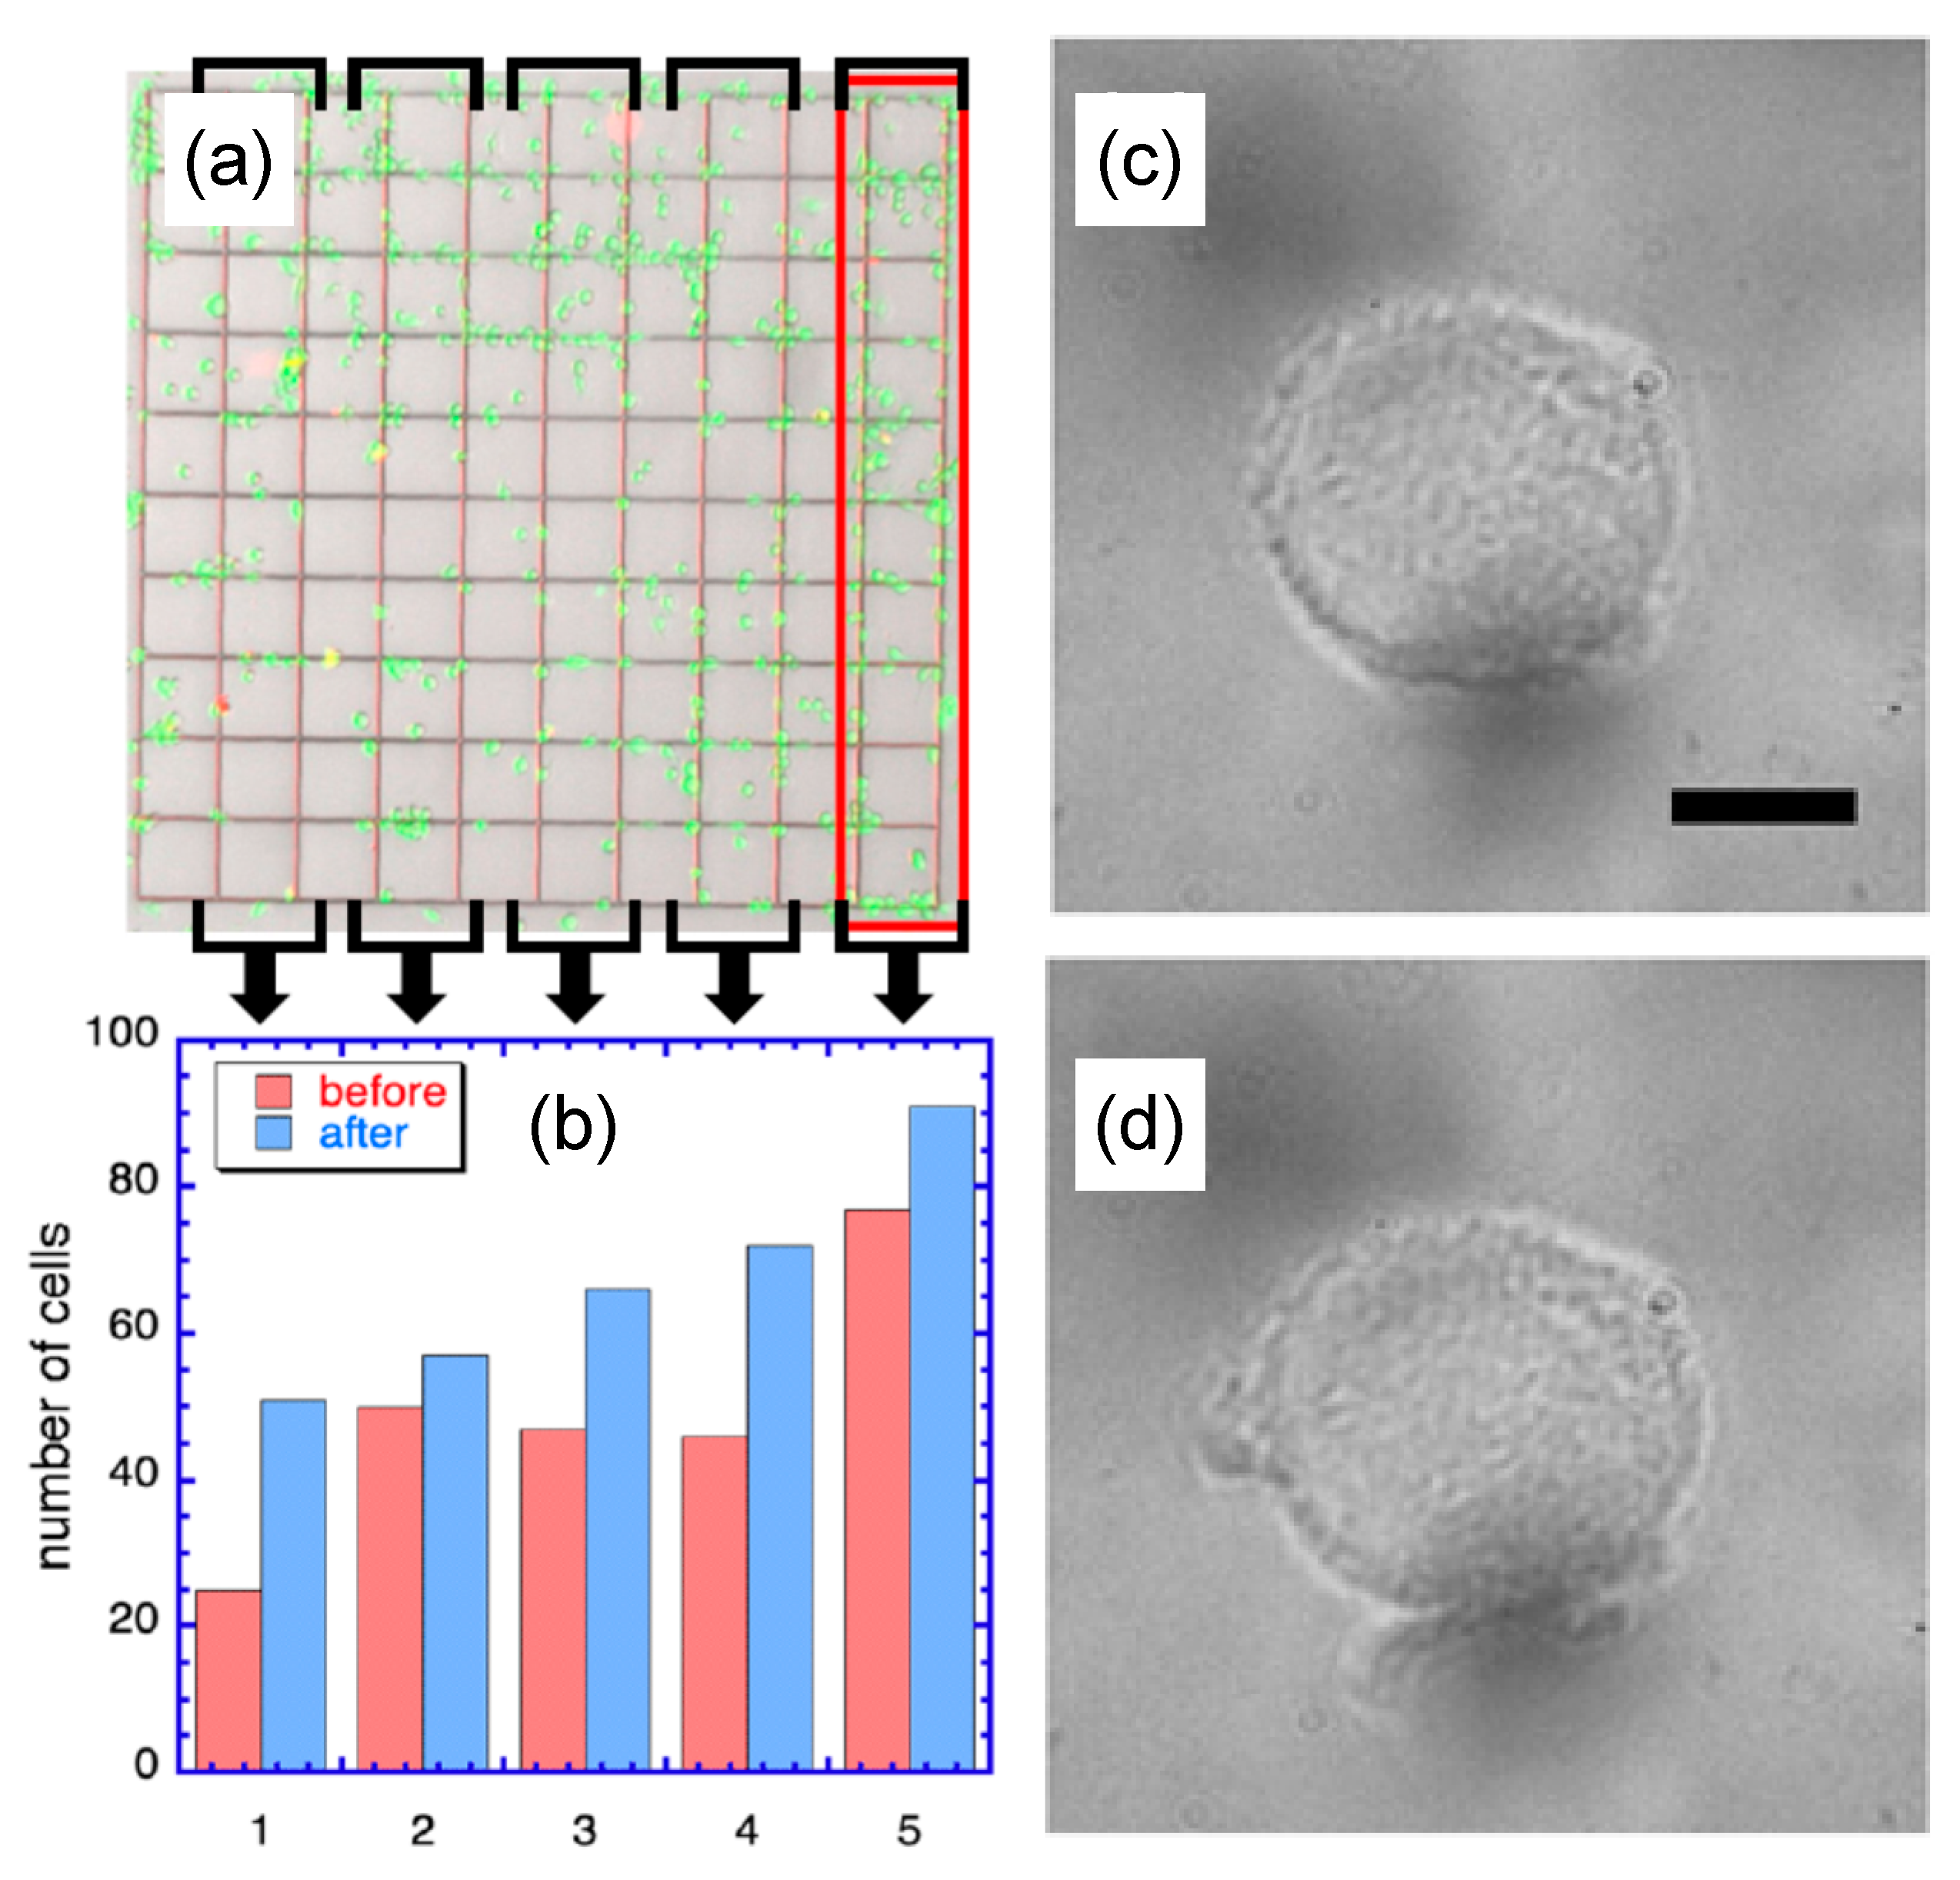
3.2. Cell Viability after mNP and mNP@G Uptake
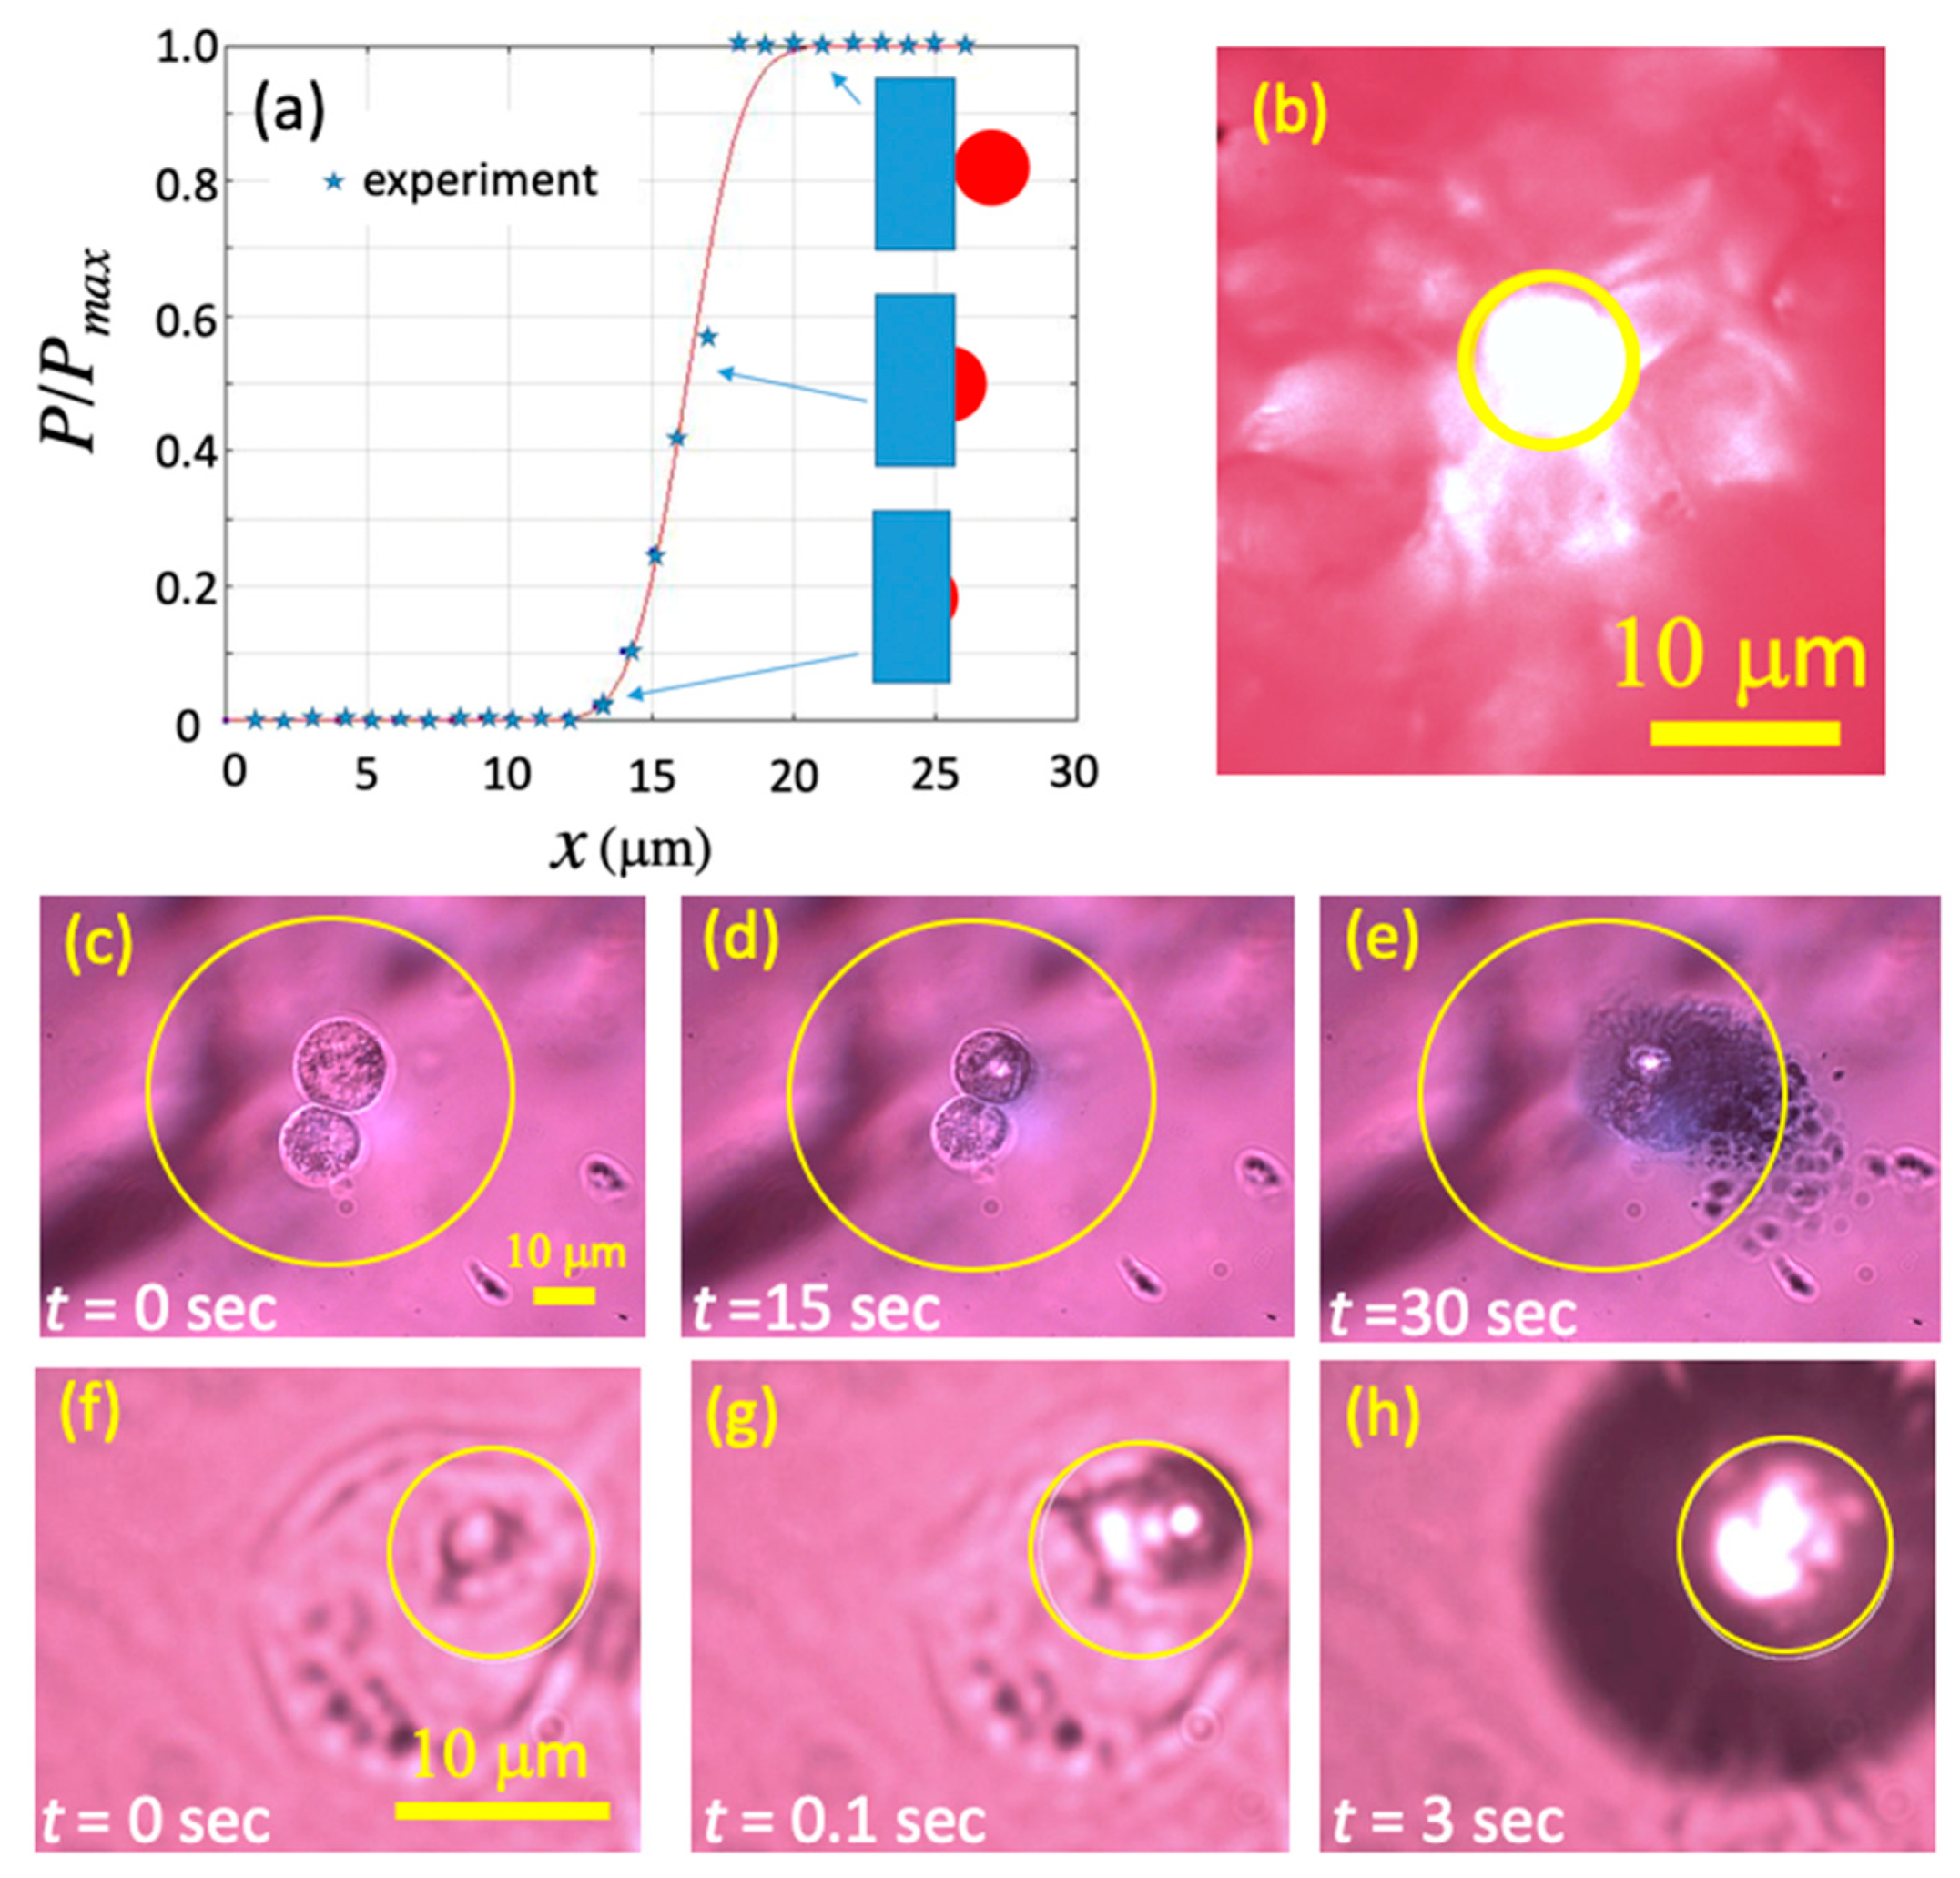
3.3. Cell Viability after Exposure to Radiation
4. Conclusions
Supplementary Materials
Author Contributions
Funding
Institutional Review Board Statement
Informed Consent Statement
Data Availability Statement
Conflicts of Interest
References
- Serpooshan, V.; Quinn, T.M.; Muja, N.; Nazhat, S.N. Hydraulic permeability of multilayered collagen gel scaffolds under plastic compression-induced unidirectional fluid flow. Acta Biomater. 2013, 9, 4673–4680. [Google Scholar] [CrossRef]
- Shi, J.; Kantoff, P.W.; Wooster, R.; Farokhzad, O.C. Cancer nanomedicine: Progress, challenges and opportunities. Nat. Rev. Cancer 2017, 17, 20–37. [Google Scholar] [CrossRef]
- Rogach, A.L.; Ogris, M. Near-infrared-emitting semiconductor quantum dots for tumor imaging and targeting. Curr. Opin. Mol. Ther. 2010, 12, 331–339. [Google Scholar]
- De La Isla, A.; Brostow, W.; Bujard, B.; Estevez, M.; Rodriguez, J.R.; Vargas, S.; Castaño, V.M. Nanohybrid scratch resistant coatings for teeth and bone viscoelasticity manifested in tribology. Mater. Res. Innov. 2003, 7, 110–114. [Google Scholar] [CrossRef]
- Versiani, A.F.; Astigarraga, R.G.; Rocha, E.S.O.; Barboza, A.P.M.; Kroon, E.G.; Rachid, M.A.; Souza, D.G.; Ladeira, L.O.; Barbosa-Stancioli, E.F.; Jorio, A.; et al. Multi-walled carbon nanotubes functionalized with recombinant Dengue virus 3 envelope proteins induce significant and specific immune responses in mice. J. Nanobiotechnol. 2017, 15, 26. [Google Scholar] [CrossRef] [Green Version]
- Chatterjee, D.K.; Diagaradjane, P.; Krishnan, S. Nanoparticle-mediated hyperthermia in cancer therapy. Ther. Deliv. 2011, 2, 1001–1014. [Google Scholar] [CrossRef] [Green Version]
- Edelstein, R.L.; Tamanaha, C.R.; Sheehan, P.E.; Miller, M.M.; Baselt, D.R.; Whitman, L.J.; Colton, R.J. The BARC biosensor applied to the detection of biological warfare agents. Biosens. Bioelectron. 2000, 14, 805–813. [Google Scholar] [CrossRef]
- Cai, D.; Ren, L.; Zhao, H.; Xu, C.; Zhang, L.; Yu, Y.; Wang, H.; Lan, Y.; Roberts, M.F.; Chuang, J.H.; et al. A molecular-imprint nanosensor for ultrasensitive detection of proteins. Nat. Nanotechnol. 2010, 5, 597–601. [Google Scholar] [CrossRef] [Green Version]
- Lai, S.K.; Hida, K.; Man, S.T.; Chen, C.; Machamer, C.; Schroer, T.A.; Hanes, J. Privileged delivery of polymer nanoparticles to the perinuclear region of live cells via a non-clathrin, non-degradative pathway. Biomaterials 2007, 28, 2876–2884. [Google Scholar] [CrossRef]
- Mahmoudi, M.; Meng, J.; Xue, X.; Liang, X.J.; Rahman, M.; Pfeiffer, C.; Hartmann, R.; Gil, P.R.; Pelaz, B.; Parak, W.J.; et al. Interaction of stable colloidal nanoparticles with cellular membranes. Biotechnol. Adv. 2014, 32, 679–692. [Google Scholar] [CrossRef] [PubMed]
- Chou, L.Y.T.; Ming, K.; Chan, W.C.W. Strategies for the intracellular delivery of nanoparticles. Chem. Soc. Rev. 2011, 40, 233–245. [Google Scholar] [CrossRef]
- Nel, A.E.; Mädler, L.; Velegol, D.; Xia, T.; Hoek, E.M.V.; Somasundaran, P.; Klaessig, F.; Castranova, V.; Thompson, M. Understanding biophysicochemical interactions at the nano-bio interface. Nat. Mater. 2009, 8, 543–557. [Google Scholar] [CrossRef]
- Hunter, R.J. Zeta Potential in Colloid Science, 1st ed.; Academic Press: San Diego, CA, USA, 1981; ISBN 9780123619617. [Google Scholar]
- Zhang, Y.; Yang, M.; Portney, N.G.; Cui, D.; Budak, G.; Ozbay, E.; Ozkan, M.; Ozkan, C.S. Zeta potential: A surface electrical characteristic to probe the interaction of nanoparticles with normal and cancer human breast epithelial cells. Biomed. Microdevices 2008, 10, 321–328. [Google Scholar] [CrossRef] [PubMed]
- Altankov, G.; Richau, K.; Groth, T. The role of surface zeta potential and substratum chemistry for regulation of dermal fibroblasts interaction. Mater. Werkst. 2003, 34, 1120–1128. [Google Scholar] [CrossRef]
- Moan, J.; Peak, M.J. Effects of UV radiation on cells. J. Photochem. Photobiol. B Biol. 1989, 4, 21–34. [Google Scholar] [CrossRef]
- Baskar, R.; Lee, K.A.; Yeo, R.; Yeoh, K.-W. Cancer and radiation therapy: Current advances and future directions. Int. J. Med. Sci. 2012, 9, 193–199. [Google Scholar] [CrossRef] [Green Version]
- Pilát, Z.; Jonáš, A.; Ježek, J.; Zemánek, P. Effects of infrared optical trapping on Saccharomyces cerevisiae in a microfluidic system. Sensors 2017, 17, 2640. [Google Scholar] [CrossRef] [Green Version]
- Rothman, L.S.; Gordon, I.E.; Babikov, Y.; Barbe, A.; Chris Benner, D.; Bernath, P.F.; Birk, M.; Bizzocchi, L.; Boudon, V.; Brown, L.R.; et al. The HITRAN2012 molecular spectroscopic database. J. Quant. Spectrosc. Radiat. Transf. 2013, 130, 4–50. [Google Scholar] [CrossRef] [Green Version]
- Gabriele, V.R.; Shvonski, A.; Hoffman, C.S.; Giersig, M.; Herczynski, A.; Naughton, M.J.; Kempa, K. Towards spectrally selective catastrophic response. Phys. Rev. E 2020, 101, 62415. [Google Scholar] [CrossRef]
- Gamage, S.; Howard, M.; Makita, H.; Cross, B.; Hastings, G.; Luo, M.; Abate, Y. Probing structural changes in single enveloped virus particles using nano-infrared spectroscopic imaging. PLoS ONE 2018, 13, e0199112. [Google Scholar] [CrossRef] [Green Version]
- Lee, S.Y.; Yoon, K.A.; Jang, S.H.; Ganbold, E.O.; Uuriintuya, D.; Shin, S.M.; Ryu, P.D.; Joo, S.W. Infrared spectroscopy characterization of normal and lung cancer cells originated from epithelium. J. Vet. Sci. 2009, 10, 299–304. [Google Scholar] [CrossRef] [PubMed] [Green Version]
- Galanzha, E.I.; Shashkov, E.V.; Spring, P.M.; Suen, J.Y.; Zharov, V.P. In vivo, noninvasive, label-free detection and eradication of circulating metastatic melanoma cells using two-color photoacoustic flow cytometry with a diode laser. Cancer Res. 2009, 69, 7926–7934. [Google Scholar] [CrossRef] [Green Version]
- Luo, X.; Mitra, D.; Sullivan, R.J.; Wittner, B.S.; Kimura, A.M.; Pan, S.; Hoang, M.P.; Brannigan, B.W.; Lawrence, D.P.; Flaherty, K.T.; et al. Isolation and molecular characterization of circulating melanoma cells. Cell Rep. 2014, 7, 645–653. [Google Scholar] [CrossRef] [Green Version]
- Vasefi, F.; MacKinnon, N.; Saager, R.; Kelly, K.M.; Maly, T.; Booth, N.; Durkin, A.J.; Farkas, D.L. Separating melanin from hemodynamics in nevi using multimode hyperspectral dermoscopy and spatial frequency domain spectroscopy. J. Biomed. Opt. 2016, 21, 114001. [Google Scholar] [CrossRef] [PubMed] [Green Version]
- Jiang, Q.; Luo, Z.; Men, Y.; Yang, P.; Peng, H.; Guo, R.; Tian, Y.; Pang, Z.; Yang, W. Red blood cell membrane-camouflaged melanin nanoparticles for enhanced photothermal therapy. Biomaterials 2017, 143, 29–45. [Google Scholar] [CrossRef]
- Slominski, A.; Kim, T.-K.; Brożyna, A.A.; Janjetovic, Z.; Brooks, D.L.P.; Schwab, L.P.; Skobowiat, C.; Jóźwicki, W.; Seagroves, T.N. The role of melanogenesis in regulation of melanoma behavior: Melanogenesis leads to stimulation of HIF-1α expression and HIF-dependent attendant pathways. Arch. Biochem. Biophys. 2014, 563, 79–93. [Google Scholar] [CrossRef] [Green Version]
- Slominski, A.; Tobin, D.J.; Shibahara, S.; Wortsman, J. Melanin pigmentation in mammalian skin and its hormonal regulation. Physiol. Rev. 2004, 84, 1155–1228. [Google Scholar] [CrossRef]
- Zhang, W.; Tang, B.; Huang, Q.; Hua, Z. Galangin inhibits tumor growth and metastasis of B16F10 melanoma. J. Cell. Biochem. 2013, 114, 152–161. [Google Scholar] [CrossRef]
- American Society of Clinical Oncology, cancer.net. 2020. Available online: https://www.cancer.net/cancer-types/melanoma/statistics (accessed on 10 March 2021).
- Suzuki, H.; Sasaki, E.; Motai, R.; Goto, S.; Nishikawa, D.; Beppu, S.; Terada, H.; Sawabe, M.; Hanai, N. Safety and efficacy of salvage neck dissection following carbon-ion radiotherapy with chemotherapy for a Patient with mucosal malignant melanoma of head and neck. Diagnostics 2020, 10, 82. [Google Scholar] [CrossRef] [Green Version]
- Cabrita, R.; Lauss, M.; Sanna, A.; Donia, M.; Skaarup Larsen, M.; Mitra, S.; Johansson, I.; Phung, B.; Harbst, K.; Vallon-Christersson, J.; et al. Tertiary lymphoid structures improve immunotherapy and survival in melanoma. Nature 2020, 577, 561–565. [Google Scholar] [CrossRef]
- Filippi, A.R.; Fava, P.; Badellino, S.; Astrua, C.; Ricardi, U.; Quaglino, P. Radiotherapy and immune checkpoints inhibitors for advanced melanoma. Radiother. Oncol. 2016, 120, 1–12. [Google Scholar] [CrossRef] [Green Version]
- Wang, J.-J.; Li, Z.-F.; Li, X.-J.; Han, Z.; Zhang, L.; Liu, Z.-J. Effects of microRNA-136 on melanoma cell proliferation, apoptosis, and epithelial-mesenchymal transition by targetting PMEL through the Wnt signaling pathway. Biosci. Rep. 2017, 37. [Google Scholar] [CrossRef] [Green Version]
- Enomoto, L.M.; Levine, E.A.; Shen, P.; Votanopoulos, K.I. Role of surgery for metastatic melanoma. Surg. Clin. N. Am. 2020, 100, 127–139. [Google Scholar] [CrossRef]
- Hocker, T.L.; Singh, M.K.; Tsao, H. Melanoma genetics and therapeutic approaches in the 21st century: Moving from the benchside to the bedside. J. Investig. Dermatol. 2008, 128, 2575–2595. [Google Scholar] [CrossRef] [Green Version]
- Pisano, M.; Pagnan, G.; Loi, M.; Mura, M.E.; Tilocca, M.G.; Palmieri, G.; Fabbri, D.; Dettori, M.A.; Delogu, G.; Ponzoni, M.; et al. Antiproliferative and pro-apoptotic activity of eugenol-related biphenyls on malignant melanoma cells. Mol. Cancer 2007, 6, 8. [Google Scholar] [CrossRef] [Green Version]
- Slominski, R.M.; Zmijewski, M.A.; Slominski, A.T. The role of melanin pigment in melanoma. Exp. Dermatol. 2015, 24, 258–259. [Google Scholar] [CrossRef] [Green Version]
- Brożyna, A.A.; Jóźwicki, W.; Roszkowski, K.; Filipiak, J.; Slominski, A.T. Melanin content in melanoma metastases affects the outcome of radiotherapy. Oncotarget 2016, 7, 17844–17853. [Google Scholar] [CrossRef] [Green Version]
- Lazova, R.; Pawelek, J.M. Why do melanomas get so dark? Exp. Dermatol. 2009, 18, 934–938. [Google Scholar] [CrossRef]
- Sarna, M.; Zadlo, A.; Hermanowicz, P.; Madeja, Z.; Burda, K.; Sarna, T. Cell elasticity is an important indicator of the metastatic phenotype of melanoma cells. Exp. Dermatol. 2014, 23, 813–818. [Google Scholar] [CrossRef]
- Sarna, M.; Krzykawska-Serda, M.; Jakubowska, M.; Zadlo, A.; Urbanska, K. Melanin presence inhibits melanoma cell spread in mice in a unique mechanical fashion. Sci. Rep. 2019, 9, 9280. [Google Scholar] [CrossRef]
- Sandulache, V.C.; Ow, T.J.; Pickering, C.R.; Frederick, M.J.; Zhou, G.; Fokt, I.; Davis-Malesevich, M.; Priebe, W.; Myers, J.N. Glucose, not glutamine, is the dominant energy source required for proliferation and survival of head and neck squamous carcinoma cells. Cancer 2011, 117, 2926–2938. [Google Scholar] [CrossRef]
- Han, L.; Ma, Q.; Li, J.; Liu, H.; Li, W.; Ma, G.; Xu, Q.; Zhou, S.; Wu, E. High glucose promotes pancreatic cancer cell proliferation via the induction of EGF expression and transactivation of EGFR. PLoS ONE 2011, 6, e27074. [Google Scholar] [CrossRef]
- Lee, C.; Longo, V.D. Fasting vs dietary restriction in cellular protection and cancer treatment: From model organisms to patients. Oncogene 2011, 30, 3305–3316. [Google Scholar] [CrossRef] [Green Version]
- De Lorenzo, M.S.; Baljinnyam, E.; Vatner, D.E.; Abarzúa, P.; Vatner, S.F.; Rabson, A.B. Caloric restriction reduces growth of mammary tumors and metastases. Carcinogenesis 2011, 32, 1381–1387. [Google Scholar] [CrossRef] [Green Version]
- Da Silva, L.P.; Oliveira, S.; Pirraco, R.P.; Santos, T.C.; Reis, R.L.; Marques, A.P.; Correlo, V.M. Eumelanin-releasing spongy-like hydrogels for skin re-epithelialization purposes. Biomed. Mater. 2017, 12, 25010. [Google Scholar] [CrossRef]
- Scognamiglio, F.; Travan, A.; Turco, G.; Borgogna, M.; Marsich, E.; Pasqua, M.; Paoletti, S.; Donati, I. Adhesive coatings based on melanin-like nanoparticles for surgical membranes. Colloids Surf. B Biointerfaces 2017, 155, 553–559. [Google Scholar] [CrossRef]
- Perring, J.; Crawshay-Williams, F.; Huang, C.; Townley, H.E. Bio-inspired melanin nanoparticles induce cancer cell death by iron adsorption. J. Mater. Sci. Mater. Med. 2018, 29, 181. [Google Scholar] [CrossRef] [Green Version]
- Liopo, A.; Su, R.; Oraevsky, A.A. Melanin nanoparticles as a novel contrast agent for optoacoustic tomography. Photoacoustics 2015, 3, 35–43. [Google Scholar] [CrossRef] [Green Version]
- Madhusudhan, D.N.; Mazhari, B.B.Z.; Dastager, S.G.; Agsar, D. Production and cytotoxicity of extracellular insoluble and droplets of soluble melanin by Streptomyces lusitanus DMZ-3. BioMed Res. Int. 2014, 2014, 306895. [Google Scholar] [CrossRef] [PubMed]


Publisher’s Note: MDPI stays neutral with regard to jurisdictional claims in published maps and institutional affiliations. |
© 2021 by the authors. Licensee MDPI, Basel, Switzerland. This article is an open access article distributed under the terms and conditions of the Creative Commons Attribution (CC BY) license (https://creativecommons.org/licenses/by/4.0/).
Share and Cite
Gabriele, V.R.; Mazhabi, R.M.; Alexander, N.; Mukherjee, P.; Seyfried, T.N.; Nwaji, N.; Akinoglu, E.M.; Mackiewicz, A.; Zhou, G.; Giersig, M.; et al. Light- and Melanin Nanoparticle-Induced Cytotoxicity in Metastatic Cancer Cells. Pharmaceutics 2021, 13, 965. https://doi.org/10.3390/pharmaceutics13070965
Gabriele VR, Mazhabi RM, Alexander N, Mukherjee P, Seyfried TN, Nwaji N, Akinoglu EM, Mackiewicz A, Zhou G, Giersig M, et al. Light- and Melanin Nanoparticle-Induced Cytotoxicity in Metastatic Cancer Cells. Pharmaceutics. 2021; 13(7):965. https://doi.org/10.3390/pharmaceutics13070965
Chicago/Turabian StyleGabriele, Victoria R., Robabeh M. Mazhabi, Natalie Alexander, Purna Mukherjee, Thomas N. Seyfried, Njemuwa Nwaji, Eser M. Akinoglu, Andrzej Mackiewicz, Guofu Zhou, Michael Giersig, and et al. 2021. "Light- and Melanin Nanoparticle-Induced Cytotoxicity in Metastatic Cancer Cells" Pharmaceutics 13, no. 7: 965. https://doi.org/10.3390/pharmaceutics13070965
APA StyleGabriele, V. R., Mazhabi, R. M., Alexander, N., Mukherjee, P., Seyfried, T. N., Nwaji, N., Akinoglu, E. M., Mackiewicz, A., Zhou, G., Giersig, M., Naughton, M. J., & Kempa, K. (2021). Light- and Melanin Nanoparticle-Induced Cytotoxicity in Metastatic Cancer Cells. Pharmaceutics, 13(7), 965. https://doi.org/10.3390/pharmaceutics13070965