
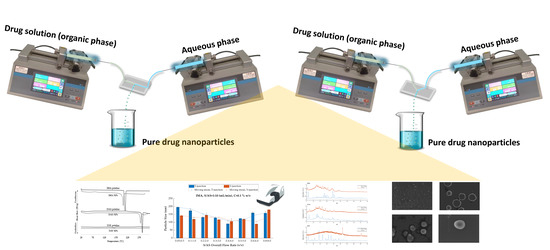
Excipient-Free Pure Drug Nanoparticles Fabricated by Microfluidic Hydrodynamic Focusing


Abstract
1. Introduction
2. Materials and Methods
2.1. Materials
2.2. Components of the Microfluidic System
2.3. Methods
2.3.1. Design and Assembly of the Microfluidic Device
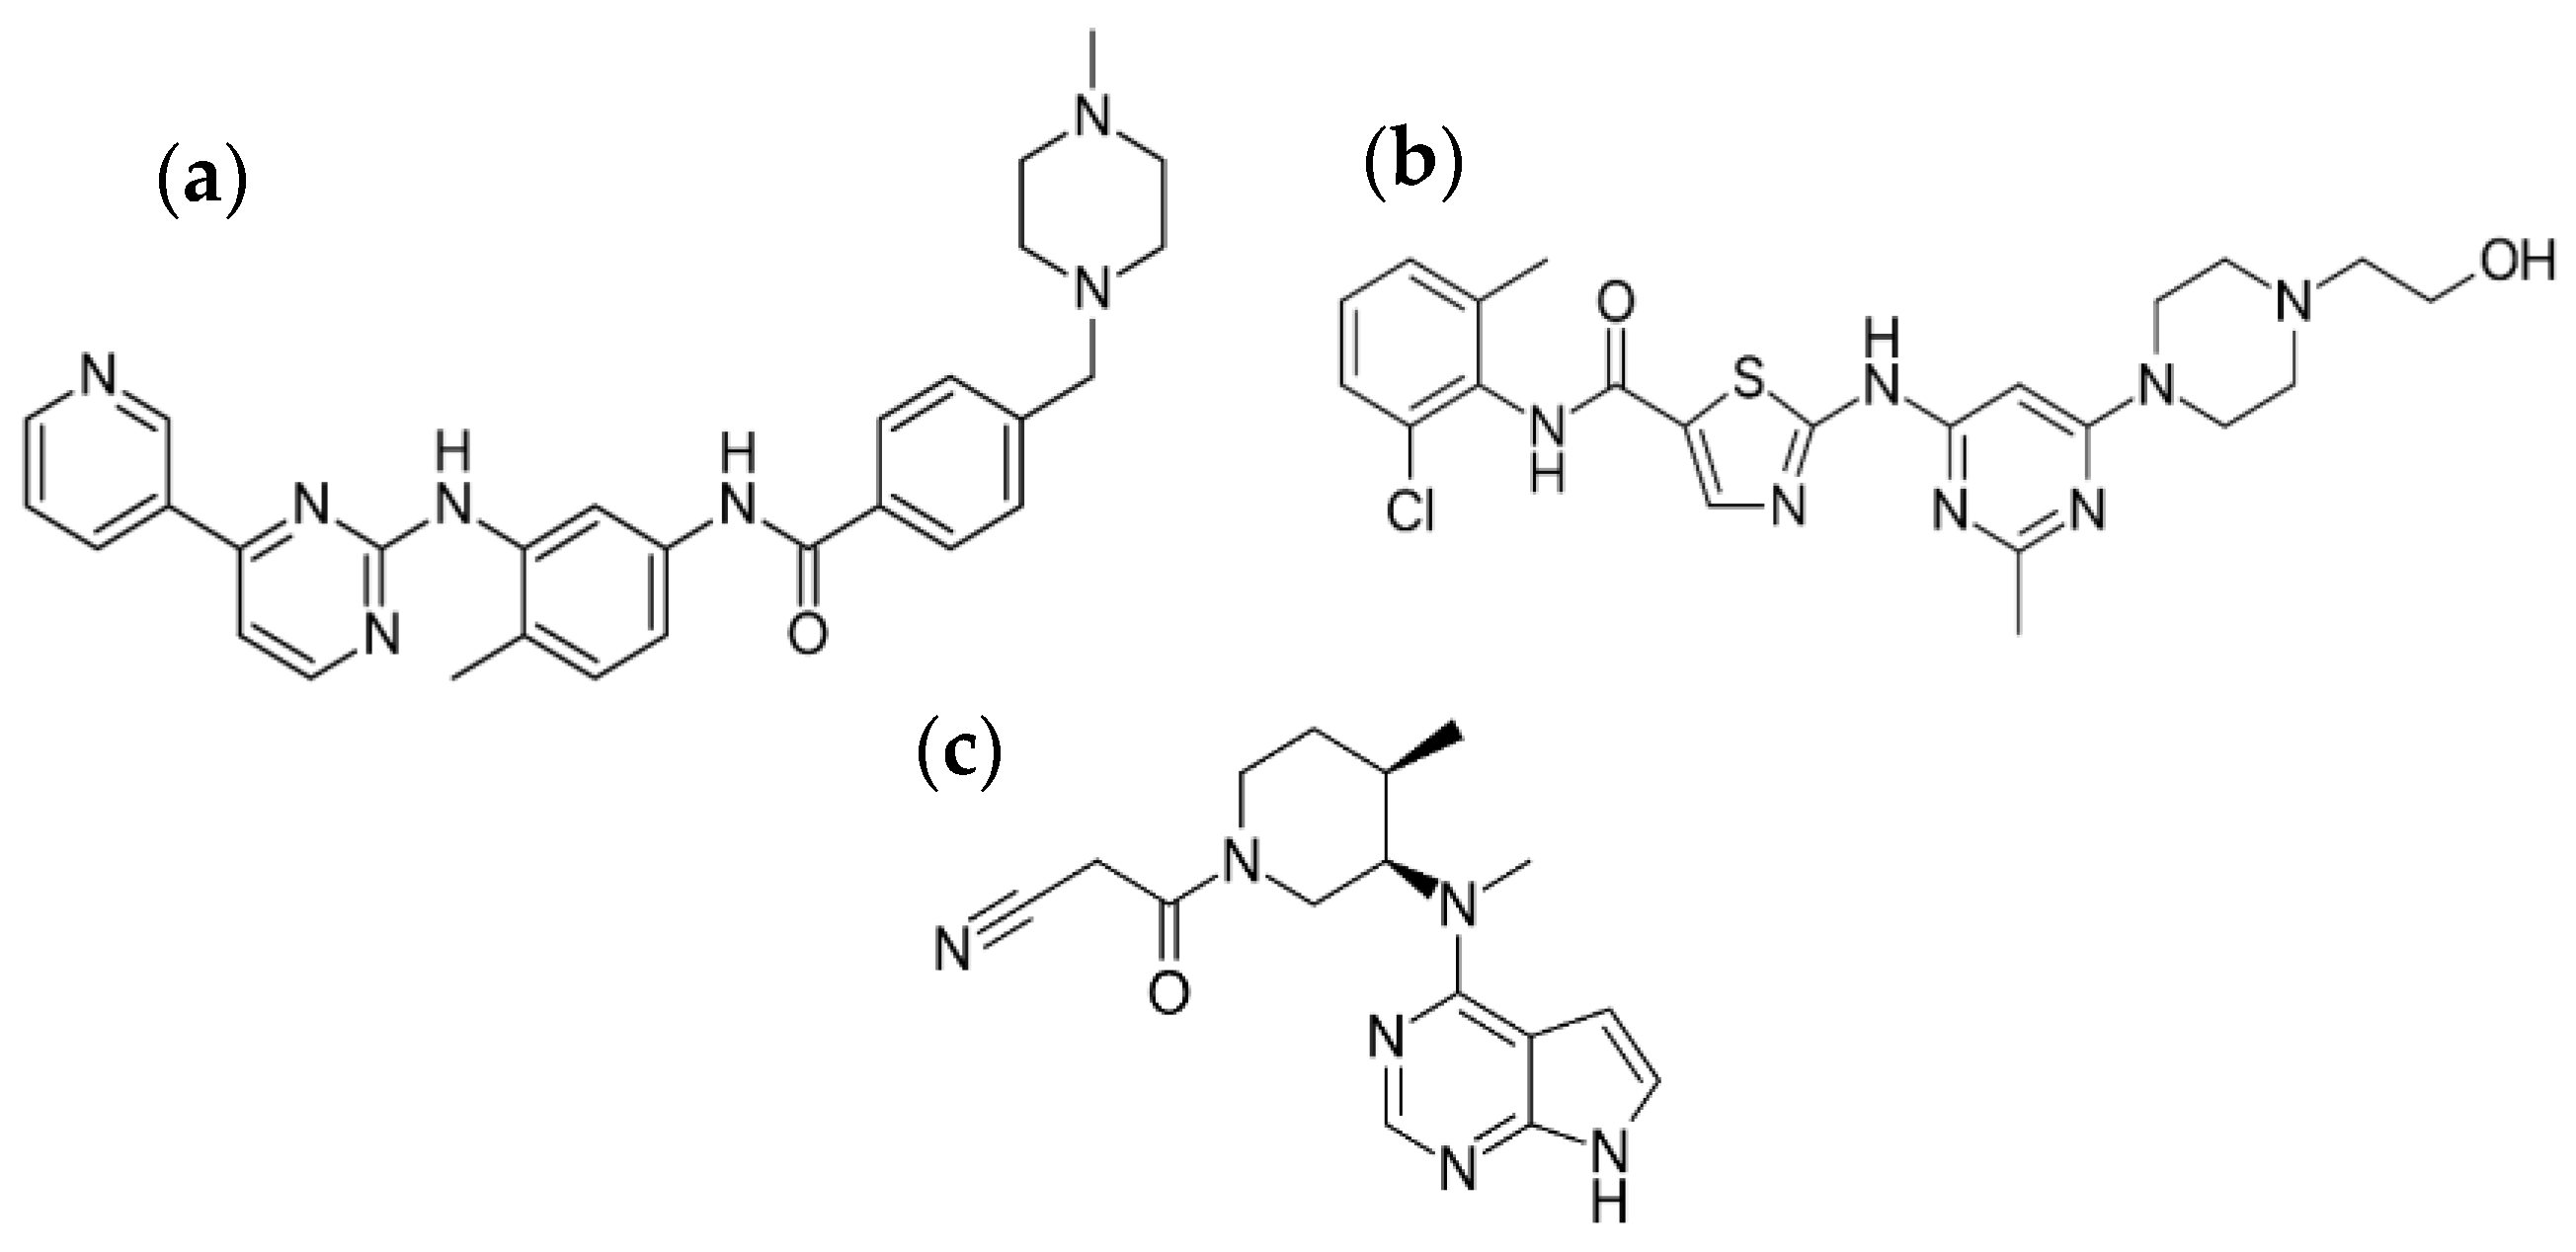
2.3.2. Production of Pure Additive-Free Kinase Inhibitor Nanoparticles
2.3.3. Characterization of Pristine Drugs and Pure Drug Nanoparticles
3. Results and Discussion
3.1. Rationale
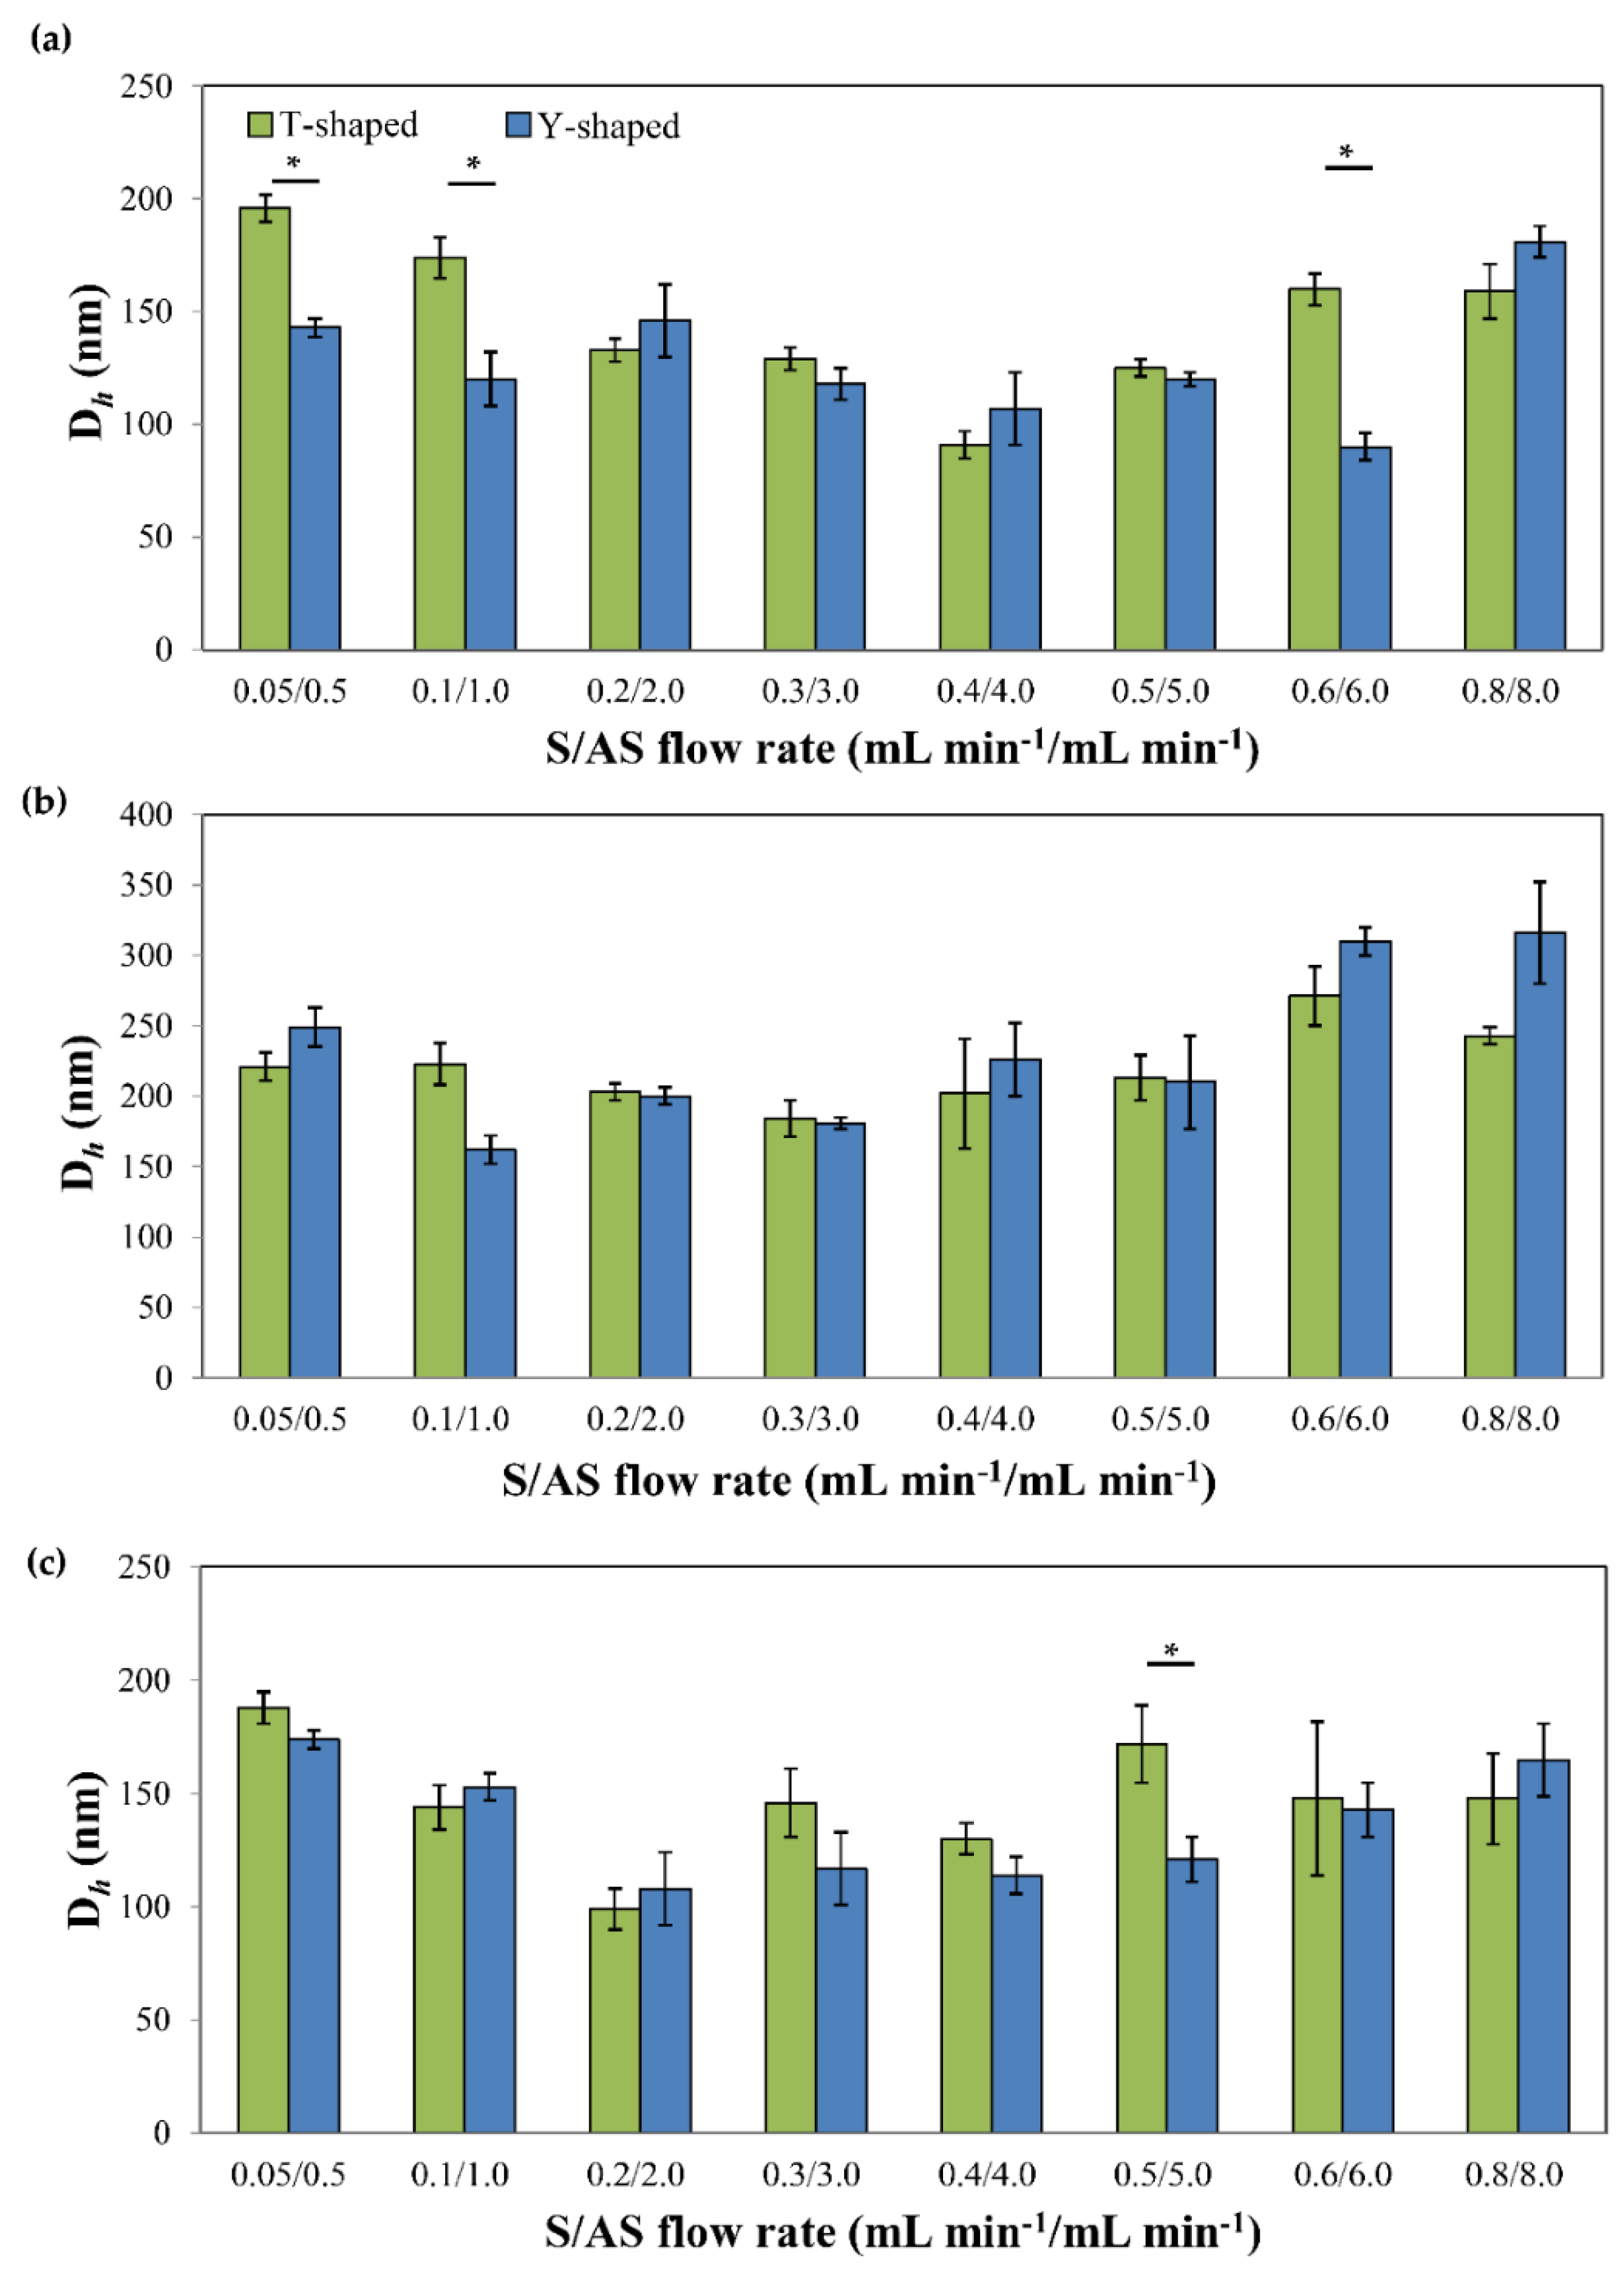
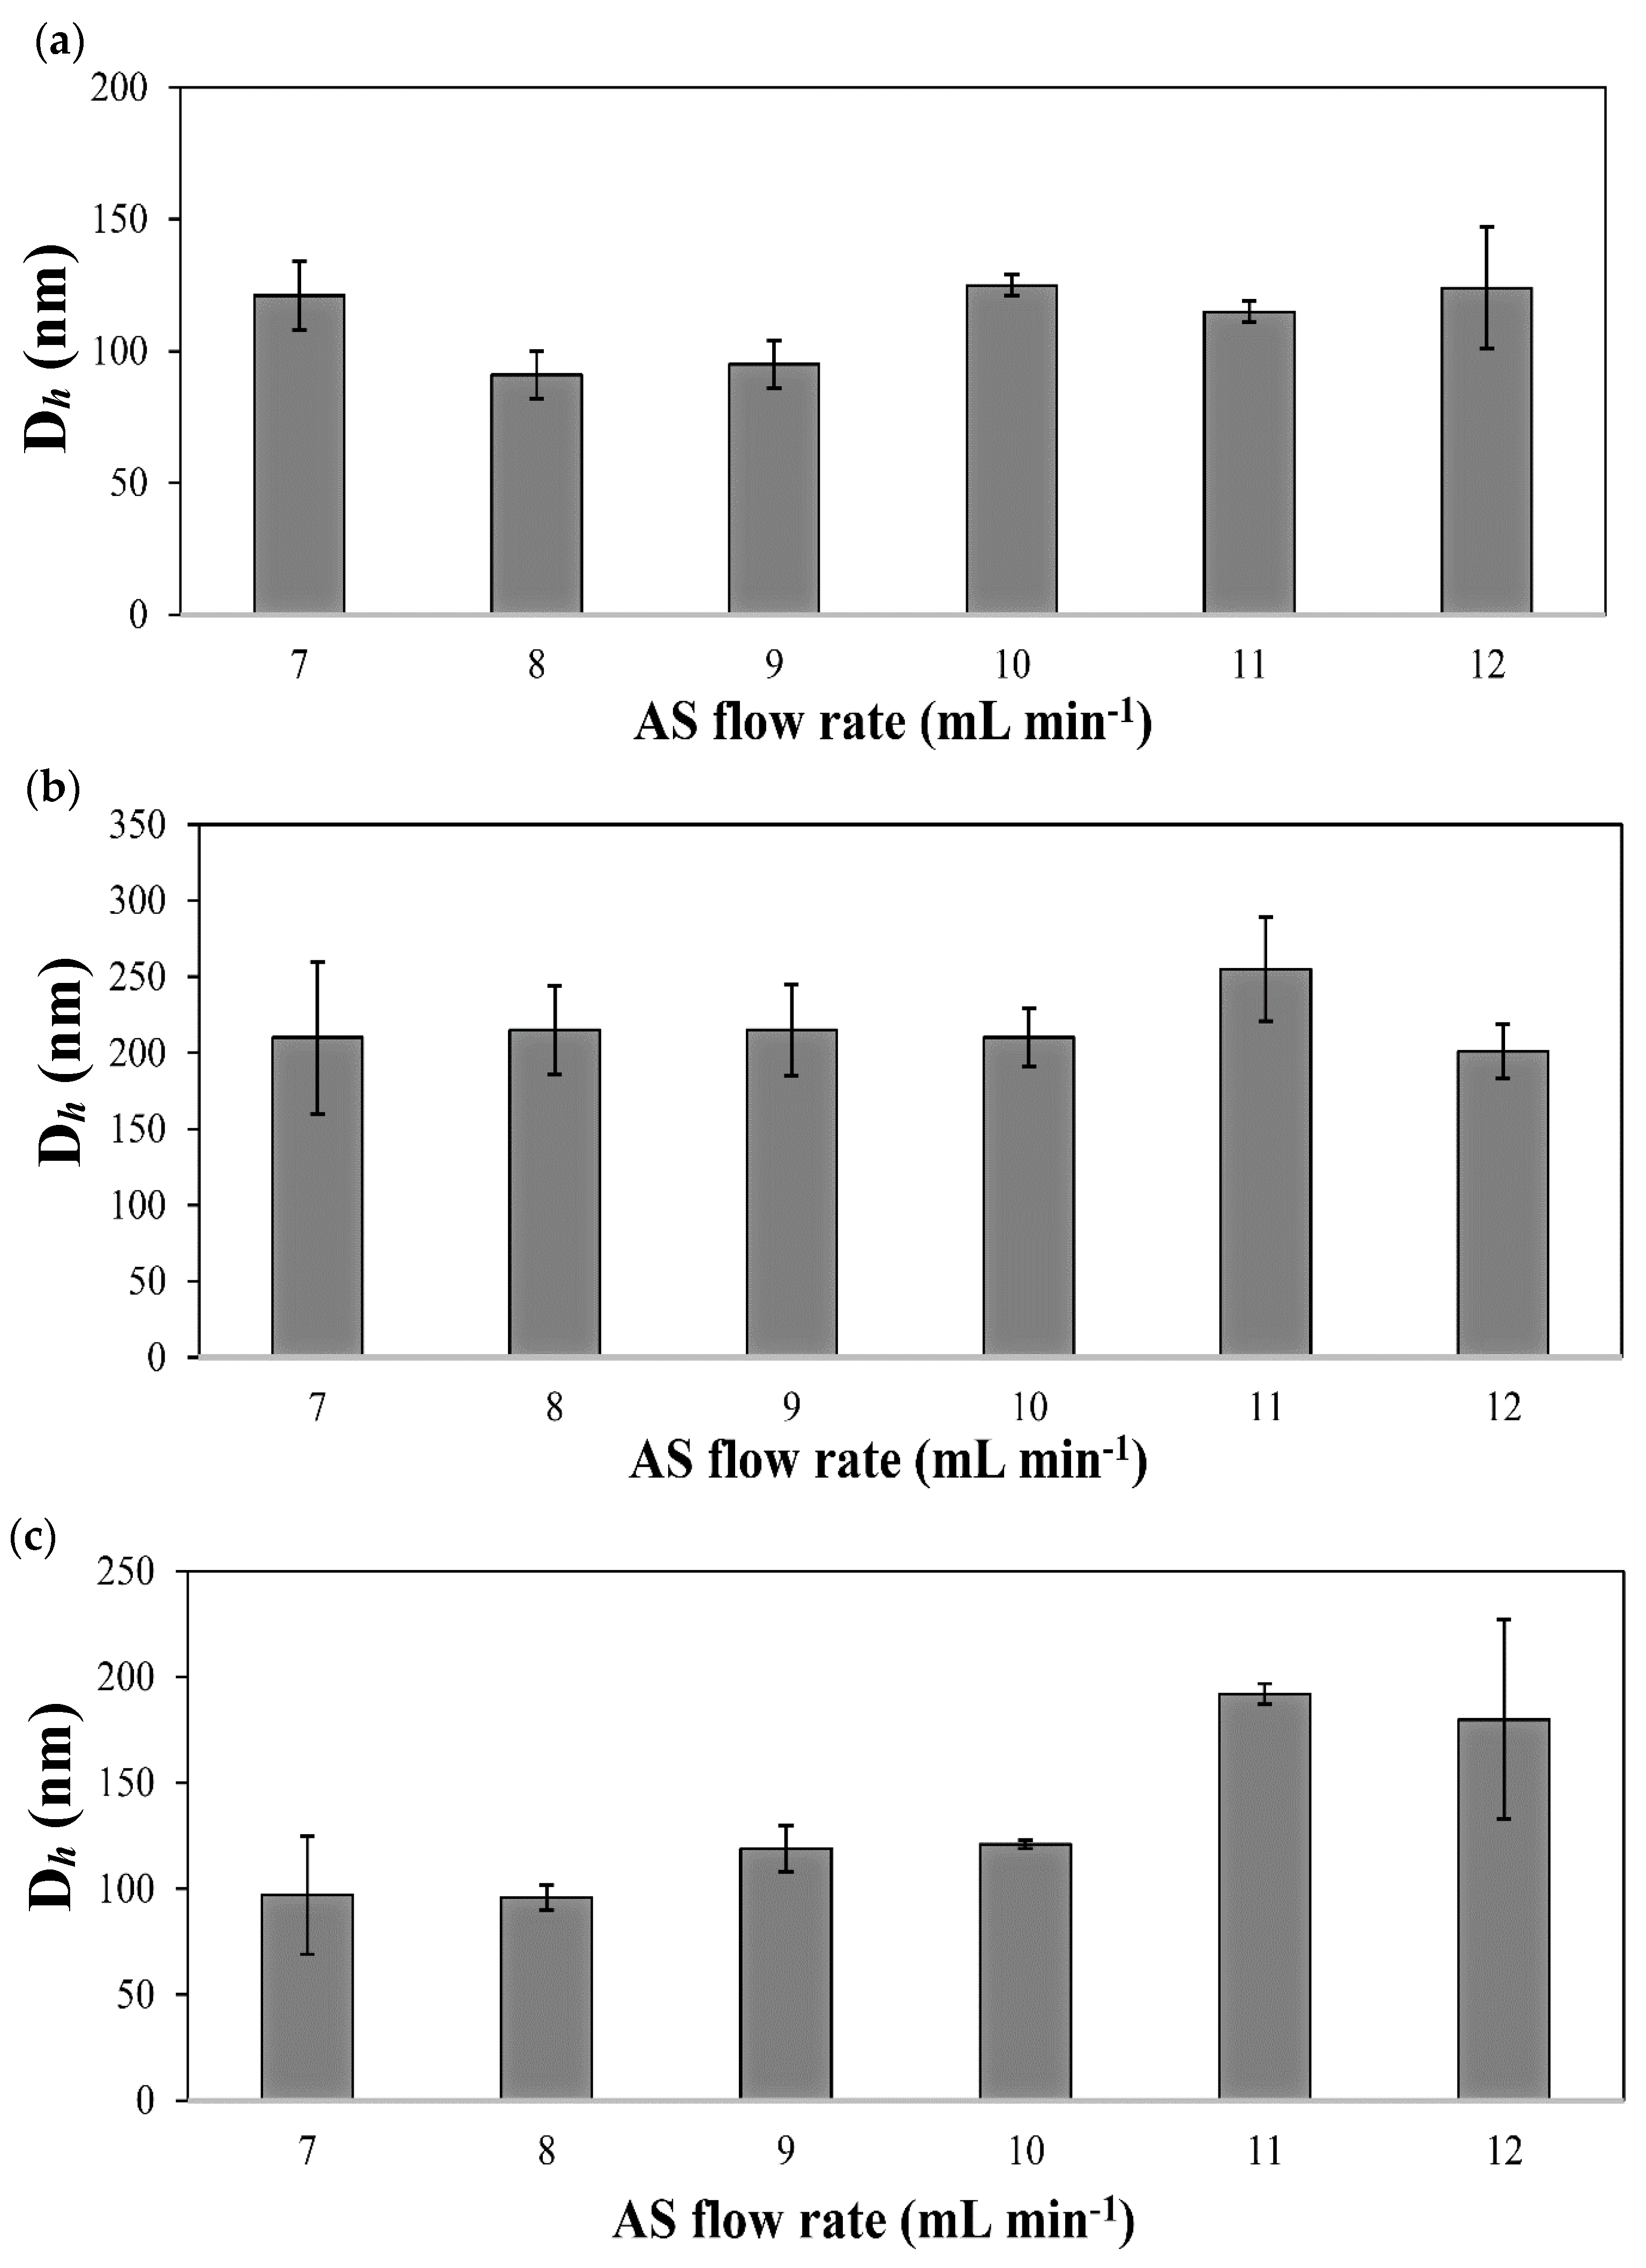
3.2. Production and Characterization of Additive-Free Pure Kinase Inhibitor Nanoparticles
4. Conclusions
Author Contributions
Funding
Institutional Review Board Statement
Informed Consent Statement
Data Availability Statement
Conflicts of Interest
References
- Müller, R. Junghanns Nanocrystal technology, drug delivery and clinical applications. Int. J. Nanomed. 2008, 3, 295. [Google Scholar] [CrossRef]
- Calderón, M.; Sosnik, A. Polymeric soft nanocarriers as smart drug delivery systems: State-of-the-art and future perspectives. Biotechnol. Adv. 2015, 33, 1277–1278. [Google Scholar] [CrossRef]
- Alvarez-Lorenzo, C.; Concheiro, A. Smart drug delivery systems: From fundamentals to the clinic. Chem. Commun. 2014, 50, 7743–7765. [Google Scholar] [CrossRef]
- Gao, L.; Zhang, D.; Chen, M. Drug nanocrystals for the formulation of poorly soluble drugs and its application as a potential drug delivery system. J. Nanopart. Res. 2008, 10, 845–862. [Google Scholar] [CrossRef]
- Gigliobianco, M.R.; Casadidio, C.; Censi, R.; Di Martino, P. Nanocrystals of poorly soluble drugs: Drug bioavailability and physicochemical stability. Pharmaceutics 2018, 10, 134. [Google Scholar] [CrossRef] [PubMed]
- Benet, L.Z. The role of BCS (biopharmaceutics classification system) and BDDCS (biopharmaceutics drug disposition classification system) in drug development. J. Pharm. Sci. 2013, 102, 34–42. [Google Scholar] [CrossRef] [PubMed]
- Mehta, M.U.; Uppoor, R.S.; Conner, D.P.; Seo, P.; Vaidyanathan, J.; Volpe, D.A.; Stier, E.; Chilukuri, D.; Dorantes, A.; Ghosh, T.; et al. Impact of the US FDA “Biopharmaceutics Classification System” (BCS) guidance on global drug development. Mol. Pharm. 2017, 14, 4334–4338. [Google Scholar] [CrossRef] [PubMed]
- Müller, R.H.; Keck, C.M. Twenty years of drug nanocrystals: Where are we, and where do we go? Eur. J. Pharm. Biopharm. 2012, 80, 1–3. [Google Scholar] [CrossRef]
- D’Addio, S.M.; Prud’homme, R.K. Controlling drug nanoparticle formation by rapid precipitation. Adv. Drug Deliv. Rev. 2011, 63, 417–426. [Google Scholar] [CrossRef]
- Sinha, B.; Müller, R.H.; Möschwitzer, J.P. Bottom-up approaches for preparing drug nanocrystals: Formulations and factors affecting particle size. Int. J. Pharm. 2013, 453, 126–141. [Google Scholar] [CrossRef]
- Paul, S.M.; Mytelka, D.S.; Dunwiddie, C.T.; Persinger, C.C.; Munos, B.H.; Lindborg, S.R.; Schacht, A.L. How to improve RD productivity: The pharmaceutical industry’s grand challenge. Nat. Rev. Drug Discov. 2010, 9, 203–214. [Google Scholar] [CrossRef]
- Scannell, J.W.; Blanckley, A.; Boldon, H.; Warrington, B. Diagnosing the decline in pharmaceutical R&D efficiency. Nat. Rev. Drug Discov. 2012, 11, 191–200. [Google Scholar]
- Sosnik, A.; Augustine, R. Challenges in oral drug delivery of antiretrovirals and the innovative strategies to overcome them. Adv. Drug Deliv. Rev. 2016, 103, 105–120. [Google Scholar] [CrossRef] [PubMed]
- Rabinow, B.E. Nanosuspensions in drug delivery. Nat. Rev. Drug Discov. 2004, 3, 785–796. [Google Scholar] [CrossRef] [PubMed]
- Sverdlov Arzi, R.; Sosnik, A. Electrohydrodynamic atomization and spray-drying for the production of pure drug nanocrystals and co-crystals. Adv. Drug Deliv. Rev. 2018, 131, 79–100. [Google Scholar] [CrossRef] [PubMed]
- Müller, R.H.; Gohla, S.; Keck, C.M. State of the art of nanocrystals—Special features, production, nanotoxicology aspects and intracellular delivery. Eur. J. Pharm. Biopharm. 2011, 78, 1–9. [Google Scholar] [CrossRef]
- Baba, K.; Nishida, K. Steroid nanocrystals prepared using the nano spray dryer B-90. Pharmaceutics 2013, 5, 107–114. [Google Scholar] [CrossRef] [PubMed]
- Jinno, J.I.; Kamada, N.; Miyake, M.; Yamada, K.; Mukai, T.; Odomi, M.; Toguchi, H.; Liversidge, G.G.; Higaki, K.; Kimura, T. Effect of particle size reduction on dissolution and oral absorption of a poorly water-soluble drug, cilostazol, in beagle dogs. J. Control. Release 2006, 111, 56–64. [Google Scholar] [CrossRef]
- Merisko-Liversidge, E.; Liversidge, G.G.; Cooper, E.R. Nanosizing: A formulation approach for poorly-water-soluble compounds. Eur. J. Pharm. Sci. 2003, 18, 113–120. [Google Scholar] [CrossRef]
- Keck, C.M.; Müller, R.H. Drug nanocrystals of poorly soluble drugs produced by high pressure homogenisation. Eur. J. Pharm. Biopharm. 2006, 62, 3–16. [Google Scholar] [CrossRef]
- Kesisoglou, F.; Panmai, S.; Wu, Y. Nanosizing—Oral formulation development and biopharmaceutical evaluation. Adv. Drug Deliv. Rev. 2007, 59, 631–644. [Google Scholar] [CrossRef] [PubMed]
- Zhang, H.X.; Wang, J.X.; Shao, L.; Chen, J.F. Microfluidic fabrication of monodispersed pharmaceutical colloidal spheres of atorvastatin calcium with tunable sizes. Ind. Eng. Chem. Res. 2010, 49, 4156–4161. [Google Scholar] [CrossRef]
- El-Say, K.M.; El-Sawy, H.S. Polymeric nanoparticles: Promising platform for drug delivery. Int. J. Pharm. 2017, 528, 675–691. [Google Scholar] [CrossRef] [PubMed]
- Fontana, F.; Figueiredo, P.; Zhang, P.; Hirvonen, J.T.; Liu, D.; Santos, H.A. Production of pure drug nanocrystals and nano co-crystals by confinement methods. Adv. Drug Deliv. Rev. 2018, 131, 3–21. [Google Scholar] [CrossRef] [PubMed]
- De Waard, H.; Frijlink, H.W.; Hinrichs, W.L.J. Bottom-up preparation techniques for nanocrystals of lipophilic drugs. Pharm. Res. 2011, 28, 1220–1223. [Google Scholar] [CrossRef] [PubMed]
- Shan, N.; Zaworotko, M.J. The role of cocrystals in pharma. Drug Discov. Today 2008, 13, 440–446. [Google Scholar] [CrossRef]
- Liu, D.; Zhang, H.; Fontana, F.; Hirvonen, J.T.; Santos, H.A. Current developments and applications of microfluidic technology toward clinical translation of nanomedicines. Adv. Drug Deliv. Rev. 2018, 128, 54–83. [Google Scholar] [CrossRef]
- Imperiale, J.C.; Bevilacqua, G.; De Rosa, P.T.V.; Sosnik, A. Production of pure indinavir free base nanoparticles by a supercritical anti-solvent (SAS) method. Drug Dev. Ind. Pharm. 2014, 40, 1607–1615. [Google Scholar] [CrossRef]
- Imperiale, J.C.; Nejamkin, P.; del Sole, M.J.; Lanusse, C.E.; Sosnik, A. Novel protease inhibitor-loaded Nanoparticle-in-Microparticle Delivery System leads to a dramatic improvement of the oral pharmacokinetics in dogs. Biomaterials 2015, 37, 383–394. [Google Scholar] [CrossRef]
- Augustine, R.; Ashkenazi, D.L.; Arzi, R.S.; Zlobin, V.; Shofti, R.; Sosnik, A. Nanoparticle-in-microparticle oral drug delivery system of a clinically relevant darunavir/ritonavir antiretroviral combination. Acta Biomater. 2018, 74, 344–359. [Google Scholar] [CrossRef]
- Sosnik, A.; Mühlebach, S. Editorial: Drug Nanoparticles and Nano-Cocrystals: From Production and Characterization to Clinical Translation. Adv. Drug Deliv. Rev. 2018, 131, 1–2. [Google Scholar] [CrossRef] [PubMed]
- Peltonen, L. Practical guidelines for the characterization and quality control of pure drug nanoparticles and nano-cocrystals in the pharmaceutical industry. Adv. Drug Deliv. Rev. 2018, 131, 101–115. [Google Scholar] [CrossRef] [PubMed]
- Surve, D.H.; Jindal, A.B. Recent advances in long-acting nanoformulations for delivery of antiretroviral drugs. J. Control. Release 2020, 324, 379–404. [Google Scholar] [CrossRef]
- Lu, Y.; Li, Y.; Wu, W. Injected nanocrystals for targeted drug delivery. Acta Pharm. Sin. B 2016, 6, 106–113. [Google Scholar] [CrossRef] [PubMed]
- Fessi, H.; Puisieux, F.; Devissaguet, J.P.; Ammoury, N.; Benita, S. Nanocapsule formation by interfacial polymer deposition following solvent displacement. Int. J. Pharm. 1989, 55, R1–R4. [Google Scholar] [CrossRef]
- Beck-Broichsitter, M.; Rytting, E.; Lebhardt, T.; Wang, X.; Kissel, T. Preparation of nanoparticles by solvent displacement for drug delivery: A shift in the “ouzo region” upon drug loading. Eur. J. Pharm. Sci. 2010, 41, 244–253. [Google Scholar] [CrossRef]
- Ding, S.; Anton, N.; Vandamme, T.F.; Serra, C.A. Microfluidic nanoprecipitation systems for preparing pure drug or polymeric drug loaded nanoparticles: An overview. Expert Opin. Drug Deliv. 2016, 13, 1447–1460. [Google Scholar] [CrossRef]
- Thorat, A.A.; Dalvi, S.V. Liquid antisolvent precipitation and stabilization of nanoparticles of poorly water soluble drugs in aqueous suspensions: Recent developments and future perspective. Chem. Eng. J. 2012, 181–182, 1–34. [Google Scholar] [CrossRef]
- Dashtimoghadam, E.; Mirzadeh, H.; Taromi, F.A.; Nyström, B. Microfluidic self-assembly of polymeric nanoparticles with tunable compactness for controlled drug delivery. Polymer 2013, 54, 4972–4979. [Google Scholar] [CrossRef]
- Martins, J.P.; Torrieri, G.; Santos, H.A. The importance of microfluidics for the preparation of nanoparticles as advanced drug delivery systems. Expert Opin. Drug Deliv. 2018, 15, 469–479. [Google Scholar] [CrossRef]
- Wang, Y.; Zheng, Y.; Zhang, L.; Wang, Q.; Zhang, D. Stability of nanosuspensions in drug delivery. J. Control. Release 2013, 172, 1126–1141. [Google Scholar] [CrossRef]
- Abdelwahed, W.; Degobert, G.; Stainmesse, S.; Fessi, H. Freeze-drying of nanoparticles: Formulation, process and storage considerations. Adv. Drug Deliv. Rev. 2006, 58, 1688–1713. [Google Scholar] [CrossRef]
- Fuhrmann, K.; Połomska, A.; Aeberli, C.; Castagner, B.; Gauthier, M.A.; Leroux, J.C. Modular design of redox-responsive stabilizers for nanocrystals. ACS Nano 2013, 7, 8243–8250. [Google Scholar] [CrossRef]
- Kipp, J.E. The role of solid nanoparticle technology in the parenteral delivery of poorly water-soluble drugs. Int. J. Pharm. 2004, 284, 109–122. [Google Scholar] [CrossRef]
- Karnik, R.; Gu, F.; Basto, P.; Cannizzaro, C.; Dean, L.; Kyei-Manu, W.; Langer, R.; Farokhzad, O.C. Microfluidic platform for controlled synthesis of polymeric nanoparticles. Nano Lett. 2008, 8, 2906–2912. [Google Scholar] [CrossRef]
- Whitesides, G.M. The origins and the future of microfluidics. Nature 2006, 442, 368–373. [Google Scholar] [CrossRef]
- Yi, C.; Li, C.W.; Ji, S.; Yang, M. Microfluidics technology for manipulation and analysis of biological cells. Anal. Chim. Acta 2006, 560, 1–23. [Google Scholar] [CrossRef]
- Choi, N.W.; Cabodi, M.; Held, B.; Gleghorn, J.P.; Bonassar, L.J.; Stroock, A.D. Microfluidic scaffolds for tissue engineering. Nat. Mater. 2007, 6, 908–915. [Google Scholar] [CrossRef] [PubMed]
- Damiati, S.; Kompella, U.B.; Damiati, S.A.; Kodzius, R. Microfluidic devices for drug delivery systems and drug screening. Genes 2018, 9, 103. [Google Scholar] [CrossRef] [PubMed]
- Kleinstreuer, C.; Li, J.; Koo, J. Microfluidics of nano-drug delivery. Int. J. Heat Mass Transf. 2008, 51, 5590–5597. [Google Scholar] [CrossRef]
- Ward, K.; Fan, Z.H. Mixing in microfluidic devices and enhancement methods. J. Micromech. Microeng. 2015, 25, 094001. [Google Scholar] [CrossRef]
- Valencia, P.M.; Pridgen, E.M.; Rhee, M.; Langer, R.; Farokhzad, O.C.; Karnik, R. Microfluidic platform for combinatorial synthesis and optimization of targeted nanoparticles for cancer therapy. ACS Nano 2013, 7, 10671–10680. [Google Scholar] [CrossRef]
- Rahimi, M.; Valeh-e-Sheyda, P.; Rashidi, H. Statistical optimization of curcumin nanosuspension through liquid anti-solvent precipitation (LASP) process in a microfluidic platform: Box-Behnken design approach. Korean J. Chem. Eng. 2017, 34, 3017–3027. [Google Scholar] [CrossRef]
- Ali, H.S.M.; York, P.; Blagden, N. Preparation of hydrocortisone nanosuspension through a bottom-up nanoprecipitation technique using microfluidic reactors. Int. J. Pharm. 2009, 375, 107–113. [Google Scholar] [CrossRef]
- Zhang, X.; Chen, H.; Qian, F.; Chen, Y. Preparation of itraconazole nanoparticles by anti-solvent precipitation method using a cascaded microfluidic device and an ultrasonic spray drier. Chem. Eng. J. 2018, 334, 2264–2272. [Google Scholar] [CrossRef]
- Garg, S.; Heuck, G.; Ramsay, E. Microfluidics: A transformational tool for nanomedicine development and production. J. Drug. Target 2016, 24, 821–835. [Google Scholar] [CrossRef]
- Zhang, Q.X.; Xu, L.M.; Zhou, Y.; Wang, J.X.; Chen, J.F. Preparation of drug nanoparticles using a T-junction microchannel system. Ind. Eng. Chem. Res. 2011, 50, 13805–13812. [Google Scholar] [CrossRef]
- Liu, D.; Zhang, H.; Fontana, F.; Hirvonen, J.T.; Santos, H.A. Microfluidic-assisted fabrication of carriers for controlled drug delivery. Lab Chip 2017, 17, 1856–1883. [Google Scholar] [CrossRef]
- Duncanson, W.J.; Lin, T.; Abate, A.R.; Seiffert, S.; Shah, R.K.; Weitz, D.A. Microfluidic synthesis of advanced microparticles for encapsulation and controlled release. Lab Chip 2012, 12, 2135–2145. [Google Scholar] [CrossRef] [PubMed]
- Zhao, H.; Wang, J.X.; Wang, Q.A.; Chen, J.F.; Yun, J. Controlled liquid antisolvent precipitation of hydrophobic pharmaceutical nanoparticles in a MicroChannel reactor. Ind. Eng. Chem. Res. 2007, 46, 8229–8235. [Google Scholar] [CrossRef]
- Wang, J.X.; Zhang, Q.X.; Zhou, Y.; Shao, L.; Chen, J.F. Microfluidic synthesis of amorphous cefuroxime axetil nanoparticles with size-dependent and enhanced dissolution rate. Chem. Eng. J. 2010, 162, 844–851. [Google Scholar] [CrossRef]
- Gross, S.; Rahal, R.; Stransky, N.; Lengauer, C.; Hoeflich, K.P. Targeting cancer with kinase inhibitors. J. Clin. Inv. 2015, 125, 1780–1789. [Google Scholar] [CrossRef] [PubMed]
- Bhullar, K.S.; Lagarón, N.O.; McGowan, E.M.; Parmar, I.; Jha, A.; Hubbard, B.P.; Rupasinghe, H.P.V. Kinase-targeted cancer therapies: Progress, challenges and future directions. Mol. Cancer 2018, 17, 1–20. [Google Scholar] [CrossRef] [PubMed]
- Wu, P.; Nielsen, T.E.; Clausen, M.H. FDA-approved small-molecule kinase inhibitors. Trends Pharmacol. Sci. 2015, 36, 422–439. [Google Scholar] [CrossRef]
- Pottier, C.; Fresnais, M.; Gilon, M.; Jérusalem, G.; Longuespée, R.; Sounni, N.E. Tyrosine kinase inhibitors in cancer: Breakthrough and challenges of targeted therapy. Cancers 2020, 12, 731. [Google Scholar] [CrossRef]
- Herbrink, M.; Nuijen, B.; Schellens, J.H.M.; Beijnen, J.H. Variability in bioavailability of small molecular tyrosine kinase inhibitors. Cancer Treat. Rev. 2015, 41, 412–422. [Google Scholar] [CrossRef]
- Umazume, K.; Liu, L.H.; Scott, P.A.; Fernandez de Castro, J.P.; McDonald, K.; Kaplan, H.J.; Tamiya, S. Inhibition of PVR with a tyrosine kinase inhibitor, dasatinib, in the swine. Investig. Ophthalmol. Vis. Sci. 2013, 54, 1150–1159. [Google Scholar] [CrossRef]
- Chen, S.Y.; Shiau, A.L.; Wu, C.L.; Wang, C.R. Amelioration of experimental arthritis by the intra-articular injection of an epidermal growth factor receptor tyrosine kinase inhibitor. Clin. Exp. Rheumatol. 2015, 33, 839–843. [Google Scholar]
- Smidova, V.; Michalek, P.; Goliasova, Z.; Eckschlager, T.; Hodek, P.; Adam, V.; Heger, Z. Nanomedicine of tyrosine kinase inhibitors. Theranostics 2021, 11, 1546–1567. [Google Scholar] [CrossRef]
- Roskoski, R. Properties of FDA-approved small molecule protein kinase inhibitors: A 2020 update. Pharmacol. Res. 2020, 152, 104609. [Google Scholar] [CrossRef]
- Ren, K.; Zhou, J.; Wu, H. Materials for microfluidic chip fabrication. Acc. Chem. Res. 2013, 46, 2396–2406. [Google Scholar] [CrossRef]
- Committee for Human Medicinal Products ICH guideline Q3C (R5) on impurities: Guideline for Residual Solvents. Int. Conf. Harmon. Tech. Requir. Regist. Pharm. Hum. Use 2015, 44, 24.
- Hamdallah, S.I.; Zoqlam, R.; Erfle, P.; Blyth, M.; Alkilany, A.M.; Dietzel, A.; Qi, S. Microfluidics for pharmaceutical nanoparticle fabrication: The truth and the myth. Int. J. Pharm. 2020, 584, 119408. [Google Scholar] [CrossRef]
- Shanko, E.S.; van de Burgt, Y.; Anderson, P.D.; den Toonder, J.M.J. Microfluidic magnetic mixing at low Reynolds numbers and in stagnant fluids. Micromachines 2019, 10, 731. [Google Scholar] [CrossRef]
- Ushikubo, F.Y.; Birribilli, F.S.; Oliveira, D.R.B.; Cunha, R.L. Y- and T-junction microfluidic devices: Effect of fluids and interface properties and operating conditions. Microfluid. Nanofluid. 2014, 17, 711–720. [Google Scholar] [CrossRef]
- Bukchin, A.; Kuplennik, N.; Carcaboso, Á.M.; Sosnik, A. Effect of growing glycosylation extents on the self-assembly and active targeting in vitro of branched poly(ethylene oxide)-poly(propylene oxide) block copolymers. Appl. Mater. Today 2018, 11, 57–69. [Google Scholar] [CrossRef]
- Nicolaou, K.C.; Vourloumis, D.; Totokotsopoulos, S.; Papakyriakou, A.; Karsunky, H.; Fernando, H.; Gavrilyuk, J.; Webb, D.; Stepan, A.F. Synthesis and biopharmaceutical evaluation of imatinib analogues featuring unusual structural motifs. ChemMedChem 2016, 11, 31–37. [Google Scholar] [CrossRef] [PubMed]
- Bukchin, A.; Pascual-Pasto, G.; Cuadrado-Vilanova, M.; Castillo-Ecija, H.; Monterrubio, C.; Olaciregui, N.G.; Vila-Ubach, M.; Ordeix, L.; Mora, J.; Carcaboso, A.M.; et al. Glucosylated nanomicelles target glucose-avid pediatric patient-derived sarcomas. J. Control. Release 2018, 276, 59–71. [Google Scholar] [CrossRef]
- Kamath, A.V.; Wang, J.; Lee, F.Y.; Marathe, P.H. Preclinical pharmacokinetics and in vitro metabolism of dasatinib (BMS-354825): A potent oral multi-targeted kinase inhibitor against SRC and BCR-ABL. Cancer Chemother. Pharmacol. 2008, 61, 365–376. [Google Scholar] [CrossRef] [PubMed]
- Seo, S.; Suh, W. Antiangiogenic effect of dasatinib in murine models of oxygen-induced retinopathy and laser-induced choroidal neovascularization. Mol. Vis. 2017, 23, 823–831. [Google Scholar] [PubMed]
- Haralampiev, I.; Alonso de Armiño, D.J.; Luck, M.; Fischer, M.; Abel, T.; Huster, D.; Di Lella, S.; Scheidt, H.A.; Müller, P. Interaction of the small-molecule kinase inhibitors tofacitinib and lapatinib with membranes. Biochim. Biophys. Acta Biomembr. 2020, 1862, 183414. [Google Scholar] [CrossRef] [PubMed]
- Dhillon, S. Tofacitinib: A review in rheumatoid arthritis. Drugs 2017, 77, 1987–2001. [Google Scholar] [CrossRef]
- Biemans, V.B.C.; Sleutjes, J.A.M.; de Vries, A.C.; Bodelier, A.G.L.; Dijkstra, G.; Oldenburg, B.; Löwenberg, M.; van Bodegraven, A.A.; van der Meulen-de Jong, A.E.; de Boer, N.K.H.; et al. Tofacitinib for ulcerative colitis: Results of the prospective Dutch Initiative on Crohn and Colitis (ICC) registry. Aliment. Pharmacol. Ther. 2020, 51, 880–888. [Google Scholar] [CrossRef]
- Zhu, Z. Flash nanoprecipitation: Prediction and enhancement of particle stability via drug structure. Mol. Pharm. 2014, 11, 776–786. [Google Scholar] [CrossRef] [PubMed]
- Liu, D.; Cito, S.; Zhang, Y.; Wang, C.F.; Sikanen, T.M.; Santos, H.A. A versatile and robust microfluidic platform toward high throughput synthesis of homogeneous nanoparticles with tunable properties. Adv. Mater. 2015, 27, 2298–2304. [Google Scholar] [CrossRef]
- Tao, J.; Chow, S.F.; Zheng, Y. Application of flash nanoprecipitation to fabricate poorly water-soluble drug nanoparticles. Acta Pharm. Sin. B 2019, 9, 4–18. [Google Scholar] [CrossRef] [PubMed]
- Zhu, W.Z.; Wang, J.X.; Shao, L.; Zhang, H.X.; Zhang, Q.X.; Chen, J.F. Liquid antisolvent preparation of amorphous cefuroxime axetil nanoparticles in a tube-in-tube microchannel reactor. Int. J. Pharm. 2010, 395, 260–265. [Google Scholar] [CrossRef]
- Zhang, S.H.; Yun, J.; Shen, S.; Chen, Z.; Yao, K.J.; Chen, J.; Chen, B. Formation of solid lipid nanoparticles in a microchannel system with a cross-shaped junction. Chem. Eng. Sci. 2008, 63, 5600–5605. [Google Scholar] [CrossRef]
- Wu, L.; Zhang, J.; Watanabe, W. Physical and chemical stability of drug nanoparticles. Adv. Drug Deliv. Rev. 2011, 63, 456–469. [Google Scholar] [CrossRef]
- Sosnik, A.; Seremeta, K.P. Advantages and challenges of the spray-drying technology for the production of pure drug particles and drug-loaded polymeric carriers. Adv. Colloid Interface Sci. 2015, 223, 40–54. [Google Scholar] [CrossRef]
- Murdande, S.B.; Pikal, M.J.; Shanker, R.M.; Bogner, R.H. Aqueous solubility of crystalline and amorphous drugs: Challenges in measurement. Pharm. Dev. Technol. 2010, 16, 187–200. [Google Scholar] [CrossRef]
- Van Den Mooter, G. The use of amorphous solid dispersions: A formulation strategy to overcome poor solubility and dissolution rate. Drug Discov. Today Technol. 2012, 9, e79–e85. [Google Scholar] [CrossRef] [PubMed]
- Younis, U.S.; Vallorz, E.; Addison, K.J.; Ledford, J.G.; Myrdal, P.B. Preformulation and evaluation of tofacitinib as a therapeutic treatment for asthma. AAPS PharmSciTech 2019, 20, 167. [Google Scholar] [CrossRef] [PubMed]
- Ren, P.; Martin, M.; Worrall, C.P.; del Rio Gancedo, S. Kinase Inhibitor Polymorphs. U.S. Patent US20150005301A1, 1 January 2015. [Google Scholar]
- Hancock, B.C.; Parks, M. What is the true solubility advantage for amorphous pharmaceuticals? Pharm. Res. 2000, 17, 397–404. [Google Scholar] [CrossRef] [PubMed]
- Yang, W.; Johnston, K.P.; Williams, R.O. Comparison of bioavailability of amorphous versus crystalline itraconazole nanoparticles via pulmonary administration in rats. Eur. J. Pharm. Biopharm. 2010, 75, 33–41. [Google Scholar] [CrossRef]
- Simo, O.; Filipcik, J.; Martaus, A.; Jegorov, A.; Gavenda, A.; Aronhime, J.; Vraspir, P.; Koltai, T.; Faustmann, J.; Gabriel, R. Polymorphs of dasatinib and process for preparation thereof. Publication Number WO2009053854A3, 3 December 2009. [Google Scholar]
- Lepeltier, E.; Bourgaux, C.; Couvreur, P. Nanoprecipitation and the “Ouzo effect”: Application to drug delivery devices. Adv. Drug Deliv. Rev. 2014, 71, 86–97. [Google Scholar] [CrossRef]
- Jog, R.; Burgess, D.J. Pharmaceutical Amorphous Nanoparticles. J. Pharm. Sci. 2017, 106, 39–65. [Google Scholar] [CrossRef]
- Mehenni, L.; Lahiani-Skiba, M.; Ladam, G.; Hallouard, F.; Skiba, M. Preparation and characterization of spherical amorphous solid dispersion with amphotericin B. Pharmaceutics 2018, 10, 235. [Google Scholar] [CrossRef]
- Schianti, J.N.; Cerize, N.N.P.; de Oliveira, A.M.; Derenzo, S.; Seabra, A.C.; Góngora-Rubio, M.R. Rifampicin nanoprecipitation using flow focusing microfluidic device. J. Nanomed. Nanotechnol. 2013, 4, 2–172. [Google Scholar] [CrossRef]


| Drug | S/AS Flow Rate, (mL min−1/mL min−1) | S/AS Volume Ratio | T-Shaped | Y-Shaped | ||||
|---|---|---|---|---|---|---|---|---|
| Dh (nm) 1 (±S.D.) | S.D. (nm) 2 | PDI (nm) (±S.D.) | Dh (nm) 1 (±S.D.) | S.D. (nm) 2 | PDI (nm) (±S.D.) | |||
| IMA | 0.05/0.5 | 1/10 | 196 (6) | 75 | 0.13 (0.02) | 143 (4) | 53 | 0.18 (0.03) |
| 0.1/1.0 | 174 (9) | 71 | 0.16 (0.01) | 120 (12) | 67 | 0.31 (0.01) | ||
| 0.2/2.0 | 133 (5) | 60 | 0.30 (0.03) | 146 (16) | 50 | 0.24 (0.04) | ||
| 0.3/3.0 | 129 (5) | 64 | 0.32 (0.02) | 118 (7) | 59 | 0.33 (0.05) | ||
| 0.4/4.0 | 91 (6) | 37 | 0.30 (0.03) | 107 (16) | 60 | 0.30 (0.08) | ||
| 0.5/5.0 | 125 (4) | 30 | 0.30 (0.03) | 120 (3) | 40 | 0.09 (0.02) | ||
| 0.6/6.0 | 160 (7) | 66 | 0.20 (0.04) | 90 (6) | 38 | 0.30 (0.03) | ||
| 0.8/8.0 | 159 (12) | 79 | 0.24 (0.02) | 181 (7) | 102 | 0.21 (0.00) | ||
| DAS | 0.05/0.5 | 221 (10) | 7 | 0.11 (0.01) | 249 (14) | 64 | 0.04 (0.01) | |
| 0.1/1.0 | 223 (15) | 49 | 0.20 (0.03) | 162 (10) | 60 | 0.15 (0.03) | ||
| 0.2/2.0 | 203 (6) | 64 | 0.10 (0.00) | 199 (6) | 63 | 0.09 (0.02) | ||
| 0.3/3.0 | 184 (13) | 44 | 0.02 (0.00) | 181 (4) | 52 | 0.07 (0.03) | ||
| 0.4/4.0 | 202 (39) | 17 | 0.10 (0.05) | 226 (26) | 4 | 0.07 (0.02) | ||
| 0.5/5.0 | 213 (16) | 5 | 0.05 (0.04) | 210 (33) | 9 | 0.04 (0.03) | ||
| 0.6/6.0 | 271 (21) | 93 | 0.13 (0.00) | 310 (10) | 97 | 0.15 (0.07) | ||
| 0.8/8.0 | 243 (6) | 72 | 0.12 (0.04) | 316 (36) | 82 | 0.05 (0.01) | ||
| TOF | 0.05/0.5 | 188 (8) | 54 | 0.31 (0.06) | 174 (4) | 78 | 0.20 (0.02) | |
| 0.1/1.0 | 144 (10) | 66 | 0.23 (0.05) | 153 (6) | 40 | 0.20 (0.02) | ||
| 0.2/2.0 | 99 (9) | 22 | 0.43 (0.14) | 108 (16) | 26 | 0.34 (0.09) | ||
| 0.3/3.0 | 146 (15) | 24 | 0.32 (0.07) | 117 (16) | 39 | 0.24 (0.07) | ||
| 0.4/4.0 | 130 (7) | 52 | 0.32 (0.07) | 114 (8) | 65 | 0.30 (0.03) | ||
| 0.5/5.0 | 172 (17) | 54 | 0.32 (0.00) | 121 (10) | 50 | 0.40 (0.08) | ||
| 0.6/6.0 | 148 (34) | 28 | 0.50 (0.10) | 143 (12) | 70 | 0.32 (0.10) | ||
| 0.8/8.0 | 148 (20) | 29 | 0.60 (0.20) | 165 (17) | 79 | 0.30 (0.06) | ||
| Drug | S/AS Volume Ratio | S/AS Flow Rate (mL min−1/mL min−1) | Dh (nm) 1 (±S.D.) | S.D. (nm) 2 | PDI (nm) (±S.D.) |
|---|---|---|---|---|---|
| IMA | 1/7 | 0.5/3.5 | 121 (13) | 48 | 0.21 (0.08) |
| 1/8 | 0.5/4.0 | 91 (9) | 26 | 0.20 (0.06) | |
| 1/9 | 0.5/4.5 | 95 (9) | 31 | 0.20 (0.05) | |
| 1/10 | 0.5/5.0 | 121 (2) | 40 | 0.10 (0.02) | |
| 1/11 | 0.5/5.5 | 115 (4) | 40 | 0.30 (0.02) | |
| 1/12 | 0.5/6.0 | 124 (23) | 32 | 0.20 (0.06) | |
| DAS | 1/7 | 0.5/3.5 | 210 (50) | 22 | 0.06 (0.04) |
| 1/8 | 0.5/4.0 | 215 (29) | 7 | 0.04 (0.02) | |
| 1/9 | 0.5/4.5 | 215 (30) | 17 | 0.05 (0.01) | |
| 1/10 | 0.5/5.0 | 210 (19) | 33 | 0.09 (0.06) | |
| 1/11 | 0.5/5.5 | 255 (34) | 17 | 0.05 (0.03) | |
| 1/12 | 0.5/6.0 | 201 (18) | 7 | 0.04 (0.03) | |
| TOF | 1/7 | 0.5/3.5 | 114 (6) | 52 | 0.40 (0.15) |
| 1/8 | 0.5/4.0 | 96 (6) | 49 | 0.30 (0.06) | |
| 1/9 | 0.5/4.5 | 113 (12) | 65 | 0.40 (0.04) | |
| 1/10 | 0.5/5.0 | 107 (26) | 61 | 0.30 (0.03) | |
| 1/11 | 0.5/5.5 | 209 (29) | 105 | 0.40 (0.15) | |
| 1/12 | 0.5/6.0 | 180 (47) | 56 | 0.45 (0.10) |
| Drug | Time | Dh (nm) 1 (±S.D.) | S.D. (nm) 2 | PDI (nm) (±S.D.) |
|---|---|---|---|---|
| IMA | 0 h | 126 (5) | 37 | 0.14 (0.05) |
| 2 h | 234 (5) | 67 | 0.10 (0.02) | |
| 24 h | 214 (15) | 42 | 0.24 (0.05) | |
| 2 days | 216 (17) | 43 | 0.30 (0.10) | |
| 7 days | 261 (4) | 58 | 0.25 (0.02) | |
| DAS | 0 h | 209 (12) | 53 | 0.05 (0.01) |
| 2 h | 300 (8) | 74 | 0.04 (0.03) | |
| 24 h | 532 (39) | 120 | 0.02 (0.03) | |
| 2 days | 500 (46) | 110 | 0.20 (0.05) | |
| 7 days | 540 (26) | 136 | 0.22 (0.01) | |
| TOF | 0 h | 127 (5) | 64 | 0.23 (0.01) |
| 2 h | 101 (6) | 33 | 0.20 (0.03) | |
| 24 h | 88 (2) | 18 | 0.23 (0.03) | |
| 2 days | 111 (5) | 40 | 0.20 (0.02) | |
| 7 days | 111 (6) | 38 | 0.20 (0.02) |
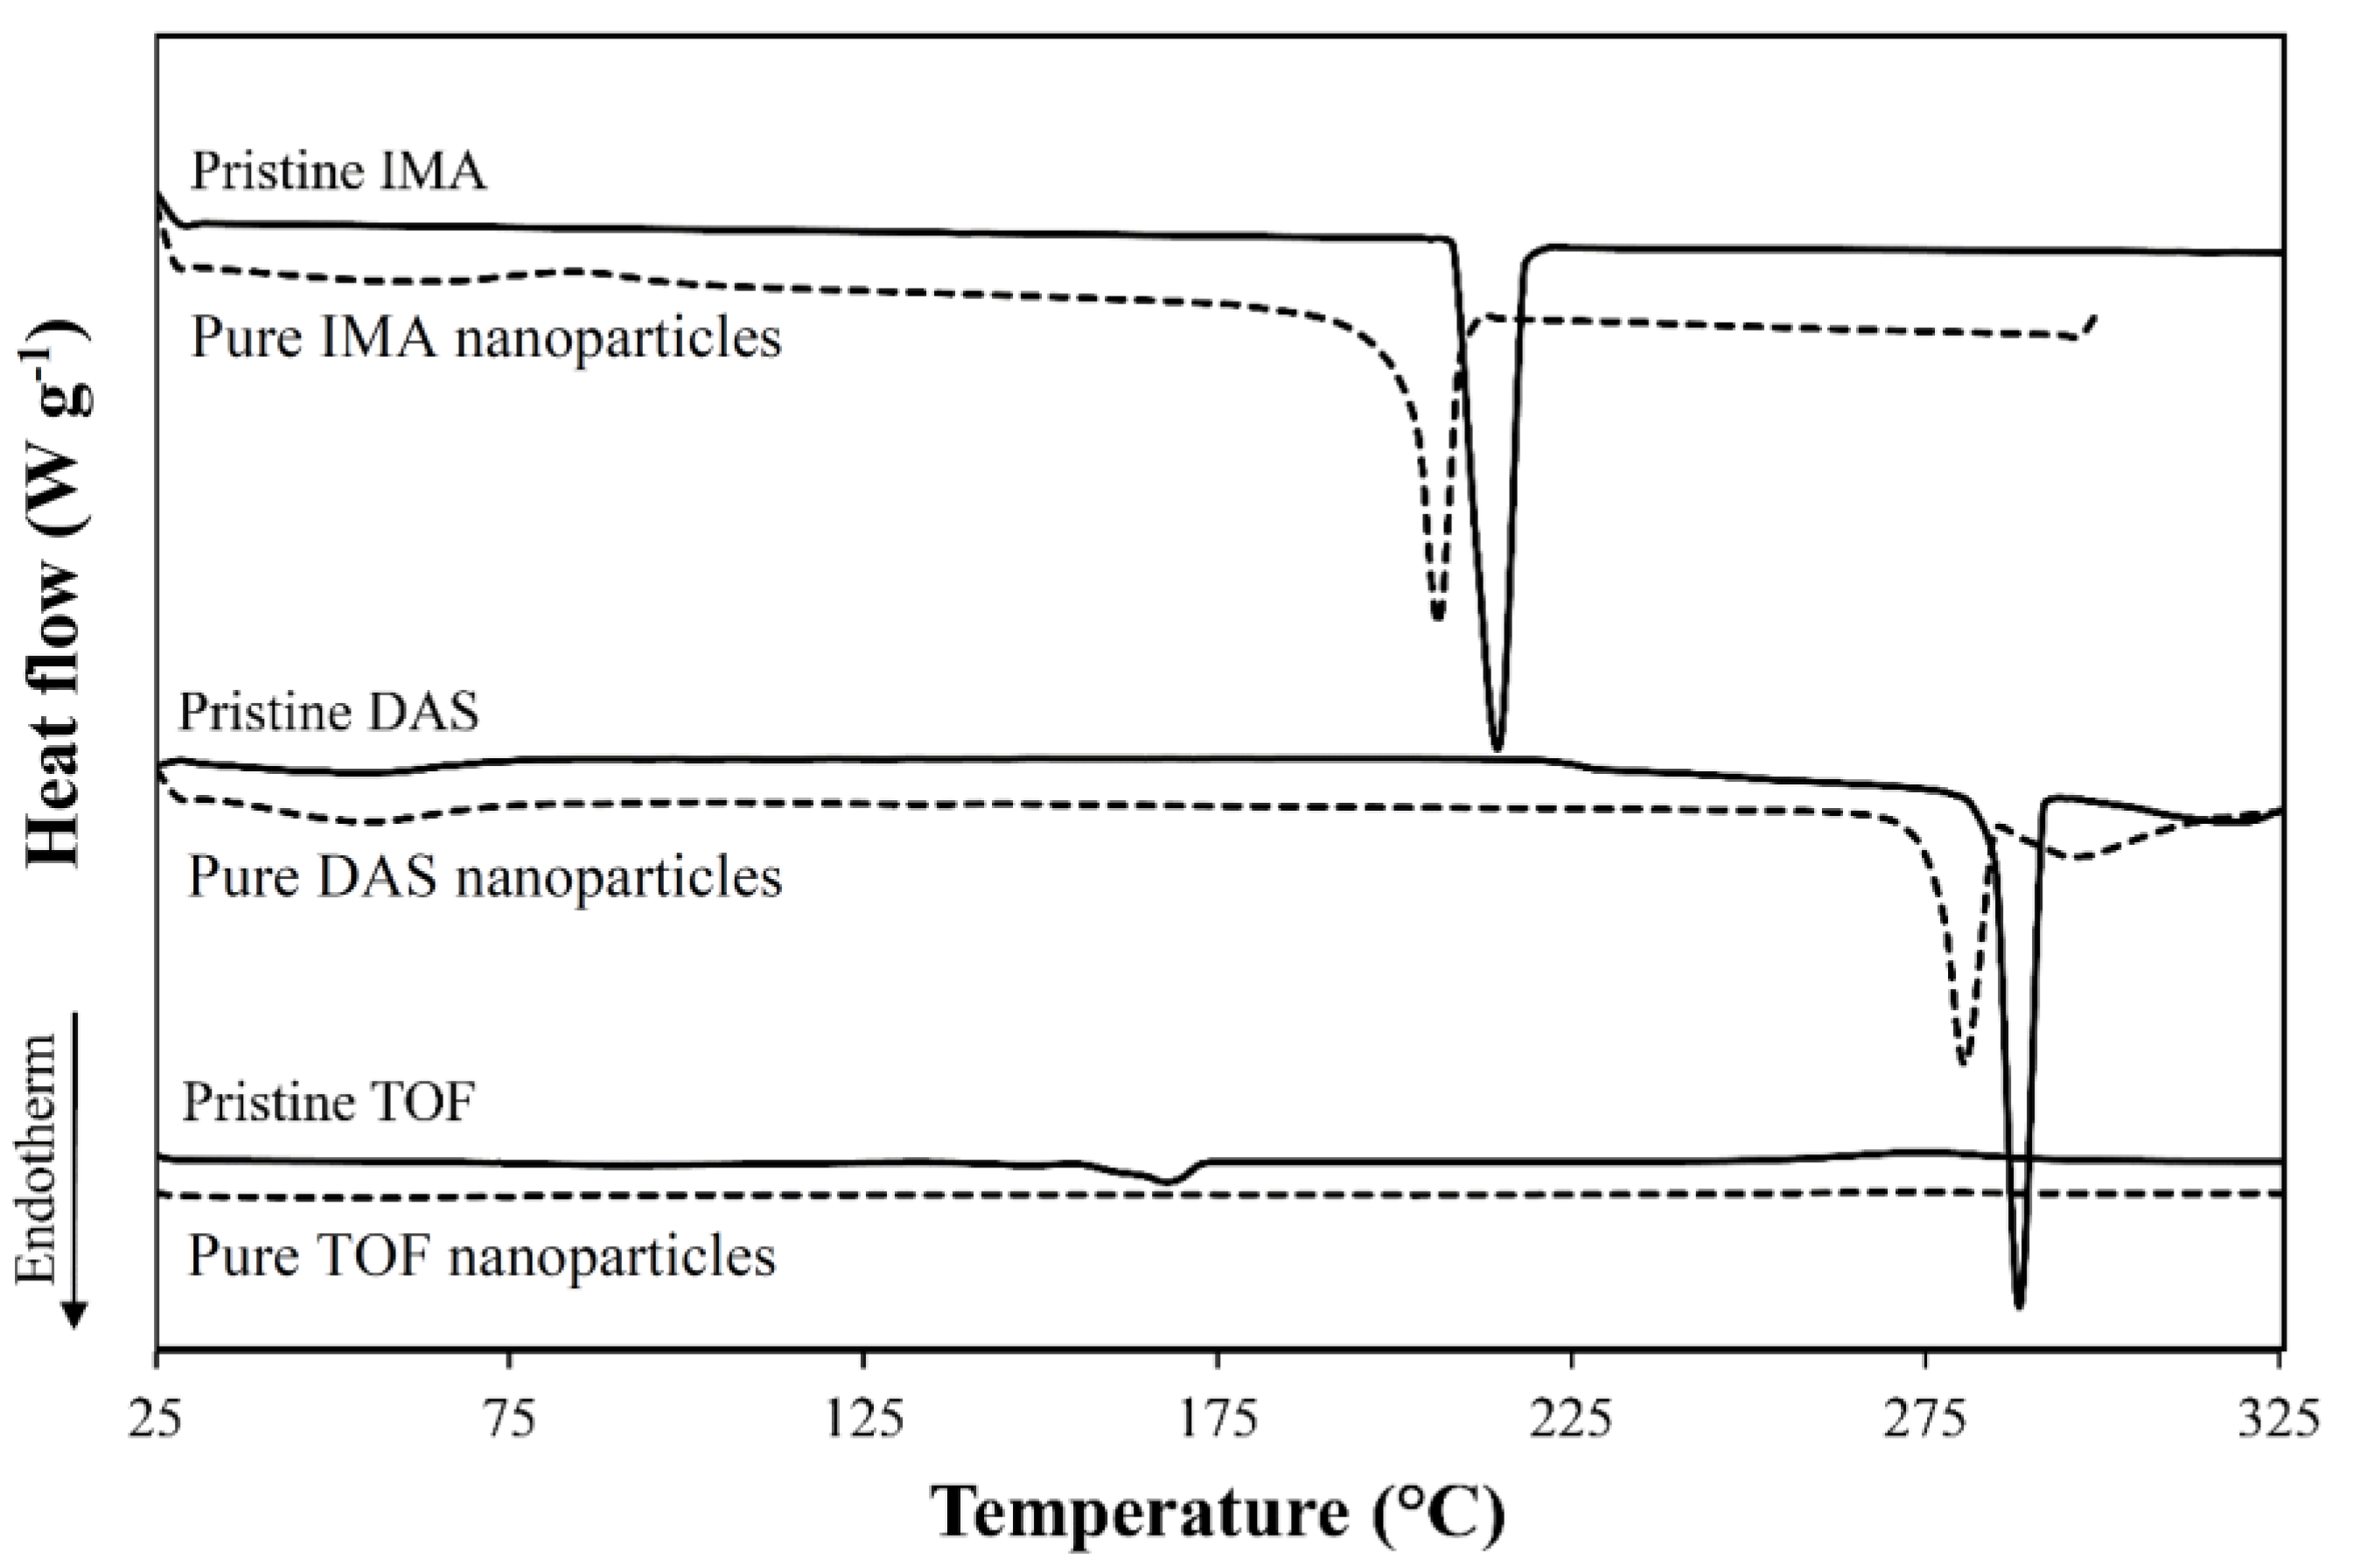
| Drug | Form | Tm (°C) 1 | ΔHm (J g−1) 1 |
|---|---|---|---|
| IMA | Raw | 215 | 124 |
| Nanonized | 206 | 106 | |
| DAS | Raw | 287, 318 | 89/41 |
| Nanonized | 280, 295 | 53/20 | |
| TOF | Raw | 148, 168 | 3/52 |
| Nanonized | N.D. | N.D. |
Publisher’s Note: MDPI stays neutral with regard to jurisdictional claims in published maps and institutional affiliations. |
© 2021 by the authors. Licensee MDPI, Basel, Switzerland. This article is an open access article distributed under the terms and conditions of the Creative Commons Attribution (CC BY) license (https://creativecommons.org/licenses/by/4.0/).
Share and Cite
Arzi, R.S.; Kay, A.; Raychman, Y.; Sosnik, A. Excipient-Free Pure Drug Nanoparticles Fabricated by Microfluidic Hydrodynamic Focusing. Pharmaceutics 2021, 13, 529. https://doi.org/10.3390/pharmaceutics13040529
Arzi RS, Kay A, Raychman Y, Sosnik A. Excipient-Free Pure Drug Nanoparticles Fabricated by Microfluidic Hydrodynamic Focusing. Pharmaceutics. 2021; 13(4):529. https://doi.org/10.3390/pharmaceutics13040529
Chicago/Turabian StyleArzi, Roni Sverdlov, Asaf Kay, Yulia Raychman, and Alejandro Sosnik. 2021. "Excipient-Free Pure Drug Nanoparticles Fabricated by Microfluidic Hydrodynamic Focusing" Pharmaceutics 13, no. 4: 529. https://doi.org/10.3390/pharmaceutics13040529
APA StyleArzi, R. S., Kay, A., Raychman, Y., & Sosnik, A. (2021). Excipient-Free Pure Drug Nanoparticles Fabricated by Microfluidic Hydrodynamic Focusing. Pharmaceutics, 13(4), 529. https://doi.org/10.3390/pharmaceutics13040529