Review

Functionalized Lanthanide Oxide Nanoparticles for Tumor Targeting, Medical Imaging, and Therapy

1
Department of Chemistry, College of Natural Sciences, Kyungpook National University, Taegu 41566, Korea
2
Department of Molecular Medicine, School of Medicine, Kyungpook National University, Taegu 41405, Korea
*
Authors to whom correspondence should be addressed.
Pharmaceutics 2021, 13(11), 1890; https://doi.org/10.3390/pharmaceutics13111890
Submission received: 30 September 2021 / Revised: 29 October 2021 / Accepted: 5 November 2021 / Published: 8 November 2021
(This article belongs to the Special Issue Magnetic Nanoparticles for Therapy and Diagnosis in Nanomedicine)

Abstract

:
Recent progress in functionalized lanthanide oxide (Ln2O3) nanoparticles for tumor targeting, medical imaging, and therapy is reviewed. Among the medical imaging techniques, magnetic resonance imaging (MRI) is an important noninvasive imaging tool for tumor diagnosis due to its high spatial resolution and excellent imaging contrast, especially when contrast agents are used. However, commercially available low-molecular-weight MRI contrast agents exhibit several shortcomings, such as nonspecificity for the tissue of interest and rapid excretion in vivo. Recently, nanoparticle-based MRI contrast agents have become a hot research topic in biomedical imaging due to their high performance, easy surface functionalization, and low toxicity. Among them, functionalized Ln2O3 nanoparticles are applicable as MRI contrast agents for tumor-targeting and nontumor-targeting imaging and image-guided tumor therapy. Primarily, Gd2O3 nanoparticles have been intensively investigated as tumor-targeting T1 MRI contrast agents. T2 MRI is also possible due to the appreciable paramagnetic moments of Ln2O3 nanoparticles (Ln = Dy, Ho, and Tb) at room temperature arising from the nonzero orbital motion of 4f electrons. In addition, Ln2O3 nanoparticles are eligible as X-ray computed tomography contrast agents because of their high X-ray attenuation power. Since nanoparticle toxicity is of great concern, recent toxicity studies on Ln2O3 nanoparticles are also discussed.

Graphical Abstract

1. Introduction

Medical imaging plays an important role in the pre-detection, diagnosis, and treatment of tumors [1]. Among the currently available medical imaging techniques, magnetic resonance imaging (MRI) allows whole-body imaging and outstanding microsoft tissue contrast and image resolution to reveal morphological and anatomical details of tissues [2,3]. As imaging agents, various nanoparticles have been developed due to their remarkable physical and chemical properties, which are superior to those of small molecules [4,5,6,7]. Moreover, nanoparticles can be easily surface-functionalized for advanced imaging and tumor targeting [8,9]. They can also provide longer blood circulation times than small molecules, which is conducive to tumor targeting and drug delivery to specific tumor cells [10,11].
Lanthanide oxide (Ln2O3) nanoparticles (Ln = Gd, Tb, Dy, and Ho) are of special interest because they have appreciable magnetic moments at room temperature, which is useful for MRI [12,13,14,15], and high X-ray attenuation power, which is useful for X-ray computed tomography (CT) [16,17,18]. In addition, surface-modified Ln2O3 nanoparticles exhibit improved properties, such as high-water proton spin relaxivities, high colloidal stabilities, and low toxicities [12,13,14]. For in vivo applications, nanoparticles should have an ultrasmall particle diameter (<3 nm) to allow their excretion from the body via the urinary system after intravenous injection [19,20]. Ln2O3 nanoparticles meet such requirements, displaying excellent MRI and CT imaging properties at ultrasmall particle diameters [12,13,14,15].
The development of tumor-targeting Ln2O3 nanoparticles is challenging. Especially when compared with commercial molecular Gd-chelates [21,22,23], Gd2O3 nanoparticles are more efficient longitudinal relaxation promoters [12,13,14,15] because their longitudinal relaxivity (r1) values are higher than those (i.e., 3–5 s‒1mM‒1) [21,22,23] of commercial molecular MRI contrast agents. Therefore, Gd2O3 nanoparticles can provide very high contrast T1 MR images and thus, are ideal candidates for tumor-targeting T1 MRI contrast agents. In particular, their r1 value is optimal at ultrasmall nanoparticle size (1.0–2.5 nm) [24,25]. Meanwhile, other Ln2O3 nanoparticles (Ln = Dy, Tb, and Ho) are eligible as T2 MRI contrast agents [12,13,15].
Nanoparticles alone accumulate nonspecifically in tumors via passive targeting, i.e., the enhanced permeability and retention (EPR) effect [26]. The accumulation amount and specificity to tumors can be enhanced by active targeting, which is commonly achieved by modifying contrast agents with tumor-targeting ligands that can selectively bind to receptors overexpressed on tumor-cell membranes. Such tumor-targeting ligands include small molecules, such as arginylglycylaspartic acids (Arg-Gly-Asp or RGDs) [27,28,29] and folic acid [30,31], peptides, such as chlorotoxin (CTX) [32,33], and biological molecules, such as antibodies [34]. Nanoparticles can provide a flexible platform to attach tumor-targeting ligands, thereby improving their specificity and effectiveness for tumor treatment. In addition, anticancer drugs can also be attached to nanoparticle surfaces for chemotherapy. Generally, in this type of treatment, most anticancer drugs cannot differentiate between tumor and normal cells, causing toxic side effects [35,36]. However, such side effects can be minimized or eliminated by delivering drugs via tumor-targeting nanoparticles. However, the cytotoxicity and biocompatibility of lanthanides during and after endocytosis by cells are still largely unknown, although numerous reports describe lanthanides as relatively non-toxic elements [37,38].
The main purpose of this review is to provide an insight into tumor imaging and image-guided tumor therapy using functionalized (i.e., tumor-targeting ligand-conjugated) Ln2O3 nanoparticles. First, nanoparticle synthesis methods, surface-modification, tumor-targeting ligand conjugation, and various experimental analyses for Ln2O3 nanoparticles are introduced. Second, physicochemical properties, such as particle diameters and magnetic properties, and imaging properties, including relaxivities, are discussed. Third, recent developments of tumor-targeting T1 MRI contrast agents based on Gd2O3 nanoparticles that were applied in tumor imaging and image-guided tumor therapy and Ln2O3 nanoparticle-based T2 MRI and CT contrast agents are discussed. Finally, recent progress in the knowledge of the toxicity of Ln2O3 nanoparticles is discussed. Overall, this review provides an overview of the recent progress in functionalized Ln2O3 nanoparticles applied in tumor imaging and therapy.

2. Synthesis and Surface Functionalization of Ln2O3 Nanoparticles

Among the various methods currently available for the synthesis of ultrasmall Ln2O3 nanoparticles, the synthesis in a polyol solvent is preferred for biomedical applications because ultrasmall nanoparticles are obtained (average particle diameter = 2.0 nm) and subsequent surface coating of the nanoparticles with hydrophilic and biocompatible ligands can be performed in one pot [17,31]. A general reaction scheme for the polyol synthesis is provided in Figure 1.
Nanoparticle contrast agents possess an additional advantage over molecular agents because cancer-targeting ligands and drugs can be easily attached to the nanoparticle surfaces. Small molecular ligands are less efficient in providing good colloidal stability to nanoparticles compared with polymer ligands, which is due to the presence of many hydrophilic binding groups in the polymers for attachment to the nanoparticles [39,40,41,42,43]. In addition, hydrophilic polymers can provide higher r1 values than small molecular ligands [39,40,41] because they can attract more water molecules around the nanoparticles. Examples of these polymers are polyacrylic acid (PAA), polymethyl vinyl ether-alt-maleic acid (PMVEMA), and polyacrylic acid-co-maleic acid (PAAMA) having numerous COOH groups (Figure 1) [39,40,41], which can serve as anchor groups of functional molecules, such as cancer-targeting ligands and drugs. For example, RGD-conjugated PAA-coated Gd2O3 nanoparticles were reported by Ho et al. [44] (Figure 2).
Ln2O3 nanoparticles can also be synthesized in organic solvents via the thermal decomposition method. The synthesized nanoparticles can be further coated with hydrophilic ligands and then conjugated with cancer-targeting ligands. For example, CTX-poly(ethylene glycol)-N-(trimethoxysilylpropyl) ethylenediamine triacetic acid silane-coated Gd2O3 nanoparticles (CTX-PEG-TETT-Gd2O3) were reported by Gu et al. [45] as tumor-targeting contrast agents (Figure 3). Here, the biocompatible poly(ethylene glycol) (PEG) layer is known to stabilize the Gd2O3 nanoparticles, enhance blood circulation blood times, and improve colloidal stability [11].

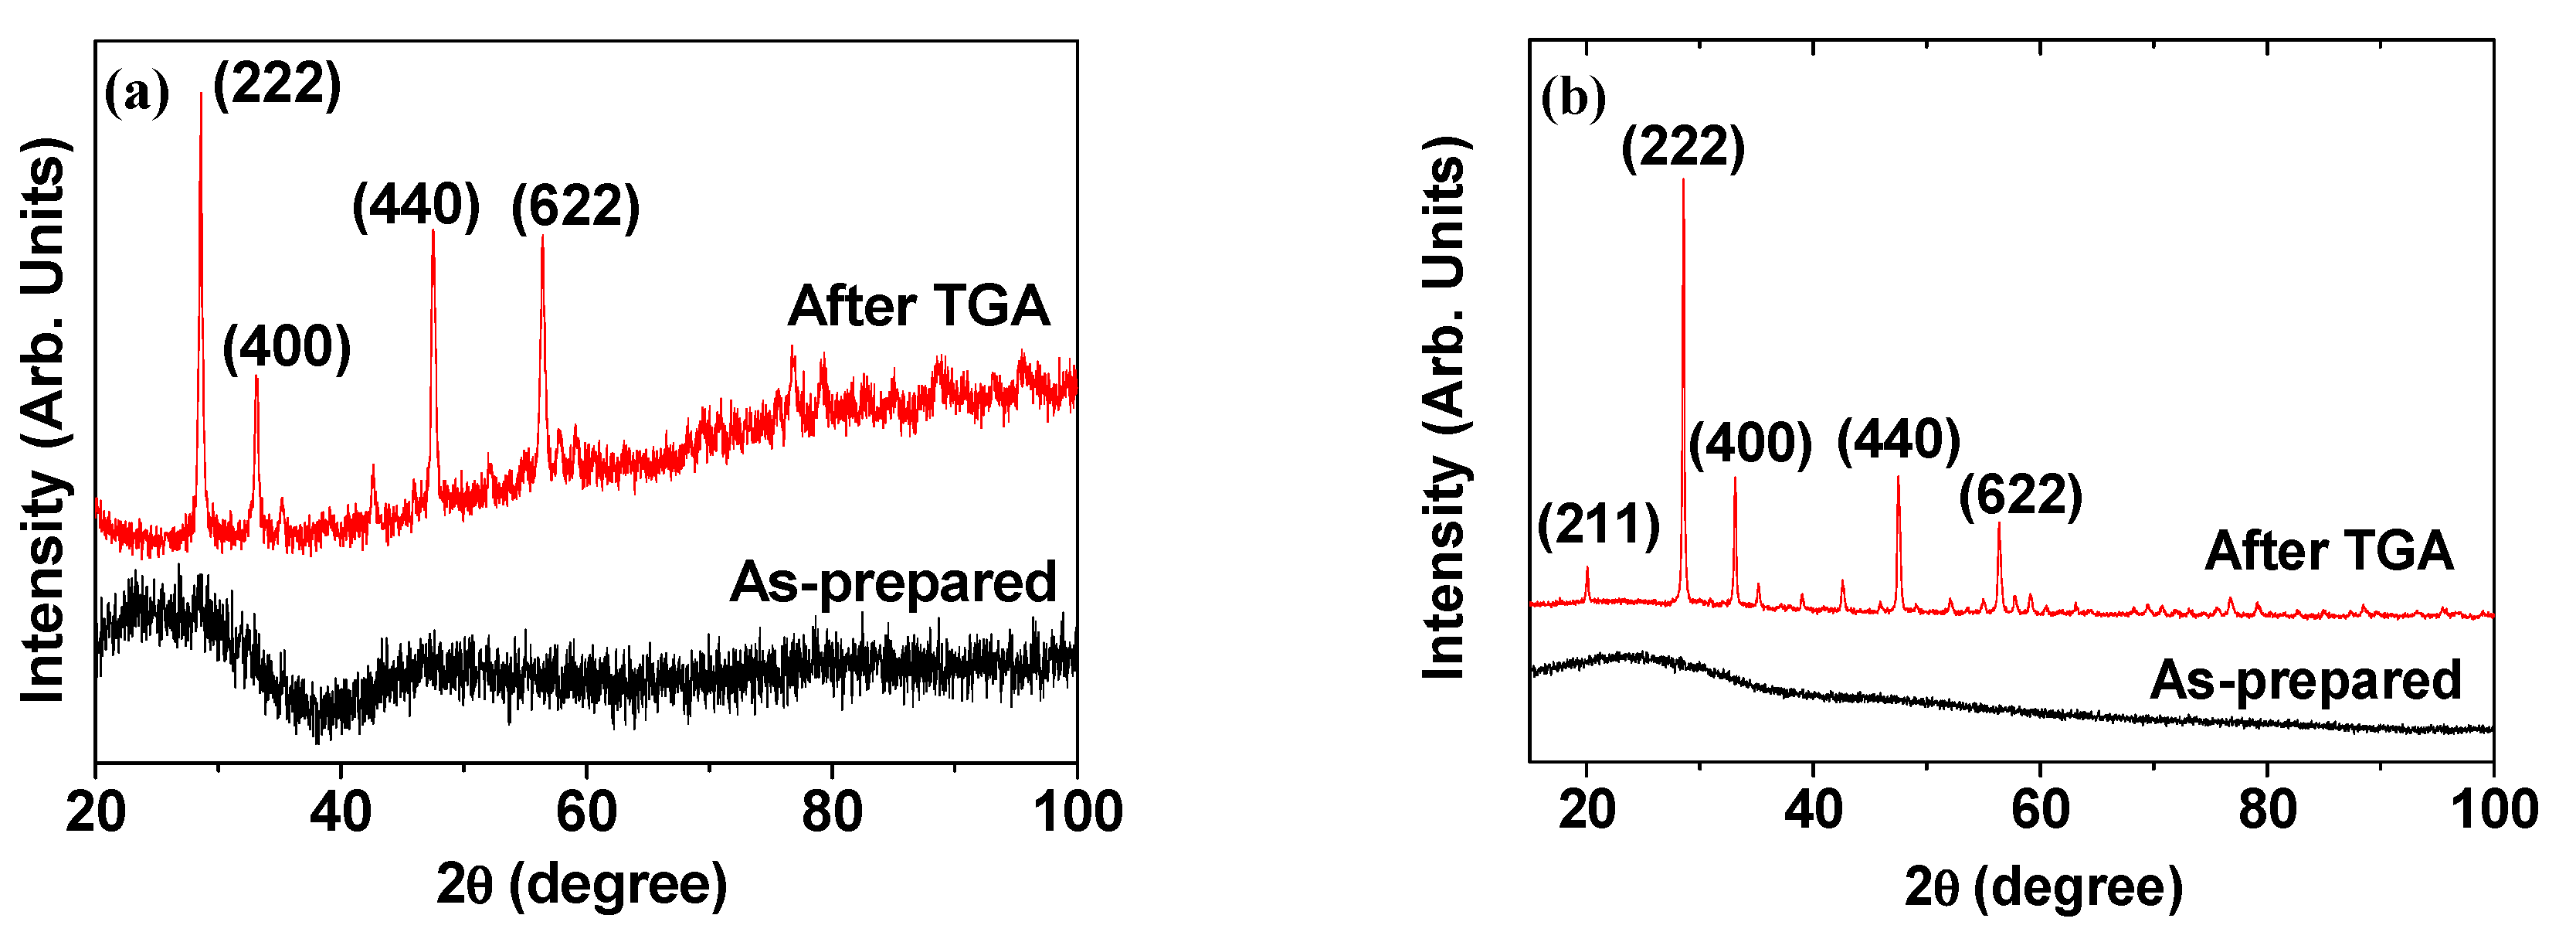
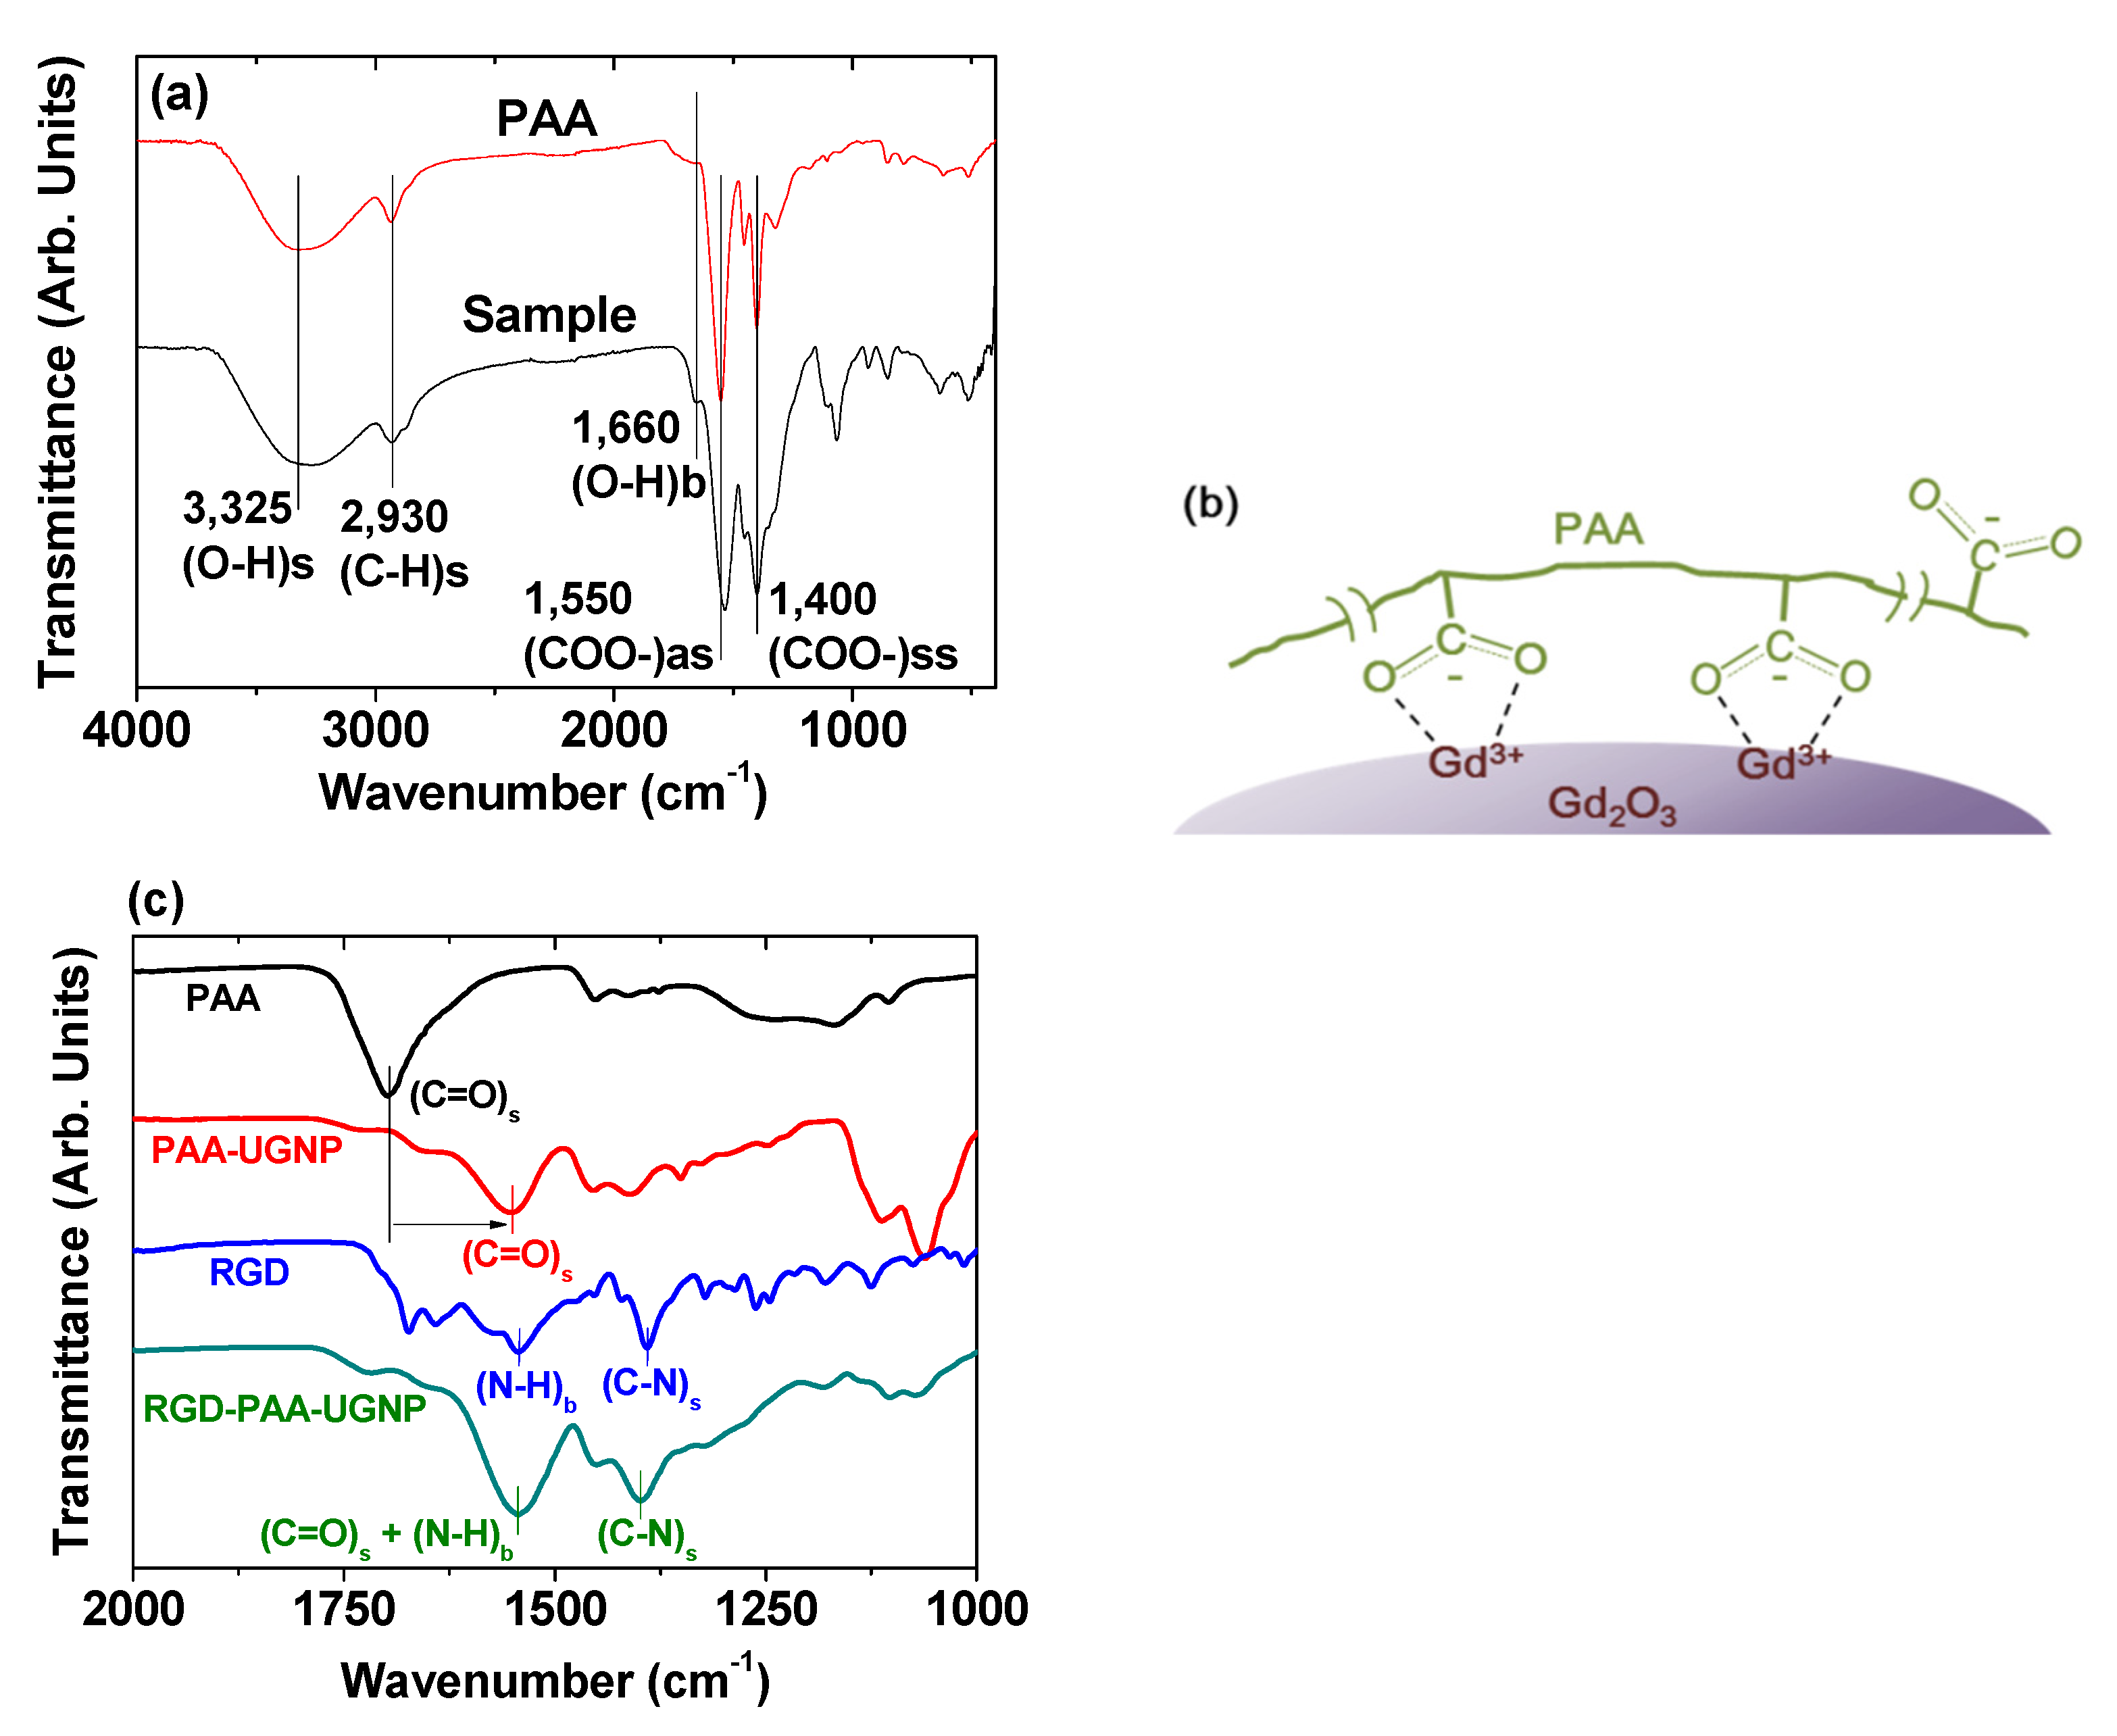
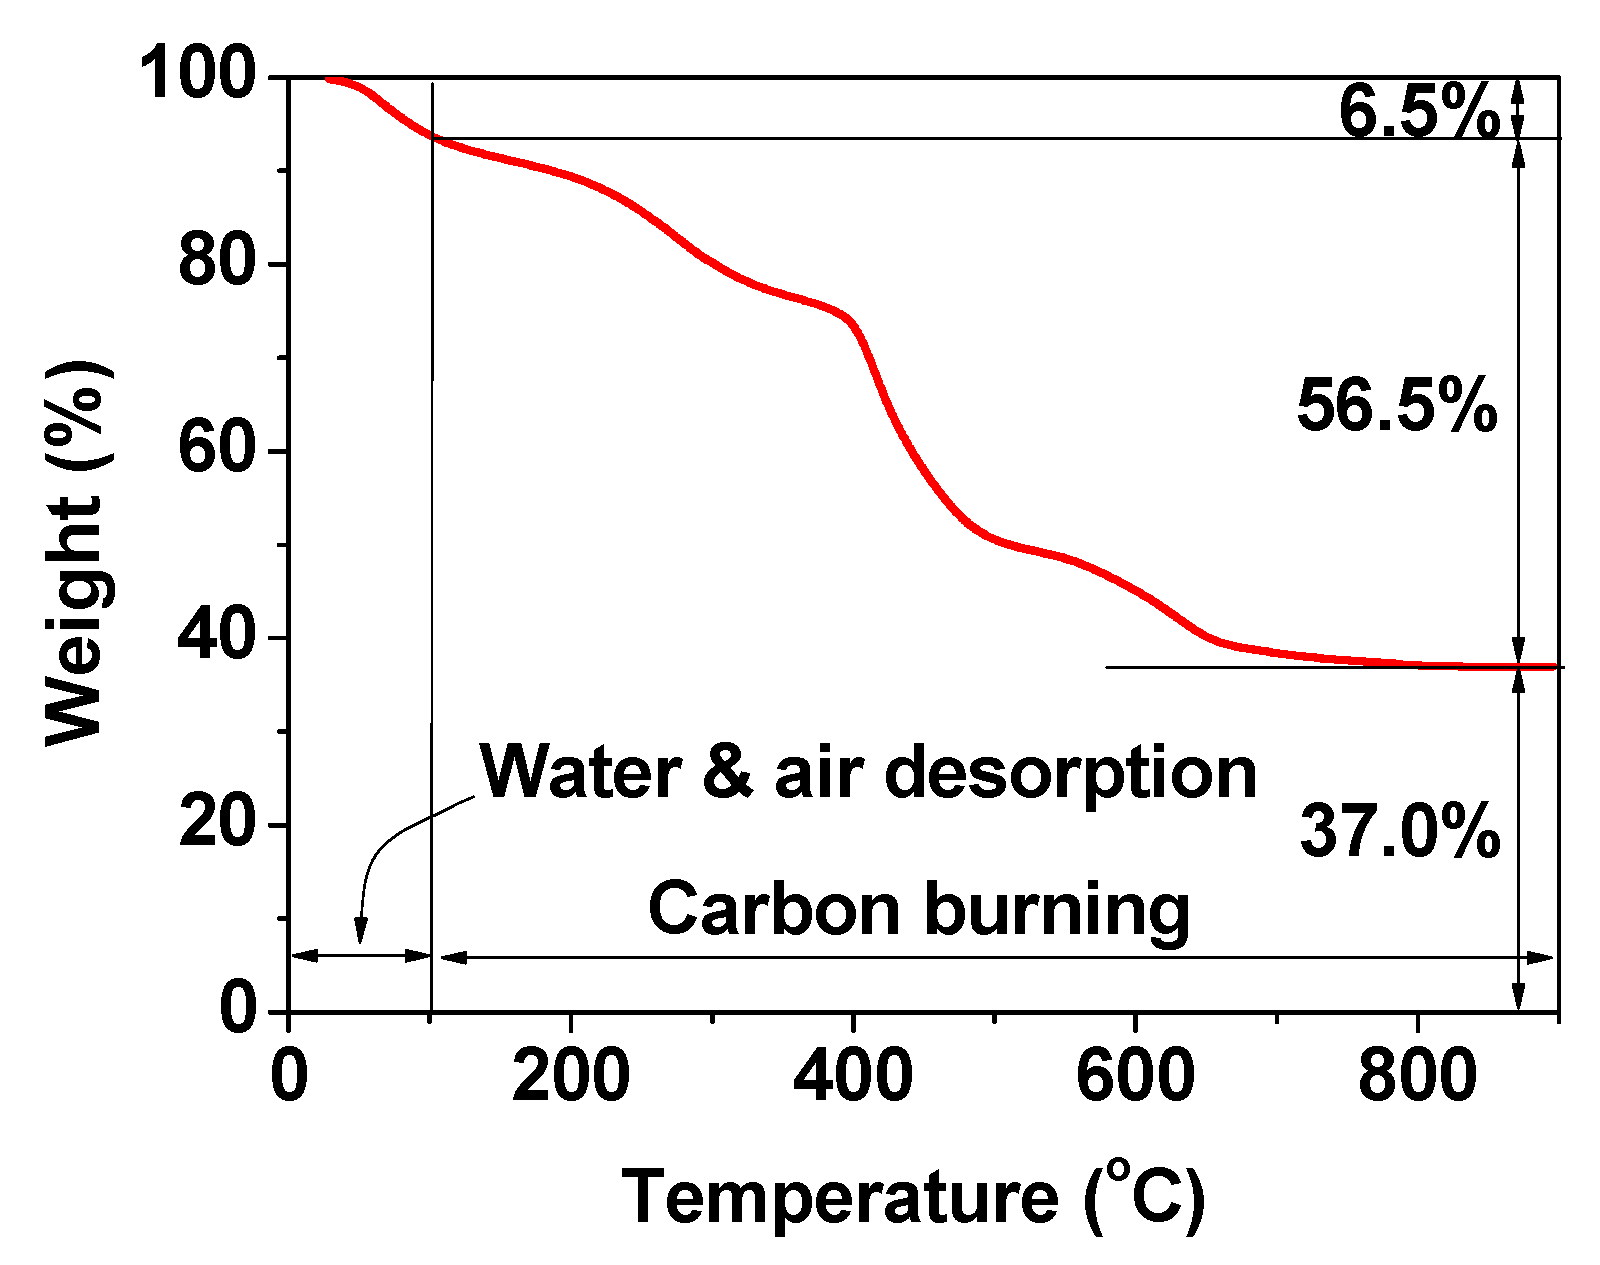
3. Physicochemical Characterization

Various experimental techniques can be used to characterize the synthesized Ln2O3 nanoparticles [17,31], as summarized in Table 1. The particle diameters, the hydrodynamic diameters of nanoparticles dispersed in water, and the crystal structure of the nanoparticles can be measured using a high-resolution transmission electron microscope (HRTEM) operating at high acceleration voltages (>200 kV), a dynamic light scattering (DLS) particle size analyzer, and a powder X-ray diffraction (XRD) spectrometer, respectively. The attachment of ligands on the nanoparticle surfaces can be investigated by recording Fourier transform-infrared (FT-IR) absorption spectra using powder samples; powder samples may be pelletized in KBr for easy handling and acquisition of good signal-to-noise ratios using a small number of powder samples. The amount of surface-coating ligand can be estimated according to thermogravimetric analysis (TGA) curves. The elemental analysis (EA) can also be used to investigate the surface-coating amount and ligand composition (C/H/O/N/S) in metal oxide nanoparticles because metal oxide nanoparticles hardly decompose during EA. The Ln-concentration in an aqueous nanoparticle suspension can be determined using an inductively coupled plasma atomic emission spectrometer (ICPAES). The in vitro cellular cytotoxicity of the ligand-coated Ln2O3 nanoparticles can be measured using various cell viability assay techniques, such as trypan blue dye exclusion staining, methylthiazoly tetrazolium (MTT) reduction, and water-soluble tetrazolium salt (WST) assay [46]. Cell viability measurements are generally performed using more than two cell lines to obtain consistent and reliable results because the cell viabilities generally depend on the cell lines. Magnetization (M) values of the nanoparticles can be estimated by recording M versus applied field (H) (M−H) curves at room temperature using a vibrating sample magnetometer (VSM). Net M values of the nanoparticles without ligand can be obtained using the net mass of the nanoparticles determined via TGA. For MRI contrast agents, r1 and the transverse relaxivity (r2) represent their ability to act as T1 or T2 MRI contrast agents. To measure the r1 and r2 values, longitudinal (T1) and transverse (T2) relaxation times are measured using an MRI scanner. The T1 relaxation time measurements can be conducted using an inversion recovery method. For the T2 relaxation times, the Carr–Purcell Meiboom–Gill pulse sequence can be used for multiple spin-echo measurements. The r1 and r2 values are then estimated from the slopes of the plots of 1/T1 and 1/T2 versus the Ln-concentration, respectively. In vivo T1 or T2 MR images can be obtained using an MRI scanner after intravenous injection of an aqueous nanoparticle suspension sample. In addition, the X-ray attenuation power of Ln2O3 nanoparticles, which is higher than those of commercial iodine CT contrast agents, can be measured by recording phantom images using a CT scanner, and in vivo CT images can be obtained using a CT scanner after intravenous injection of an aqueous nanoparticle suspension sample.

4. Physicochemical and Imaging Properties

4.1. Particle Diameters and Surface Coatings

The imaging properties of nanoparticles depend on their particle and hydrodynamic diameters. Ln2O3 nanoparticles synthesized via the polyol method generally have ultrasmall diameters (average particle diameter = 2.0 nm) [39,40,41,42,43,44]. Figure 4a–c shows various HRTEM images of Gd2O3 nanoparticles [44,47,48]. Both particle and hydrodynamic diameters follow a log-normal function distribution; therefore, average particle and hydrodynamic diameters can be obtained by fitting the log-normal distribution function to the observed particle and hydrodynamic diameter distributions, respectively. The insets in Figure 4c show a nanoparticle suspension sample exhibiting laser light scattering (i.e., Tyndall effect) due to the collision of the nanoparticle colloids with the passing laser light, whereas triple-distilled water shows no light scattering [44]. This experiment shows the good colloidal dispersion of the nanoparticles in aqueous media.
Due to the ultrasmall particle diameters, the XRD patterns of nanoparticle powder samples are generally broad and amorphous [49,50]. Nevertheless, upon performing a TGA from room temperature to high temperatures (>500 °C), sharp peaks corresponding to the (222), (400), (440), and (622) planes of a highly crystallized form of Ln2O3 having cubic structure are observed [50]. Examples of XRD patterns of ligand-coated Gd2O3 nanoparticles recorded before (i.e., as-prepared) and after TGA [44,47] are provided in Figure 5. The peak positions and the estimated cell constants of the TGA-analyzed samples are well consistent with those given in the literature [51]. The sharp peaks observed in the XRD patterns after TGA are due to the particle size growth and subsequent crystallization of the nanoparticles (Figure 5a,b), which was confirmed by Kattel et al. on the basis of HRTEM images [50,52].
Surface coating of Ln2O3 nanoparticles with hydrophilic and biocompatible ligands is essential for their biomedical applications. The surface coating can be investigated by recording FT-IR absorption spectra. An FT-IR absorption spectrum of PAA-coated Gd2O3 nanoparticles is provided as an example at the bottom of Figure 6a [39], along with an FT-IR absorption spectrum of PAA (Mw = 5100 Da) at the top of the same figure as a reference. The spectrum of the PAA-coated Gd2O3 nanoparticles exhibited a series of bands stemming from PAA, such as C−H stretching (2930 cm−1), COO antisymmetric stretching (1550 cm−1), and COO symmetric stretching vibrations (1400 cm−1). The PAA and the nanoparticle were bonded through a coordination bonding between Gd3+ on the nanoparticle surface as a hard acid and the COO group of PAA as a hard base [53,54,55]. In this case, a stable nanoparticle colloid was formed in aqueous media because of the multiple bonding between many COO groups of PAA (each PAA has ~54 COO groups) and a nanoparticle. On this basis, the bonding between PAA and the Gd2O3 nanoparticle surface was proposed, as displayed in Figure 6b. Another example of surface coating on Gd2O3 nanoparticles is provided in Figure 6c, which displayed the FT-IR absorption spectra of RGD, PAA (Mw = 1800 Da), PAA-Gd2O3, and RGD-PAA-Gd2O3 powder samples [44]. The presence of a C=O stretching band (1553 cm−1) of PAA in the FT-IR absorption spectrum of PAA-Gd2O3 nanoparticles confirmed the PAA surface coating on the Gd2O3 nanoparticles. This band was red-shifted by 144 cm−1 compared with free PAA (1697 cm−1), which can be attributed to the coordination bonding between the COO groups of PAA and the Gd3+ of the Gd2O3 nanoparticles. As mentioned above, each PAA can form many coordination bonds with each Gd2O3 nanoparticle via a hard acid (Gd3+)–hard base (COO) interaction [53,54,55]. The N−H bending vibration at 1544 cm−1 and the C–N stretching vibration at 1390 cm−1 of RGD [56] appeared in the FT-IR absorption spectrum of the RGD-PAA-Gd2O3 nanoparticles, confirming the successful conjugation of RGD to PAA in the PAA-Gd2O3 nanoparticles via amide bond formation.
The EA can also be used to investigate the surface coating of nanoparticles. For example, in carbon-coated Gd2O3 nanoparticles (C@Gd2O3), the C/H/O content, in which H mostly stems from hydrocarbons and -OH groups and O mostly stems from -OH groups on the carbon-coating layer, was determined to be 28.1/3.2/26.5 in wt% [57]. The sum of these wt% is 57.8%, which is fairly consistent with the 56.5% estimated from the TGA curve (Figure 7). As can be seen in Figure 7, the remaining 37.0% corresponds to the mass wt% of Gd2O3 in the C@Gd2O3 nanoparticles. By performing a grafting density analysis [58], the wt% can be converted into the number of ligands grafted onto each nanoparticle surface [47,48].

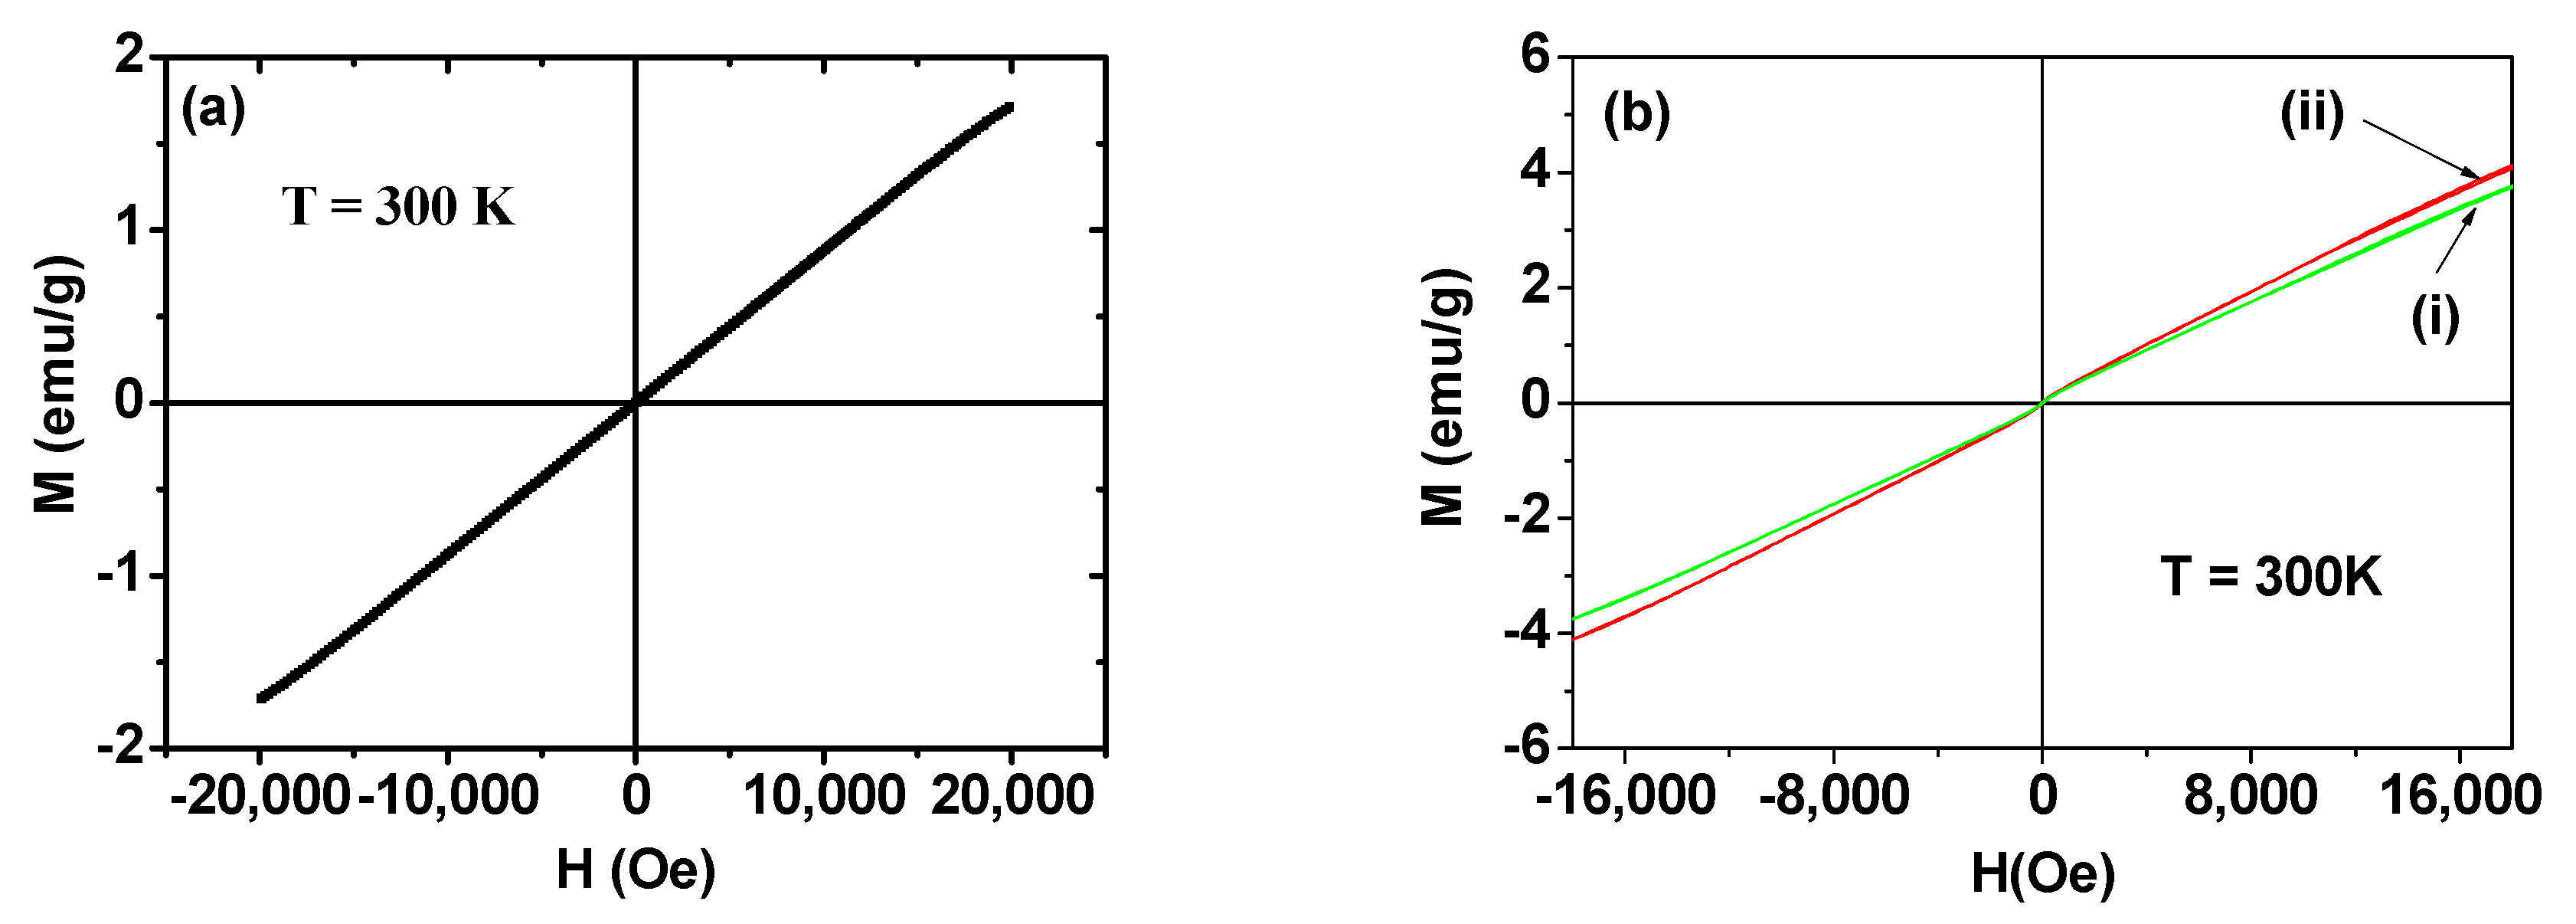
4.2. Magnetic Properties

To obtain high r1 and r2 values for enhanced MR contrast images, the nanoparticles must exhibit large M values at room temperature [59,60]. Figure 8a,b shows the M–H curves of Ln2O3 nanoparticles (Ln = Gd, Tb, Ho) [41,43]. Similar to the corresponding bulk materials [61,62,63], all of the nanoparticle samples are paramagnetic (i.e., no hysteresis, zero coercivity, zero remanence, and low M values) and exhibit appreciable unsaturated M values up to the measured H values at 300 K. From the mass-corrected M–H curve, the net M value of the Gd2O3 nanoparticles, which corresponds to the nanoparticles without ligands, at 2.0 T was estimated to be 1.71 emu/g. This appreciable value is due to the high 4f-electron spin magnetic moment (s = 7/2) of Gd3+ having seven unpaired 4f electrons. Meanwhile, other Ln2O3 nanoparticles (Ln = Tb and Ho) exhibit net M values of 3.8 and 4.1 emu/g at 1.8 T (Figure 8b), respectively, which result from high 4f-electron spin–orbital magnetic moments, i.e., J = 6 for Tb3+ and J = 8 for Ho3+. The slightly higher M value of the Ho2O3 nanoparticles compared with that of the Tb2O3 nanoparticles is due to the higher atomic magnetic moment (µ = 10.60 µB) of Ho3+ compared with that of Tb3+ (= 9.72 µB) [64], where µB is the Bohr magneton.

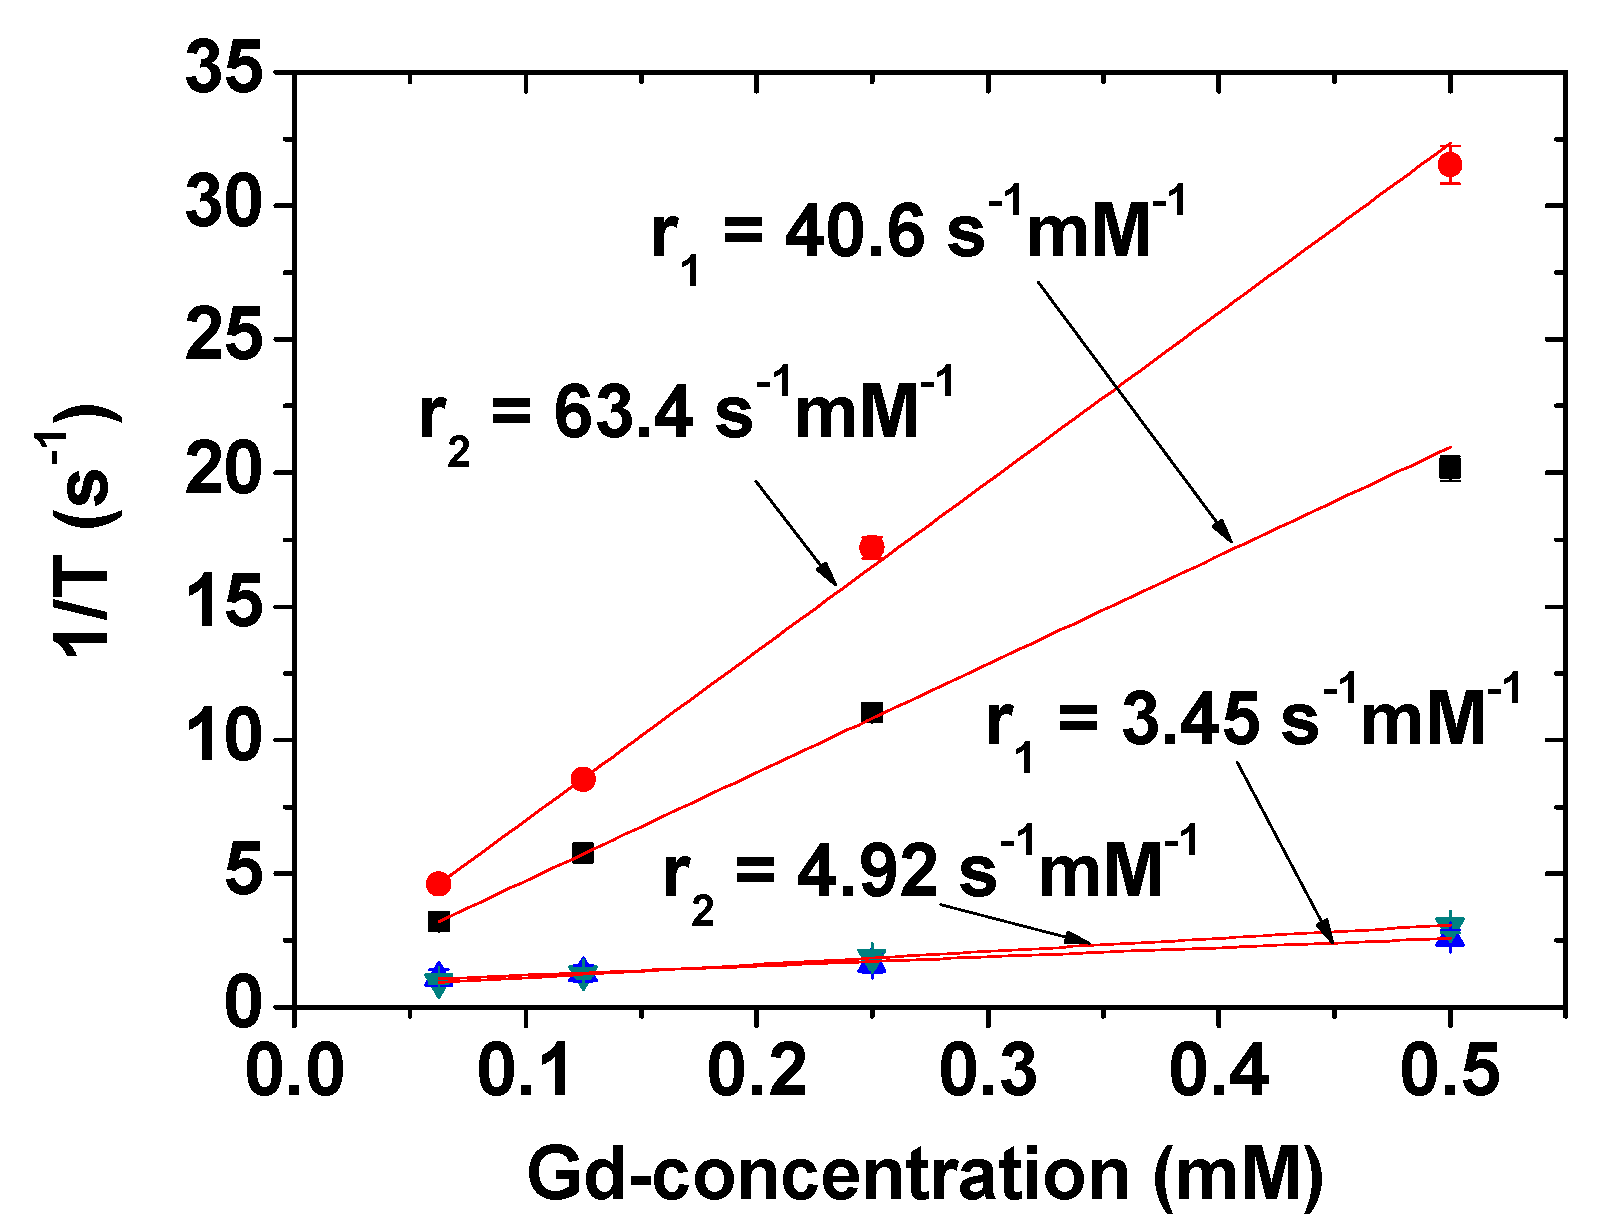
4.3. MR Imaging Properties: r1 and r2 Values

The r1 and r2 values are affected by the number of water molecules around the nanoparticles and the distance between them and, therefore, depend on the water-attracting ability of the ligands around the nanoparticles [59,60,65]. Accordingly, surface-coating ligands should be properly selected. Gd2O3 nanoparticles act as positive (T1) MRI contrast agents due to the high spin magnetic moment of Gd3+ (s = 7/2); they have high r1 values and r2/r1 ratios close to one [39,40,41] (T1 MRI contrast agents exhibit low r2/r1 ratios, whereas T2 MRI contrast agents have high r2/r1 ratios [23]). The r1 and r2 values of PAAMA-coated Gd2O3 nanoparticles at 3.0 T MR field were determined to be 40.6 and 63.4 s−1 mM−1 (r2/r1 = 1.56), respectively, using the 1/T1 and 1/T2 plots versus Gd-concentration depicted in Figure 9 [40]. This r1 value is approximately 10 times higher than those [21,22,23] of commercial molecular T1 MRI contrast agents, such as Dotarem, ProHance, Gadovist, Magnevist, and Omniscan [21,22]. The r1 value also depends on the particle diameter of Gd2O3 nanoparticles, for which the optimal value was suggested to be 1.0 to 2.5 nm [24]. The observed particle diameter of the PAAMA-coated Gd2O3 nanoparticles is within this size range. As a reference, the r1 and r2 values of Gadovist as a commercial molecular agent are provided at the bottom of Figure 9, which shows that this nanoparticle sample is more powerful than Gadovist as a T1 MRI contrast agent. On the other hand, other Ln2O3 nanoparticles (Ln = Tb, Dy, and Ho) show appreciable to high r2 values and negligible r1 values with very large r2/r1 ratios [66]. Therefore, these nanoparticles are suitable as T2 MRI contrast agents. The r2 values of these nanoparticles increased with increasing the MR field [66] because r2 is proportional M2 [59,60]. Therefore, these nanoparticles are expected to provide appreciable T2 MR contrast images at high MR fields. For example, PAA-coated Ln2O3 nanoparticles (Ln = Tb and Ho) exhibit appreciable T2 MR contrast images at 9.4 T MR Field [43]. For comparison, this T2 contrast is lower than that of superparamagnetic iron oxide nanoparticles possessing high saturation magnetizations (50–80 emu/g) and high r2 values [67,68].

5. In Vivo Imaging

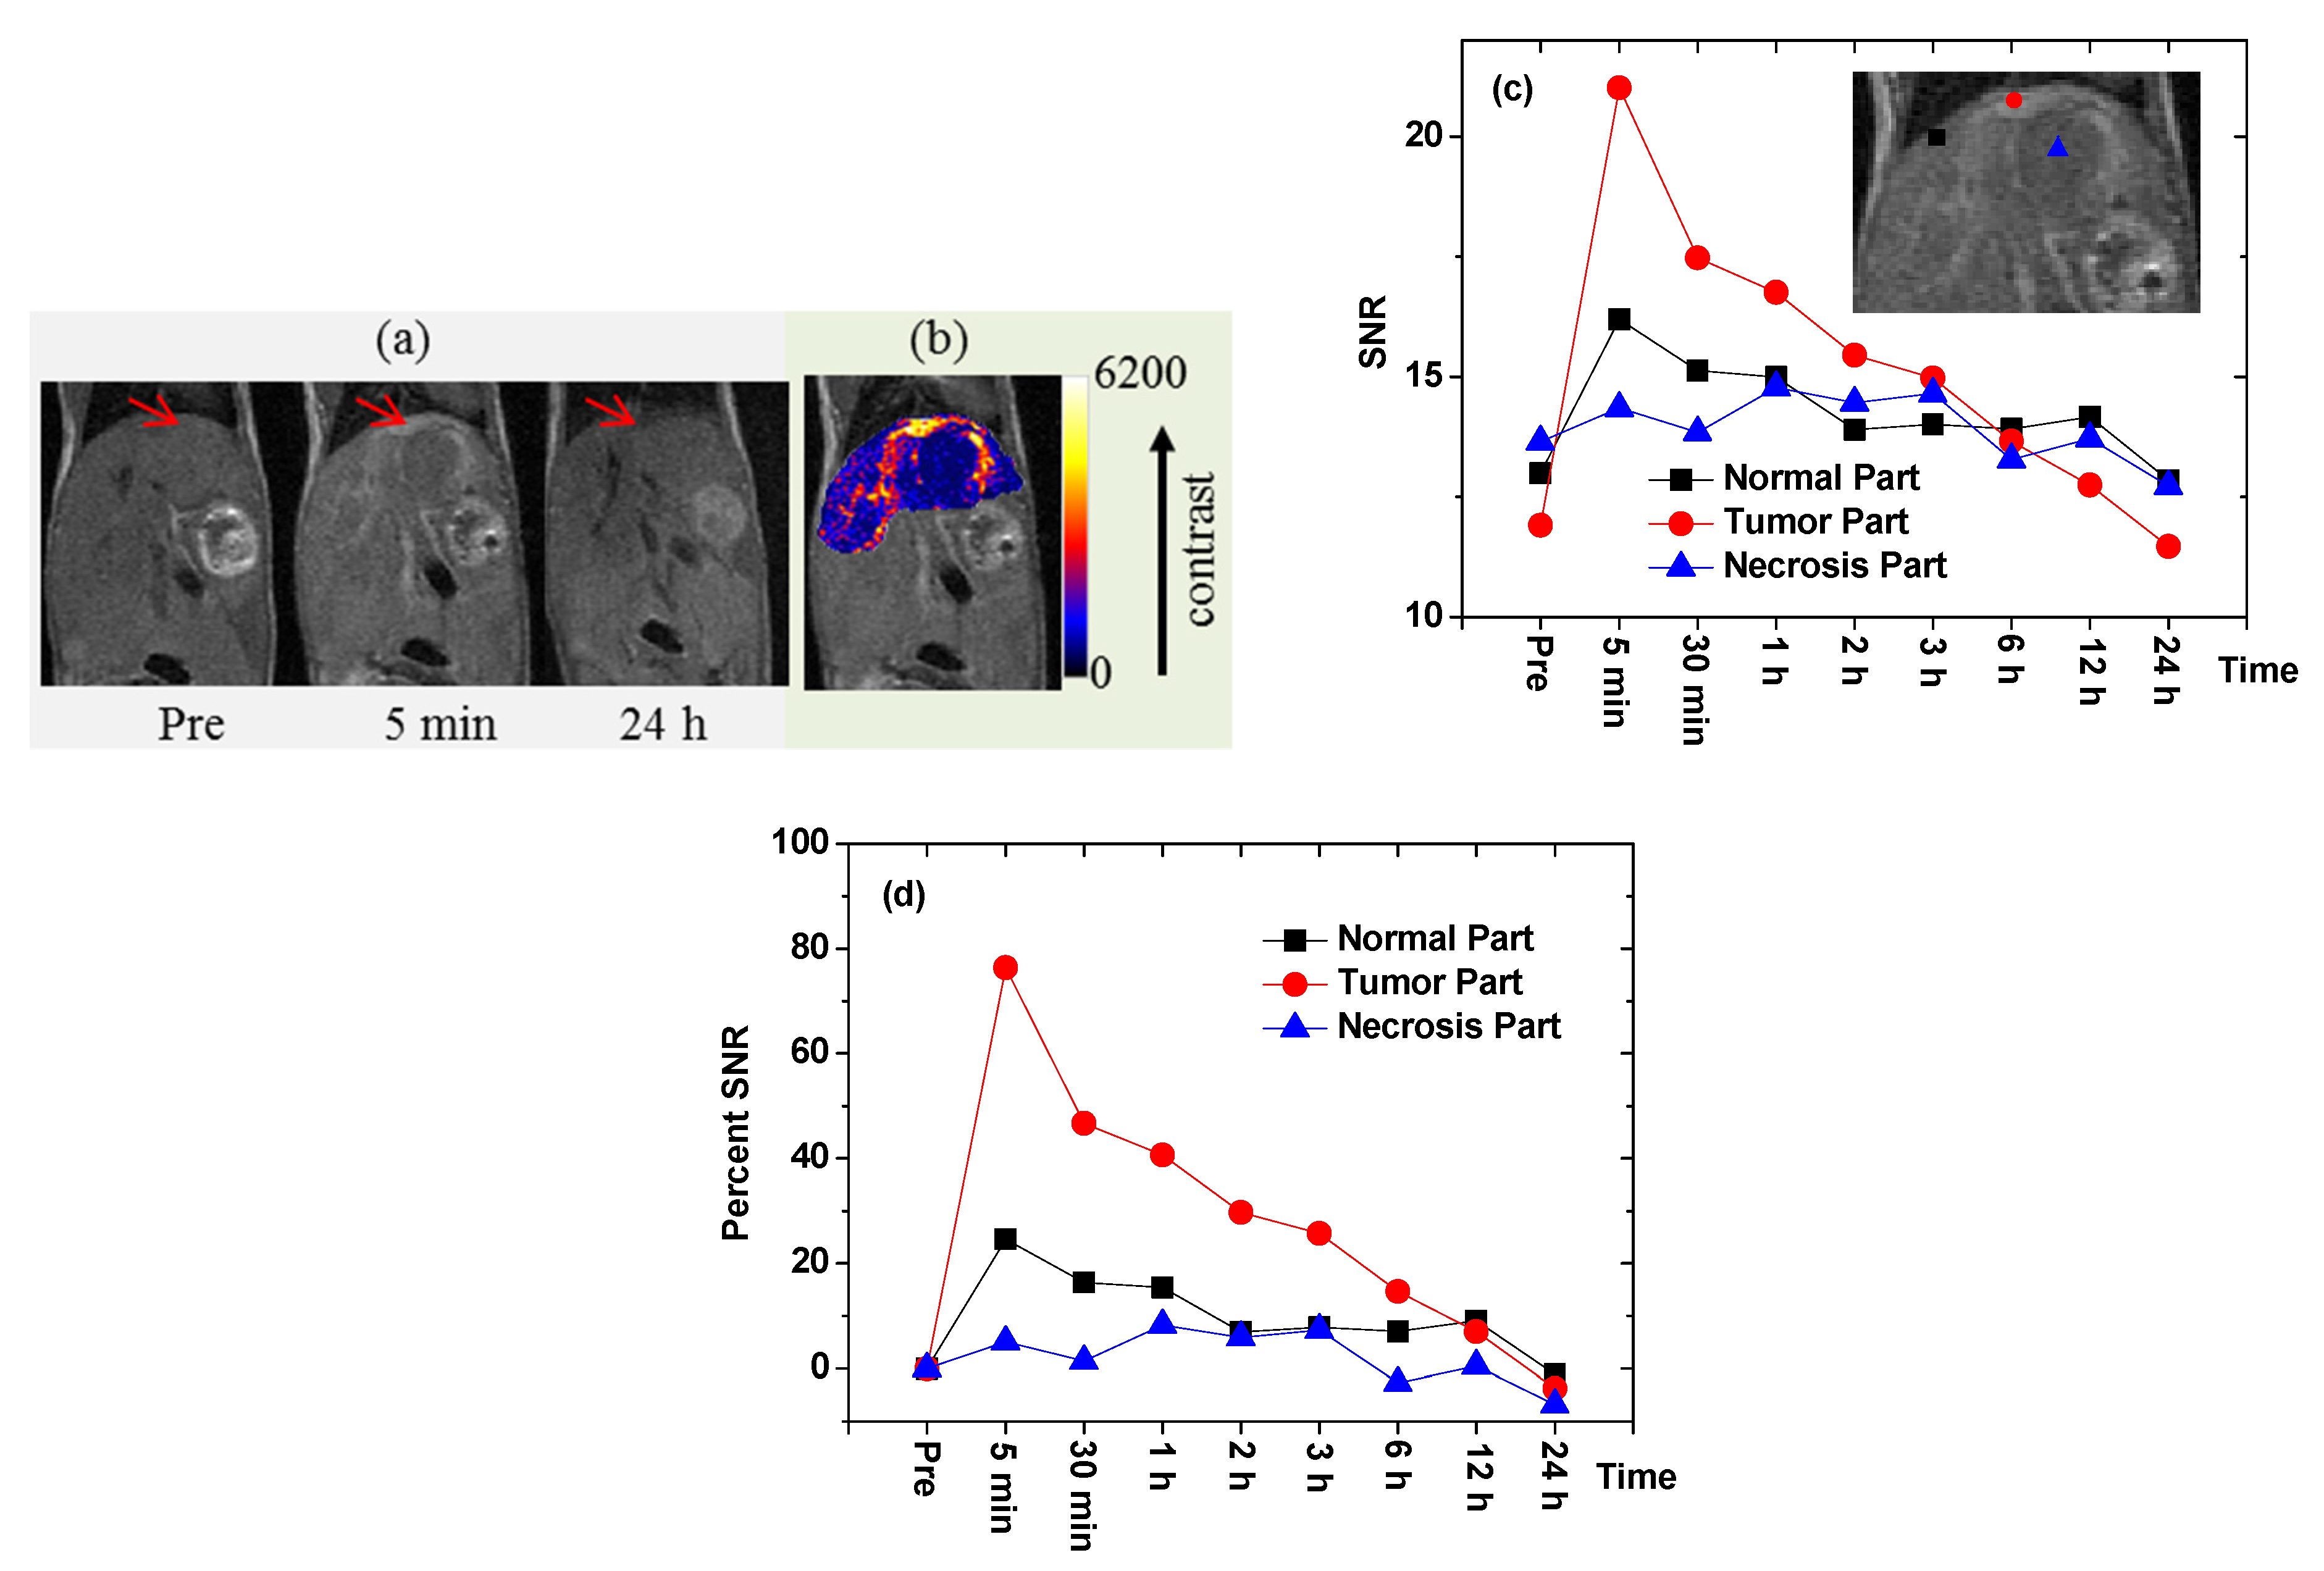
5.1. Tumor-Targeting T1 MRI Contrast Agents

Gd2O3 nanoparticles are the most widely applied Ln2O3 nanoparticles as in vivo tumor-targeting T1 MRI contrast agents because of the high spin magnetic moment (s = 7/2) of Gd3+ (8S7/2), which is the largest value among the elements in the periodic table and thus provides very high T1 MR contrast. Therefore, various studies on the synthesis and application of tumor-targeting Gd2O3 nanoparticles have been reported, which are discussed below according to the type of tumor-targeting ligands used.

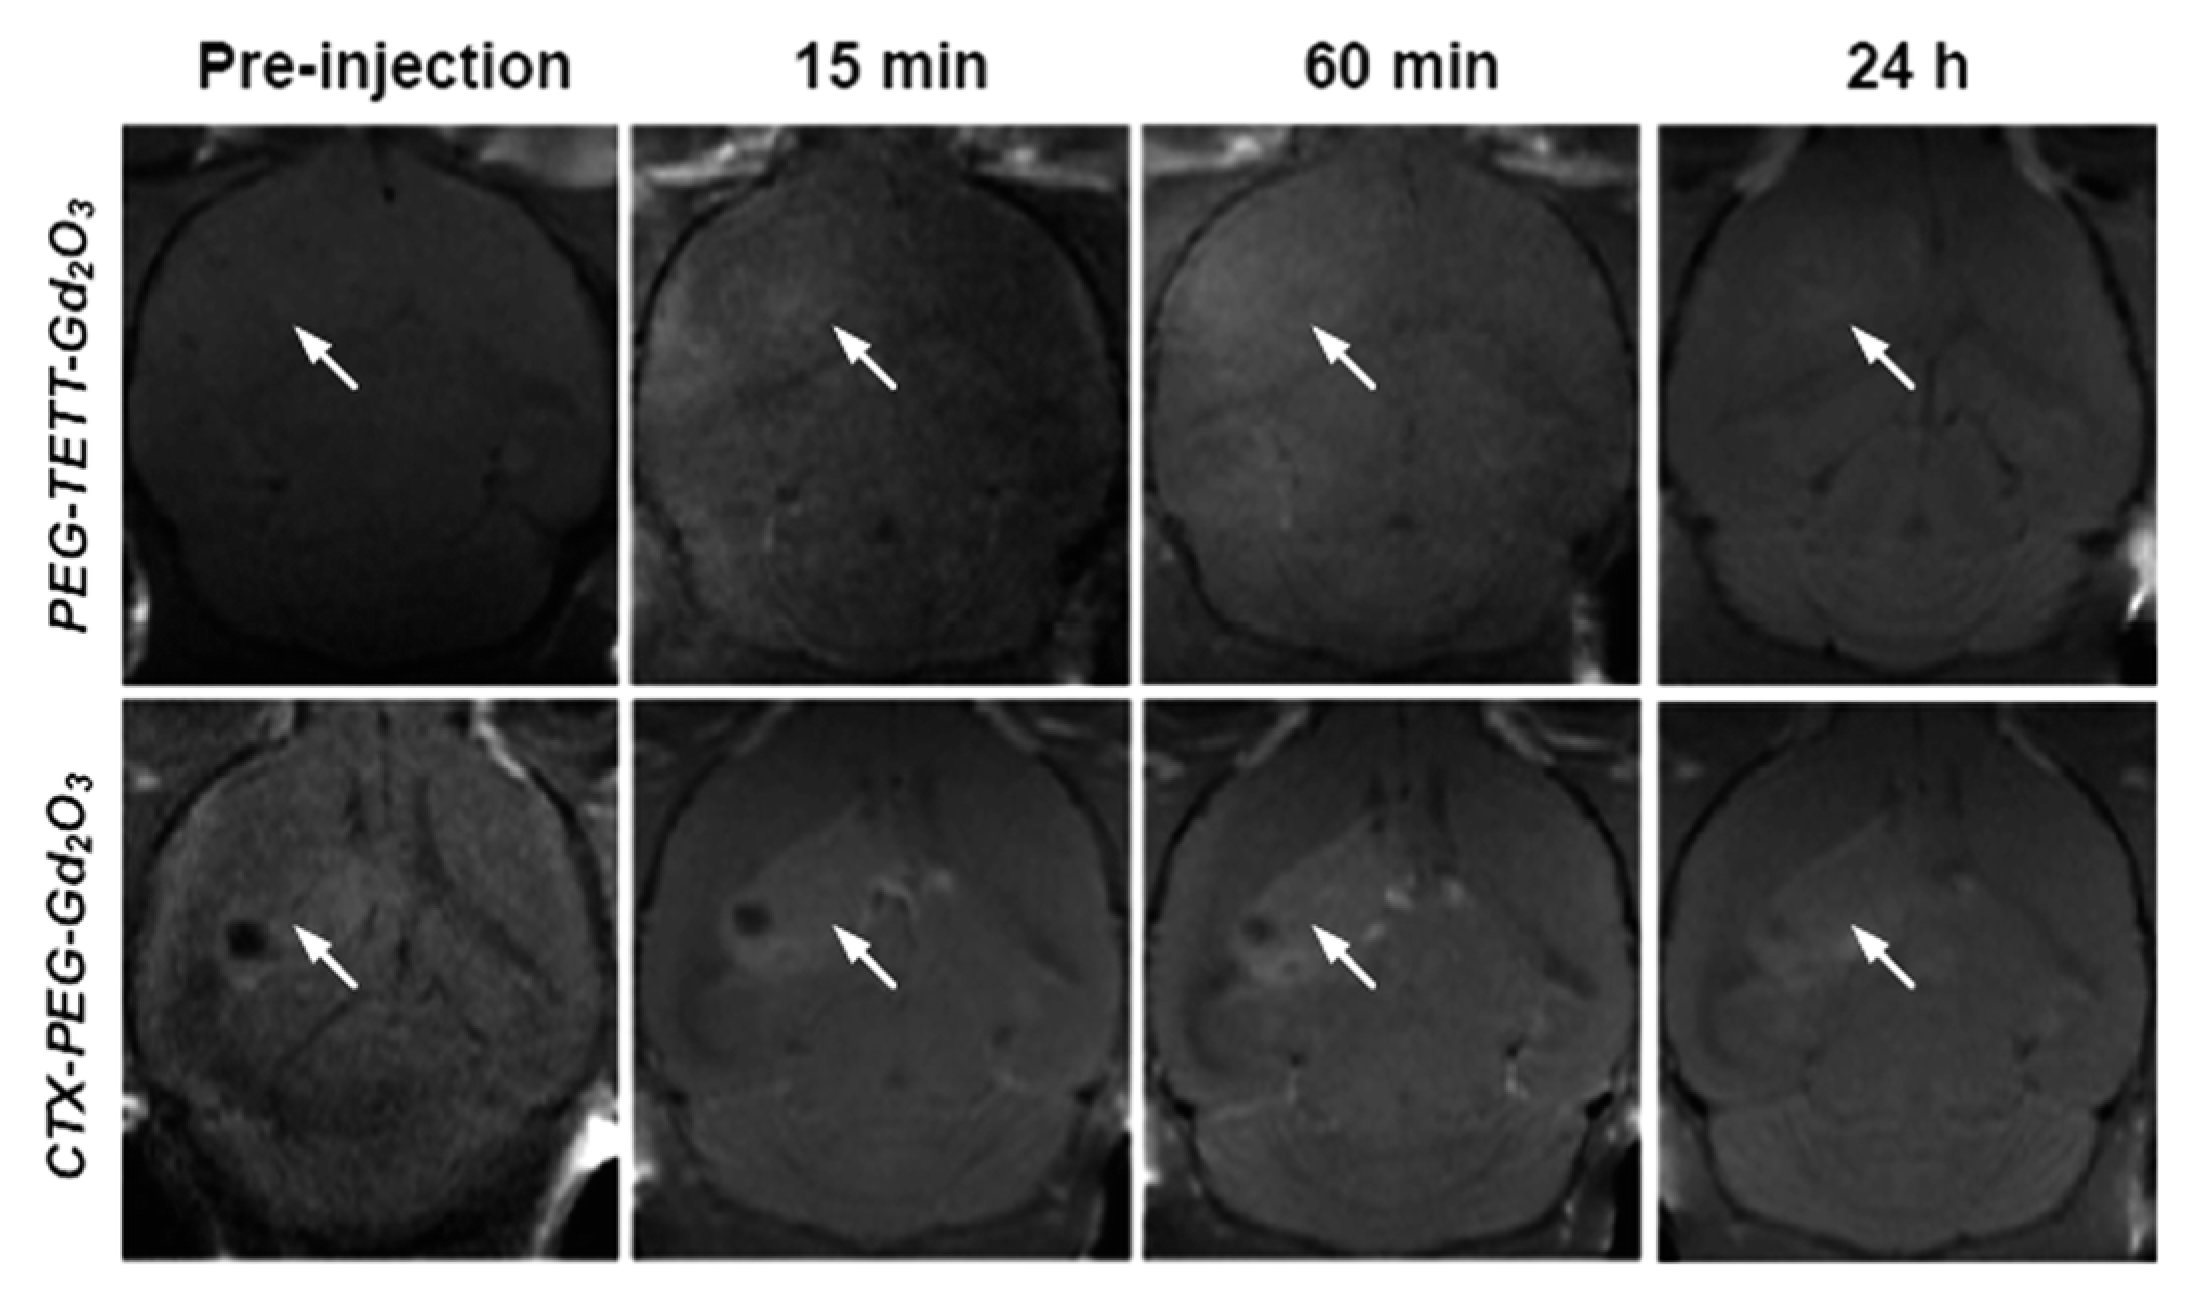
5.1.1. Chlorotoxin (CTX)

Gu et al. developed a mouse brain tumor-targeting contrast agent using CTX as a tumor-targeting ligand [45]. CTX is a peptide consisting of a 36-amino acid sequence found in the venom of the deathstalker scorpion [69]. CTX preferentially binds to glioma cells, enabling the development of therapeutic and diagnostic protocols for several types of tumors [70]. In this study, CTX-PEG-TETT-coated Gd2O3 nanoparticles with a core diameter of 3.46 nm and r1 value of 8.41 s−1 mM−1 at 7.0 T were applied to tumor-targeting imaging in vivo. Figure 10 shows a series of in vivo T1 MR images of mice with brain glioma tumor after mice tail intravenous injection of PEG-TETT-Gd2O3 and CTX-PEG-TETT-Gd2O3 nanoparticle samples at the same Gd dose (6 mg Gd/kg). The PEG-TETT-Gd2O3 nanoparticles slightly improved the contrast of glioma sites (labeled with arrows) compared with the preinjection image. However, the CTX-PEG-TETT-Gd2O3 nanoparticles exhibited highly enhanced T1 MR images in brain tumors (labeled with arrows) after injection, clearly supporting that the CTX-PEG-TETT-Gd2O3 nanoparticles act as a tumor-targeting T1 MRI contrast agent.

5.1.2. Cyclic RGD (cRGD)

Ahmad et al. investigated Gd2O3 nanoparticles that were directly conjugated with cRGDs [47]. Prior to measuring in vivo T1 MR images to confirm tumor targeting, an in vitro cellular incubation experiment was conducted with cRGD-Gd2O3 nanoparticles to confirm the internalization of the nanoparticles in the tumor cells, which is particularly important in the case of tumor theragnosis. To investigate this, human brain glioma (U87MG) tumor cells were incubated with cRGD-Gd2O3 nanoparticles (0.01 mM Gd). Untreated cells as a control group are shown in Figure 11a. The treated cells exhibited different surface morphologies from that of the control cells due to nanoparticle attachment on the tumor cell surfaces (Figure 11b). The internalization of cRGD-Gd2O3 nanoparticles in the tumor cells was confirmed by analyzing the TEM images of the cells, where no cRGD-Gd2O3 nanoparticles were found in the TEM image of the control cells (Figure 11c), whereas they were found in the treated tumor cells (Figure 11d). In addition, an energy-dispersive X-ray (EDX) spectroscopy analysis of the circled region in Figure 11d confirmed the presence of Gd (Figure 11e), supporting the internalization of cRGD-Gd2O3 nanoparticles in the U87MG tumor cells.
To demonstrate the occurrence of in vivo tumor targeting via T1 MRI, a sample solution containing cRGD-Gd2O3 nanoparticles was injected into the tail vein of a U87MG tumor-bearing mouse inoculated into the liver (injection dose = ~0.1 mmol Gd/kg) [47]. T1 MR images were obtained before and after injection (Figure 12a). As shown in the figure, tumor targeting was confirmed via positive contrast enhancement in the liver tumor 5 min after injection, indicating the accumulation of the nanoparticles in the tumor. Figure 12b shows a color map of the middle T1 MR image depicted in Figure 12a, in which the contrast enhancement in the liver tumor (i.e., the widely spread brighter part) can be clearly observed. The signal-to-noise ratios (SNRs) of the three regions of interest (ROIs) in the liver, i.e., the normal region (filled square), the tumor region (filled circle), and the necrotic region (filled triangle), as labeled in the inserted T1 MR image, are plotted versus time in Figure 12c. The T1 contrast enhancement in the liver tumor was approximately three times higher than in the normal region of the liver, as shown in the percentage SNR plots in Figure 12d. These results suggest that the cRGD-Gd2O3 nanoparticles act as a tumor-targeting T1 MRI contrast agent.

5.1.3. TAT Peptide

Ahmad et al. explored the tumor-imaging application of transactivator of transcription (TAT) peptide-conjugated Gd2O3 nanoparticles [48]. The TAT peptide, which contains 48−57 fragments of the basic domain of the human immunodeficiency virus type 1 TAT protein, exhibits cell-penetrating properties [71]. To date, various nanomaterials grafted with TAT peptides have been applied in gene delivery, drug delivery, and tumor-cell imaging [72,73,74]. Ahmad et al. observed a greater accumulation of TAT peptide-grafted Gd2O3 nanoparticles in tumor cells than in normal cells in a mouse via T1 MRI in vivo [48]. The TAT peptide allowed cell penetration of the nanoparticles during circulation through angiogenesis via the EPR effect [26,75].

5.1.4. Linear RGD

Recently, Ho et al. synthesized highly stable Gd2O3 nanoparticles coated with PAA and then conjugated with liner RGD (Figure 2) to target tumors by binding to αvβ3 and αvβ5 integrins, which are overexpressed in tumor angiogenic sites and tumor cells [44]. The RGD-PAA-Gd2O3 nanoparticles accumulated at the tumor sites, showing enhanced T1 contrast at the tumor sites after injection (Figure 13). This result was probably due to the combination of various outstanding properties of the RGD-PAA-Gd2O3 nanoparticles, such as the delivery of hundreds of Gd atoms per nanoparticle to the tumor site, tumor-targeting ability, and ultrasmall size, which provides them with good transport properties during circulation through blood vessels and tumor-cell penetration. This study indicated that the RGD-PAA-Gd2O3 nanoparticles are applicable to in vivo tumor diagnosis.

5.2. MRI-Guided Therapy

One of the main advantages of Gd2O3 nanoparticles as T1 MRI contrast agents is that they can be used for MRI-guided therapy. For example, Le Duc et al. developed gadolinium-based nanoparticles encapsulated in a polysiloxane shell and then grafted with diethylenetriaminepentaacetic dianhydride for nanoparticle colloidal stabilization [76]. They used the nanoparticles for tumor therapy using X-ray microbeam radiation [77,78], which improved the survival of mice against an aggressive brain tumor. The efficacy of this treatment depended on how accurately MRI contrast agents locate the tumor position and shape. In the T1 MR images recorded a few minutes after intravenous injection, the delineation of the tumor was clearly distinguished from normal tissues in a rat brain as shown in Figure 14, and X-ray microbeam radiation was then conducted to kill the brain tumor cells.

5.3. T2-Weighted MRI

Recently, Ln2O3 (Ln = Tb, Dy, and Ho) nanoparticles with appreciable r2 and negligible r1 values, suitable for T2 MRI were developed [42,43,50,66,79,80]. For example, PAA-coated Ln2O3 (Ln = Tb and Ho) nanoparticles exhibited appreciable r2 values at 3.0 T MR field (3.19 s−1 mM−1 for Ln = Tb and 1.44 s−1 mM−1 for Ln = Ho), enhanced r2 values at 9.4 T MR field (16.40 s−1 mM−1 for Ln = Tb and 9.20 s−1 mM−1 for Ln = Ho) [43], and negligible r1 values at all MR fields. With such r1 and r2 values, only the exclusive induction of T2 relaxations by the nanoparticles occurs at all MR fields. The appreciable T2 MR contrast enhancements at 9.4 T MR field confirmed the effectiveness of the nanoparticles as T2 MRI contrast agents at high MR fields in vivo [43]. Dy2O3 nanoparticles constitute another example with application in T2 MRI. Thus, D-glucuronic acid-coated Dy2O3 nanoparticles exhibited T2 MR contrast enhancements in a mouse liver at 3.0 T MR field in vivo [79] (Figure 15a), proving the potential of Dy2O3 nanoparticles as T2 MRI contrast agents. Recently, Yue et al. investigated carbon-coated Dy2O3 nanoparticles as a new class of T2 MRI contrast agent at 3.0 T MR field [80]. The nanoparticles were nearly non-toxic via an in vitro cellular cytotoxicity assay. The presence of numerous hydroxyl groups on the carbon-coating layer conferred the colloidal nanoparticles with stability in aqueous media. The nanoparticles exhibited T2 contrast enhancement in the mice kidneys after intravenous administration, acting as a T2 MRI contrast agent (Figure 15b).

5.4. CT Imaging

Lanthanide elements exhibit higher X-ray attenuation coefficients [16] than iodine, which is currently used as a CT contrast agent in its organic molecular forms. Consequently, Ln2O3 nanoparticles can be applied as CT contrast agents [17,18,81,82]. For example, an aqueous solution of Gd2O3 nanoparticles coated with iodine compounds was used to investigate CT imaging in vivo [81]. Brighter contrast enhancements were observed in mouse bladder (labeled B in Figure 16a) after intravenous tail injection. The X-ray absorption in the ROI of the bladder (indicated by a small, dotted circle in Figure 16a) indicated that the contrast reached a maximum at ~30 min after injection and then decreased with time (Figure 16b), suggesting that the sample solution was excreted through the bladder as urine. This result showed that an aqueous solution of Gd2O3 nanoparticles might serve as a CT contrast agent.

6. Ln2O3 Nanoparticle Toxicity

As shown in Figure 17a, bare Gd2O3 nanoparticles exhibit toxicities in both NCTC1469 normal and U87MG tumor-cell lines, whereas PAA-coated Gd2O3 nanoparticles are nearly non-toxic up to 500 μM Gd with cell viabilities of ∼93% in DU145, ∼99% in NCTC1469, and ∼80% in U87MG cell lines (Figure 17b) [83]. Other PAA-coated Ln2O3 nanoparticles (Ln = Dy, Tb, and Ho) also exhibit very low cytotoxicities in both DU145 and NCTC1469 cell lines (Figure 17c–e) [42,43], showing good biocompatibilities. These examples demonstrate that Ln2O3 nanoparticles must be well protected with water-soluble and biocompatible ligands for biomedical applications.
Lanthanides are relatively non-toxic elements [37,38]. For example, for lanthanide chlorides, the lethal dose causing the death of 50% of a group of 10 animals (LD50) is higher than 10 and 450 mg per kg bodyweight for intravenous and intraperitoneal injections, respectively [84]. In the case of Ln2O3 nanoparticles, other properties, either alone or in concert, must be considered to evaluate the possible toxic effects of the nanoparticles. These properties include chemical composition, doping, hydrodynamic size, shape, redox properties, tendency for aggregation, composition of the shell or coating material, surface modifications, colloidal stability, solubility, biodegradability, concentration, and duration of exposure [85]. Although several studies have investigated the toxicity of lanthanide-based nanoparticles having different properties, such as chemical composition, size, surface ligands, and lanthanide concentration [86,87,88], the lack of literature data has prevented drawing firm conclusions for the assessment of the potential toxicity of Ln2O3 nanoparticles. Furthermore, several aspects of the biological interaction of Ln2O3 nanoparticles in living systems still need to be unveiled. For example, despite in vitro cytotoxicity studies being conducted using various cell cultures, these studies did not provide information about long-term safety and cytotoxicity [89,90], for which in vivo cytotoxicity studies would be needed.
Nevertheless, several important conclusions can be extracted from the currently available literature data. In the case of biomedical applications, Ln2O3 nanoparticles are usually introduced into the body by intravenous injections and circulated by the bloodstream primarily to organs, such as the liver and spleen, kidneys, heart, lungs, and brain [91]. The possible retention or uptake in blood and organs strongly depends on the surface properties of the nanoparticles. Ligand coating can promote the interaction of the Ln2O3 nanoparticles with the cell membranes, favoring the internalization of the nanoparticles by various types of cells. However, biologically inert coating ligands, such as PEG, may prolong the circulation in the bloodstream of nanoparticles [11]. In addition, nanoparticle size is an important factor for the excretion route [92,93]. Thus, nanoparticles smaller than 3 nm can be excreted by renal filtration [19,20], whereas those larger than 3 nm are enclosed by a phagocyte system. As a part of the immune system, the phagocyte system is composed of several types of phagocytic cells in the reticular tissue within the body, whose main function is to remove undesired species, such as bacteria, viruses, and foreign materials, including nanoparticles.
The toxicity of Ln2O3 nanoparticles differs depending on the lanthanide ions. For example, Er2O3 shows higher toxicity than Gd2O3 and La2O3 and is highly toxic to zebrafish embryos at a concentration of 50 ppm Er, causing significant mortality and morphological malformations [93]. Meanwhile, the toxicity of Gd2O3 nanoparticles is primarily attributed to the release of Gd3+ ions [94,95,96]. The toxicity of Gd3+ ions has been addressed not only for Gd2O3 nanoparticles but also for a variety of molecular Gd3+-chelates. In the case of Gd2O3 nanomaterials, Eu3+-doped Gd2O3 (Gd2O3:Eu3+) nanotubes can adversely affect bone marrow stromal cells (BMSCs) [97]. Yang et al. reported the application of 153Sm-doped Gd(OH)3 nanorods as a potential MRI contrast agent [98]. In vitro cell toxicity tests revealed that Gd(OH)3 nanorods have no toxic effect on cellular proliferation and viability. Furthermore, an in vivo toxicity test using Kunming mice showed that injection up to 100 mg/kg of Gd(OH)3 nanorods had no toxic effect up to 150 days after exposure. However, this in vivo test investigated the short-term toxic effect of Gd(OH)3 nanorods. In contrast, the long-term toxicity of clinically used Gd3+-chelates was reported. When used in patients with severely compromised kidney function, Gd3+-chelates promoted the development of nephrogenic systemic fibrosis (NSF), which is a rare disease affecting different parts of the body that can lead to thickening or hardening of the skin and deposits [99] (Figure 18). Moreover, NSF is a progressive condition that can be fatal because it may cause multiple organ failure [99,100,101,102]. Gd3+ retention in the body, which is greater with linear structured Gd3+-chelates than with macrocyclic structured Gd3+-chelates, was demonstrated to be associated with NSF.
Compared with clinically used Gd3+-chelates, the toxicity of Ln2O3 nanoparticles, including Gd2O3 nanoparticles, has been less explored. For instance, the extent, mechanism, chemical form, and clinical implications of chronic lanthanide retention for Ln2O3 nanoparticles remain unknown. Therefore, more comprehensive investigations are required to improve our understanding of Ln2O3 nanoparticle toxicity and its clinical importance. In this context, the development of new experimental techniques may play a significant role in unveiling lanthanide nanotoxicity. For example, nanotoxicogenomics [103], which uses DNA microarray technologies to investigate the impact of nanoparticles on global gene expression profiles of cells and tissues, has emerged as a new field of toxicology to provide new and important insights into the toxicity of Ln2O3 nanoparticles.

7. Conclusions and Perspectives

Recent studies on the synthesis, surface modification, tumor-targeting ligand conjugation, toxicity, and novel biomedical applications to tumor-targeting T1 MRI and image-guided tumor therapy of Ln2O3 nanoparticles were reviewed here. In addition, T2 MRI and CT imaging applications were also discussed. High-quality Ln2O3 nanoparticles can be synthesized via the polyol method and organic-phase thermal decomposition method and then surface-coated with hydrophilic and biocompatible ligands for colloidal stability and biocompatibility. Polymers are more efficient than small molecules as surface-coating ligands because of their many –COOH, –NH2, –OH groups, which can be attached to nanoparticles and conjugated with tumor-targeting ligands and drugs.
The interest in Ln2O3 nanoparticles in the field of medical imaging lies principally in the excellent imaging properties of lanthanides, which arises from their appreciable paramagnetic moments at room temperature; Gd3+ has the highest 4f-electron spin magnetic moment (s = 7/2) among the elements in the periodic table, which is extremely useful for T1 MRI, and other Ln3+ ions (Ln = Tb, Dy, and Ho) have a very high 4f-electron spin–orbital magnetic moment, which is suitable for T2 MRI. In addition, lanthanide elements possess higher X-ray attenuation coefficients than iodine, which is currently used as a CT contrast agent in its organic compound forms. The potential of Ln2O3 nanoparticles as CT contrast agents has been confirmed by recording in vivo CT images. In the case of tumor targeting, Gd2O3 nanoparticles are the most widely investigated Ln2O3 nanoparticles due to their very high T1 MRI sensitivity. Various tumor-targeting ligands have been conjugated to Gd2O3 nanoparticles for tumor imaging and T1 MRI-guided tumor therapy. Especially, the enhanced accumulation of tumor-targeting ligand-coated Gd2O3 nanoparticles at tumor cells compared with that at normal cells allowed the development of precise image-guided tumor therapies via clear distinction and delineation of tumors from normal tissues.
As reviewed here, further intensive research is essential to achieve the ultimate goal of using Ln2O3 nanoparticles for tumor-targeting diagnosis and therapy and nontumor-targeting medical imaging. In addition, sophisticated toxicological and pharmacological improvements are required to demonstrate the safety of nanoparticle formulations prior to clinical trials. We hope that this review will guide the future development of biomedical applications of Ln2O3 nanoparticles.

Author Contributions

Conceptualization, M.Y.A., H.Y., T.T., S.L., S.L.H., G.H.L., S.-W.N. and Y.C.; investigation, M.Y.A., H.Y., T.T., S.L., S.L.H., G.H.L., S.-W.N. and Y.C.; writing—original draft preparation, M.Y.A.; writing—review and editing, G.H.L. and Y.C.; funding acquisition, G.H.L., Y.C. and S.-W.N. All authors have read and agreed to the published version of the manuscript.

Funding

This work was supported by the Basic Science Research Program of the National Research Foundation (NRF) funded by the Ministry of Education, Science, and Technology (No. 2016R1D1A3B01007622) and the Korean government (Ministry of Science, and Information and Communications Technology: MSIT) (No. 2021R1A4A1029433).

Informed Consent Statement

Not applicable.

Data Availability Statement

Not applicable.

Conflicts of Interest

The authors declare no conflict of interest.

References

  1. García-Figueiras, R.; Baleato-González, S.; Padhani, A.; Luna-Alcalá, A.; Vallejo-Casas, J.A.; Sala, E.; Vilanova, J.C.; Koh, D.-M.; Herranz-Carnero, M.; Vargas, H.A. How clinical imaging can assess cancer biology. Insights Imaging 2019, 10, 1–35. [Google Scholar] [CrossRef]
  2. Lecouvet, F.E. Whole-Body MR Imaging: Musculoskeletal Applications. Radiology 2016, 279, 345–365. [Google Scholar] [CrossRef]
  3. Morone, M.; Bali, M.A.; Tunariu, N.; Messiou, C.; Blackledge, M.; Grazioli, L.; Koh, D.-M. Whole-Body MRI: Current Applications in Oncology. Am. J. Roentgenol. 2017, 209. [Google Scholar] [CrossRef]
  4. Thakor, A.S.; Jokerst, J.V.; Ghanouni, P.; Campbell, J.L.; Mittra, E.; Gambhir, S.S. Clinically Approved Nanoparticle Imaging Agents. J. Nucl. Med. 2016, 57, 1833–1837. [Google Scholar] [CrossRef] [Green Version]
  5. Kim, J.; Lee, N.; Hyeon, T. Recent development of nanoparticles for molecular imaging. Philos. Trans. R. Soc. A Math. Phys. Eng. Sci. 2017, 375, 20170022. [Google Scholar] [CrossRef]
  6. Ehlerding, E.B.; Grodzinski, P.; Cai, W.; Liu, C.H. Big Potential from Small Agents: Nanoparticles for Imaging-Based Companion Diagnostics. ACS Nano 2018, 12, 2106–2121. [Google Scholar] [CrossRef] [PubMed]
  7. Crist, R.M.; Dasa, S.S.K.; Liu, C.H.; Clogston, J.D.; Dobrovolskaia, M.A.; Stern, S.T. Challenges in the development of nanoparticle-based imaging agents: Characterization and biology. Wiley Interdiscip. Rev. Nanomed. Nanobiotechnol. 2020, 13. [Google Scholar] [CrossRef]
  8. Sanità, G.; Carrese, B.; Lamberti, A. Nanoparticle Surface Functionalization: How to Improve Biocompatibility and Cellular Internalization. Front. Mol. Biosci. 2020, 7. [Google Scholar] [CrossRef]
  9. Thiruppathi, R.; Mishra, S.; Ganapathy, M.; Padmanabhan, P.; Gulyás, B. Nanoparticle Functionalization and Its Potentials for Molecular Imaging. Adv. Sci. 2016, 4, 1600279. [Google Scholar] [CrossRef]
  10. Ye, H.; Shen, Z.; Yu, L.; Wei, M.; Huilin, Y. Manipulating nanoparticle transport within blood flow through external forces: An exemplar of mechanics in nanomedicine. Proc. R. Soc. A Math. Phys. Eng. Sci. 2018, 474, 20170845. [Google Scholar] [CrossRef] [PubMed] [Green Version]
  11. Suk, J.S.; Xu, Q.; Kim, N.; Hanes, J.; Ensign, L.M. PEGylation as a strategy for improving nanoparticle-based drug and gene delivery. Adv. Drug Deliv. Rev. 2015, 99, 28–51. [Google Scholar] [CrossRef] [PubMed] [Green Version]
  12. Yue, H.; Park, J.Y.; Chang, Y.; Lee, G.H. Ultrasmall Europium, Gadolinium, and Dysprosium Oxide Nanoparticles: Polyol Synthesis, Properties, and Biomedical Imaging Applications. Mini-Rev. Med. Chem. 2020, 20, 1767–1780. [Google Scholar] [CrossRef] [PubMed]
  13. Xu, W.; Kattel, K.; Park, J.Y.; Chang, Y.; Kim, T.J.; Lee, G.H. Paramagnetic nanoparticle T1 and T2 MRI contrast agents. Phys. Chem. Chem. Phys. 2012, 14, 12687–12700. [Google Scholar] [CrossRef]
  14. Dong, H.; Du, S.-R.; Zheng, X.-Y.; Lyu, G.-M.; Sun, L.-D.; Li, L.-D.; Zhang, P.-Z.; Zhang, C.; Yan, C.-H. Lanthanide Nanoparticles: From Design toward Bioimaging and Therapy. Chem. Rev. 2015, 115, 10725–10815. [Google Scholar] [CrossRef]
  15. Xu, W.; Chang, Y.; Lee, G.H. Biomedical Applications of Lanthanide Oxide Nanoparticles. J. Biomater. Tissue Eng. 2017, 7, 757–769. [Google Scholar] [CrossRef]
  16. Hubbell, J.H.; Seltzer, S.M. Tables of X-Ray Mass Attenuation Coefficients and Mass Energy-Absorption Coefficients from 1 keV to 20 MeV for Elements Z = 1 to 92 and 48 Additional Substances of Dosimetric Interest; NIST: Gaithersburg, MD, USA, 1996. Available online: http://www.nist.gov/pml/data/xraycoef (accessed on 1 July 2021).
  17. Ghazanfari, A.; Marasini, S.; Miao, X.; Park, J.A.; Jung, K.-H.; Ahmad, M.Y.; Yue, H.; Ho, S.L.; Liu, S.; Jang, Y.J.; et al. Synthesis, characterization, and X-ray attenuation properties of polyacrylic acid-coated ultrasmall heavy metal oxide (Bi2O3, Yb2O3, NaTaO3, Dy2O3, and Gd2O3) nanoparticles as potential CT contrast agents. Colloids Surfaces A Physicochem. Eng. Asp. 2019, 576, 73–81. [Google Scholar] [CrossRef]
  18. Lee, E.J.; Heo, W.C.; Park, J.W.; Chang, Y.; Bae, J.-E.; Chae, K.S.; Kim, T.J.; Park, J.A.; Lee, G.H. D-Glucuronic Acid Coated Gd(IO3)3·2H2O Nanomaterial as a PotentialT1MRI-CT Dual Contrast Agent. Eur. J. Inorg. Chem. 2013, 2013, 2858–2866. [Google Scholar] [CrossRef]
  19. Xu, J.; Peng, C.; Yu, M.; Zheng, J. Renal clearable noble metal nanoparticles: Photoluminescence, elimination, and biomedical applications. Wiley Interdiscip. Rev. Nanomed. Nanobiotechnol. 2017, 9, e1453. [Google Scholar] [CrossRef] [PubMed]
  20. Du, B.; Yu, M.; Zheng, J. Transport and interactions of nanoparticles in the kidneys. Nat. Rev. Mater. 2018, 3, 358–374. [Google Scholar] [CrossRef]
  21. Hermann, P.; Kotek, J.; Kubíček, V.; Lukeš, I. Gadolinium(III) complexes as MRI contrast agents: Ligand design and properties of the complexes. Dalton Trans. 2008, 3027–3047. [Google Scholar] [CrossRef] [PubMed]
  22. Chan, K.W.-Y.; Wong, W.-T. Small molecular gadolinium(III) complexes as MRI contrast agents for diagnostic imaging. Co-Ord. Chem. Rev. 2007, 251, 2428–2451. [Google Scholar] [CrossRef]
  23. Wahsner, J.; Gale, E.M.; Rodríguez-Rodríguez, A.; Caravan, P. Chemistry of MRI Contrast Agents: Current Challenges and New Frontiers. Chem. Rev. 2018, 119, 957–1057. [Google Scholar] [CrossRef] [PubMed]
  24. Park, J.Y.; Baek, M.J.; Choi, E.S.; Woo, S.; Kim, J.H.; Kim, T.J.; Jung, J.C.; Chae, K.S.; Chang, Y.; Lee, G.H. Paramagnetic Ultrasmall Gadolinium Oxide Nanoparticles as Advanced T1 MRI Contrast Agent: Account for Large Longitudinal Relaxivity, Optimal Particle Diameter, and In Vivo T1 MR Images. ACS Nano 2009, 3, 3663–3669. [Google Scholar] [CrossRef]
  25. Cho, M.; Sethi, R.; Narayanan, J.S.A.; Lee, S.S.; Benoit, D.N.; Taheri, N.; Decuzzi, P.; Colvin, V.L. Gadolinium oxide nanoplates with high longitudinal relaxivity for magnetic resonance imaging. Nanoscale 2014, 6, 13637–13645. [Google Scholar] [CrossRef] [PubMed] [Green Version]
  26. Tee, J.K.; Yip, L.X.; Tan, E.S.; Santitewagun, S.; Prasath, A.; Ke, P.C.; Ho, H.K.; Leong, D.T. Nanoparticles’ interactions with vasculature in diseases. Chem. Soc. Rev. 2019, 48, 5381–5407. [Google Scholar] [CrossRef]
  27. Danhier, F.; Le Breton, A.; Préat, V. RGD-Based Strategies To Target Alpha(v) Beta(3) Integrin in Cancer Therapy and Diagnosis. Mol. Pharm. 2012, 9, 2961–2973. [Google Scholar] [CrossRef]
  28. Zhou, Q.-H.; You, Y.-Z.; Wu, C.; Huang, Y.; Oupický, D. Cyclic RGD-targeting of reversibly stabilized DNA nanoparticles enhances cell uptake and transfection in vitro. J. Drug Target. 2009, 17, 364–373. [Google Scholar] [CrossRef] [PubMed] [Green Version]
  29. Boturyn, D.; Dumy, P. Tumor Targeting with RGD Peptide Ligands-Design of New Molecular Conjugates for Imaging and Therapy of Cancers. Anti-Cancer Agents Med. Chem. 2007, 7, 552–558. [Google Scholar] [CrossRef]
  30. Li, J.; Zheng, L.; Cai, H.; Sun, W.; Shen, M.; Zhang, G.; Shi, X. Polyethyleneimine-mediated synthesis of folic acid-targeted iron oxide nanoparticles for in vivo tumor MR imaging. Biomaterials 2013, 34, 8382–8392. [Google Scholar] [CrossRef]
  31. Marasini, S.; Yue, H.; Ho, S.-L.; Park, J.-A.; Kim, S.; Yang, J.-U.; Cha, H.; Liu, S.; Tegafaw, T.; Ahmad, M.; et al. In Vivo Positive Magnetic Resonance Imaging of Brain Cancer (U87MG) Using Folic Acid-Conjugated Polyacrylic Acid-Coated Ultrasmall Manganese Oxide Nanoparticles. Appl. Sci. 2021, 11, 2596. [Google Scholar] [CrossRef]
  32. Huang, R.; Han, L.; Li, J.; Liu, S.; Shao, K.; Kuang, Y.; Hu, X.; Wang, X.; Lei, H.; Jiang, C. Chlorotoxin-modified macromolecular contrast agent for MRI tumor diagnosis. Biomaterials 2011, 32, 5177–5186. [Google Scholar] [CrossRef]
  33. Cohen, G.; Burks, S.R.; Frank, J.A. Chlorotoxin—A Multimodal Imaging Platform for Targeting Glioma Tumors. Toxins 2018, 10, 496. [Google Scholar] [CrossRef] [PubMed] [Green Version]
  34. Zahavi, D.; Weiner, L. Monoclonal antibodies in cancer therapy. Antibodies 2020, 9, 34. [Google Scholar] [CrossRef] [PubMed]
  35. Beck, A.; Goetsch, L.; Dumontet, C.; Corvaïa, N. Strategies and challenges for the next generation of antibody–drug conjugates. Nat. Rev. Drug Discov. 2017, 16, 315–337. [Google Scholar] [CrossRef] [PubMed]
  36. Bouchard, H.; Viskov, C.; Garcia-Echeverria, C. Antibody-drug conjugates-a new wave of cancer drugs. Bioorg. Med. Chem. Lett. 2014, 24, 5357–5363. [Google Scholar] [CrossRef] [Green Version]
  37. Wells, W.H., Jr.; Wells, V.L. The lanthanides, rare earth metals. In Patty’s Toxicology, 6th ed.; Bingham, E., Cohrssen, B., Eds.; John Wiley & Sons, Inc.: Berlin, Germany, 2012; Volume 1, pp. 817–840. [Google Scholar]
  38. Malhotra, N.; Hsu, H.-S.; Liang, S.-T.; Roldan, M.J.M.; Lee, J.-S.; Ger, T.-R.; Hsiao, C.-D. An Updated Review of Toxicity Effect of the Rare Earth Elements (REEs) on Aquatic Organisms. Animals 2020, 10, 1663. [Google Scholar] [CrossRef]
  39. Miao, X.; Ho, S.L.; Tegafaw, T.; Cha, H.; Chang, Y.; Oh, I.T.; Yaseen, A.M.; Marasini, S.; Ghazanfari, A.; Yue, H.; et al. Stable and non-toxic ultrasmall gadolinium oxide nanoparticle colloids (coating material = polyacrylic acid) as high-performance T1 magnetic resonance imaging contrast agents. RSC Adv. 2018, 8, 3189–3197. [Google Scholar] [CrossRef] [Green Version]
  40. Jang, Y.J.; Liu, S.; Yue, H.; Park, J.A.; Cha, H.; Ho, S.L.; Marasini, S.; Ghazanfari, A.; Ahmad, M.Y.; Miao, X.; et al. Hydrophilic biocompatible poly(acrylic acid-co-maleic acid) polymer as a surface-coating ligand of ultrasmall Gd2O3 nanoparticles to obtain a high r1 value and T1 MR images. Diagnostics 2021, 11, 2. [Google Scholar] [CrossRef]
  41. Ahmad, M.Y.; Ahmad, W.; Yue, H.; Ho, S.L.; Park, J.A.; Jung, K.-H.; Cha, H.; Marasini, S.; Ghazanfari, A.; Liu, S.; et al. In Vivo Positive Magnetic Resonance Imaging Applications of Poly(methyl vinyl ether-alt-maleic acid)-coated Ultra-small Paramagnetic Gadolinium Oxide Nanoparticles. Molecules 2020, 25, 1159. [Google Scholar] [CrossRef] [Green Version]
  42. Marasini, S.; Yue, H.; Ho, S.L.; Cha, H.; Park, J.A.; Jung, K.; Ghazanfari, A.; Ahmad, M.Y.; Liu, S.; Chae, K.; et al. A Novel Paramagnetic Nanoparticle T2 Magnetic Resonance Imaging Contrast Agent with High Colloidal Stability: Polyacrylic Acid-Coated Ultrafine Dysprosium Oxide Nanoparticles. Bull. Korean Chem. Soc. 2020, 41, 829–836. [Google Scholar] [CrossRef]
  43. Marasini, S.; Yue, H.; Ho, S.L.; Park, J.; Kim, S.; Jung, K.H.; Cha, H.; Liu, S.; Tegafaw, T.; Ahmad, M.Y.; et al. Synthesis, Characterizations, and 9.4 tesla T2 MR images of polyacrylic acid-coated terbium (III) and holmium (III) oxide nanoparticles. Nanomaterials 2021, 11, 1355. [Google Scholar] [CrossRef]
  44. Ho, S.L.; Choi, G.; Yue, H.; Kim, H.-K.; Jung, K.-H.; Park, J.A.; Kim, M.H.; Lee, Y.J.; Kim, J.Y.; Miao, X.; et al. In vivo neutron capture therapy of cancer using ultrasmall gadolinium oxide nanoparticles with cancer-targeting ability. RSC Adv. 2020, 10, 865–874. [Google Scholar] [CrossRef] [Green Version]
  45. Gu, W.; Song, G.; Li, S.; Shao, C.; Yan, C.; Ye, L. Chlorotoxin-conjugated, PEGylated Gd2O3 nanoparticles as a glioma-specific magnetic resonance imaging contrast agent. RSC Adv. 2014, 4, 50254–50260. [Google Scholar] [CrossRef]
  46. Stoddart, M.J. Mammalian Cell Viability, Methods and Protocols; Humana Press: New York, NY, USA, 2011. [Google Scholar]
  47. Ahmad, M.Y.; Ahmad, M.W.; Cha, H.; Oh, I.-T.; Tegafaw, T.; Miao, X.; Ho, S.L.; Marasini, S.; Ghazanfari, A.; Yue, H.; et al. Cyclic RGD-Coated Ultrasmall Gd2O3 Nanoparticles as Tumor-Targeting Positive Magnetic Resonance Imaging Contrast Agents. Eur. J. Inorg. Chem. 2018, 2018, 3070–3079. [Google Scholar] [CrossRef]
  48. Ahmad, M.Y.; Cha, H.; Oh, I.T.; Tegafaw, T.; Miao, X.; Ho, S.L.; Marasini, S.; Ghazanfari, A.; Yue, H.; Chae, K.S.; et al. Synthesis, characterization, and enhanced cancer-Imaging application of trans-activator of transcription peptide-conjugated ultrasmall gadolinium oxide nanoparticles. Bull. Korean Chem. Soc. 2018, 39, 435–441. [Google Scholar] [CrossRef]
  49. Söderlind, F.; Pedersen, H.; Petoral, R.M.; Käll, P.-O.; Uvdal, K. Synthesis and characterisation of Gd2O3 nanocrystals functionalised by organic acids. J. Colloid Interface Sci. 2005, 288, 140–148. [Google Scholar] [CrossRef]
  50. Kattel, K.; Park, J.Y.; Xu, W.; Kim, H.G.; Lee, E.J.; Alam Bony, B.; Heo, W.C.; Lee, J.J.; Jin, S.; Baeck, J.S.; et al. A Facile Synthesis, In vitro and In vivo MR Studies of d-Glucuronic Acid-Coated Ultrasmall Ln2O3 (Ln = Eu, Gd, Dy, Ho, and Er) Nanoparticles as a New Potential MRI Contrast Agent. ACS Appl. Mater. Interfaces 2011, 3, 3325–3334. [Google Scholar] [CrossRef]
  51. Heiba, Z.; Okuyucu, H.; Hascicek, Y.S. X-ray structure determination of the rare earth oxides (Er1-uGd)2O3 applying the Rietveld method. J. Appl. Crystallogr. 2002, 35, 577–580. [Google Scholar] [CrossRef] [Green Version]
  52. Kattel, K.; Park, J.Y.; Xu, W.; Kim, H.G.; Lee, E.J.; Alam Bony, B.; Heo, W.C.; Chang, Y.; Kim, T.J.; Do, J.Y.; et al. Water-soluble ultrasmall Eu2O3 nanoparticles as a fluorescent imaging agent: In vitro and in vivo studies. Colloids Surfaces A Physicochem. Eng. Asp. 2012, 394, 85–91. [Google Scholar] [CrossRef]
  53. Pearson, R.G. Hard and Soft Acids and Bases. J. Am. Chem. Soc. 1963, 85, 3533–3539. [Google Scholar] [CrossRef]
  54. Pearson, R.G. Hard and soft acids and bases, HSAB, part 1: Fundamental principles. J. Chem. Educ. 1968, 45. [Google Scholar] [CrossRef]
  55. Pearson, R.G. Hard and soft acids and bases, HSAB, part II: Underlying theories. J. Chem. Educ. 1968, 45, 643–648. [Google Scholar] [CrossRef]
  56. Psarra, E.; König, U.; Müller, M.; Bittrich, E.; Eichhorn, K.-J.; Welzel, P.B.; Stamm, M.; Uhlmann, P. In Situ Monitoring of Linear RGD-Peptide Bioconjugation with Nanoscale Polymer Brushes. ACS Omega 2017, 2, 946–958. [Google Scholar] [CrossRef]
  57. Yue, H.; Marasini, S.; Ahmad, M.Y.; Ho, S.L.; Cha, H.; Liu, S.; Jang, Y.J.; Tegafaw, T.; Ghazanfari, A.; Miao, X.; et al. Carbon-coated ultrasmall gadolinium oxide (Gd2O3@C) nanoparticles: Application to magnetic resonance imaging and fluorescence properties. Colloids Surfaces A Physicochem. Eng. Asp. 2019, 586, 124261. [Google Scholar] [CrossRef]
  58. Corbierre, M.K.; Cameron, N.S.; Lennox, R.B. Polymer-Stabilized Gold Nanoparticles with High Grafting Densities. Langmuir 2004, 20, 2867–2873. [Google Scholar] [CrossRef]
  59. Roch, A.; Gillis, P.; Muller, R.N. Theory of proton relaxation induced by superparamagnetic particles. J. Chem. Phys. 1999, 110, 5403–5411. [Google Scholar] [CrossRef]
  60. Roch, A.; Gossuin, Y.; Muller, R.N.; Gillis, P. Superparamagnetic colloid suspensions: Water magnetic relaxation and clustering. J. Magn. Magn. Mater. 2005, 293, 532–539. [Google Scholar] [CrossRef]
  61. Koehler, W.C.; Wollan, E.O.; Wilkinson, M.K. Paramagnetic and Nuclear Scattering Cross Sections of Holmium Sesquioxide. Phys. Rev. 1958, 110, 37–40. [Google Scholar] [CrossRef]
  62. Wolf, W.P.; Meissner, H.; Catanese, C.A. Magnetic Properties of Rare Earth Hydroxides. J. Appl. Phys. 1968, 39, 1134–1136. [Google Scholar] [CrossRef]
  63. Lal, H.B.; Pratap, V.; Kumar, A. Magnetic susceptibility of heavy rare-earth sesquioxides. Pramana 1978, 10, 409–412. [Google Scholar] [CrossRef]
  64. Greenwood, N.N.; Earnshaw, A. Chemistry of the Elements, 2nd ed.; Butterworth-Heinemann: New York, NY, USA, 1997; p. 1243. [Google Scholar]
  65. Marasini, S.; Yue, H.; Ghazanfari, A.; Ho, S.L.; Park, J.A.; Kim, S.; Cha, H.; Liu, S.; Tegafaw, T.; Ahmad, M.Y.; et al. Polyaspartic Acid-Coated Paramagnetic Gadolinium Oxide Nanoparticles as a Dual-Modal T1 and T2 Magnetic Resonance Imaging Contrast Agent. Appl. Sci. 2021, 11, 8222. [Google Scholar] [CrossRef]
  66. Marasini, S.; Yue, H.; Ho, S.L.; Jung, K.-H.; Park, J.A.; Cha, H.; Ghazanfari, A.; Ahmad, M.Y.; Liu, S.; Jang, Y.J.; et al. D-glucuronic acid-coated ultrasmall paramagnetic Ln2O3 (Ln = Tb, Dy, and Ho) nanoparticles: Magnetic properties, water proton relaxivities, and fluorescence properties. Eur. J. Inorg. Chem. 2019, 34, 3832–3839. [Google Scholar] [CrossRef]
  67. Zhao, Z.; Zhou, Z.; Bao, J.; Wang, Z.; Hu, J.; Chi, X.; Ni, K.; Wang, R.; Chen, X.; Chen, Z.; et al. Octapod iron oxide nanoparticles as high-performance T2 contrast agents for magnetic resonance imaging. Nat. Commun. 2013, 4, 2266. [Google Scholar] [CrossRef] [PubMed]
  68. Wei, R.; Zhou, T.; Sun, C.; Lin, H.; Yang, L.; Ren, B.W.; Chen, Z.; Gao, J. Iron-oxide-based twin nanoplates with strong T2 relaxation shortening for contrast-enhanced magnetic resonance imaging. Nanoscale 2018, 10, 18398–18406. [Google Scholar] [CrossRef]
  69. DeBin, J.; Strichartz, G. Chloride channel inhibition by the venom of the scorpion Leiurus quinquestriatus. Toxicon 1991, 29, 1403–1408. [Google Scholar] [CrossRef]
  70. Deshane, J.; Garner, C.; Sontheimer, H. Chlorotoxin Inhibits Glioma Cell Invasion via Matrix Metalloproteinase-2. J. Biol. Chem. 2003, 278, 4135–4144. [Google Scholar] [CrossRef] [Green Version]
  71. Debaisieux, S.; Rayne, F.; Yezid, H.; Beaumelle, B. The Ins and Outs of HIV-1 Tat. Traffic 2011, 13, 355–363. [Google Scholar] [CrossRef]
  72. Pan, L.; He, Q.; Liu, J.; Chen, Y.; Ma, M.; Zhang, L.; Shi, J. Nuclear-Targeted Drug Delivery of TAT Peptide-Conjugated Monodisperse Mesoporous Silica Nanoparticles. J. Am. Chem. Soc. 2012, 134, 5722–5725. [Google Scholar] [CrossRef] [PubMed]
  73. Peng, L.-H.; Niu, J.; Zhang, C.-Z.; Yu, W.; Wu, J.-H.; Shan, Y.-H.; Wang, X.-R.; Shen, Y.; Mao, Z.-W.; Liang, W.-Q.; et al. TAT conjugated cationic noble metal nanoparticles for gene delivery to epidermal stem cells. Biomaterials 2014, 35, 5605–5618. [Google Scholar] [CrossRef]
  74. Santra, S.; Yang, H.; Dutta, D.; Stanley, J.T.; Holloway, P.H.; Tan, W.; Moudgil, B.M.; Mericle, R.A. TAT conjugated, FITC doped silica nanoparticles for bioimaging applications. Chem. Commun. 2004, 2810–2811. [Google Scholar] [CrossRef]
  75. Shi, Y.; Van Der Meel, R.; Chen, X.; Lammers, T. The EPR effect and beyond: Strategies to improve tumor targeting and cancer nanomedicine treatment efficacy. Theranostics 2020, 10, 7921–7924. [Google Scholar] [CrossRef]
  76. Le Duc, G.; Miladi, I.; Alric, C.; Mowat, P.; Brӓuer-Krisch, E.; Bouchet, A.; Khalil, E.; Billotey, C.; Janier, M.; Lux, F.; et al. Toward an Image-Guided Microbeam Radiation Therapy Using Gadolinium-Based Nanoparticles. ACS Nano 2011, 5, 9566–9574. [Google Scholar] [CrossRef] [PubMed]
  77. Laissue, J.A.; Geiser, G.; Spanne, P.O.; Dilmanian, F.A.; Gebbers, J.-O.; Geiser, M.; Wu, X.-Y.; Makar, M.S.; Micca, P.L.; Nawrocky, M.M.; et al. Neuropathology of ablation of rat gliosarcomas and contiguous brain tissues using a microplanar beam of synchrotron-wiggler-generated X rays. Int. J. Cancer 1998, 78, 654–660. [Google Scholar] [CrossRef]
  78. Dilmanian, F.A.; Button, T.M.; Le Duc, G.; Zhong, N.; Pena, L.A.; Smith, J.A.L.; Martinez, S.R.; Bacarian, T.; Tammam, J.; Ren, B.; et al. Response of rat intracranial 9L gliosarcoma to microbeam radiation therapy. Neuro-Oncology 2002, 4, 26–38. [Google Scholar] [CrossRef] [PubMed]
  79. Kattel, K.; Park, J.Y.; Xu, W.; Kim, H.G.; Lee, E.J.; Alam Bony, B.; Heo, W.C.; Jin, S.; Baeck, J.S.; Chang, Y.; et al. Paramagnetic dysprosium oxide nanoparticles and dysprosium hydroxide nanorods as T2 MRI contrast agents. Biomaterials 2012, 33, 3254–3261. [Google Scholar] [CrossRef]
  80. Yue, H.; Park, J.; Ho, S.; Ahmad, M.; Cha, H.; Liu, S.; Tegafaw, T.; Marasini, S.; Ghazanfari, A.; Kim, S.; et al. New Class of Efficient T2 Magnetic Resonance Imaging Contrast Agent: Carbon-Coated Paramagnetic Dysprosium Oxide Nanoparticles. Pharmaceuticals 2020, 13, 312. [Google Scholar] [CrossRef]
  81. Ahmad, M.W.; Xu, W.; Kim, S.J.; Baeck, J.S.; Chang, Y.; Bae, J.E.; Chae, K.S.; Park, J.A.; Kim, T.J.; Lee, G.H. Potential dual imaging nanoparticle: Gd2O3 nanoparticle. Sci. Rep. 2015, 5, 8549. [Google Scholar] [CrossRef] [Green Version]
  82. Cheung, E.N.M.; Alvares, R.D.A.; Oakden, W.; Chaudhary, R.; Hill, M.L.; Pichaandi, J.; Mo, G.C.H.; Yip, C.; Macdonald, P.M.; Stanisz, G.J.; et al. Polymer-Stabilized Lanthanide Fluoride Nanoparticle Aggregates as Contrast Agents for Magnetic Resonance Imaging and Computed Tomography. Chem. Mater. 2010, 22, 4728–4739. [Google Scholar] [CrossRef]
  83. Ho, S.L.; Cha, H.; Oh, I.T.; Jung, K.-H.; Kim, M.H.; Lee, Y.J.; Miao, X.; Tegafaw, T.; Ahmad, M.Y.; Chae, K.S.; et al. Magnetic resonance imaging, gadolinium neutron capture therapy, and tumor cell detection using ultrasmall Gd2O3 nanoparticles coated with polyacrylic acid-rhodamine B as a multifunctional tumor theragnostic agent. RSC Adv. 2018, 8, 12653–12665. [Google Scholar] [CrossRef] [Green Version]
  84. Hirano, S.; Suzuki, K.T. Exposure, metabolism, and toxicity of rare earths and related compounds. Environ. Health Perspect. 1996, 104, 85–95. [Google Scholar]
  85. Nel, A.E.; Mädler, L.; Velegol, D.; Xia, T.; Hoek, E.M.V.; Somasundaran, P.; Klaessig, F.; Castranova, V.; Thompson, M. Understanding biophysicochemical interactions at the nano–bio interface. Nat. Mater. 2009, 8, 543–557. [Google Scholar] [CrossRef]
  86. Jiang, W.; Kim, B.Y.; Rutka, J.T.; Chan, W.C.W. Nanoparticle-mediated cellular response is size-dependent. Nat. Nanotechnol. 2008, 3, 145–150. [Google Scholar] [CrossRef]
  87. Lim, S.F.; Riehn, R.; Ryu, W.S.; Khanarian, N.; Tung, C.-K.; Tank, D.; Austin, R.H. In Vivo and Scanning Electron Microscopy Imaging of Upconverting Nanophosphors in Caenorhabditis elegans. Nano Lett. 2005, 6, 169–174. [Google Scholar] [CrossRef]
  88. Chen, J.; Guo, C.; Wang, M.; Huang, L.; Wang, L.; Mi, C.; Li, J.; Fang, X.; Mao, C.; Xu, S. Controllable synthesis of NaYF4: Yb, Er upconversion nanophosphors and their application to in vivo imaging of Caenorhabditis elegans. J. Mater. Chem. 2011, 21, 2632–2638. [Google Scholar] [CrossRef]
  89. Gu, Z.; Yan, L.; Tian, G.; Li, S.; Chai, Z.; Zhao, Y. Recent Advances in Design and Fabrication of Upconversion Nanoparticles and Their Safe Theranostic Applications. Adv. Mater. 2013, 25, 3758–3779. [Google Scholar] [CrossRef]
  90. Fadeel, B.; Garcia-Bennett, A.E. Better safe than sorry: Understanding the toxicological properties of inorganic nanoparticles manufactured for biomedical applications. Adv. Drug Deliv. Rev. 2010, 62, 362–374. [Google Scholar] [CrossRef] [PubMed]
  91. Rogosnitzky, M.; Branch, S.M. Gadolinium-based contrast agent toxicity: A review of known and proposed mechanisms. BioMetals 2016, 29, 365–376. [Google Scholar] [CrossRef] [Green Version]
  92. Gnach, A.; Lipinski, T.; Bednarkiewicz, A.; Rybka, J.; Capobianco, J.A. Upconverting nanoparticles: Assessing the toxicity. Chem. Soc. Rev. 2014, 44, 1561–1584. [Google Scholar] [CrossRef]
  93. Harper, S.; Usenko, C.; Hutchison, J.E.; Maddux, B.L.S.; Tanguay, R.L. Biodistribution and toxicity depends on nanomaterial composition, size, surface functionalisation and route of exposure. J. Exp. Nanosci. 2008, 3, 195–206. [Google Scholar] [CrossRef]
  94. Tweedle, M.F. Gadolinium deposition: Is it chelated or dissociated gadolinium? How can we tell? Magn. Reson. Imaging 2016, 34, 1377–1382. [Google Scholar] [CrossRef] [PubMed]
  95. Frenzel, T.; Apte, C.; Jost, G.; Schöckel, L.; Lohrke, J.; Pietsch, H. Quantification and assessment of the chemical form of residual gadolinium in the brain after repeated administration of gadolinium-based contrast agents: Comparative study in rats. Investig. Radiol. 2017, 52, 396–404. [Google Scholar] [CrossRef] [Green Version]
  96. Kanal, E. Gadolinium based contrast agents (GBCA): Safety overview after 3 decades of clinical experience. Magn. Reson. Imaging 2016, 34, 1341–1345. [Google Scholar] [CrossRef]
  97. Jin, Y.; Chen, S.; Duan, J.; Jia, G.; Zhang, J. Europium-doped Gd2O3 nanotubes cause the necrosis of primary mouse bone marrow stromal cells through lysosome and mitochondrion damage. J. Inorg. Biochem. 2015, 146, 28–36. [Google Scholar] [CrossRef]
  98. Yang, Y.; Sun, Y.; Liu, Y.; Peng, J.; Wu, Y.; Zhang, Y.; Feng, W.; Li, F. Long-term in vivo biodistribution and toxicity of Gd(OH)3 nanorods. Biomaterials 2013, 34, 508–515. [Google Scholar] [CrossRef]
  99. Grobner, T.; Prischl, F. Gadolinium and nephrogenic systemic fibrosis. Kidney Int. 2007, 72, 260–264. [Google Scholar] [CrossRef] [PubMed] [Green Version]
  100. Penfield, J.G.; Reilly, R.F. What nephrologists need to know about gadolinium. Nat. Clin. Pr. Nephrol. 2007, 3, 654–668. [Google Scholar] [CrossRef] [PubMed]
  101. Boyd, A.S.; Zic, J.A.; Abraham, J.L. Gadolinium deposition in nephrogenic fibrosing dermopathy. J. Am. Acad. Dermatol. 2007, 56, 27–30. [Google Scholar] [CrossRef]
  102. High, W.A.; Ayers, R.A.; Chandler, J.; Zito, G.; Cowper, S.E. Gadolinium is detectable within the tissue of patients with nephrogenic systemic fibrosis. J. Am. Acad. Dermatol. 2007, 56, 21–26. [Google Scholar] [CrossRef]
  103. Ding, L.; Stilwell, J.; Zhang, T.; Elboudwarej, O.; Jiang, H.; Selegue, J.P.; Cooke, P.A.; Gray, J.W.; Chen, F.F. Molecular Characterization of the Cytotoxic Mechanism of Multiwall Carbon Nanotubes and Nano-Onions on Human Skin Fibroblast. Nano Lett. 2005, 5, 2448–2464. [Google Scholar] [CrossRef] [PubMed] [Green Version]
Figure 1. Reaction scheme for the one-pot polyol synthesis of hydrophilic and biocompatible polymer-coated ultrasmall Ln2O3 nanoparticles. TEG = triethylene glycol.
Pharmaceutics 13 01890 g001
Figure 2. Two-step synthesis of RGD-PAA-Gd2O3 nanoparticles. (a) Step 1: PAA-Gd2O3 nanoparticles and (b) step 2: conjugation of RGD with PAA-Gd2O3 nanoparticles. EDC = N-(3-dimethylaminopropyl)-N′-ethylcarbodiimide, NHS = N-hydroxysuccinimide, and UGNP = ultrasmall gadolinium oxide nanoparticle. Adapted with permission from [44], The Royal Society of Chemistry, 2020.
Pharmaceutics 13 01890 g002
Figure 3. Schematic illustration for the synthesis of CTX-PEG-TETT-Gd2O3 nanoparticles. TETT = N-(trimethoxysilylpropyl) ethylenediamine triacetic acid trisodium salt and OA = oleic acid. Reproduced from [45], The Royal Society of Chemistry, 2014.
Pharmaceutics 13 01890 g003
Figure 4. (ac) HRTEM images [44,47,48]. Arrows and circles indicate nanoparticles. Insets in (c) show a magnified image of a nanoparticle (top right) and laser light scattering (i.e., Tyndall effect) due to the collision of the nanoparticle colloids with a passing laser light, whereas triple-distilled water shows no light scattering, confirming the good colloidal dispersion of nanoparticles in aqueous media (bottom left). Reproduced from [44,47,48]. Copyright 2020 The Royal Society of Chemistry [44]; Copyrights 2018 Wiley [47,48].
Pharmaceutics 13 01890 g004
Figure 5. XRD patterns of (a) cRGD-Gd2O3 nanoparticles [47] and (b) RGD-PAA-Gd2O3 nanoparticles [44] before (i.e., as-prepared; bottom figures) and after TGA (top figures). Adapted from [44,47]. Copyright 2020 The Royal Society of Chemistry [44]; Copyright 2018 Wiley [47].
Pharmaceutics 13 01890 g005
Figure 6. (a) FT-IR absorption spectra of PAA-coated Gd2O3 nanoparticles and free PAA sodium salt (Mw = 5100 Da) and (b) surface-coating structure of PAA on the Gd2O3 nanoparticle surface [39]. (c) FT-IR absorption spectra of PAA (Mw = 1800 Da), PAA-Gd2O3 nanoparticles, RGD, and RGD-PAA-Gd2O3 nanoparticles [44]. The lowercase letters “s”, “ss”, “as”, and “b” indicate stretch, symmetric stretch, antisymmetric stretch, and bend, respectively. Adapted from [39,44]. Copyrights 2018 and 2020 The Royal Society of Chemistry, respectively.
Pharmaceutics 13 01890 g006
Figure 7. TGA curve of the powder sample of C@Gd2O3 nanoparticles. Adapted from [57]. Copyright 2019 Elsevier.
Pharmaceutics 13 01890 g007
Figure 8. (a) M–H curve of Gd2O3 nanoparticles at T = 300 K [41]. (b) M–H curves of Ln2O3 nanoparticles, Ln = (i) Tb and (ii) Ho at T = 300 K [43]. Net M values of Ln2O3 nanoparticles without ligands were used in the plots. Adapted from [41,43]. Copyrights 2020 and 2021 MDPI.
Pharmaceutics 13 01890 g008
Figure 9. r1 and r2 values of PAAMA-coated Gd2O3 nanoparticles [40]. Adapted from [40]. Copyright 2021 MDPI.
Pharmaceutics 13 01890 g009
Figure 10. T1 MR images of mice brains with C6 glioma before and after (15 min, 60 min, and 24 h) intravenous injection of PEG-TETT-Gd2O3 and CTX-PEG-TETT-Gd2O3 nanoparticle samples into mice tails at 7.0 T. Tumor sites are indicated with arrows. Adapted from [45]. Copyright 2014 The Royal Society of Chemistry.
Pharmaceutics 13 01890 g010
Figure 11. Optical microscope images of U87MG tumor cells incubated (a) without and (b) with cRGD-Gd2O3 nanoparticles. HRTEM images of U87MG tumor cells incubated (c) without and (d) with cRGD-Gd2O3 nanoparticles. (e) EDX spectrum of the circled region in (d). Adapted from [47]. Copyright 2018 Wiley.
Pharmaceutics 13 01890 g011
Figure 12. (a) T1 MR images of a U87MG tumor-bearing nude mouse in the liver before and after intravenous injection (arrows indicate the tumor region). (b) Color map of the middle T1 MR image in (a), showing the widely spread liver tumor (brighter region). (c) Plots of the SNRs of the ROIs in the normal, tumor, and necrosis parts of the liver versus time. (d) Plots of the percentage SNRs in the normal, tumor, and necrosis parts of the liver versus time; percentage SNR = {[SNR (time)-SNR (Pre)]/SNR (Pre)} × 100. Adapted from [47]. Copyright 2018 Wiley.
Pharmaceutics 13 01890 g012
Figure 13. T1 MR images before and 20 min after (labeled “post 20 min”) intravenous injection into the mouse tail: the bright contrast at the tumor (labeled with arrows) was due to the accumulation of nanoparticles at the tumor site. Adapted from [44]. Copyright 2020 The Royal Society of Chemistry.
Pharmaceutics 13 01890 g013
Figure 14. T1-weighted images of the brain of a rat having intracerebral 9L gliosarcoma (9LGS) before and after (5, 20, and 45 min) intravenous injection of gadolinium-based nanoparticles. Adapted from [76]. Copyright 2011 American Chemical Society.
Pharmaceutics 13 01890 g014
Figure 15. (a) A series of 3.0 T in vivo T2 MR images: coronal views of kidneys and liver (labeled as “K” and “L”, respectively) before and after intravenous injection of an aqueous solution of D-glucuronic acid-coated Dy2O3 nanoparticles into the mouse tail [79]. (b) In vivo coronal 3.0 T T2 MR images of the mice kidneys (indicated with arrows) as a function of time before and after intravenous injection of an aqueous solution of carbon-coated Dy2O3 nanoparticles into the mouse tail [80]. Adapted from [79,80]. Copyrights 2012 Elsevier and 2020 MDPI.
Pharmaceutics 13 01890 g015
Figure 16. (a) In vivo CT images of a mouse bladder (labeled B) and (b) plot of the X-ray absorption of the ROI in the bladder (indicated by the small, dotted circle in (a)) before and after intravenous injection of an aqueous sample into the mouse tail [81]. Adapted from [81]. Copyright 2015 Springer Nature.
Pharmaceutics 13 01890 g016
Figure 17. In vitro cytotoxicities of (a) uncoated Gd2O3 nanoparticles in NCTC1469 and U87MG cell lines and (b) PAA-coated Gd2O3 nanoparticles in DU145, NCTC1469, and U87MG cell lines [83]. PAA-coated Ln2O3 nanoparticles (Ln = (c) Dy, (d) Tb, and (e) Ho) in DU145 and NCTC1469 cell lines [42,43]. Adapted from [42,43,83]. Copyrights 2018, 2020 and 2021 The Royal Society of Chemistry, Wiley & MDPI.
Pharmaceutics 13 01890 g017
Figure 18. Clinical pictures of the legs of two patients with NSF for (a) about three years and (b) four weeks. Adapted from [99]. Copyright 2007 International Society of Nephrology.
Pharmaceutics 13 01890 g018
Table 1. Summary of physicochemical characterization.
PropertiesTechnique 1PropertiesTechnique 1
Particle diameterHRTEMHydrodynamic diameterDLS
Crystal structureXRDLigand surface coatingFT-IR absorption, EA
Ligand surface-coating amountTGA, EAMetal concentration in waterICPAES
Cellular cytotoxicityMTT, WSTMagnetizationVSM
Relaxivity (r1 and r2)MRIMR imageMRI
X-ray attenuation powerCTCT imageCT
1 HRTEM = high-resolution transmission electron microscope; DLS = dynamic light scattering; XRD = X-ray diffraction; FT-IR = Fourier transform-infrared; EA = elemental analysis; TGA = thermogravimetric analysis; ICPAES = inductively coupled plasma atomic emission spectrometry; MTT = methylthiazoly tetrazolium; WST = water-soluble tetrazolium salt; VSM = vibrating sample magnetometer; MRI = magnetic resonance imaging; CT = computed tomography.
Publisher’s Note: MDPI stays neutral with regard to jurisdictional claims in published maps and institutional affiliations.

