
[18F]2-Fluoro-2-deoxy-sorbitol PET Imaging for Quantitative Monitoring of Enhanced Blood-Brain Barrier Permeability Induced by Focused Ultrasound

 , , , and
Abstract
:
1. Introduction
2. Materials and Methods
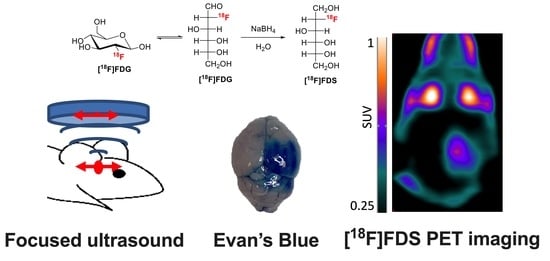
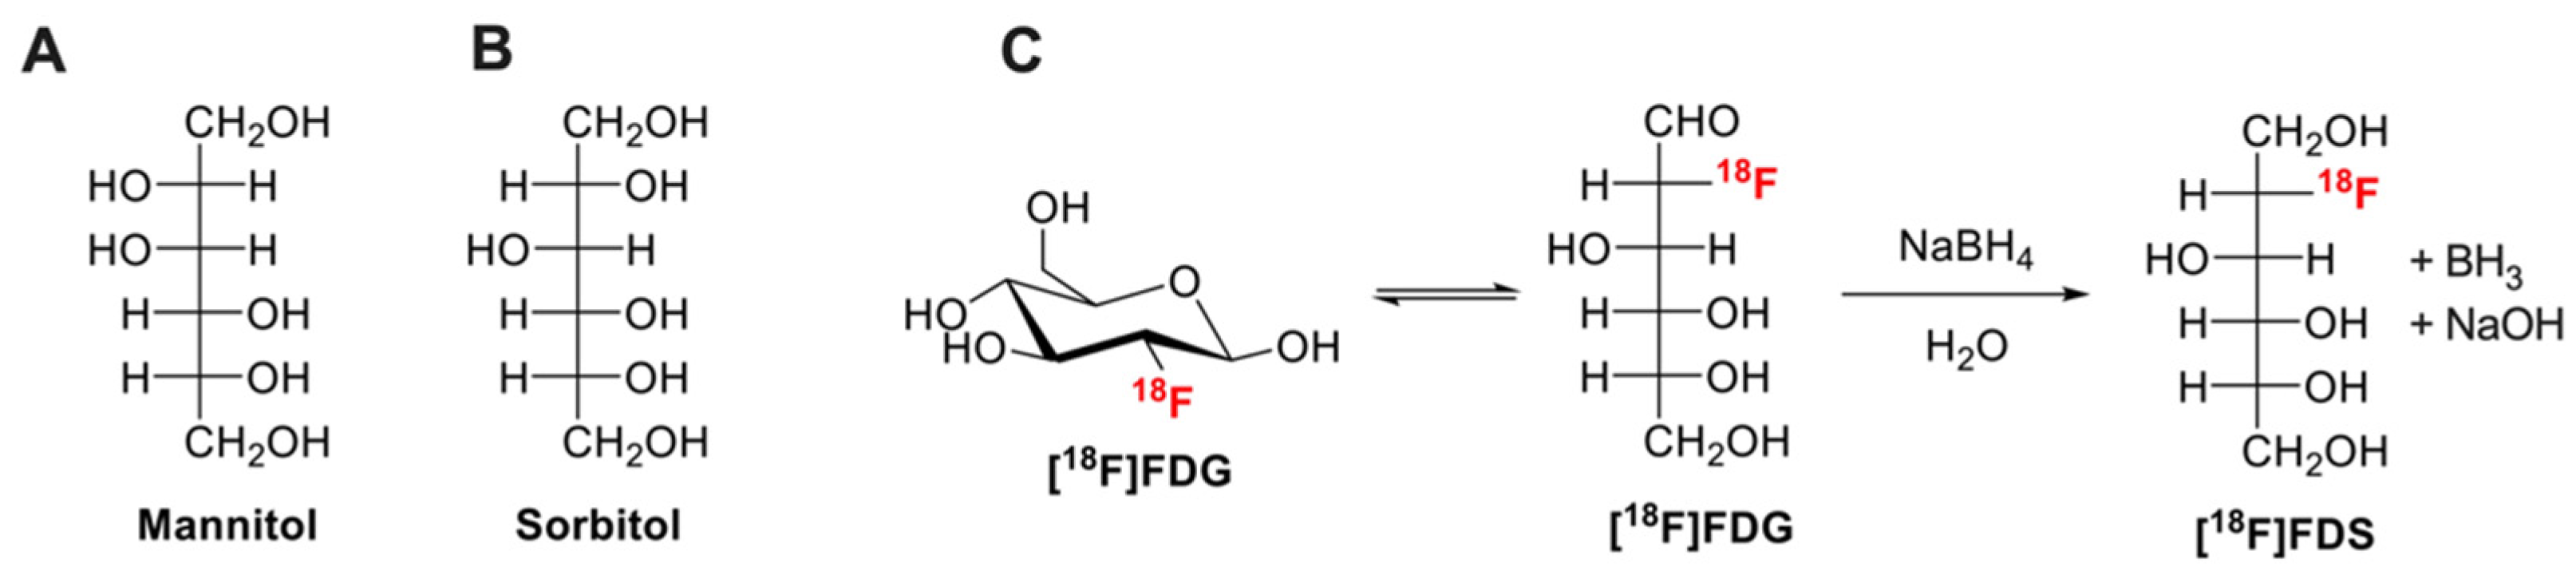
2.1. Production of [18F]FDS
2.2. Focused Ultrasound
2.3. Evan’s Blue Extravasation Test
2.4. [18F]FDS PET Imaging
2.5. Statistics
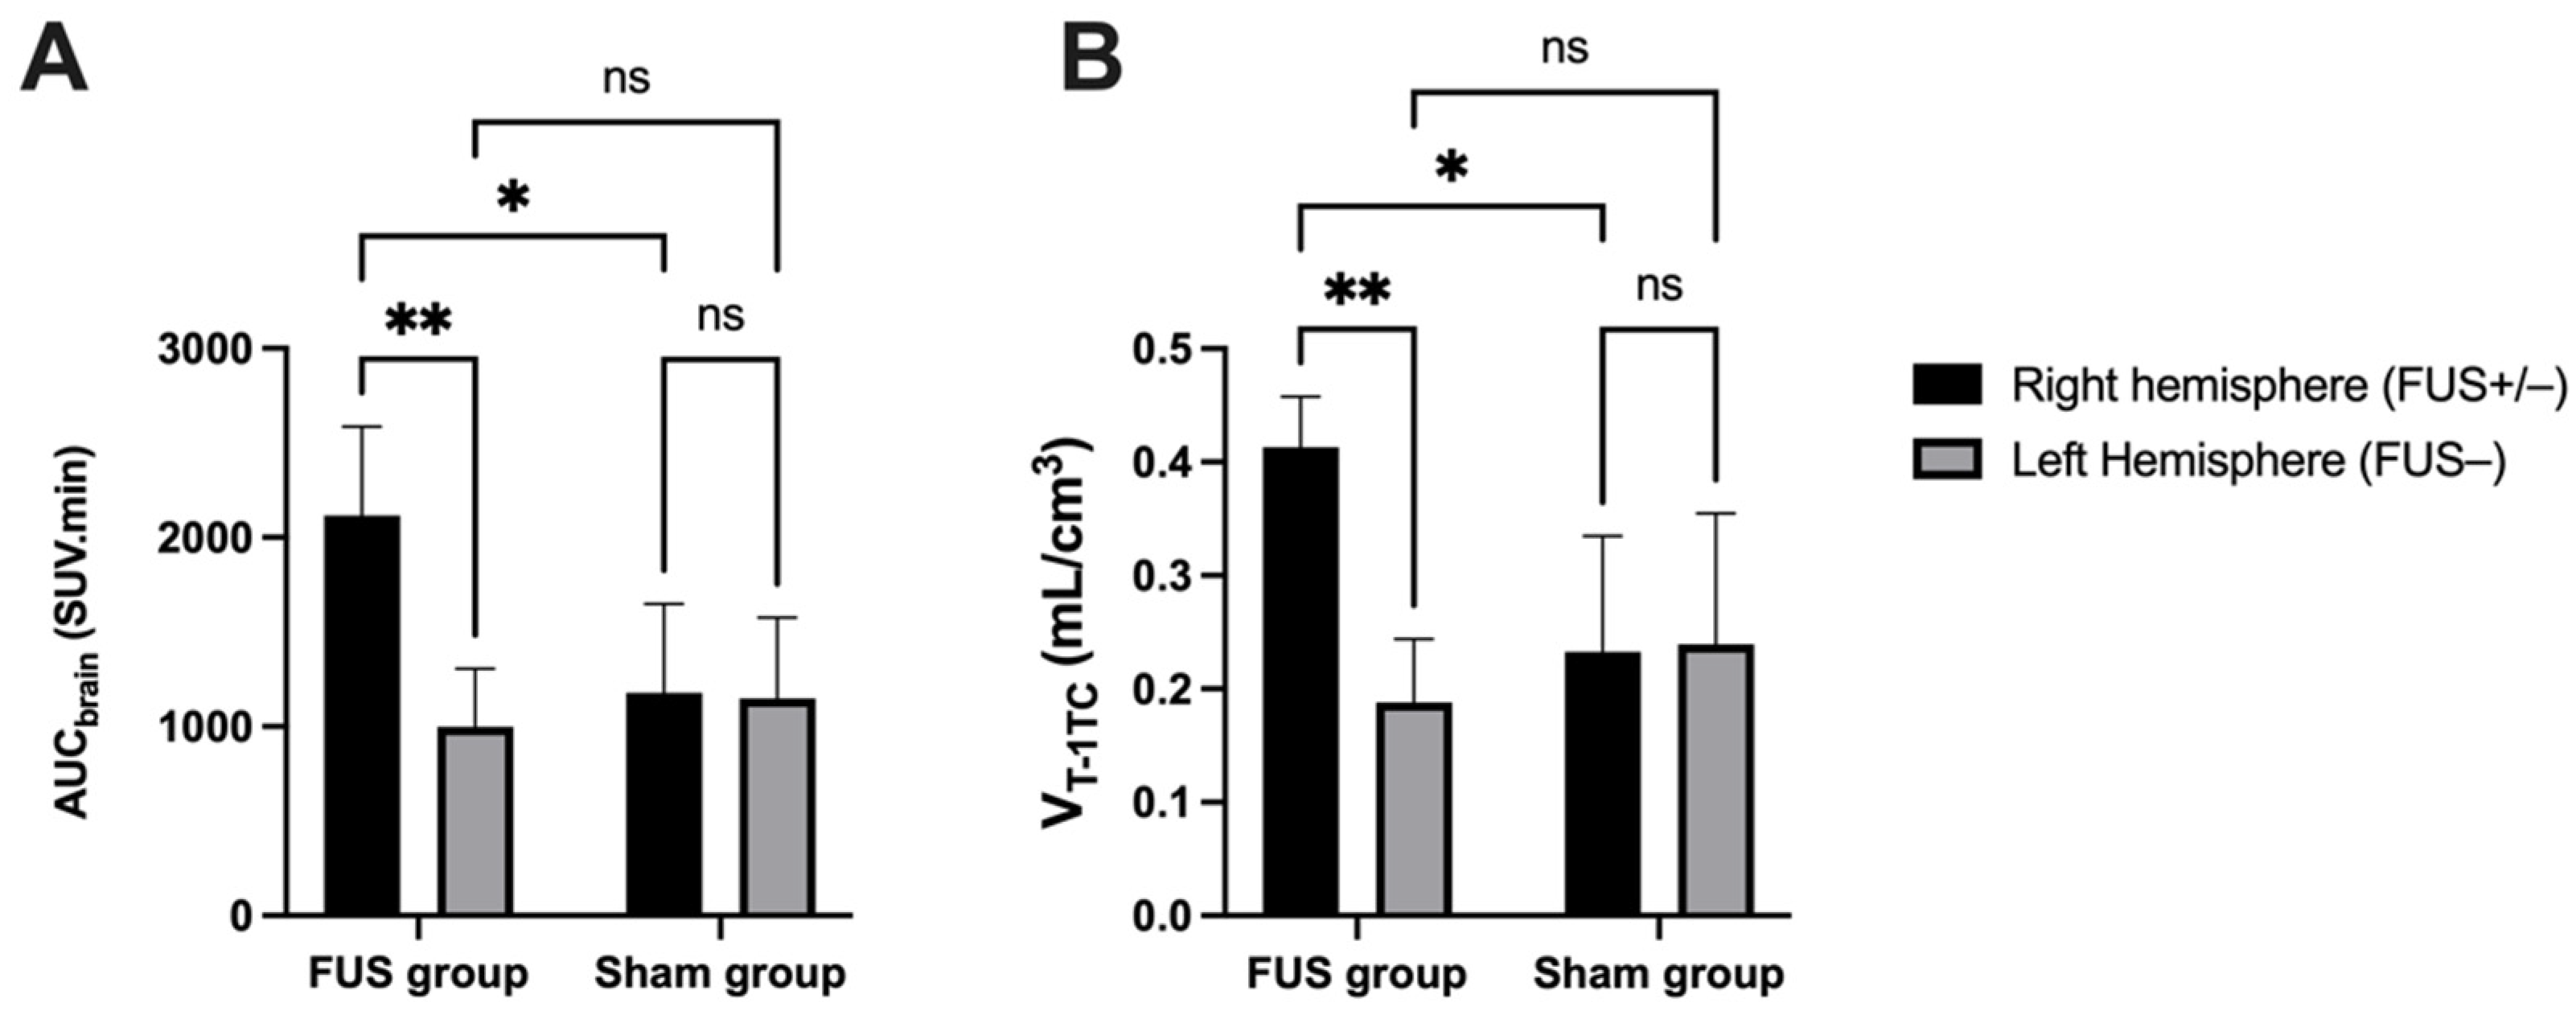
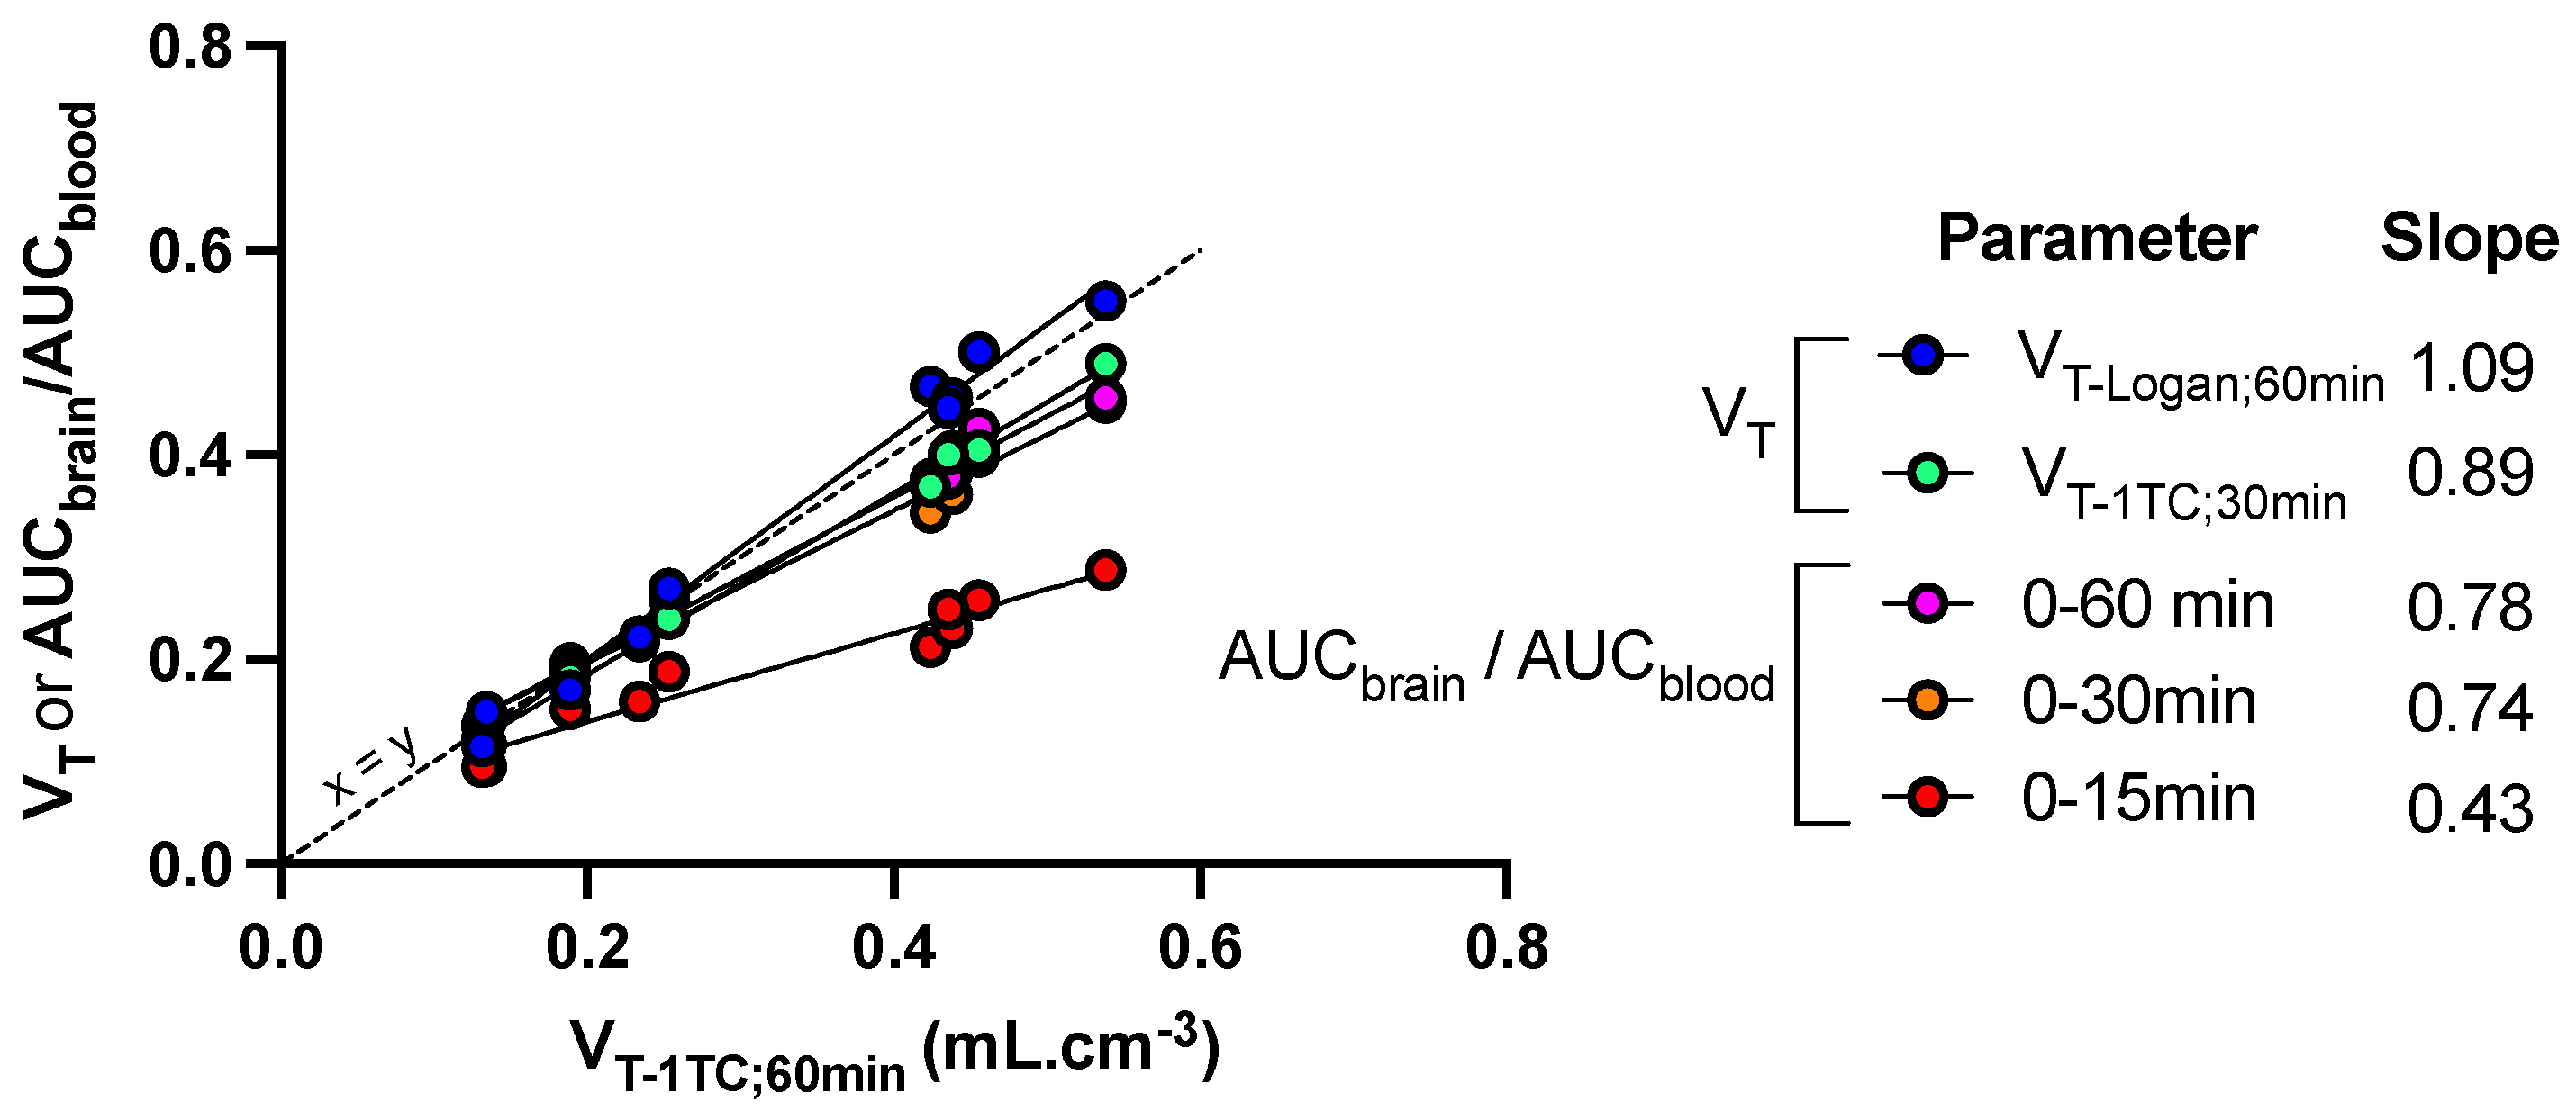
3. Results
4. Discussion
5. Conclusions
Author Contributions
Funding
Institutional Review Board Statement
Informed Consent Statement
Data Availability Statement
Acknowledgments
Conflicts of Interest
Appendix A

| FUS Group (FUS+) | Sham Group (FUS−) | |||||||
|---|---|---|---|---|---|---|---|---|
| Time (min) | Mouse 1 | Mouse 2 | Mouse 3 | Mouse 4 | Mouse 5 | Mouse 1 | Mouse 2 | Mouse 3 |
| 0.25 | 0.016 | 0.024 | 0.032 | 0.026 | 0.017 | 0.033 | 0.033 | 0.010 |
| 0.75 | 0.195 | 0.216 | 0.312 | 0.222 | 0.178 | 0.232 | 0.278 | 0.135 |
| 1.25 | 0.433 | 0.382 | 0.614 | 0.378 | 0.330 | 0.403 | 0.542 | 0.295 |
| 2 | 0.566 | 0.581 | 0.603 | 0.396 | 0.527 | 0.325 | 0.580 | 0.437 |
| 3 | 0.633 | 0.530 | 0.664 | 0.420 | 0.534 | 0.324 | 0.624 | 0.441 |
| 4 | 0.565 | 0.550 | 0.642 | 0.452 | 0.580 | 0.396 | 0.596 | 0.421 |
| 5 | 0.605 | 0.579 | 0.698 | 0.479 | 0.657 | 0.338 | 0.543 | 0.430 |
| 6 | 0.591 | 0.587 | 0.711 | 0.478 | 0.635 | 0.370 | 0.610 | 0.409 |
| 7.5 | 0.589 | 0.636 | 0.680 | 0.498 | 0.730 | 0.377 | 0.582 | 0.394 |
| 9.5 | 0.585 | 0.624 | 0.650 | 0.506 | 0.733 | 0.320 | 0.578 | 0.372 |
| 11.5 | 0.574 | 0.626 | 0.639 | 0.506 | 0.768 | 0.299 | 0.555 | 0.346 |
| 13.5 | 0.600 | 0.620 | 0.648 | 0.505 | 0.794 | 0.292 | 0.529 | 0.362 |
| 15.5 | 0.582 | 0.645 | 0.612 | 0.508 | 0.807 | 0.262 | 0.538 | 0.327 |
| 18 | 0.569 | 0.613 | 0.621 | 0.512 | 0.804 | 0.246 | 0.521 | 0.333 |
| 21 | 0.561 | 0.592 | 0.600 | 0.520 | 0.840 | 0.220 | 0.525 | 0.295 |
| 24 | 0.555 | 0.607 | 0.564 | 0.531 | 0.813 | 0.254 | 0.502 | 0.310 |
| 27.5 | 0.525 | 0.615 | 0.550 | 0.553 | 0.879 | 0.209 | 0.489 | 0.280 |
| 31.5 | 0.511 | 0.595 | 0.534 | 0.547 | 0.856 | 0.204 | 0.465 | 0.271 |
| 35.5 | 0.495 | 0.561 | 0.516 | 0.560 | 0.907 | 0.167 | 0.471 | 0.270 |
| 40 | 0.497 | 0.559 | 0.494 | 0.568 | 0.940 | 0.176 | 0.457 | 0.262 |
| 45 | 0.470 | 0.555 | 0.489 | 0.579 | 0.932 | 0.185 | 0.416 | 0.246 |
| 50 | 0.462 | 0.559 | 0.457 | 0.592 | 0.953 | 0.165 | 0.433 | 0.244 |
| 55 | 0.448 | 0.538 | 0.461 | 0.604 | 1.029 | 0.163 | 0.405 | 0.224 |
| 58.75 | 0.418 | 0.528 | 0.455 | 0.609 | 0.929 | 0.163 | 0.435 | 0.231 |
| FUS Group (FUS−) | Sham Group (FUS−) | |||||||
|---|---|---|---|---|---|---|---|---|
| Time (min) | Mouse 1 | Mouse 2 | Mouse 3 | Mouse 4 | Mouse 5 | Mouse 1 | Mouse 2 | Mouse 3 |
| 0.25 | 0.019 | 0.039 | 0.031 | 0.032 | 0.009 | 0.019 | 0.032 | 0.007 |
| 0.75 | 0.194 | 0.117 | 0.323 | 0.213 | 0.108 | 0.206 | 0.277 | 0.131 |
| 1.25 | 0.330 | 0.264 | 0.547 | 0.337 | 0.236 | 0.304 | 0.511 | 0.269 |
| 2 | 0.389 | 0.301 | 0.520 | 0.295 | 0.331 | 0.420 | 0.613 | 0.409 |
| 3 | 0.326 | 0.278 | 0.515 | 0.309 | 0.375 | 0.369 | 0.584 | 0.393 |
| 4 | 0.282 | 0.264 | 0.510 | 0.292 | 0.351 | 0.405 | 0.599 | 0.466 |
| 5 | 0.257 | 0.250 | 0.499 | 0.294 | 0.350 | 0.372 | 0.604 | 0.390 |
| 6 | 0.270 | 0.256 | 0.508 | 0.309 | 0.401 | 0.292 | 0.558 | 0.390 |
| 7.5 | 0.242 | 0.233 | 0.489 | 0.287 | 0.420 | 0.346 | 0.536 | 0.403 |
| 9.5 | 0.240 | 0.227 | 0.474 | 0.285 | 0.394 | 0.289 | 0.569 | 0.377 |
| 11.5 | 0.211 | 0.226 | 0.432 | 0.278 | 0.352 | 0.329 | 0.515 | 0.361 |
| 13.5 | 0.218 | 0.213 | 0.405 | 0.276 | 0.419 | 0.230 | 0.521 | 0.341 |
| 15.5 | 0.213 | 0.235 | 0.415 | 0.254 | 0.379 | 0.289 | 0.517 | 0.325 |
| 18 | 0.216 | 0.226 | 0.374 | 0.259 | 0.391 | 0.257 | 0.482 | 0.320 |
| 21 | 0.194 | 0.196 | 0.360 | 0.270 | 0.406 | 0.209 | 0.474 | 0.310 |
| 24 | 0.203 | 0.223 | 0.341 | 0.249 | 0.389 | 0.255 | 0.488 | 0.301 |
| 27.5 | 0.197 | 0.204 | 0.324 | 0.245 | 0.395 | 0.225 | 0.440 | 0.297 |
| 31.5 | 0.201 | 0.198 | 0.328 | 0.267 | 0.406 | 0.198 | 0.451 | 0.273 |
| 35.5 | 0.203 | 0.205 | 0.302 | 0.261 | 0.421 | 0.183 | 0.446 | 0.273 |
| 40 | 0.179 | 0.182 | 0.279 | 0.257 | 0.409 | 0.188 | 0.427 | 0.255 |
| 45 | 0.173 | 0.178 | 0.262 | 0.271 | 0.435 | 0.177 | 0.420 | 0.241 |
| 50 | 0.168 | 0.178 | 0.265 | 0.276 | 0.444 | 0.178 | 0.398 | 0.215 |
| 55 | 0.153 | 0.167 | 0.245 | 0.266 | 0.449 | 0.159 | 0.409 | 0.225 |
| 58.75 | 0.160 | 0.169 | 0.238 | 0.278 | 0.476 | 0.147 | 0.380 | 0.231 |
| FUS Group (FUS+/−) | Sham Group (FUS−) | |||||||
|---|---|---|---|---|---|---|---|---|
| Time (min) | Mouse 1 | Mouse 2 | Mouse 3 | Mouse 4 | Mouse 5 | Mouse 1 | Mouse 2 | Mouse 3 |
| 0.25 | 3.340 | 2.733 | 3.691 | 2.713 | 1.559 | 3.811 | 3.009 | 0.864 |
| 0.75 | 10.454 | 7.641 | 10.710 | 8.422 | 5.261 | 10.480 | 9.161 | 3.796 |
| 1.25 | 11.205 | 9.700 | 8.331 | 5.437 | 7.183 | 11.001 | 10.762 | 5.115 |
| 2 | 4.676 | 5.277 | 3.446 | 1.990 | 3.324 | 3.175 | 3.246 | 3.890 |
| 3 | 2.352 | 2.419 | 2.611 | 1.615 | 2.241 | 2.337 | 2.027 | 2.214 |
| 4 | 2.276 | 2.155 | 2.378 | 1.583 | 2.056 | 2.272 | 1.689 | 1.888 |
| 5 | 2.046 | 1.923 | 2.146 | 1.524 | 1.953 | 2.056 | 1.684 | 1.797 |
| 6 | 2.002 | 1.942 | 1.881 | 1.418 | 1.948 | 2.021 | 1.547 | 1.720 |
| 7.5 | 1.870 | 1.789 | 1.803 | 1.441 | 1.890 | 1.861 | 1.486 | 1.586 |
| 9.5 | 1.691 | 1.579 | 1.581 | 1.382 | 1.821 | 1.771 | 1.355 | 1.539 |
| 11.5 | 1.497 | 1.610 | 1.519 | 1.337 | 1.809 | 1.607 | 1.263 | 1.517 |
| 13.5 | 1.501 | 1.481 | 1.371 | 1.314 | 1.733 | 1.516 | 1.241 | 1.446 |
| 15.5 | 1.426 | 1.491 | 1.359 | 1.320 | 1.731 | 1.466 | 1.194 | 1.454 |
| 18 | 1.309 | 1.446 | 1.206 | 1.283 | 1.736 | 1.383 | 1.276 | 1.540 |
| 21 | 1.238 | 1.409 | 1.154 | 1.290 | 1.730 | 1.304 | 1.303 | 1.512 |
| 24 | 1.118 | 1.348 | 1.045 | 1.260 | 1.740 | 1.219 | 1.154 | 1.539 |
| 27.5 | 1.060 | 1.288 | 0.979 | 1.291 | 1.686 | 1.144 | 1.179 | 1.532 |
| 31.5 | 0.959 | 1.235 | 0.935 | 1.262 | 1.660 | 1.095 | 1.206 | 1.448 |
| 35.5 | 0.924 | 1.175 | 0.869 | 1.274 | 1.684 | 1.022 | 1.154 | 1.446 |
| 40 | 0.835 | 1.100 | 0.814 | 1.249 | 1.669 | 0.941 | 1.114 | 1.378 |
| 45 | 0.785 | 1.021 | 0.737 | 1.255 | 1.666 | 0.863 | 1.062 | 1.269 |
| 50 | 0.705 | 0.961 | 0.703 | 1.251 | 1.669 | 0.829 | 1.092 | 1.072 |
| 55 | 0.650 | 0.896 | 0.657 | 1.223 | 1.650 | 0.760 | 1.039 | 0.985 |
| 58.75 | 0.577 | 0.906 | 0.573 | 1.195 | 1.633 | 0.748 | 1.099 | 0.922 |
References
- Kadry, H.; Noorani, B.; Cucullo, L. A blood-brain barrier overview on structure, function, impairment, and biomarkers of integrity. Fluids Barriers CNS 2020, 17, 69. [Google Scholar] [CrossRef] [PubMed]
- Abbott, N.J.; Patabendige, A.; Dolman, D.E.; Yusof, S.R.; Begley, D.J. Structure and function of the blood-brain barrier. Neurobiol. Dis. 2010, 37, 13–25. [Google Scholar] [CrossRef] [PubMed]
- Al Rihani, S.; Darakjian, L.; Deodhar, M.; Dow, P.; Turgeon, J.; Michaud, V. Disease-Induced Modulation of Drug Transporters at the Blood-Brain Barrier Level. Int. J. Mol. Sci. 2021, 22, 3742. [Google Scholar] [CrossRef]
- Pardridge, W.M. The Blood-Brain Barrier: Bottleneck in Brain Drug Development. NeuroRx 2005, 2, 3–14. [Google Scholar] [CrossRef] [PubMed]
- Terstappen, G.C.; Meyer, A.H.; Bell, R.D.; Zhang, W. Strategies for delivering therapeutics across the blood-brain barrier. Nat. Rev. Drug Discov. 2021, 20, 362–383. [Google Scholar] [CrossRef]
- Chen, K.-T.; Wei, K.-C.; Liu, H.-L. Theranostic Strategy of Focused Ultrasound Induced Blood-Brain Barrier Opening for CNS Disease Treatment. Front. Pharmacol. 2019, 10, 86. [Google Scholar] [CrossRef] [Green Version]
- Liu, H.-L.; Fan, C.-H.; Ting, C.-Y.; Yeh, C.-K. Combining Microbubbles and Ultrasound for Drug Delivery to Brain Tumors: Current Progress and Overview. Theranostics 2014, 4, 432–444. [Google Scholar] [CrossRef] [PubMed]
- Couture, O.; Foley, J.; Kassell, N.F.; Larrat, B.; Aubry, J.-F. Review of Ultrasound Mediated Drug Delivery for Cancer Treatment: Updates from Pre-Clinical Studies. Transl. Cancer Res. 2014, 3, 494–511. [Google Scholar] [CrossRef]
- Hynynen, K.; McDannold, N.; Vykhodtseva, N.; Jolesz, F.A. Noninvasive MR Imaging–guided Focal Opening of the Blood-Brain Barrier in Rabbits. Radiology 2001, 220, 640–646. [Google Scholar] [CrossRef]
- Tran, V.L.; Novell, A.; Tournier, N.; Gerstenmayer, M.; Schweitzer-Chaput, A.; Mateos, C.; Jego, B.; Bouleau, A.; Nozach, H.; Winkeler, A.; et al. Impact of blood-brain barrier permeabilization induced by ultrasound associated to microbubbles on the brain delivery and kinetics of cetuximab: An immunoPET study using 89Zr-cetuximab. J. Control. Release 2020, 328, 304–312. [Google Scholar] [CrossRef]
- Alli, S.; Figueiredo, C.A.; Golbourn, B.; Sabha, N.; Wu, M.Y.; Bondoc, A.; Luck, A.; Coluccia, D.; Maslink, C.; Smith, C.; et al. Brainstem blood brain barrier disruption using focused ultrasound: A demonstration of feasibility and enhanced doxorubicin delivery. J. Control. Release 2018, 281, 29–41. [Google Scholar] [CrossRef] [PubMed]
- Carpentier, A.; Canney, M.; Vignot, A.; Reina, V.; Beccaria, K.; Horodyckid, C.; Karachi, C.; Leclercq, D.; Lafon, C.; Chapelon, J.-Y.; et al. Clinical trial of blood-brain barrier disruption by pulsed ultrasound. Sci. Transl. Med. 2016, 8, 343re2. [Google Scholar] [CrossRef]
- Abrahao, A.; Meng, Y.; Llinas, M.; Huang, Y.; Hamani, C.; Mainprize, T.; Aubert, I.; Heyn, C.; Black, S.E.; Hynynen, K.; et al. First-in-human trial of blood-brain barrier opening in amyotrophic lateral sclerosis using MR-guided focused ultrasound. Nat. Commun. 2019, 10, 4373. [Google Scholar] [CrossRef] [PubMed] [Green Version]
- Lipsman, N.; Meng, Y.; Bethune, A.J.; Huang, Y.; Lam, B.; Masellis, M.; Herrmann, N.; Heyn, C.; Aubert, I.; Boutet, A.; et al. Blood-brain barrier opening in Alzheimer’s disease using MR-guided focused ultrasound. Nat. Commun. 2018, 9, 2336. [Google Scholar] [CrossRef] [PubMed] [Green Version]
- Mainprize, T.; Lipsman, N.; Huang, Y.; Meng, Y.; Bethune, A.; Ironside, S.; Heyn, C.; Alkins, R.; Trudeau, M.; Sahgal, A.; et al. Blood-Brain Barrier Opening in Primary Brain Tumors with Non-invasive MR-Guided Focused Ultrasound: A Clinical Safety and Feasibility Study. Sci. Rep. 2019, 9, 321. [Google Scholar] [CrossRef] [PubMed] [Green Version]
- Idbaih, A.; Canney, M.; Belin, L.; Desseaux, C.; Vignot, A.; Bouchoux, G.; Asquier, N.; Law-Ye, B.; Leclercq, D.; Bissery, A.; et al. Safety and Feasibility of Repeated and Transient Blood-Brain Barrier Disruption by Pulsed Ultrasound in Patients with Recurrent Glioblastoma. Clin. Cancer Res. 2019, 25, 3793–3801. [Google Scholar] [CrossRef] [Green Version]
- Chen, K.-T.; Lin, Y.-J.; Chai, W.-Y.; Lin, C.-J.; Chen, P.-Y.; Huang, C.-Y.; Kuo, J.S.; Liu, H.-L.; Wei, K.-C. Neuronavigation-guided focused ultrasound (NaviFUS) for transcranial blood-brain barrier opening in recurrent glioblastoma patients: Clinical trial protocol. Ann. Transl. Med. 2020, 8, 673. [Google Scholar] [CrossRef]
- Arif, W.M.; Elsinga, P.H.; Gasca-Salas, C.; Versluis, M.; Martínez-Fernández, R.; Dierckx, R.A.; Borra, R.J.; Luurtsema, G. Focused ultrasound for opening blood-brain barrier and drug delivery monitored with positron emission tomography. J. Control. Release 2020, 324, 303–316. [Google Scholar] [CrossRef]
- Sun, H.; Hu, H.; Liu, C.; Sun, N.; Duan, C. Methods used for the measurement of blood-brain barrier integrity. Metab. Brain Dis. 2021, 36, 723–735. [Google Scholar] [CrossRef]
- Noorani, B.; Chowdhury, E.A.; Alqahtani, F.; Ahn, Y.; Patel, D.; Al-Ahmad, A.; Mehvar, R.; Bickel, U. LC–MS/MS-based in vitro and in vivo investigation of blood-brain barrier integrity by simultaneous quantitation of mannitol and sucrose. Fluids Barriers CNS 2020, 17, 61. [Google Scholar] [CrossRef]
- Saunders, N.R.; Dziegielewska, K.M.; Emøllgård, K.; Habgood, M.D. Markers for blood-brain barrier integrity: How appropriate is Evans blue in the twenty-first century and what are the alternatives? Front. Neurosci. 2015, 9, 385. [Google Scholar] [CrossRef] [Green Version]
- Bernal, J.; Valdés-Hernández, M.D.; Escudero, J.; Heye, A.K.; Sakka, E.; Armitage, P.A.; Makin, S.; Touyz, R.M.; Wardlaw, J.M.; Thrippleton, M.J. A four-dimensional computational model of dynamic contrast-enhanced magnetic resonance imaging measurement of subtle blood-brain barrier leakage. NeuroImage 2021, 230, 117786. [Google Scholar] [CrossRef] [PubMed]
- Elschot, E.P.; Backes, W.H.; Postma, A.A.; Van Oostenbrugge, R.J.; Staals, J.; Rouhl, R.P.; Jansen, J.F. A Comprehensive View on MRI Techniques for Imaging Blood-Brain Barrier Integrity. Investig. Radiol. 2021, 56, 10–19. [Google Scholar] [CrossRef]
- Marty, B.; Larrat, B.; Van Landeghem, M.; Robic, C.; Robert, P.; Port, M.; Le Bihan, D.; Pernot, M.; Tanter, M.; Lethimonnier, F.; et al. Dynamic Study of Blood-Brain Barrier Closure after its Disruption using Ultrasound: A Quantitative Analysis. J. Cereb. Blood Flow Metab. 2012, 32, 1948–1958. [Google Scholar] [CrossRef]
- Yang, F.-Y.; Wang, H.-E.; Lin, G.-L.; Teng, M.-C.; Lin, H.-H.; Wong, T.-T.; Liu, R.-S. Micro-SPECT/CT–Based Pharmacokinetic Analysis of 99mTc-Diethylenetriaminepentaacetic Acid in Rats with Blood-Brain Barrier Disruption Induced by Focused Ultrasound. J. Nucl. Med. 2011, 52, 478–484. [Google Scholar] [CrossRef] [Green Version]
- Tournier, N.; Comtat, C.; Lebon, V.; Gennisson, J.-L. Challenges and Perspectives of the Hybridization of PET with Functional MRI or Ultrasound for Neuroimaging. Neuroscience 2020, 474, 80–93. [Google Scholar] [CrossRef]
- Elmaleh, D.; Shoup, T.; Bonab, A.; Takahashi, K.; Fischman, A. Evaluation of 1-Deoxy-1-[18F]Fluoro-D-Mannitol as a Brain Imaging Tracer for Measuring Osmotic Disruption Following Cancer Therapy. J. Nucl. Med. 2014, 55, 1123. [Google Scholar]
- Hara, T.; Iio, M.; Tsukiyama, T.; Yokoi, F. Measurement of human blood brain barrier integrity using 11C-inulin and positron emission tomography. Eur. J. Nucl. Med. 1988, 14, 173–176. [Google Scholar] [CrossRef]
- Li, Z.; Wu, Z.; Cao, Q.; Dick, D.; Tseng, J.R.; Gambhir, S.S.; Chen, X. The Synthesis of 18F-FDS and Its Potential Application in Molecular Imaging. Mol. Imaging Biol. 2008, 10, 92–98. [Google Scholar] [CrossRef] [PubMed]
- Zhu, W.; Yao, S.; Xing, H.; Zhang, H.; Tai, Y.-C.; Zhang, Y.; Liu, Y.; Ma, Y.; Wu, C.; Wang, H.; et al. Biodistribution and Radiation Dosimetry of the Enterobacteriaceae-Specific Imaging Probe [18F]Fluorodeoxysorbitol Determined by PET/CT in Healthy Human Volunteers. Mol. Imaging Biol. 2016, 18, 782–787. [Google Scholar] [CrossRef] [PubMed]
- Yao, S.; Xing, H.; Zhu, W.; Wu, Z.; Zhang, Y.; Ma, Y.; Liu, Y.; Huo, L.; Zhu, Z.; Li, Z.; et al. Infection Imaging With 18F-FDS and First-in-Human Evaluation. Nucl. Med. Biol. 2016, 43, 206–214. [Google Scholar] [CrossRef] [PubMed]
- Felix, M.-S.; Borloz, E.; Metwally, K.; Dauba, A.; Larrat, B.; Matagne, V.; Ehinger, Y.; Villard, L.; Novell, A.; Mensah, S.; et al. Ultrasound-Mediated Blood-Brain Barrier Opening Improves Whole Brain Gene Delivery in Mice. Pharmaceutics 2021, 13, 1245. [Google Scholar] [CrossRef] [PubMed]
- Goutal, S.; Gerstenmayer, M.; Auvity, S.; Caillé, F.; Mériaux, S.; Buvat, I.; Larrat, B.; Tournier, N. Physical blood-brain barrier disruption induced by focused ultrasound does not overcome the transporter-mediated efflux of erlotinib. J. Control. Release 2018, 292, 210–220. [Google Scholar] [CrossRef]
- Logan, J.; Fowler, J.S.; Volkow, N.D.; Wolf, A.P.; Dewey, S.L.; Schlyer, D.J.; MacGregor, R.R.; Hitzemann, R.; Bendriem, B.; Gatley, S.J.; et al. Graphical Analysis of Reversible Radioligand Binding from Time—Activity Measurements Applied to [N-11C-Methyl]-(−)-Cocaine PET Studies in Human Subjects. J. Cereb. Blood Flow Metab. 1990, 10, 740–747. [Google Scholar] [CrossRef] [PubMed] [Green Version]
- Werner, R.A.; Ordonez, A.; Sanchez-Bautista, J.; Marcus, C.; Lapa, C.; Rowe, S.P.; Pomper, M.G.; Leal, J.P.; Lodge, M.A.; Javadi, M.S.; et al. Novel Functional Renal PET Imaging With 18F-FDS in Human Subjects. Clin. Nucl. Med. 2019, 44, 410–411. [Google Scholar] [CrossRef] [PubMed] [Green Version]
- Weinstein, E.A.; Ordonez, A.A.; DeMarco, V.P.; Murawski, A.M.; Pokkali, S.; MacDonald, E.M.; Klunk, M.; Mease, R.C.; Pomper, M.G.; Jain, S.K. Imaging Enterobacteriaceae infection in vivo with 18F-fluorodeoxysorbitol positron emission tomography. Sci. Transl. Med. 2014, 6, 259ra146. [Google Scholar] [CrossRef] [Green Version]
- Ordonez, A.A.; Wintaco, L.M.; Mota, F.; Restrepo, A.F.; Ruiz-Bedoya, C.A.; Reyes, C.F.; Uribe, L.G.; Abhishek, S.; D’Alessio, F.R.; Holt, D.P.; et al. Imaging Enterobacterales infections in patients using pathogen-specific positron emission tomography. Sci. Transl. Med. 2021, 13, eabe9805. [Google Scholar] [CrossRef]
- Werner, R.A.; Wakabayashi, H.; Chen, X.; Hirano, M.; Shinaji, T.; Lapa, C.; Rowe, S.P.; Javadi, M.S.; Higuchi, T. Functional Renal Imaging with 2-Deoxy-2-18F-Fluorosorbitol PET in Rat Models of Renal Disorders. J. Nucl. Med. 2018, 59, 828–832. [Google Scholar] [CrossRef] [Green Version]
- Fortin, D. Drug Delivery Technology to the CNS in the Treatment of Brain Tumors: The Sherbrooke Experience. Pharmaceutics 2019, 11, 248. [Google Scholar] [CrossRef] [Green Version]
- Yang, F.-Y.; Chang, W.-Y.; Chen, J.-C.; Lee, L.-C.; Hung, Y.-S. Quantitative assessment of cerebral glucose metabolic rates after blood-brain barrier disruption induced by focused ultrasound using FDG-MicroPET. NeuroImage 2014, 90, 93–98. [Google Scholar] [CrossRef]
- Breuil, L.; Marie, S.; Goutal, S.; Auvity, S.; Truillet, C.; Saba, W.; Langer, O.; Caillé, F.; Tournier, N. Comparative vulnerability of PET radioligands to partial inhibition of P-glycoprotein at the blood-brain barrier: A criterion of choice? J. Cereb. Blood Flow Metab. 2021. [Google Scholar] [CrossRef]
- Aryal, M.; Fischer, K.; Gentile, C.; Gitto, S.; Zhang, Y.-Z.; McDannold, N. Effects on P-Glycoprotein Expression after Blood-Brain Barrier Disruption Using Focused Ultrasound and Microbubbles. PLoS ONE 2017, 12, e0166061. [Google Scholar] [CrossRef] [Green Version]
- Cho, H.; Lee, H.-Y.; Han, M.; Choi, J.-R.; Ahn, S.; Lee, T.; Chang, Y.; Park, J. Localized Down-regulation of P-glycoprotein by Focused Ultrasound and Microbubbles induced Blood-Brain Barrier Disruption in Rat Brain. Sci. Rep. 2016, 6, 31201. [Google Scholar] [CrossRef]
- Drozdovitch, V.; Brill, A.B.; Callahan, R.J.; Clanton, J.A.; DePietro, A.; Goldsmith, S.J.; Greenspan, B.S.; Gross, M.D.; Hays, M.T.; Moore, S.C.; et al. Use of Radiopharmaceuticals in Diagnostic Nuclear Medicine in the United States: 1960–2010. Heal. Phys. 2015, 108, 520–537. [Google Scholar] [CrossRef] [Green Version]
- Hasegawa, K.; Koshino, K.; Higuchi, T. Facile synthesis of 2-deoxy-2-[18F]fluorosorbitol using sodium borohydride on aluminum oxide. J. Label. Compd. Radiopharm. 2021, 64, 40–46. [Google Scholar] [CrossRef]
- Obermeier, B.; Daneman, R.; Ransohoff, R.M. Development, maintenance and disruption of the blood-brain barrier. Nat. Med. 2013, 19, 1584–1596. [Google Scholar] [CrossRef]
- Okada, M.; Kikuchi, T.; Okamura, T.; Ikoma, Y.; Tsuji, A.B.; Wakizaka, H.; Kamakura, T.; Aoki, I.; Zhang, M.-R.; Kato, K. In-vivo imaging of blood-brain barrier permeability using positron emission tomography with 2-amino-[3-11C]isobutyric acid. Nucl. Med. Commun. 2015, 36, 1239–1248. [Google Scholar] [CrossRef] [PubMed]
- Iannotti, F.; Fieschi, C.; Alfano, B.; Picozzi, P.; Mansi, L.; Pozzilli, C.; Punzo, A.; Del Vecchio, G.; Lenzi, G.L.; Salvatore, M.; et al. Simplified, Noninvasive PET Measurement of Blood-Brain Barrier Permeability. J. Comput. Assist. Tomogr. 1987, 11, 390–397. [Google Scholar] [CrossRef] [PubMed]
- Jones, T.; Rabiner, E.A. PET Research Advisory Company the Development, Past Achievements, and Future Directions of Brain PET. J. Cereb. Blood Flow Metab. 2012, 32, 1426–1454. [Google Scholar] [CrossRef] [PubMed] [Green Version]
- Szadvari, I.; Krizanova, O.; Babula, P. Athymic Nude Mice as an Experimental Model for Cancer Treatment. Physiol. Res. 2016, S441–S453. [Google Scholar] [CrossRef] [PubMed]
- Zhang, X.; Liu, W.; Yuan, J.; Zhu, H.; Yang, Y.; Wen, Z.; Chen, Y.; Li, L.; Lin, J.; Feng, H. T lymphocytes infiltration promotes blood-brain barrier injury after experimental intracerebral hemorrhage. Brain Res. 2017, 1670, 96–105. [Google Scholar] [CrossRef]
- Li, J.; Zheng, M.; Shimoni, O.; Banks, W.A.; Bush, A.I.; Gamble, J.R.; Shi, B. Development of Novel Therapeutics Targeting the Blood-Brain Barrier: From Barrier to Carrier. Adv. Sci. 2021, 8, 2101090. [Google Scholar] [CrossRef] [PubMed]
- Burgess, A.; Dubey, S.; Yeung, S.; Hough, O.; Eterman, N.; Aubert, I.; Hynynen, K. Alzheimer Disease in a Mouse Model: MR Imaging–guided Focused Ultrasound Targeted to the Hippocampus Opens the Blood-Brain Barrier and Improves Pathologic Abnormalities and Behavior. Radiology 2014, 273, 736–745. [Google Scholar] [CrossRef] [PubMed] [Green Version]
- Mooney, S.J.; Shah, K.; Yeung, S.; Burgess, A.; Aubert, I.; Hynynen, K. Focused Ultrasound-Induced Neurogenesis Requires an Increase in Blood-Brain Barrier Permeability. PLoS ONE 2016, 11, e0159892. [Google Scholar] [CrossRef] [PubMed]


Publisher’s Note: MDPI stays neutral with regard to jurisdictional claims in published maps and institutional affiliations. |
© 2021 by the authors. Licensee MDPI, Basel, Switzerland. This article is an open access article distributed under the terms and conditions of the Creative Commons Attribution (CC BY) license (https://creativecommons.org/licenses/by/4.0/).
Share and Cite
Hugon, G.; Goutal, S.; Dauba, A.; Breuil, L.; Larrat, B.; Winkeler, A.; Novell, A.; Tournier, N. [18F]2-Fluoro-2-deoxy-sorbitol PET Imaging for Quantitative Monitoring of Enhanced Blood-Brain Barrier Permeability Induced by Focused Ultrasound. Pharmaceutics 2021, 13, 1752. https://doi.org/10.3390/pharmaceutics13111752
Hugon G, Goutal S, Dauba A, Breuil L, Larrat B, Winkeler A, Novell A, Tournier N. [18F]2-Fluoro-2-deoxy-sorbitol PET Imaging for Quantitative Monitoring of Enhanced Blood-Brain Barrier Permeability Induced by Focused Ultrasound. Pharmaceutics. 2021; 13(11):1752. https://doi.org/10.3390/pharmaceutics13111752
Chicago/Turabian StyleHugon, Gaëlle, Sébastien Goutal, Ambre Dauba, Louise Breuil, Benoit Larrat, Alexandra Winkeler, Anthony Novell, and Nicolas Tournier. 2021. "[18F]2-Fluoro-2-deoxy-sorbitol PET Imaging for Quantitative Monitoring of Enhanced Blood-Brain Barrier Permeability Induced by Focused Ultrasound" Pharmaceutics 13, no. 11: 1752. https://doi.org/10.3390/pharmaceutics13111752
APA StyleHugon, G., Goutal, S., Dauba, A., Breuil, L., Larrat, B., Winkeler, A., Novell, A., & Tournier, N. (2021). [18F]2-Fluoro-2-deoxy-sorbitol PET Imaging for Quantitative Monitoring of Enhanced Blood-Brain Barrier Permeability Induced by Focused Ultrasound. Pharmaceutics, 13(11), 1752. https://doi.org/10.3390/pharmaceutics13111752