
Re-Use of Caco-2 Monolayers in Permeability Assays—Validation Regarding Cell Monolayer Integrity

 , , ,
, , ,  and
and 
Abstract
:
1. Introduction
2. Materials and Methods
2.1. Reagents and Materials
2.2. Caco-2 Cell Culture and Seeding
2.3. Permeability Assays and Transepithelial Electrical Resistance (TEER)
2.4. LY Quantification
2.5. Confocal Laser Screening Microscopy
2.6. Statistical Analysis
3. Results and Discussion
3.1. Effect of Re-Use on the Cell Monolayer Integrity after Single Time Sampling Permeability Assays
3.2. Effect of Multi-Time Sampling on the Paracellular Permeability through Caco-2 Monolayers
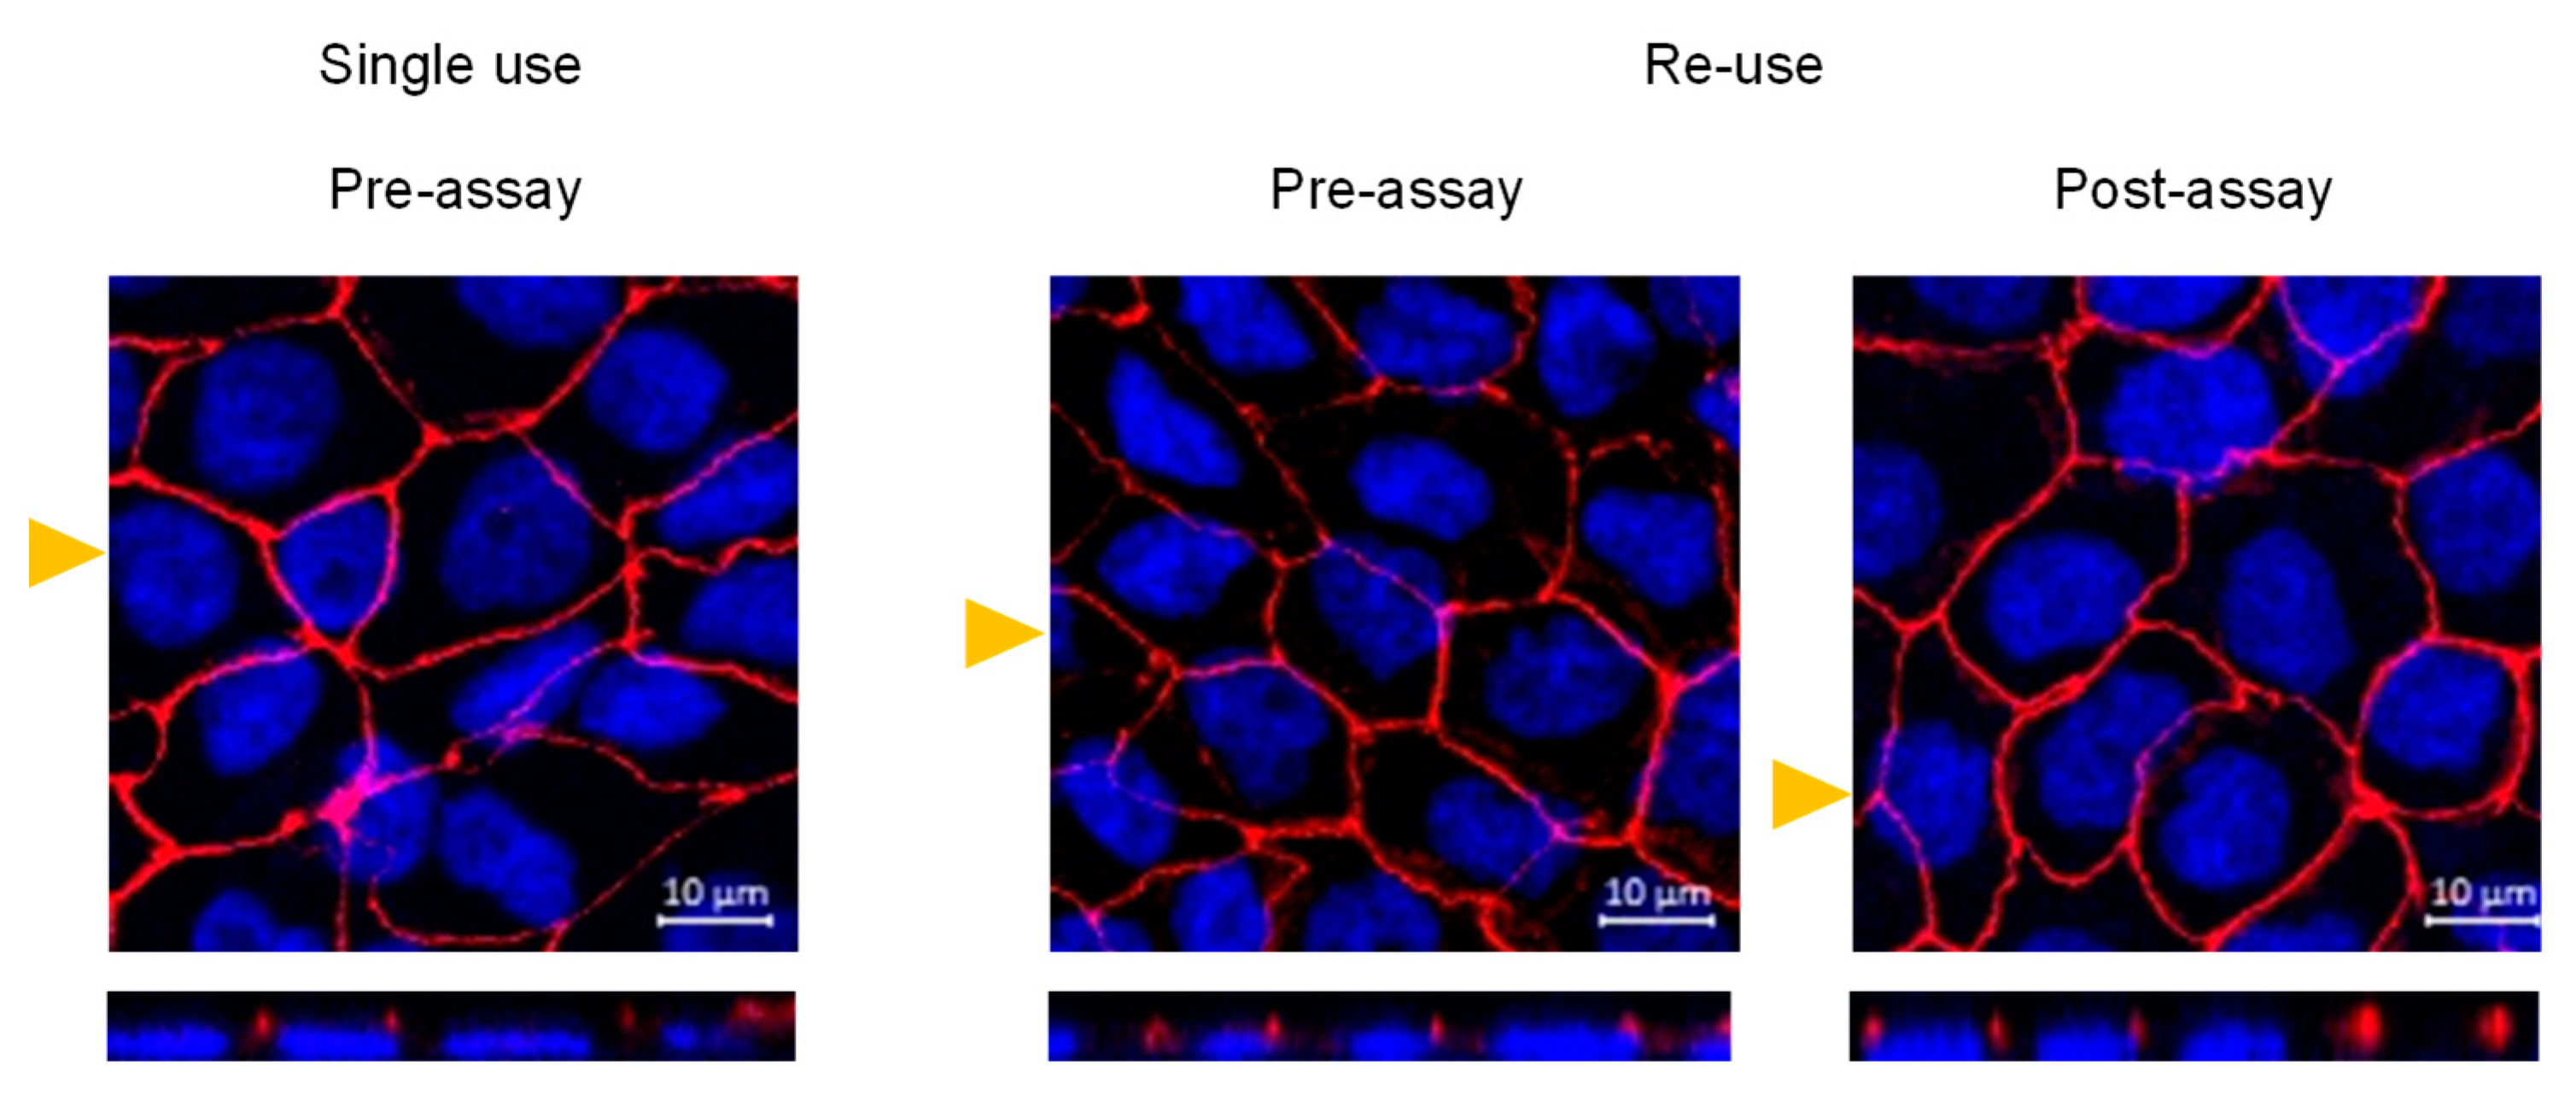
3.3. Morphological Features and Integrity of the Cell Monolayer
3.4. Multivariate Analysis
4. Conclusions
Supplementary Materials
Author Contributions
Funding
Institutional Review Board Statement
Informed Consent Statement
Data Availability Statement
Acknowledgments
Conflicts of Interest
References
- Balimane, P.V.; Chong, S. Cell culture-based models for intestinal permeability: A critique. Drug Discov. Today 2005, 10, 335–343. [Google Scholar] [CrossRef]
- Volpe, D.A. Advances in cell-based permeability assays to screen drugs for intestinal absorption. Expert Opin. Drug Discov. 2020, 15, 539–549. [Google Scholar] [CrossRef] [PubMed]
- Hidalgo, I.J.; Raub, T.J.; Borchardt, R.T. Characterization of the Human-Colon Carcinoma Cell-Line (Caco-2) as a Model System for Intestinal Epithelial Permeability. Gastroenterology 1989, 96, 736–749. [Google Scholar] [CrossRef]
- Hilgers, A.R.; Conradi, R.A.; Burton, P.S. Caco-2 Cell Monolayers as a Model for Drug Transport Across the Intestinal-Mucosa. Pharm. Res. 1990, 7, 902–910. [Google Scholar] [CrossRef]
- van Breemen, R.B.; Li, Y. Caco-2 cell permeability assays to measure drug absorption. Expert Opin. Drug Metab. Toxicol. 2005, 1, 175–185. [Google Scholar] [CrossRef]
- Artursson, P.; Palm, K.; Luthman, K. Caco-2 monolayers in experimental and theoretical predictions of drug transport. Adv. Drug Deliv. Rev. 2012, 64, 280–289. [Google Scholar] [CrossRef]
- Lennernas, H.; Palm, K.; Fagerholm, U.; Artursson, P. Comparison between active and passive drug transport in human intestinal epithelial (Caco-2) cells in vitro and human jejunum in vivo. Int. J. Pharmaceut. 1996, 127, 103–107. [Google Scholar] [CrossRef]
- Artursson, P.; Karlsson, J. Correlation Between Oral-Drug Absorption in Humans and Apparent Drug Permeability Coefficients in Human Intestinal Epithelial (Caco-2) Cells. Biochem. Biophys. Res. Commun. 1991, 175, 880–885. [Google Scholar] [CrossRef]
- Di, L.; Artursson, P.; Avdeef, A.; Ecker, G.F.; Faller, B.; Fischer, H.; Houston, J.B.; Kansy, M.; Kerns, E.H.; Kramer, S.D.; et al. Evidence-based approach to assess passive diffusion and carrier-mediated drug transport. Drug Discov. Today 2012, 17, 905–912. [Google Scholar] [CrossRef]
- Sun, H.; Chow, E.C.Y.; Liu, S.; Du, Y.; Pang, K.S. The Caco-2 cell monolayer: Usefulness and limitations. Expert Opin. Drug Metab. Toxicol. 2008, 4, 395–411. [Google Scholar] [CrossRef]
- Kozuka, K.; He, Y.; Koo-Mccoy, S.; Kumaraswamy, P.; Nie, B.; Shaw, K.; Chan, P.; Leadbetter, M.; He, L.; Lewis, J.G.; et al. Development and Characterization of a Human and Mouse Intestinal Epithelial Cell Monolayer Platform. Stem Cell Rep. 2017, 9, 1976–1990. [Google Scholar] [CrossRef] [Green Version]
- Oltra-Noguera, D.; Mangas-Sanjuan, V.; Centelles-Sanguesa, A.; Gonzalez-Garcia, I.; Sanchez-Castano, G.; Gonzalez-Alvarez, M.; Casabo, V.G.; Merino, V.; Gonzalez-Alvarez, I.; Bermejo, M. Variability of permeability estimation from different protocols of subculture and transport experiments in cell monolayers. J. Pharmacol. Toxicol. Methods 2015, 71, 21–32. [Google Scholar] [CrossRef]
- Lee, J.B.; Zgair, A.; Taha, D.A.; Zang, X.W.; Kagan, L.; Kim, T.H.; Kim, M.G.; Yun, H.Y.; Fischer, P.M.; Gershkovich, P. Quantitative analysis of lab-to-lab variability in Caco-2 permeability assays. Eur. J. Pharm. Biopharm. 2017, 114, 38–42. [Google Scholar] [CrossRef]
- Sambuy, Y.; Angelis, I.; Ranaldi, G.; Scarino, M.L.; Stammati, A.; Zucco, F. The Caco-2 cell line as a model of the intestinal barrier: Influence of cell and culture-related factors on Caco-2 cell functional characteristics. Cell Biol. Toxicol. 2005, 21, 1–26. [Google Scholar] [CrossRef] [PubMed]
- Hubatsch, I.; Ragnarsson, E.G.E.; Artursson, P. Determination of drug permeability and prediction of drug absorption in Caco-2 monolayers. Nat. Protoc. 2007, 2, 2111–2119. [Google Scholar] [CrossRef] [PubMed]
- BriskeAnderson, M.J.; Finley, J.W.; Newman, S.M. The influence of culture time and passage number on the morphological and physiological development of Caco-2 cells. Proc. Soc. Exp. Biol. Med. 1997, 214, 248–257. [Google Scholar] [CrossRef]
- Lu, S.; Gough, A.W.; Bobrowski, W.F.; Stewart, B.H. Transport properties are not altered across Caco-2 cells with heightened TEER despite underlying physiological and ultrastructural changes. J. Pharm. Sci. 1996, 85, 270–273. [Google Scholar] [CrossRef]
- Liang, E.; Chessic, K.; Yazdanian, M. Evaluation of an accelerated Caco-2 cell permeability model. J. Pharm. Sci. 2000, 89, 336–345. [Google Scholar] [CrossRef]
- Yamashita, S.; Konishi, K.; Yamazaki, Y.; Taki, Y.; Sakane, T.; Sezaki, H.; Furuyama, Y. New and better protocols for a short-term Caco-2 cell culture system. J. Pharm. Sci. 2002, 91, 669–679. [Google Scholar] [CrossRef] [PubMed]
- Sevin, E.; Dehouck, L.; Fabulas-da Costa, A.; Cecchelli, R.; Dehouck, M.P.; Lundquist, S.; Culot, M. Accelerated Caco-2 cell permeability model for drug discovery. J. Pharmacol. Toxicol. Methods 2013, 68, 334–339. [Google Scholar] [CrossRef] [PubMed]
- Cai, Y.K.; Xu, C.S.; Chen, P.Y.; Hu, J.Q.; Hu, R.; Huang, M.; Bi, H.C. Development, validation, and application of a novel 7-day Caco-2 cell culture system. J. Pharmacol. Toxicol. Methods 2014, 70, 175–181. [Google Scholar] [CrossRef]
- Marino, A.M.; Yarde, M.; Patel, H.; Chong, S.H.; Balimane, P.V. Validation of the 96 well Caco-2 cell culture model for high throughput permeability assessment of discovery compounds. Int. J. Pharmaceut. 2005, 297, 235–241. [Google Scholar] [CrossRef] [PubMed]
- Balimane, P.V.; Patel, K.; Marino, A.; Chong, S.H. Utility of 96 well Caco-2 cell system for increased throughput of P-gp screening in drug discovery. Eur. J. Pharm. Biopharm. 2004, 58, 99–105. [Google Scholar] [CrossRef] [PubMed]
- Sevin, E.; Dehouck, L.; Versele, R.; Culot, M.; Gosselet, F. A Miniaturized Pump Out Method for Characterizing Molecule Interaction with ABC Transporters. Int. J. Mol. Sci. 2019, 20, 5529. [Google Scholar] [CrossRef] [Green Version]
- Alsenz, J.; Haenel, E. Development of a 7-day, 96-well Caco-2 permeability assay with high-throughput direct UV compound analysis. Pharm. Res. 2003, 20, 1961–1969. [Google Scholar] [CrossRef]
- Bu, H.Z.; Poglod, M.; Micetich, R.G.; Khan, J.K. High-throughput Caco-2 cell permeability screening by cassette dosing and sample pooling approaches using direct injection/on-line guard cartridge extraction/tandem mass spectrometry. Rapid Commun. Mass Spectrom. 2000, 14, 523–528. [Google Scholar] [CrossRef]
- Laitinen, L.; Kangas, H.; Kaukonen, A.M.; Hakala, K.; Kotiaho, T.; Kostiainen, R.; Hirvonen, J. N-in-one permeability studies of heterogeneous sets of compounds across Caco-2 cell monolayers. Pharm. Res. 2003, 20, 187–197. [Google Scholar] [CrossRef]
- Tannergren, C.; Langguth, P.; Hoffmann, K.J. Compound mixtures in Caco-2 cell permeability screens as a means to increase screening capacity. Pharmazie 2001, 56, 337–342. [Google Scholar] [PubMed]
- Konsoula, R.; Barile, F.A. Correlation of in vitro cytotoxicity with paracellular permeability in Caco-2 cells. Toxicol. Vitr. 2005, 19, 675–684. [Google Scholar] [CrossRef]
- Rodrigues, E.T.; Nascimento, S.F.; Pires, C.L.; Godinho, L.P.; Churro, C.; Moreno, M.J.; Pardal, M.A. Determination of intestinal absorption of the paralytic shellfish toxin GTX-5 using the Caco-2 human cell model. Environ. Sci. Pollut. Res. 2021. [Google Scholar] [CrossRef]
- Yu, H.S.; Cook, T.J.; Sinko, P.J. Evidence for diminished functional expression of intestinal transporters in Caco-2 cell monolayers at high passages. Pharm. Res. 1997, 14, 757–762. [Google Scholar] [CrossRef]
- Volpe, D.A. Application of Method Suitability for Drug Permeability Classification. Aaps J. 2010, 12, 670–678. [Google Scholar] [CrossRef] [Green Version]
- Vachon, P.H.; Beaulieu, J.F. Transient Mosaic Patterns of Morphological and Functional-Differentiation in the Caco-2 Cell-Line. Gastroenterology 1992, 103, 414–423. [Google Scholar] [CrossRef]
- Ujhelyi, Z.; Fenyvesi, F.; Varadi, J.; Feher, P.; Kiss, T.; Veszelka, S.; Deli, M.; Vecsernyes, M.; Bacskay, I. Evaluation of cytotoxicity of surfactants used in self-micro emulsifying drug delivery systems and their effects on paracellular transport in Caco-2 cell monolayer. Eur. J. Pharm. Sci. 2012, 47, 564–573. [Google Scholar] [CrossRef] [PubMed]
- Corazza, F.G.; Ernesto, J.V.; Nambu, F.A.N.; de Carvalho, L.R.; Leite-Silva, V.R.; Varca, G.H.C.; Calixto, L.A.; Vieira, D.P.; Andreo-Filho, N.; Lopes, P.S. Papain-cyclodextrin complexes as an intestinal permeation enhancer: Permeability and in vitro safety evaluation. J. Drug Deliv. Sci. Technol. 2020, 55, 101413. [Google Scholar] [CrossRef]
- Hellinger, E.; Veszelka, S.; Toth, A.E.; Walter, F.; Kittel, A.; Bakk, M.L.; Tihanyi, K.; Hada, V.; Nakagawa, S.; Thuy, D.H.D.; et al. Comparison of brain capillary endothelial cell-based and epithelial (MDCK-MDR1, Caco-2, and VB-Caco-2) cell-based surrogate blood-brain barrier penetration models. Eur. J. Pharm. Biopharm. 2012, 82, 340–351. [Google Scholar] [CrossRef] [PubMed]
- Paketuryte, V.; Petrauskas, V.; Zubriene, A.; Abian, O.; Bastos, M.; Chen, W.Y.; Moreno, M.J.; Krainer, G.; Linkuviene, V.; Sedivy, A.; et al. Uncertainty in protein-ligand binding constants: Asymmetric confidence intervals versus standard errors. Eur. Biophys. J. Biophys. Lett. 2021, 50, 661–670. [Google Scholar] [CrossRef] [PubMed]
- Kemmer, G.; Keller, S. Nonlinear least-squares data fitting in Excel spreadsheets. Nat. Protoc. 2010, 5, 267–281. [Google Scholar] [CrossRef]
- Delie, F.; Rubas, W. A human colonic cell line sharing similarities with enterocytes as a model to examine oral absorption: Advantages and limitations of the Caco-2 model. Crit. Rev. Ther. Drug Carr. Syst. 1997, 14, 221–286. [Google Scholar] [CrossRef]
- Hidalgo, I.J. Assessing the absorption of new pharmaceuticals. Curr. Top. Med. Chem. 2001, 1, 385–401. [Google Scholar] [CrossRef]
- Madara, J.L. Regulation of the movement of solutes across tight junctions. Annu. Rev. Physiol. 1998, 60, 143–159. [Google Scholar] [CrossRef] [PubMed]
- Tervonen, A.; Ihalainen, T.O.; Nymark, S.; Hyttinen, J. Structural dynamics of tight junctions modulate the properties of the epithelial barrier. PLoS ONE 2019, 14, e0214876. [Google Scholar] [CrossRef] [PubMed]
- Adson, A.; Raub, T.J.; Burton, P.S.; Barsuhn, C.L.; Hilgers, A.R.; Audus, K.L.; Ho, N.F.H. Quantitative Approaches to Delineate Paracellular Diffusion in Cultured Epithelial-Cell Monolayers. J. Pharm. Sci. 1994, 83, 1529–1536. [Google Scholar] [CrossRef] [PubMed]
- Press, B.; Di Grandi, D. Permeability for Intestinal Absorption: Caco-2 Assay and Related Issues. Curr. Drug Metab. 2008, 9, 893–900. [Google Scholar] [CrossRef]
- Bohets, H.; Annaert, P.; Mannens, G.; Van Beijsterveldt, L.; Anciaux, K.; Verboven, P.; Meuldermans, W.; Lavrijsen, K. Strategies for absorption screening in drug discovery and development. Curr. Top. Med. Chem. 2001, 1, 367–383. [Google Scholar] [CrossRef] [Green Version]
- Antonescu, I.E.; Rasmussen, K.F.; Neuhoff, S.; Frette, X.; Karlgren, M.; Bergstrom, C.A.S.; Nielsen, C.U.; Steffansen, B. The Permeation of Acamprosate Is Predominantly Caused by Paracellular Diffusion across Caco-2 Cell Monolayers: A Paracellular Modeling Approach. Mol. Pharm. 2019, 16, 4636–4650. [Google Scholar] [CrossRef]
- Shimizu, M.; Tsunogai, M.; Arai, S. Transepithelial transport of oligopeptides in the human intestinal cell, Caco-2. Peptides 1997, 18, 681–687. [Google Scholar] [CrossRef]
- Yee, S.Y. In vitro permeability across Caco-2 cells (colonic) can predict in vivo (small intestinal) absorption in man—Fact or myth. Pharm. Res. 1997, 14, 763–766. [Google Scholar] [CrossRef]
- Artursson, P. Epithelial transport of drugs in cell culture. I: A model for studying the passive diffusion of drugs over intestinal absorbtive (Caco-2) cells. J. Pharm. Sci. 1990, 79, 476–482. [Google Scholar] [CrossRef]
- Broeders, J.J.W.; van Eijkeren, J.C.H.; Blaauboer, B.J.; Hermens, J.L.M. Transport of Chlorpromazine in the Caco-2 Cell Permeability Assay: A Kinetic Study. Chem. Res. Toxicol. 2012, 25, 1442–1451. [Google Scholar] [CrossRef]
- Hidalgo, I.J.; Borchardt, R.T. Transport of Bile-Acids In a Human Intestinal Epithelial-Cell Line, Caco-2. Biochim. Biophys. Acta 1990, 1035, 97–103. [Google Scholar] [CrossRef]
- Hosoya, K.; Kim, K.J.; Lee, V.H.L. Age-dependent expression of P-glycoprotein gp170 in Caco-2 cell monolayers. Pharm. Res. 1996, 13, 885–890. [Google Scholar] [CrossRef]
- Saitoh, R.; Sugano, K.; Takata, N.; Tachibana, T.; Higashida, A.; Nabuchi, Y.; Aso, Y. Correction of permeability with pore radius of tight junctions in Caco-2 monolayers improves the prediction of the dose fraction of hydrophilic drugs absorbed by humans. Pharm. Res. 2004, 21, 749–755. [Google Scholar] [CrossRef] [PubMed]
- Linnankoski, J.; Makela, J.; Palmgren, J.; Mauriala, T.; Vedin, C.; Ungell, A.L.; Lazorova, L.; Artursson, P.; Urtti, A.; Yliperttula, M. Paracellular Porosity and Pore Size of the Human Intestinal Epithelium in Tissue and Cell Culture Models. J. Pharm. Sci. 2010, 99, 2166–2175. [Google Scholar] [CrossRef] [PubMed]
 ,
,  ,
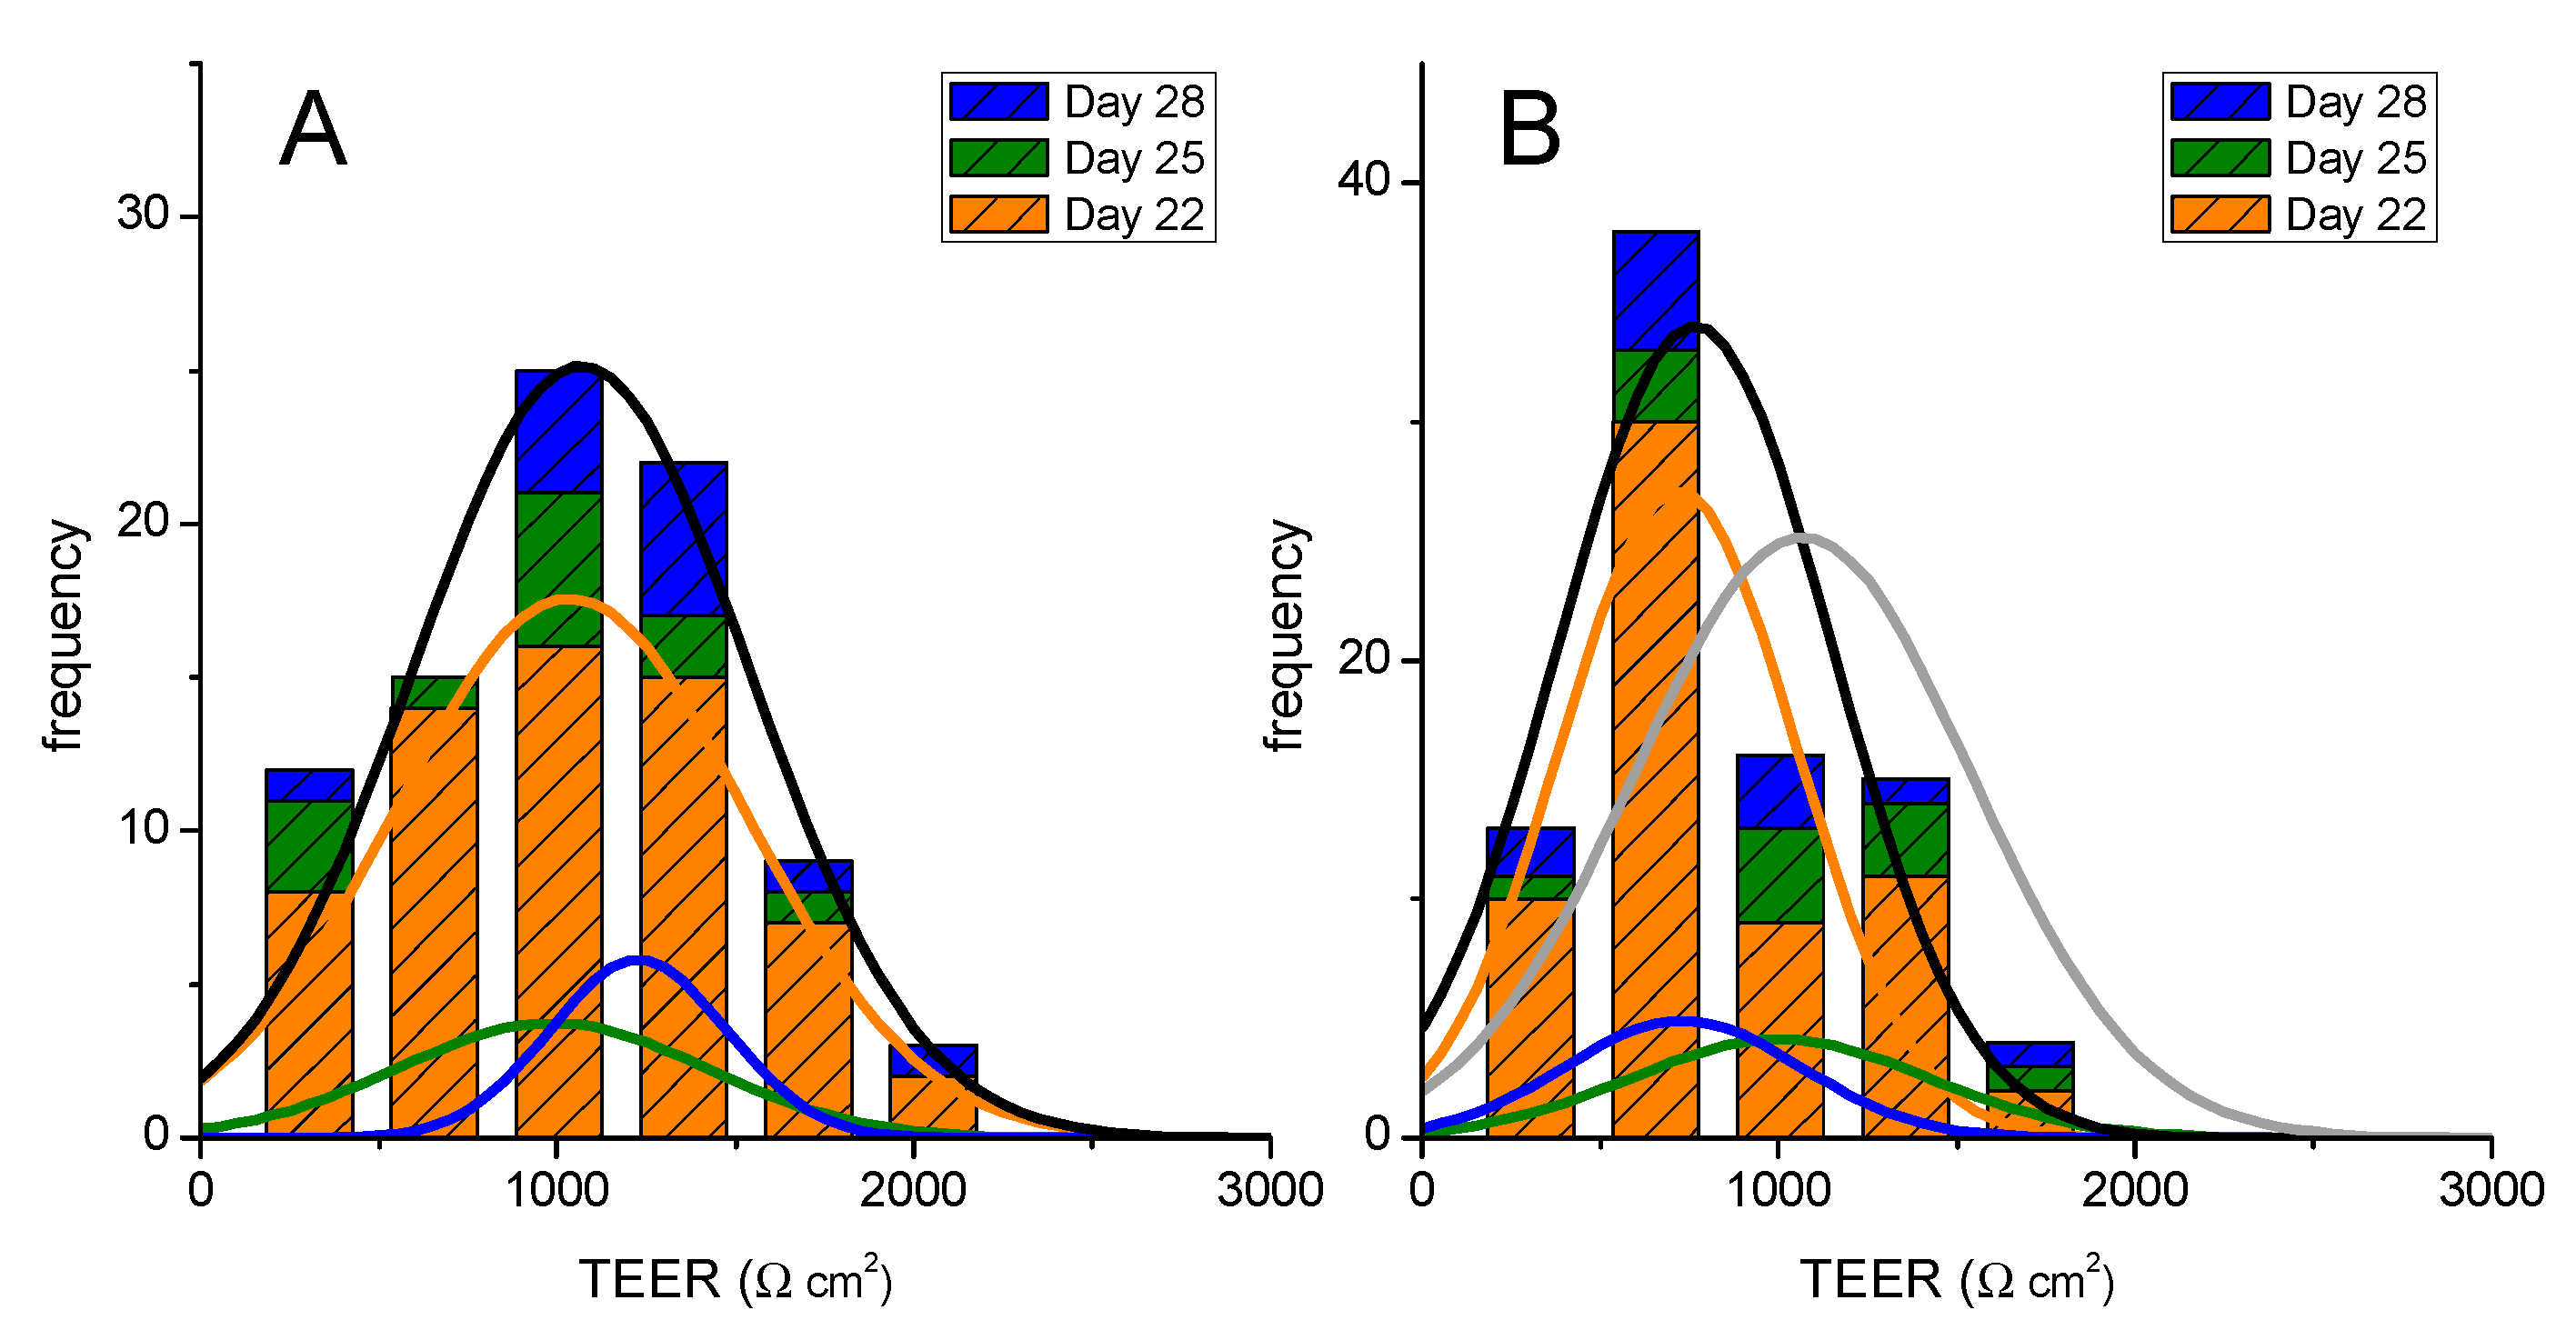
,  ), and those previously used are shown in light colors (
  and
and  , TEER on day 25 previously used on day 22;
  and
and  , TEER on day 28 previously used on days 22 and 25, on single or multi-time sampling). The lines are the best fit of a Normal distribution to the results obtained on single use or re-used cell monolayers (colored lines) or cumulatively for each day (black line), with the parameters given in the Supplementary Material—Table S1. The cumulative results at all days are shown on the right plot (
  , TEER before assay on days 22, 25, or 28;
  , TEER before assay on days 25 or 28 after being used on day 22 or on days 22 and 25).
, , ), and those previously used are shown in light colors ( and , TEER on day 25 previously used on day 22; and , TEER on day 28 previously used on days 22 and 25, on single or multi-time sampling). The lines are the best fit of a Normal distribution to the results obtained on single use or re-used cell monolayers (colored lines) or cumulatively for each day (black line), with the parameters given in the Supplementary Material—Table S1. The cumulative results at all days are shown on the right plot ( , TEER before assay on days 22, 25, or 28; , TEER before assay on days 25 or 28 after being used on day 22 or on days 22 and 25).
, TEER before assay on days 25 or 28 after being used on day 22 or on days 22 and 25).
, , ), and those previously used are shown in light colors ( and , TEER on day 25 previously used on day 22; and , TEER on day 28 previously used on days 22 and 25, on single or multi-time sampling). The lines are the best fit of a Normal distribution to the results obtained on single use or re-used cell monolayers (colored lines) or cumulatively for each day (black line), with the parameters given in the Supplementary Material—Table S1. The cumulative results at all days are shown on the right plot ( , TEER before assay on days 22, 25, or 28; , TEER before assay on days 25 or 28 after being used on day 22 or on days 22 and 25).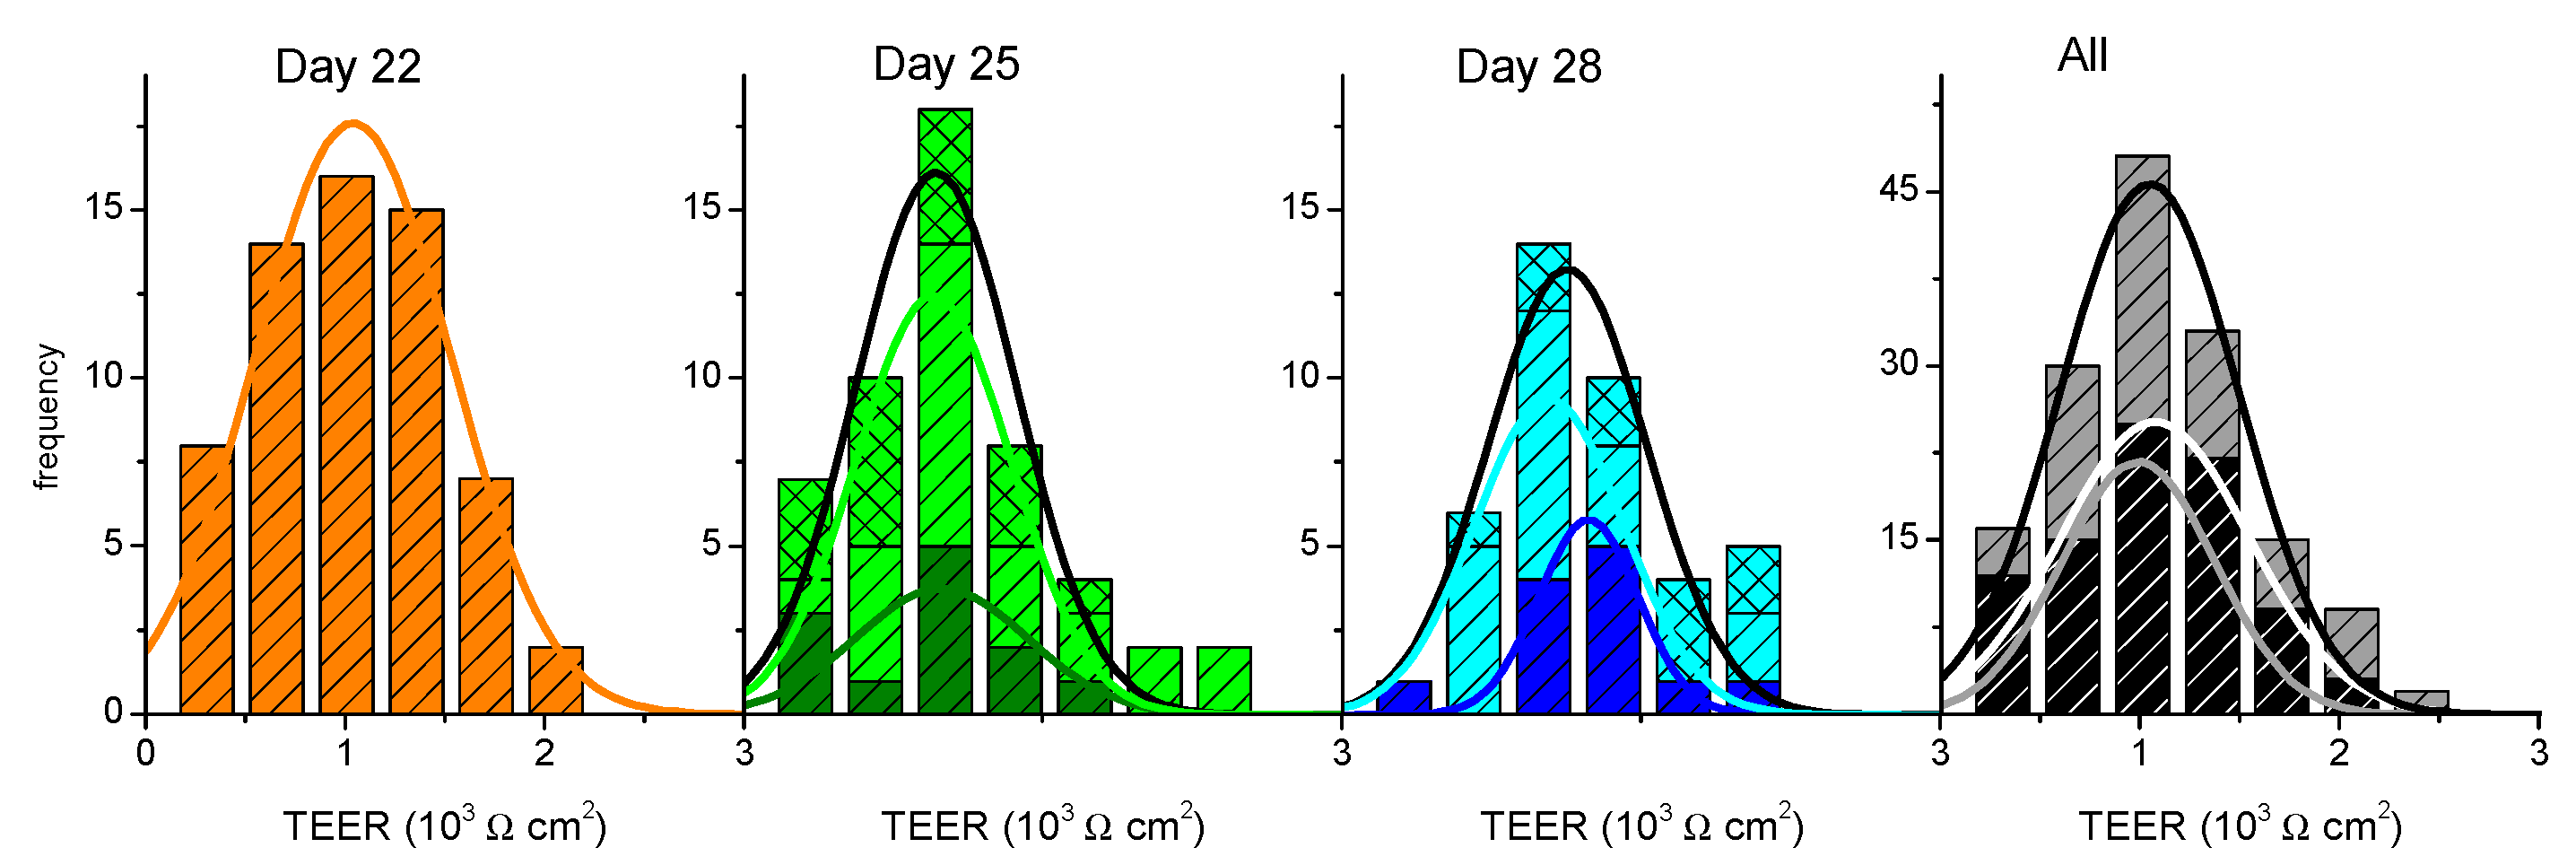

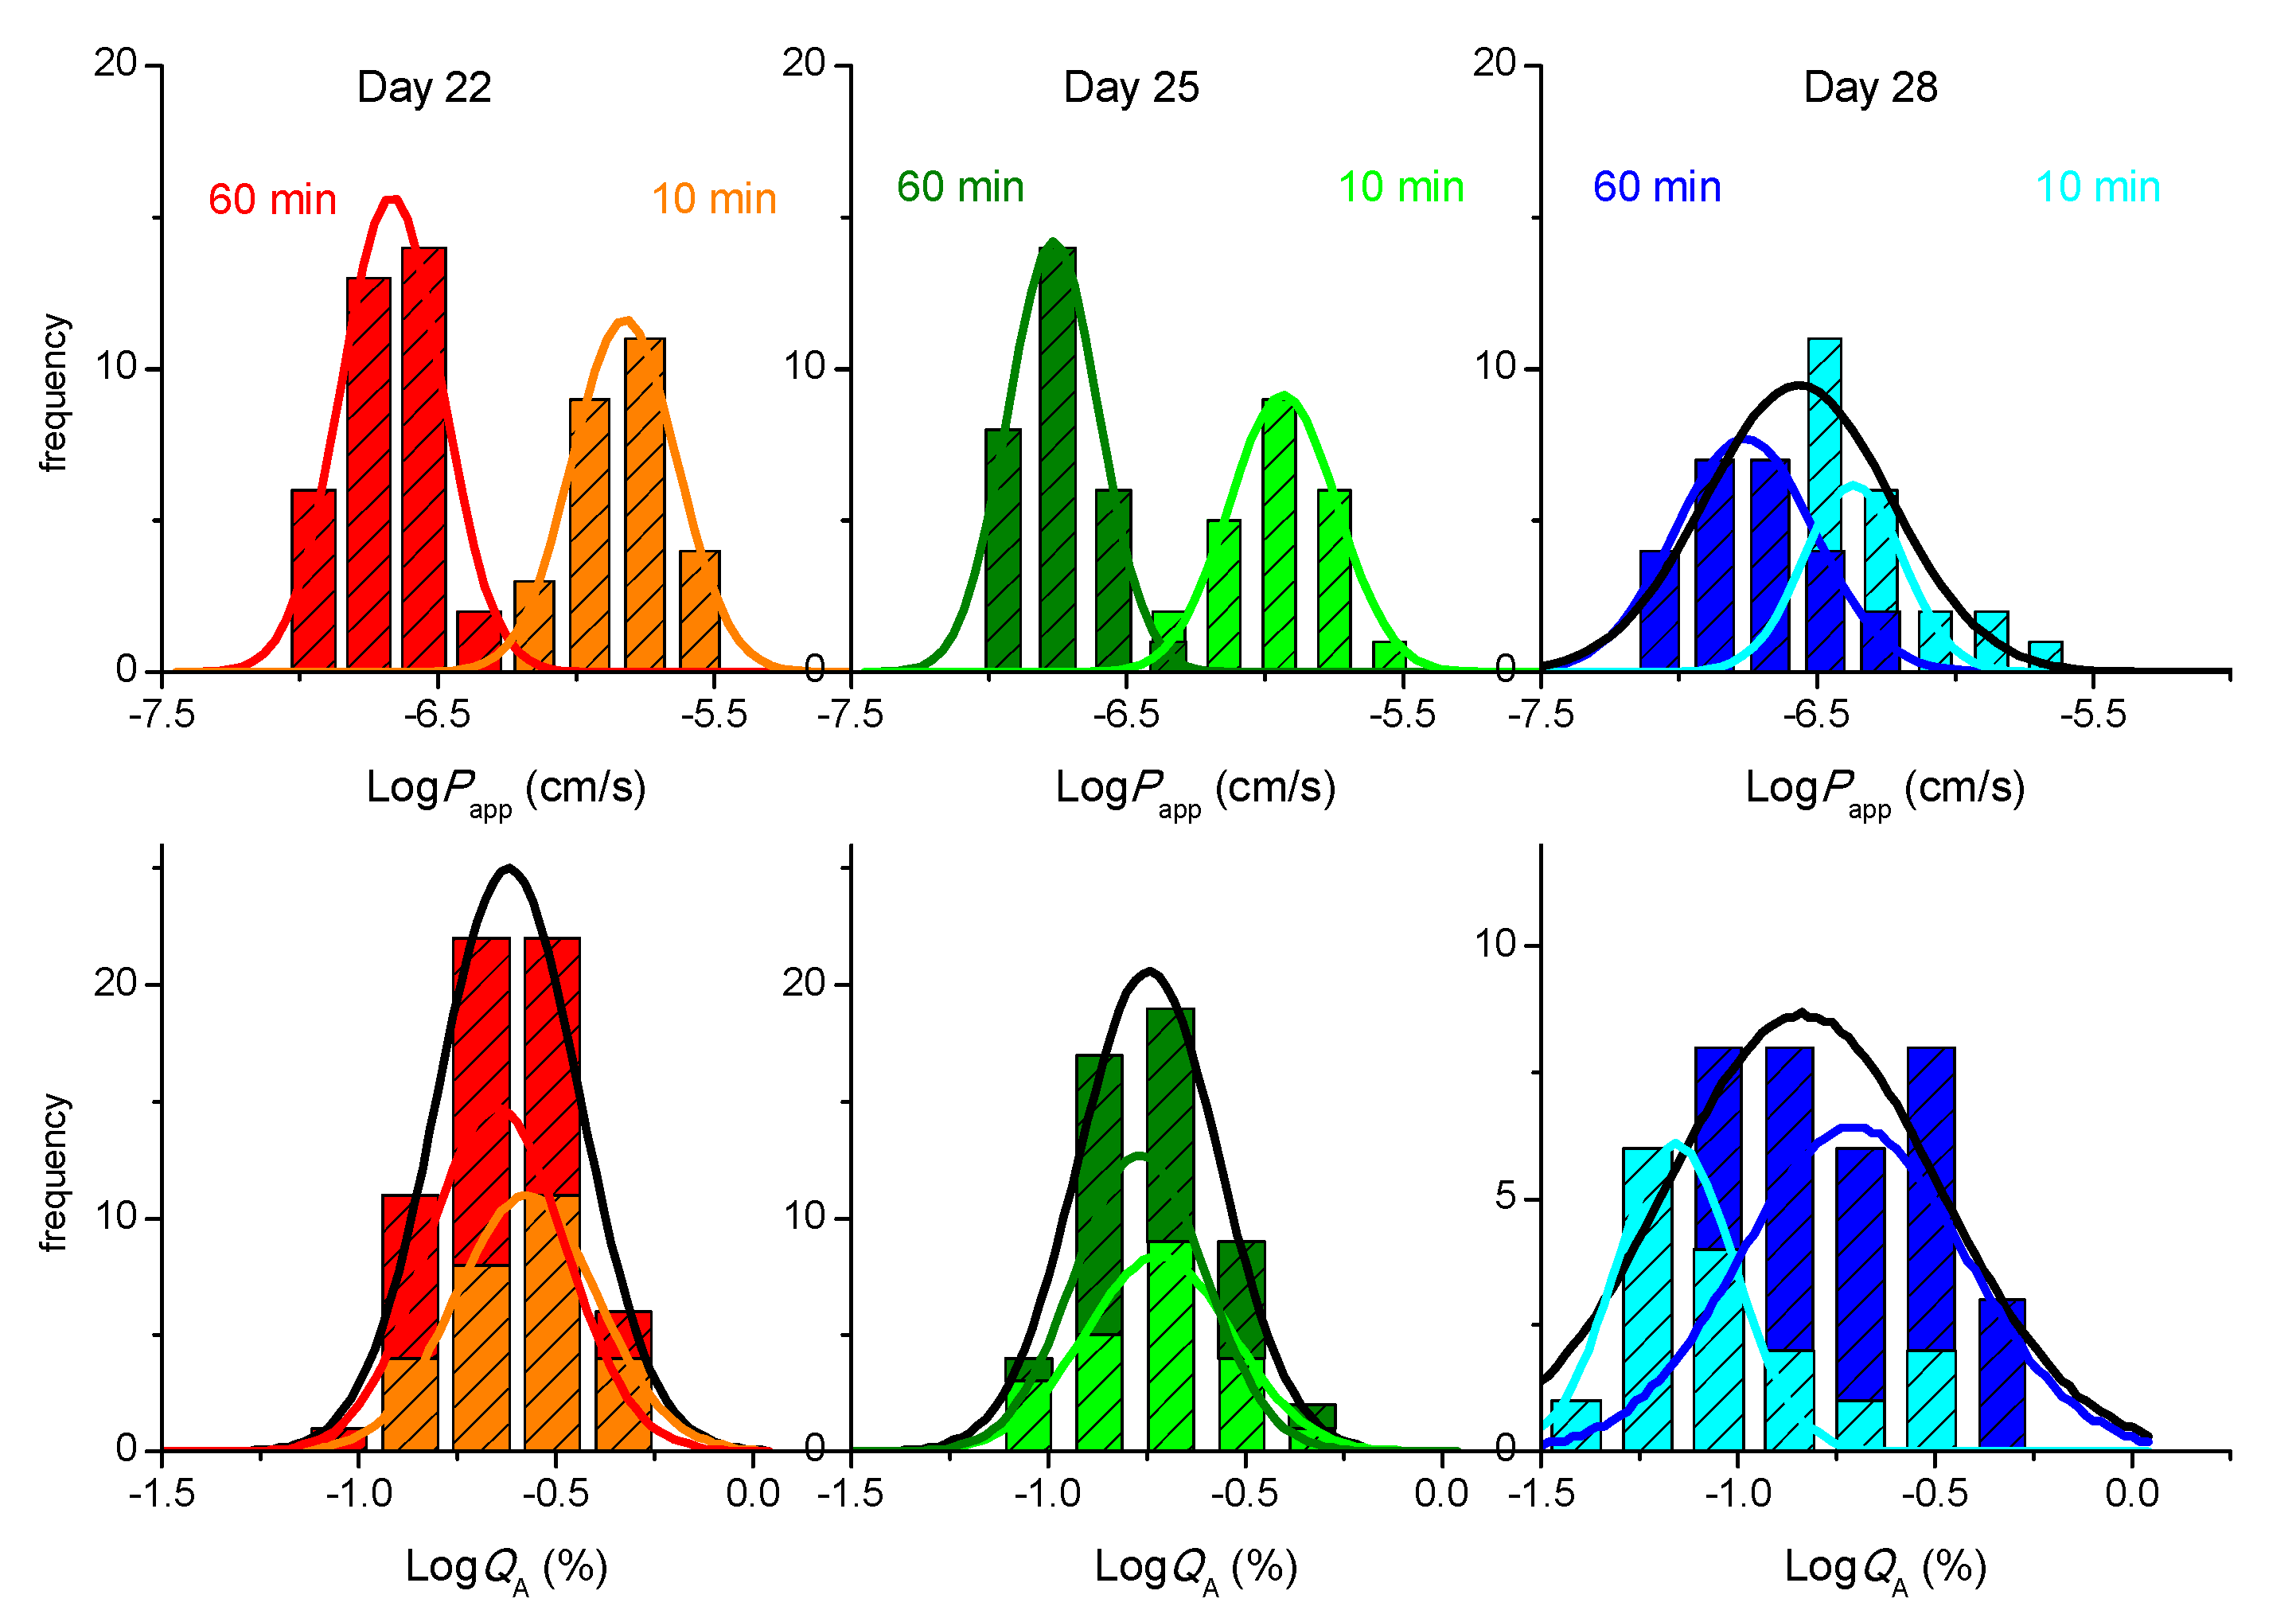
 , , ), 2nd 10 min sampling (
  ,
,  ,
,  ), and 3rd 10 min sampling ( , , ). The lines are the best fit of a Normal distribution, with the parameters given in Supplementary Material—Table S4, the black line corresponding to the sum of the results from the 3 sampling time points.
, , ), 2nd 10 min sampling ( , , ), and 3rd 10 min sampling ( , , ). The lines are the best fit of a Normal distribution, with the parameters given in Supplementary Material—Table S4, the black line corresponding to the sum of the results from the 3 sampling time points.
), and 3rd 10 min sampling ( , , ). The lines are the best fit of a Normal distribution, with the parameters given in Supplementary Material—Table S4, the black line corresponding to the sum of the results from the 3 sampling time points.
, , ), 2nd 10 min sampling ( , , ), and 3rd 10 min sampling ( , , ). The lines are the best fit of a Normal distribution, with the parameters given in Supplementary Material—Table S4, the black line corresponding to the sum of the results from the 3 sampling time points.
Publisher’s Note: MDPI stays neutral with regard to jurisdictional claims in published maps and institutional affiliations. |
© 2021 by the authors. Licensee MDPI, Basel, Switzerland. This article is an open access article distributed under the terms and conditions of the Creative Commons Attribution (CC BY) license (https://creativecommons.org/licenses/by/4.0/).
Share and Cite
Pires, C.L.; Praça, C.; Martins, P.A.T.; Batista de Carvalho, A.L.M.; Ferreira, L.; Marques, M.P.M.; Moreno, M.J. Re-Use of Caco-2 Monolayers in Permeability Assays—Validation Regarding Cell Monolayer Integrity. Pharmaceutics 2021, 13, 1563. https://doi.org/10.3390/pharmaceutics13101563
Pires CL, Praça C, Martins PAT, Batista de Carvalho ALM, Ferreira L, Marques MPM, Moreno MJ. Re-Use of Caco-2 Monolayers in Permeability Assays—Validation Regarding Cell Monolayer Integrity. Pharmaceutics. 2021; 13(10):1563. https://doi.org/10.3390/pharmaceutics13101563
Chicago/Turabian StylePires, Cristiana L., Catarina Praça, Patrícia A. T. Martins, Ana L. M. Batista de Carvalho, Lino Ferreira, Maria Paula M. Marques, and Maria João Moreno. 2021. "Re-Use of Caco-2 Monolayers in Permeability Assays—Validation Regarding Cell Monolayer Integrity" Pharmaceutics 13, no. 10: 1563. https://doi.org/10.3390/pharmaceutics13101563
APA StylePires, C. L., Praça, C., Martins, P. A. T., Batista de Carvalho, A. L. M., Ferreira, L., Marques, M. P. M., & Moreno, M. J. (2021). Re-Use of Caco-2 Monolayers in Permeability Assays—Validation Regarding Cell Monolayer Integrity. Pharmaceutics, 13(10), 1563. https://doi.org/10.3390/pharmaceutics13101563