Polypeptide Self-Assembled Nanoparticles as Delivery Systems for Polymyxins B and E

 ,
,  ,
,  and
and 
Abstract
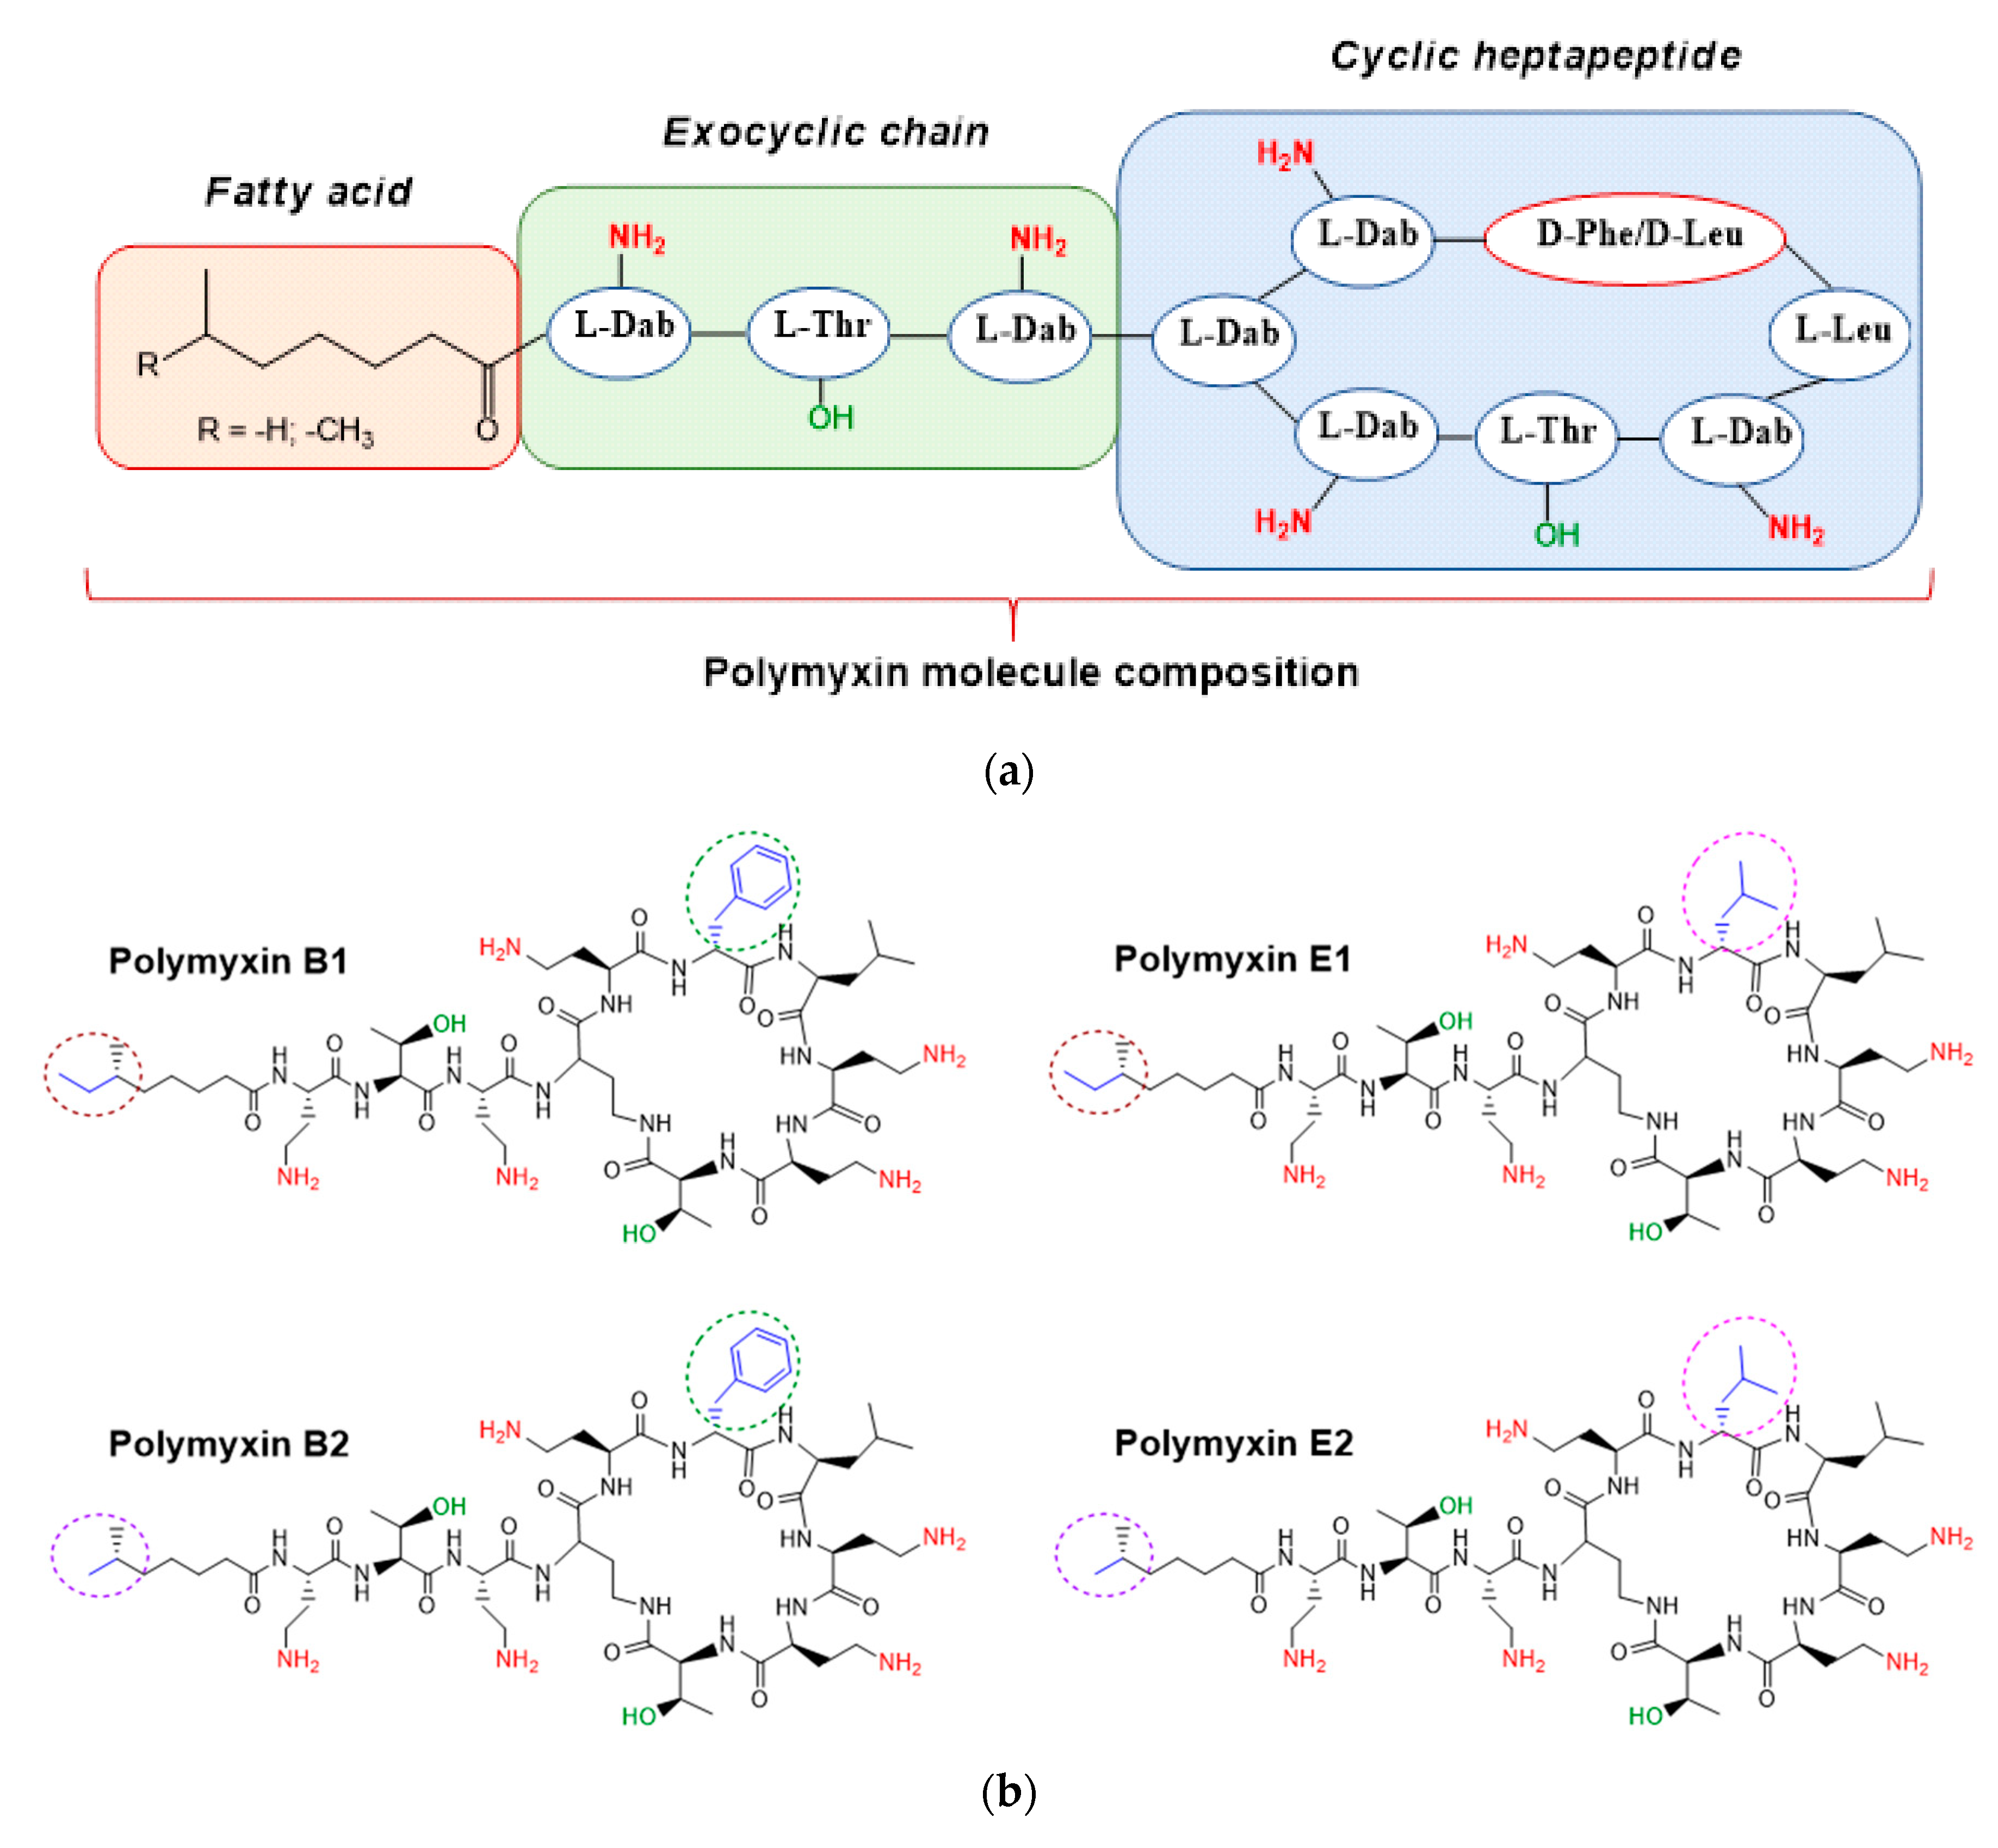
1. Introduction
2. Materials and Methods
2.1. Chemicals and Supplements
2.2. Cell Lines and Bacterial Strain
2.3. Molecular Docking
2.4. Synthesis and Characterization of Polypeptides
2.5. Formation and Characterization of Nanoparticles
2.6. Analysis of Commercial Drug Preparations
2.7. Drug Loading
2.8. Release Study
2.9. Cytotoxicity Study and Uptake by Macrophages
2.10. Antibacterial Activity
2.11. Statistics
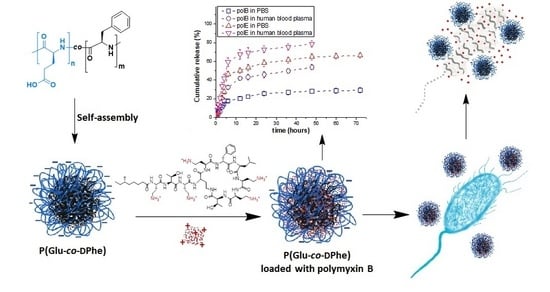
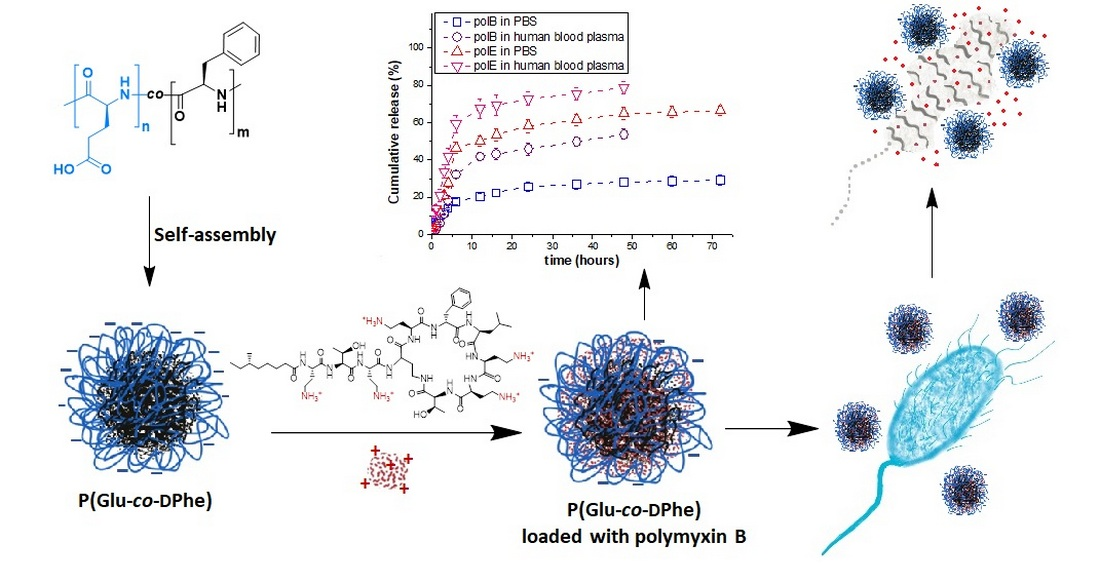
3. Results and Discussion
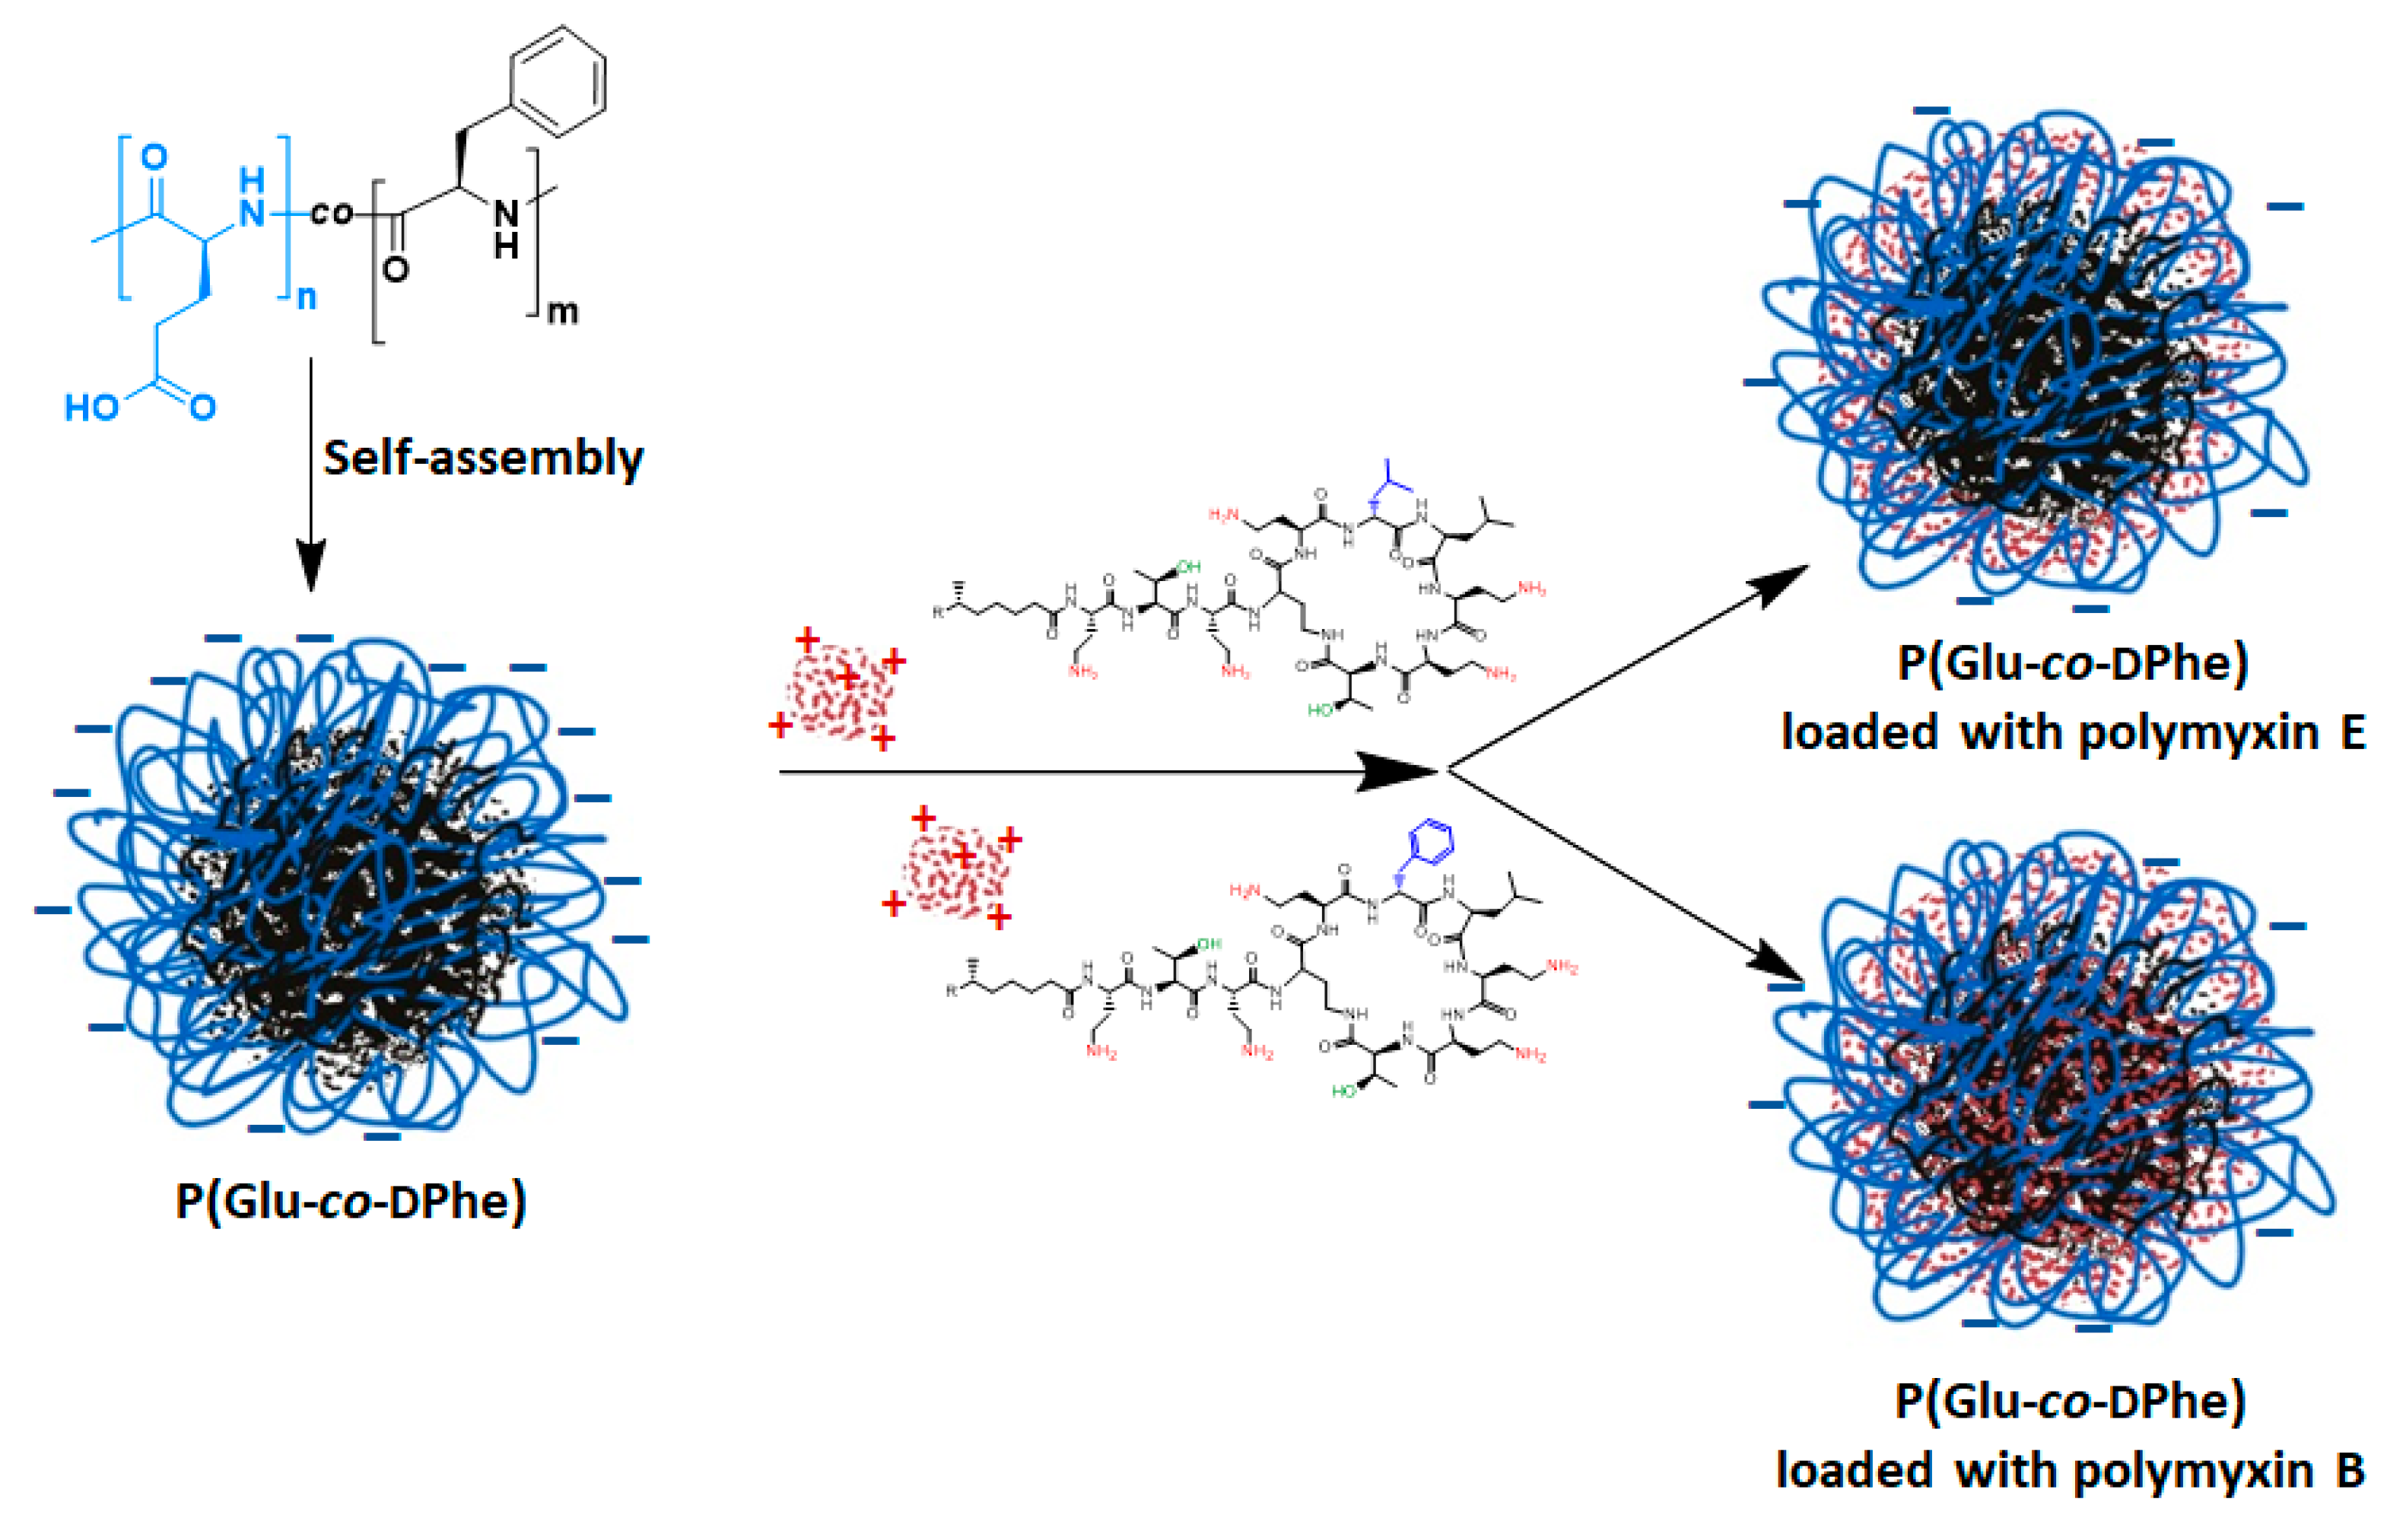
3.1. Synthesis of Polymers
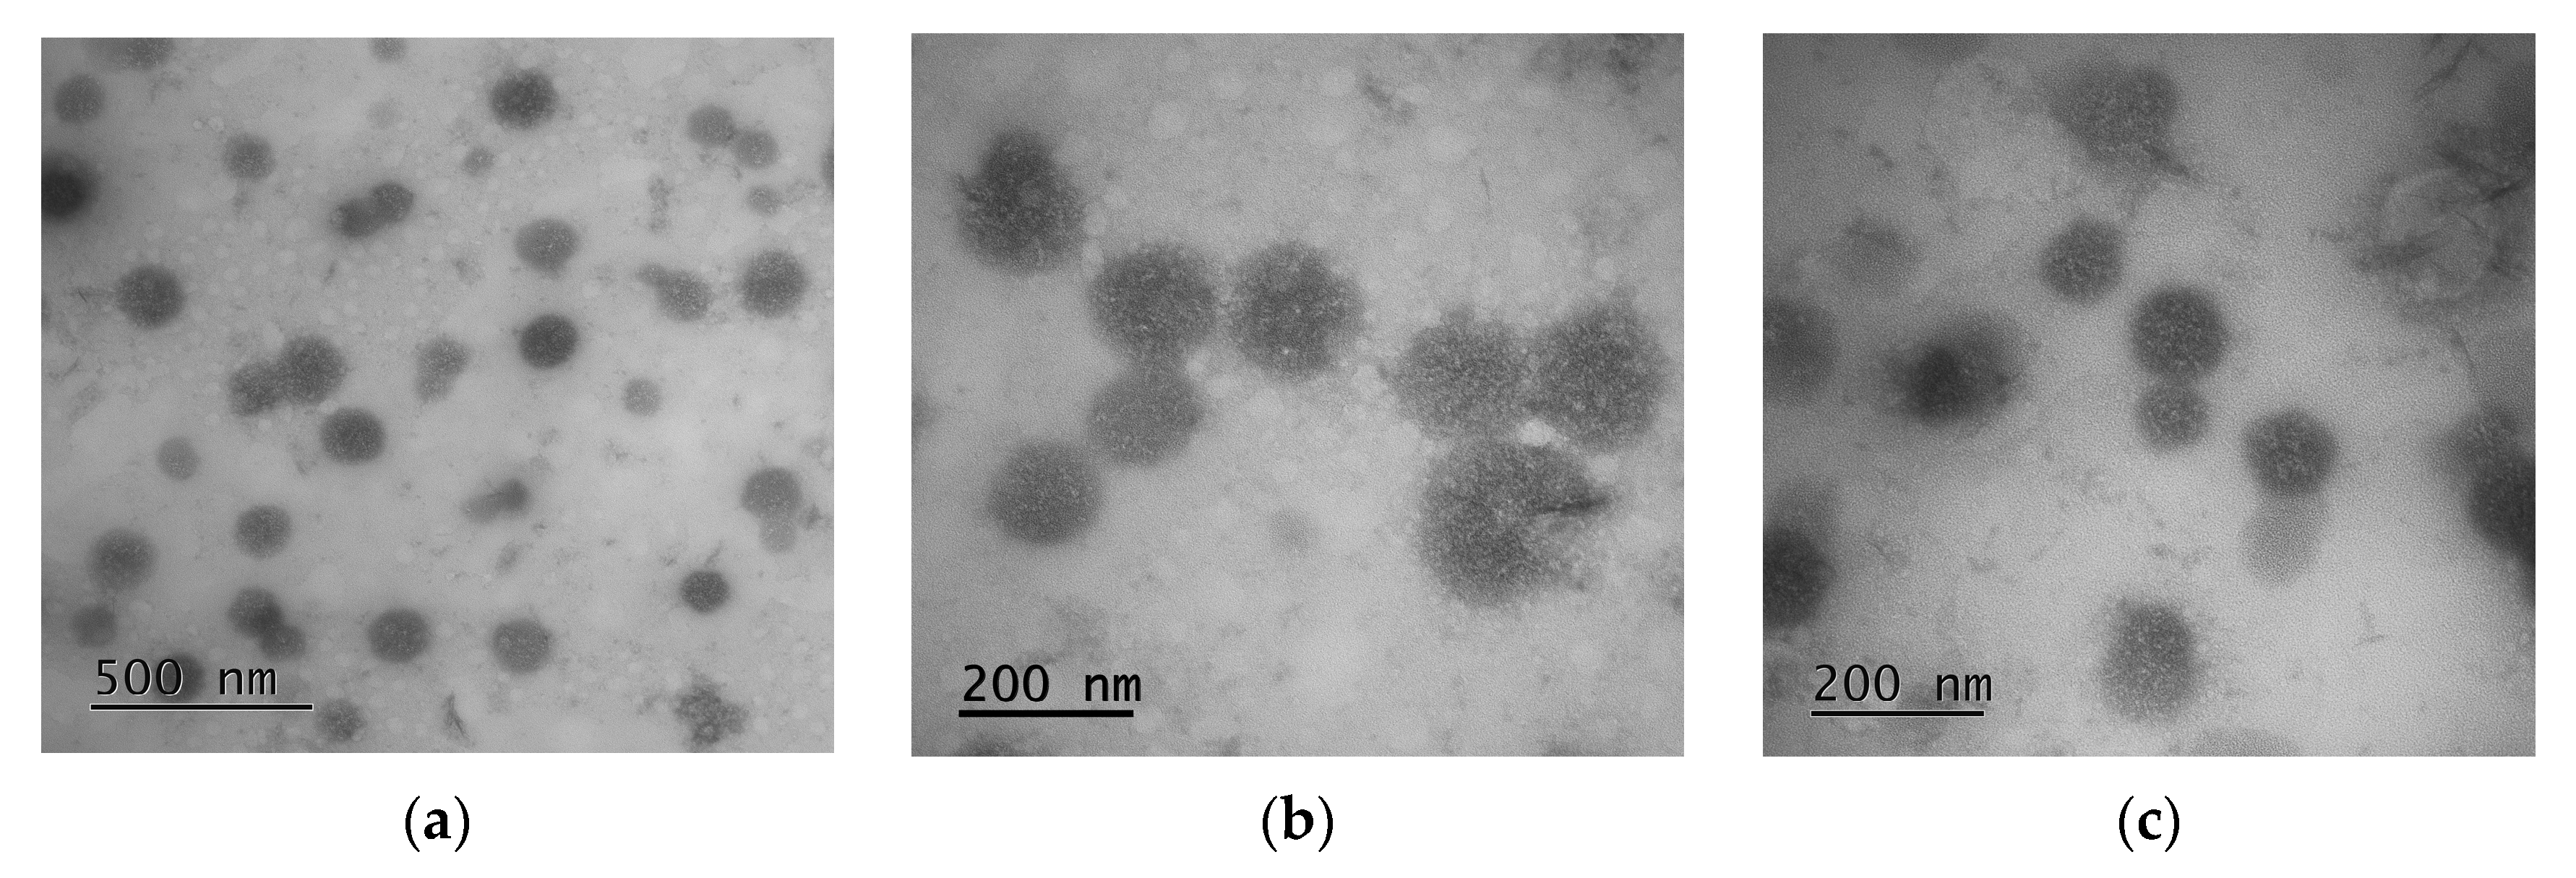
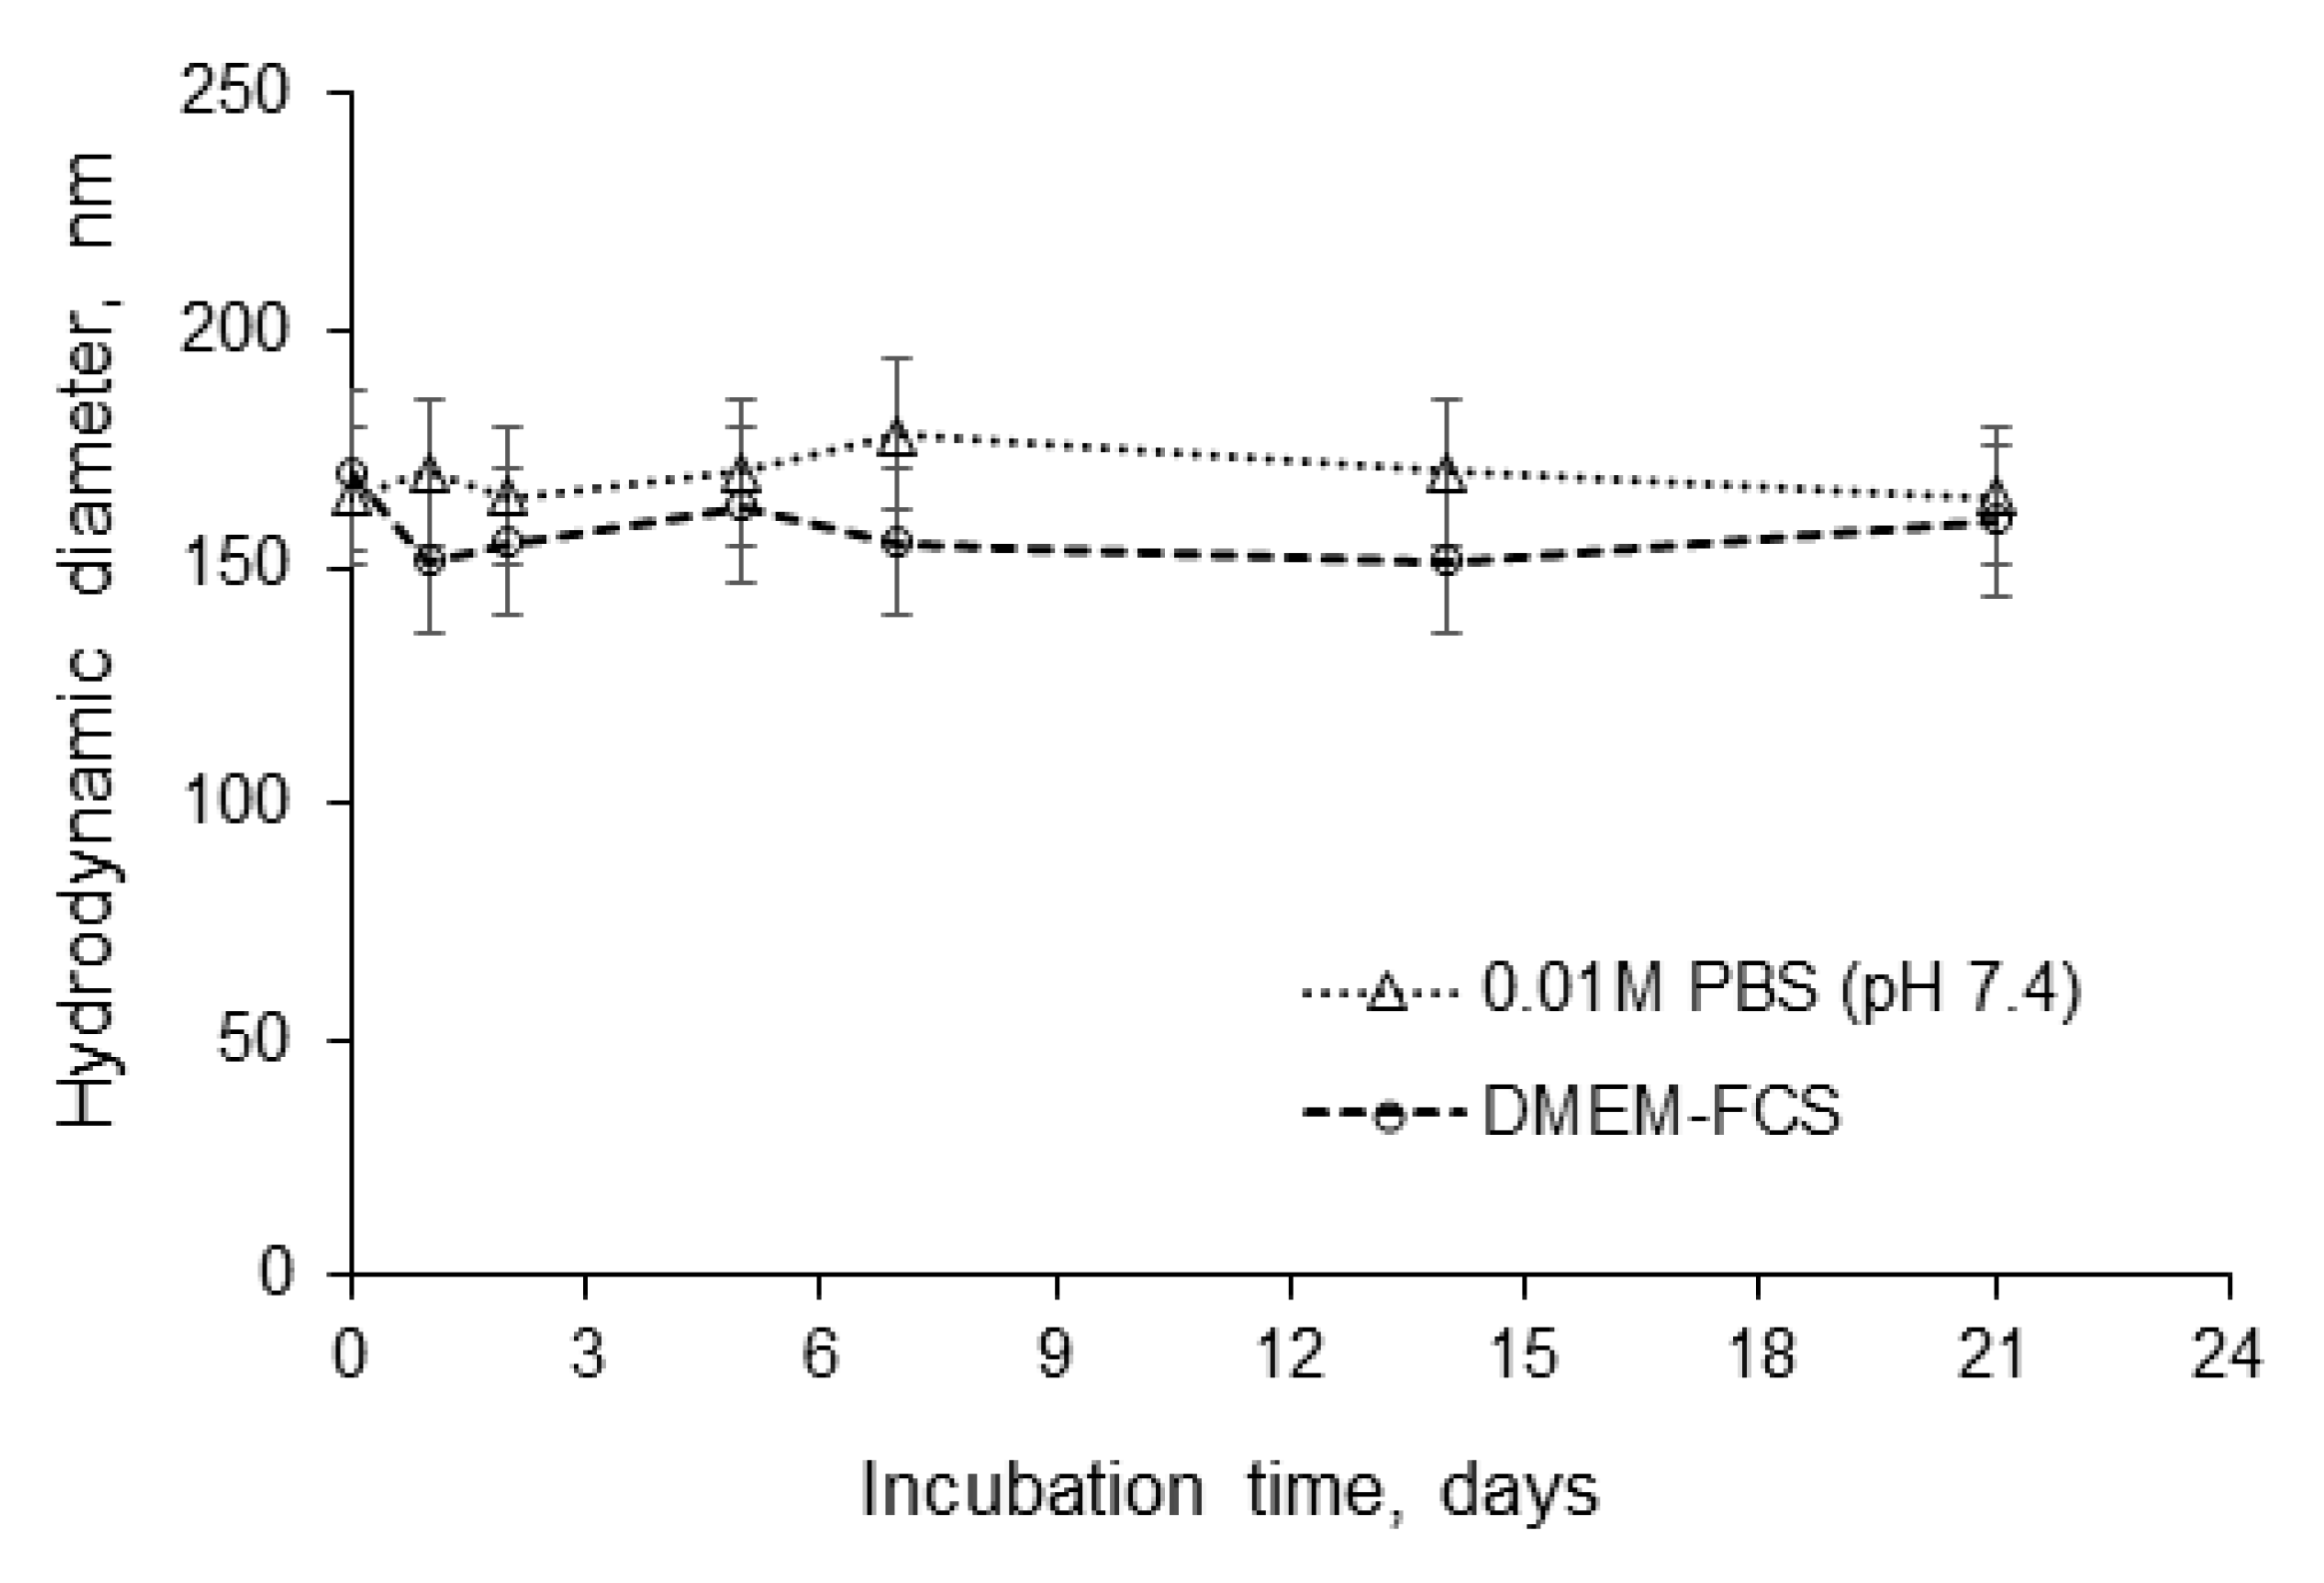
3.2. Formation and Characterization of Nanoparticles
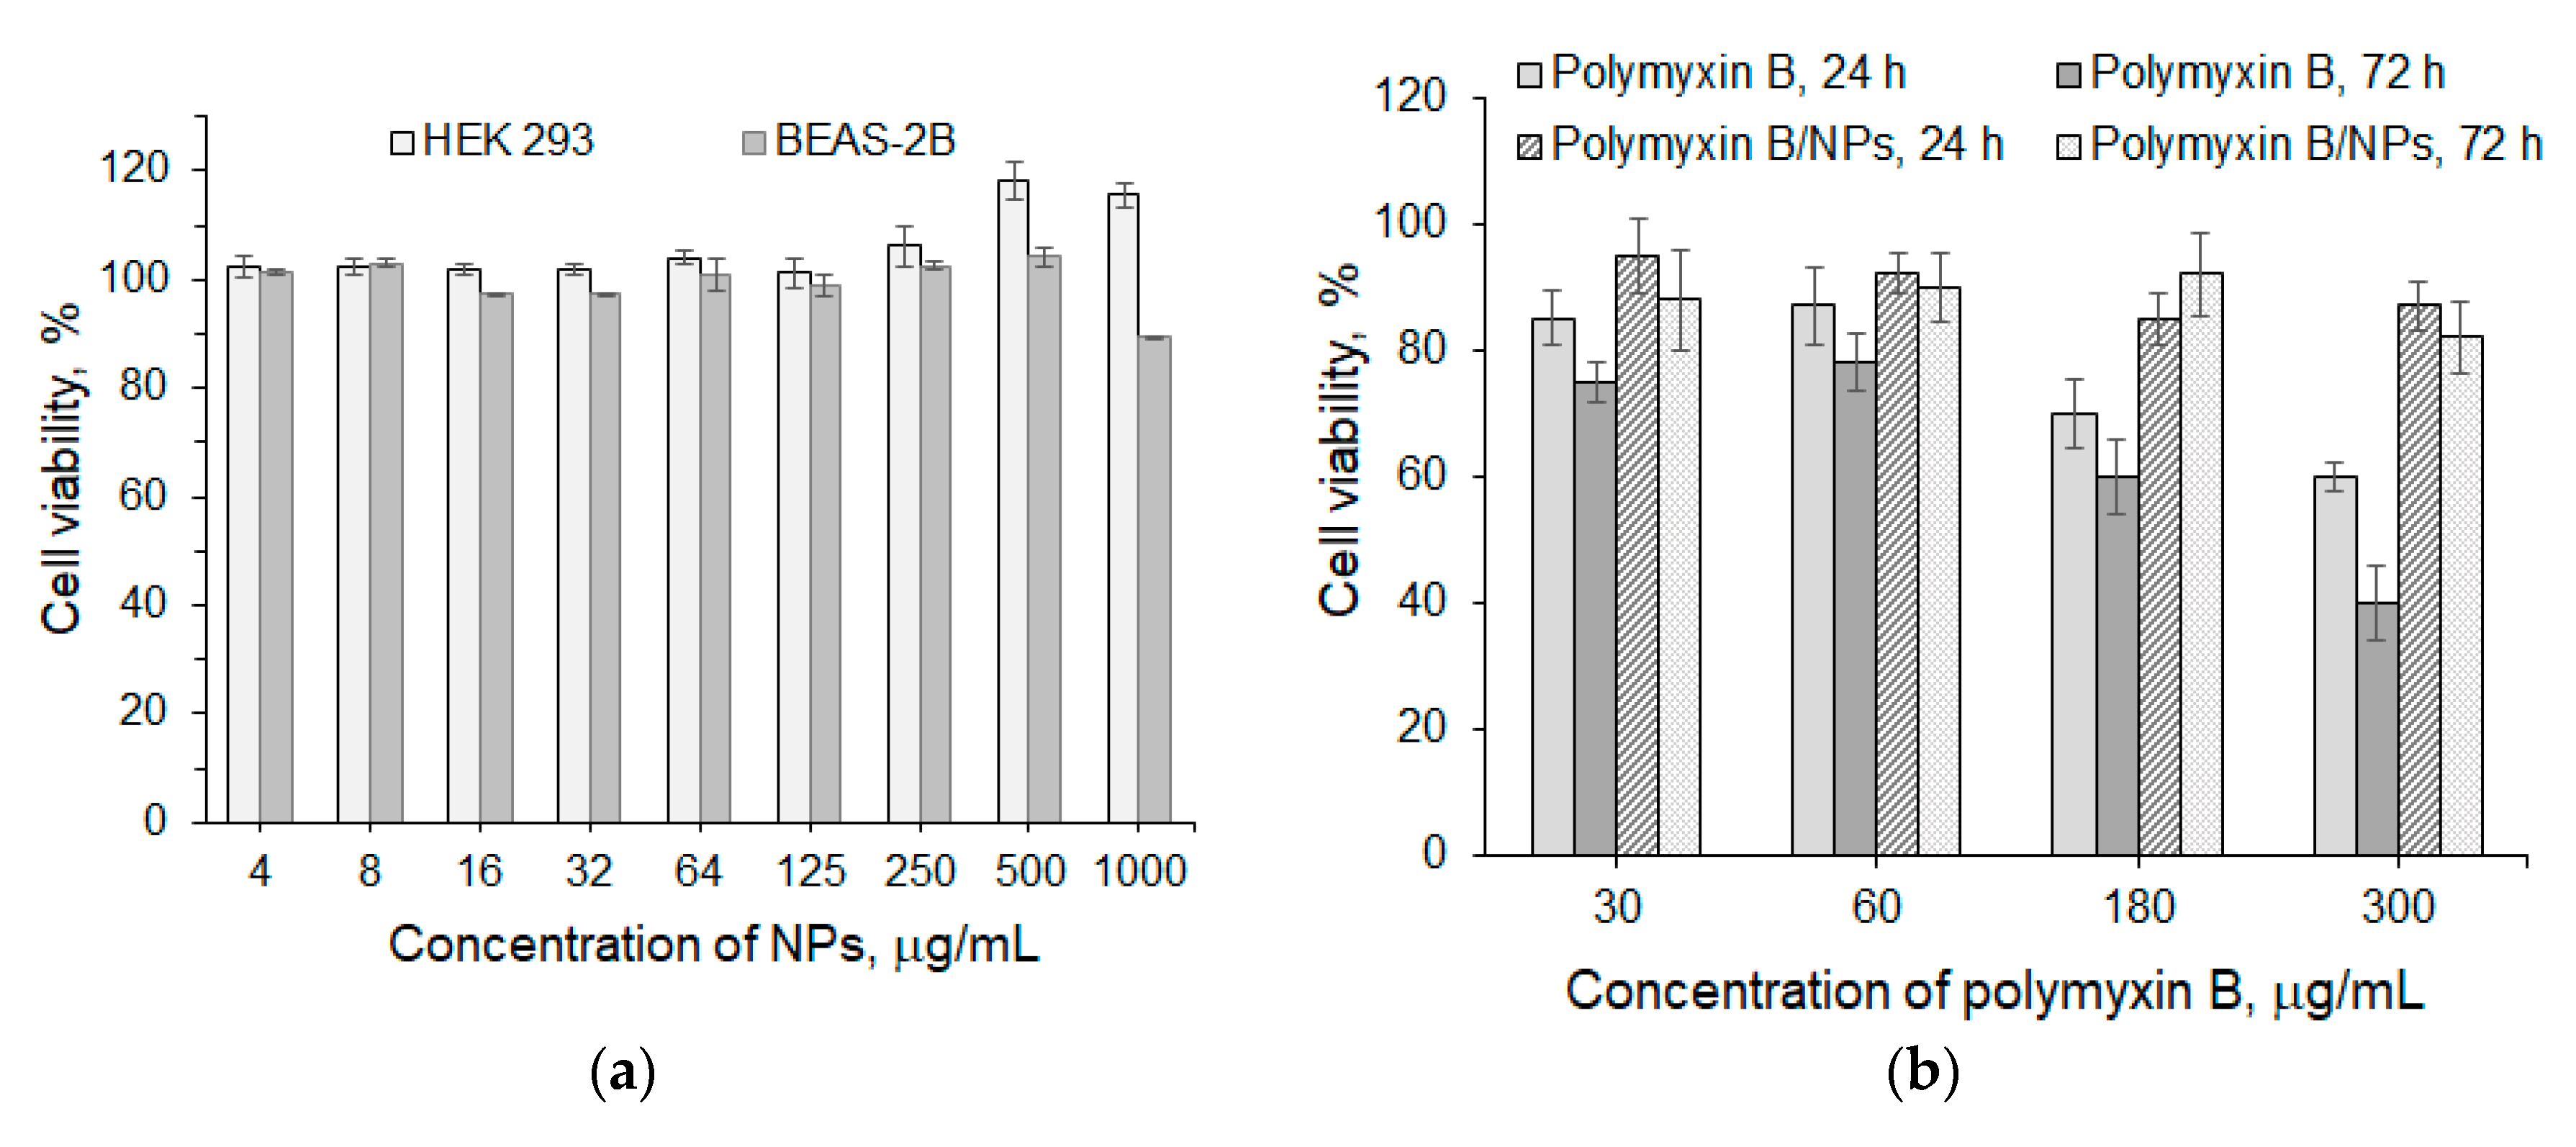
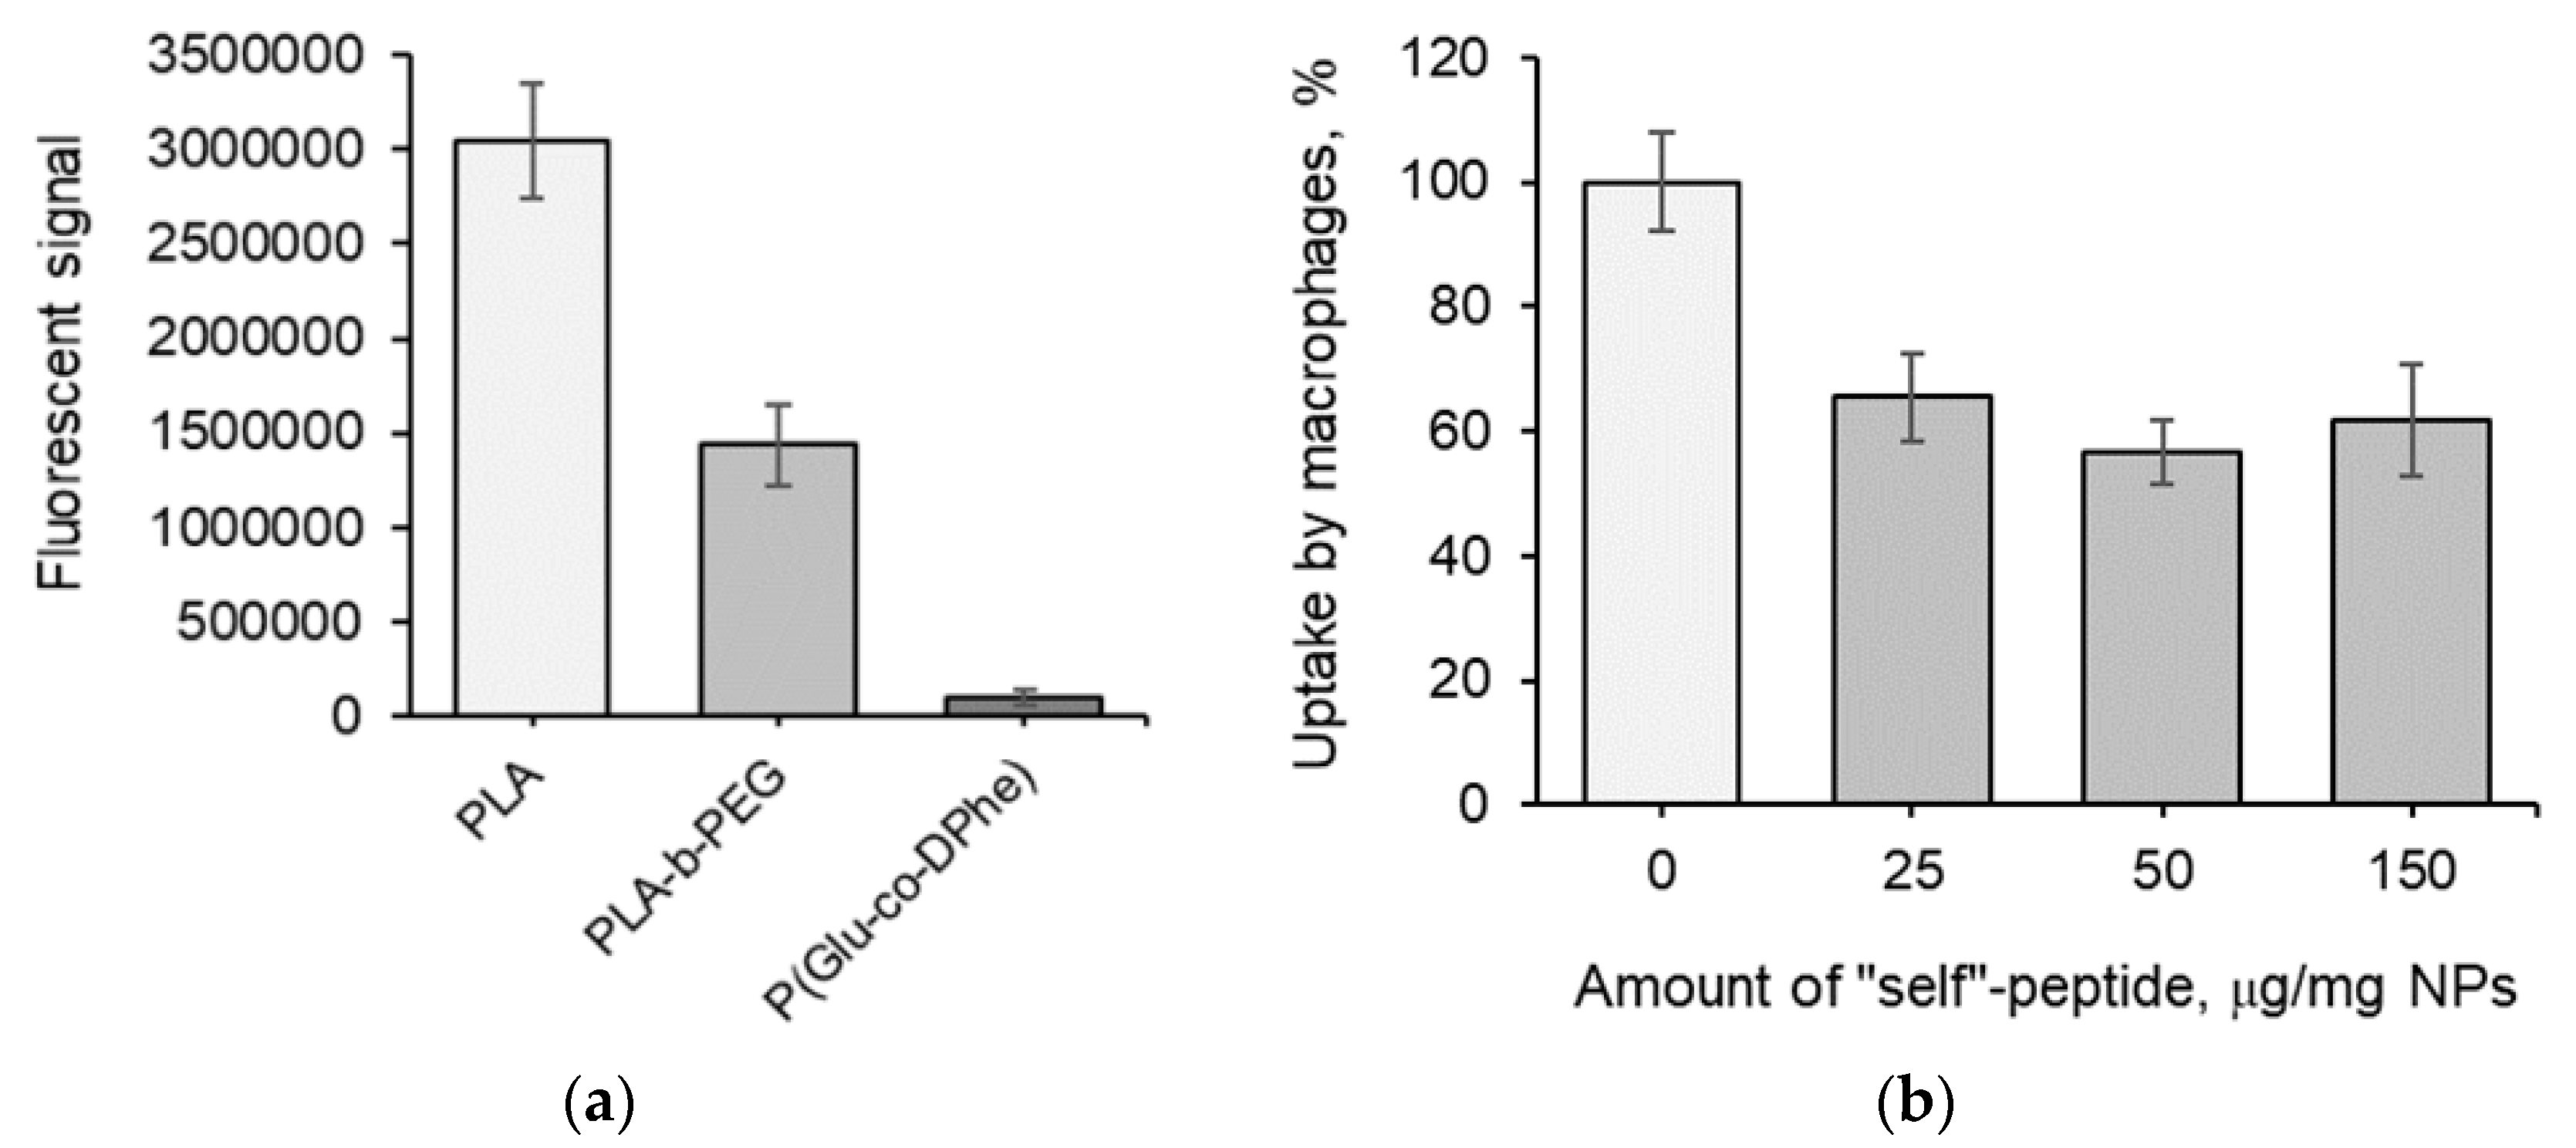
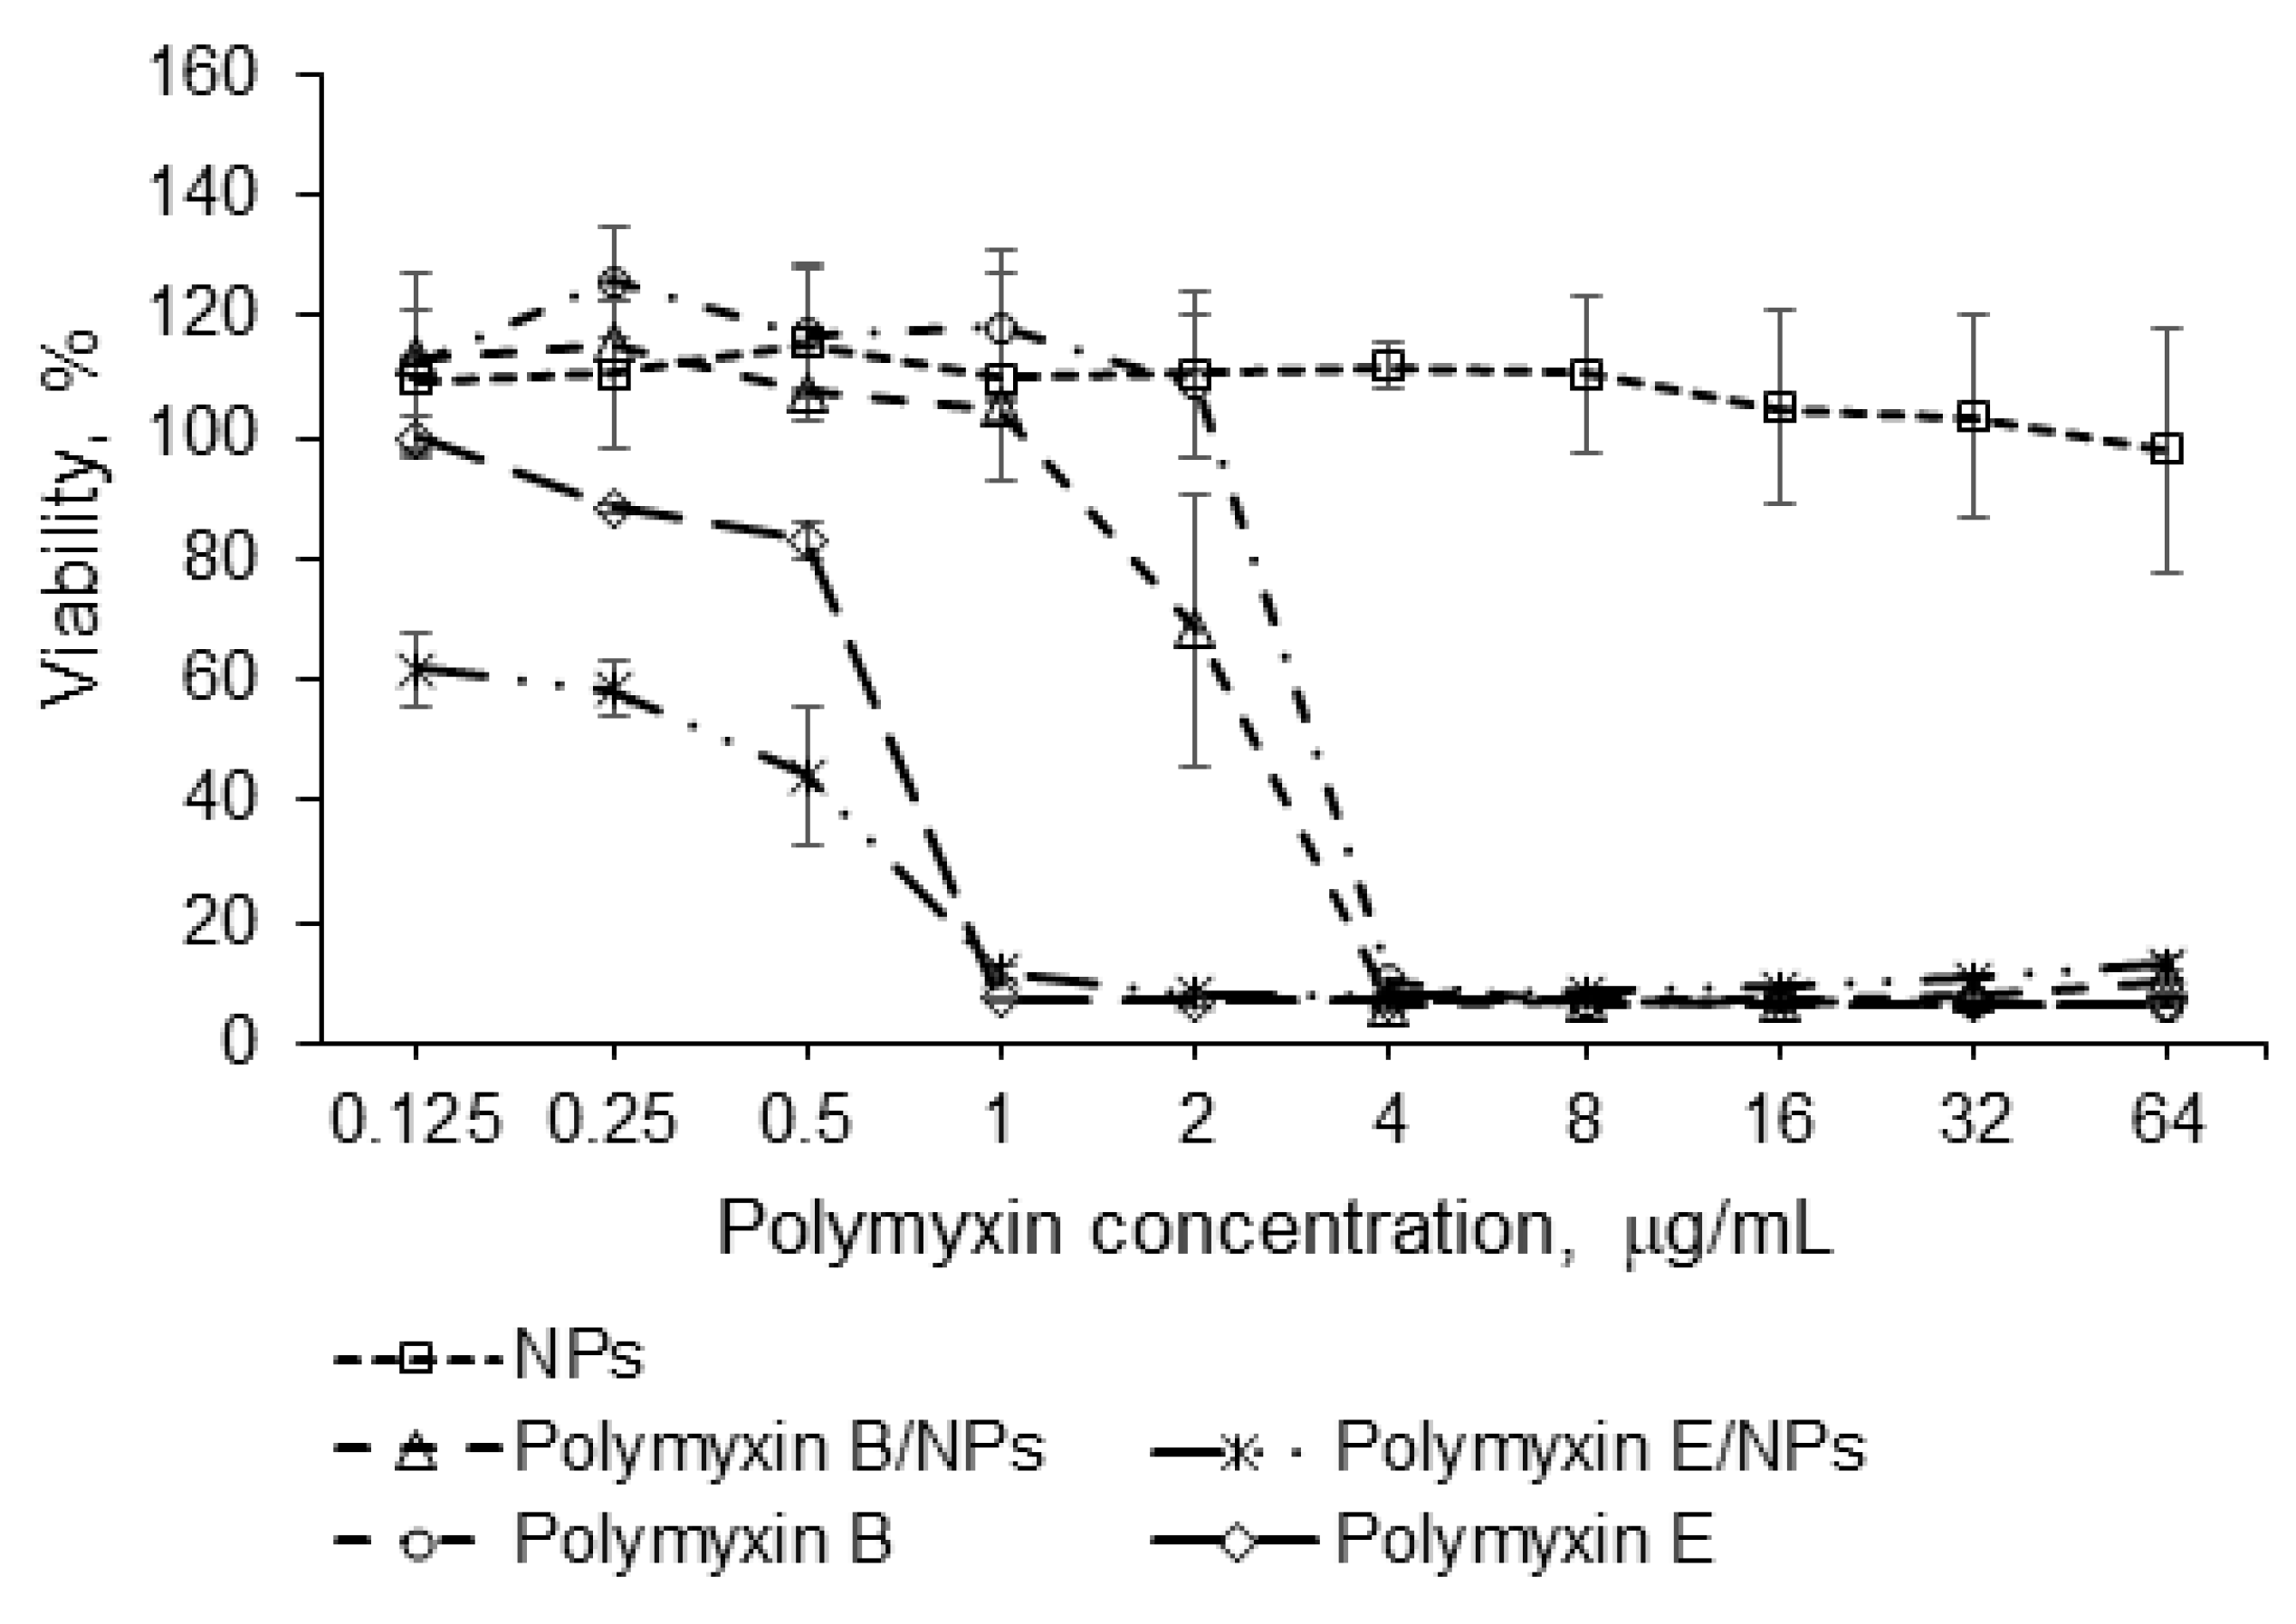
3.3. Biological Evaluation
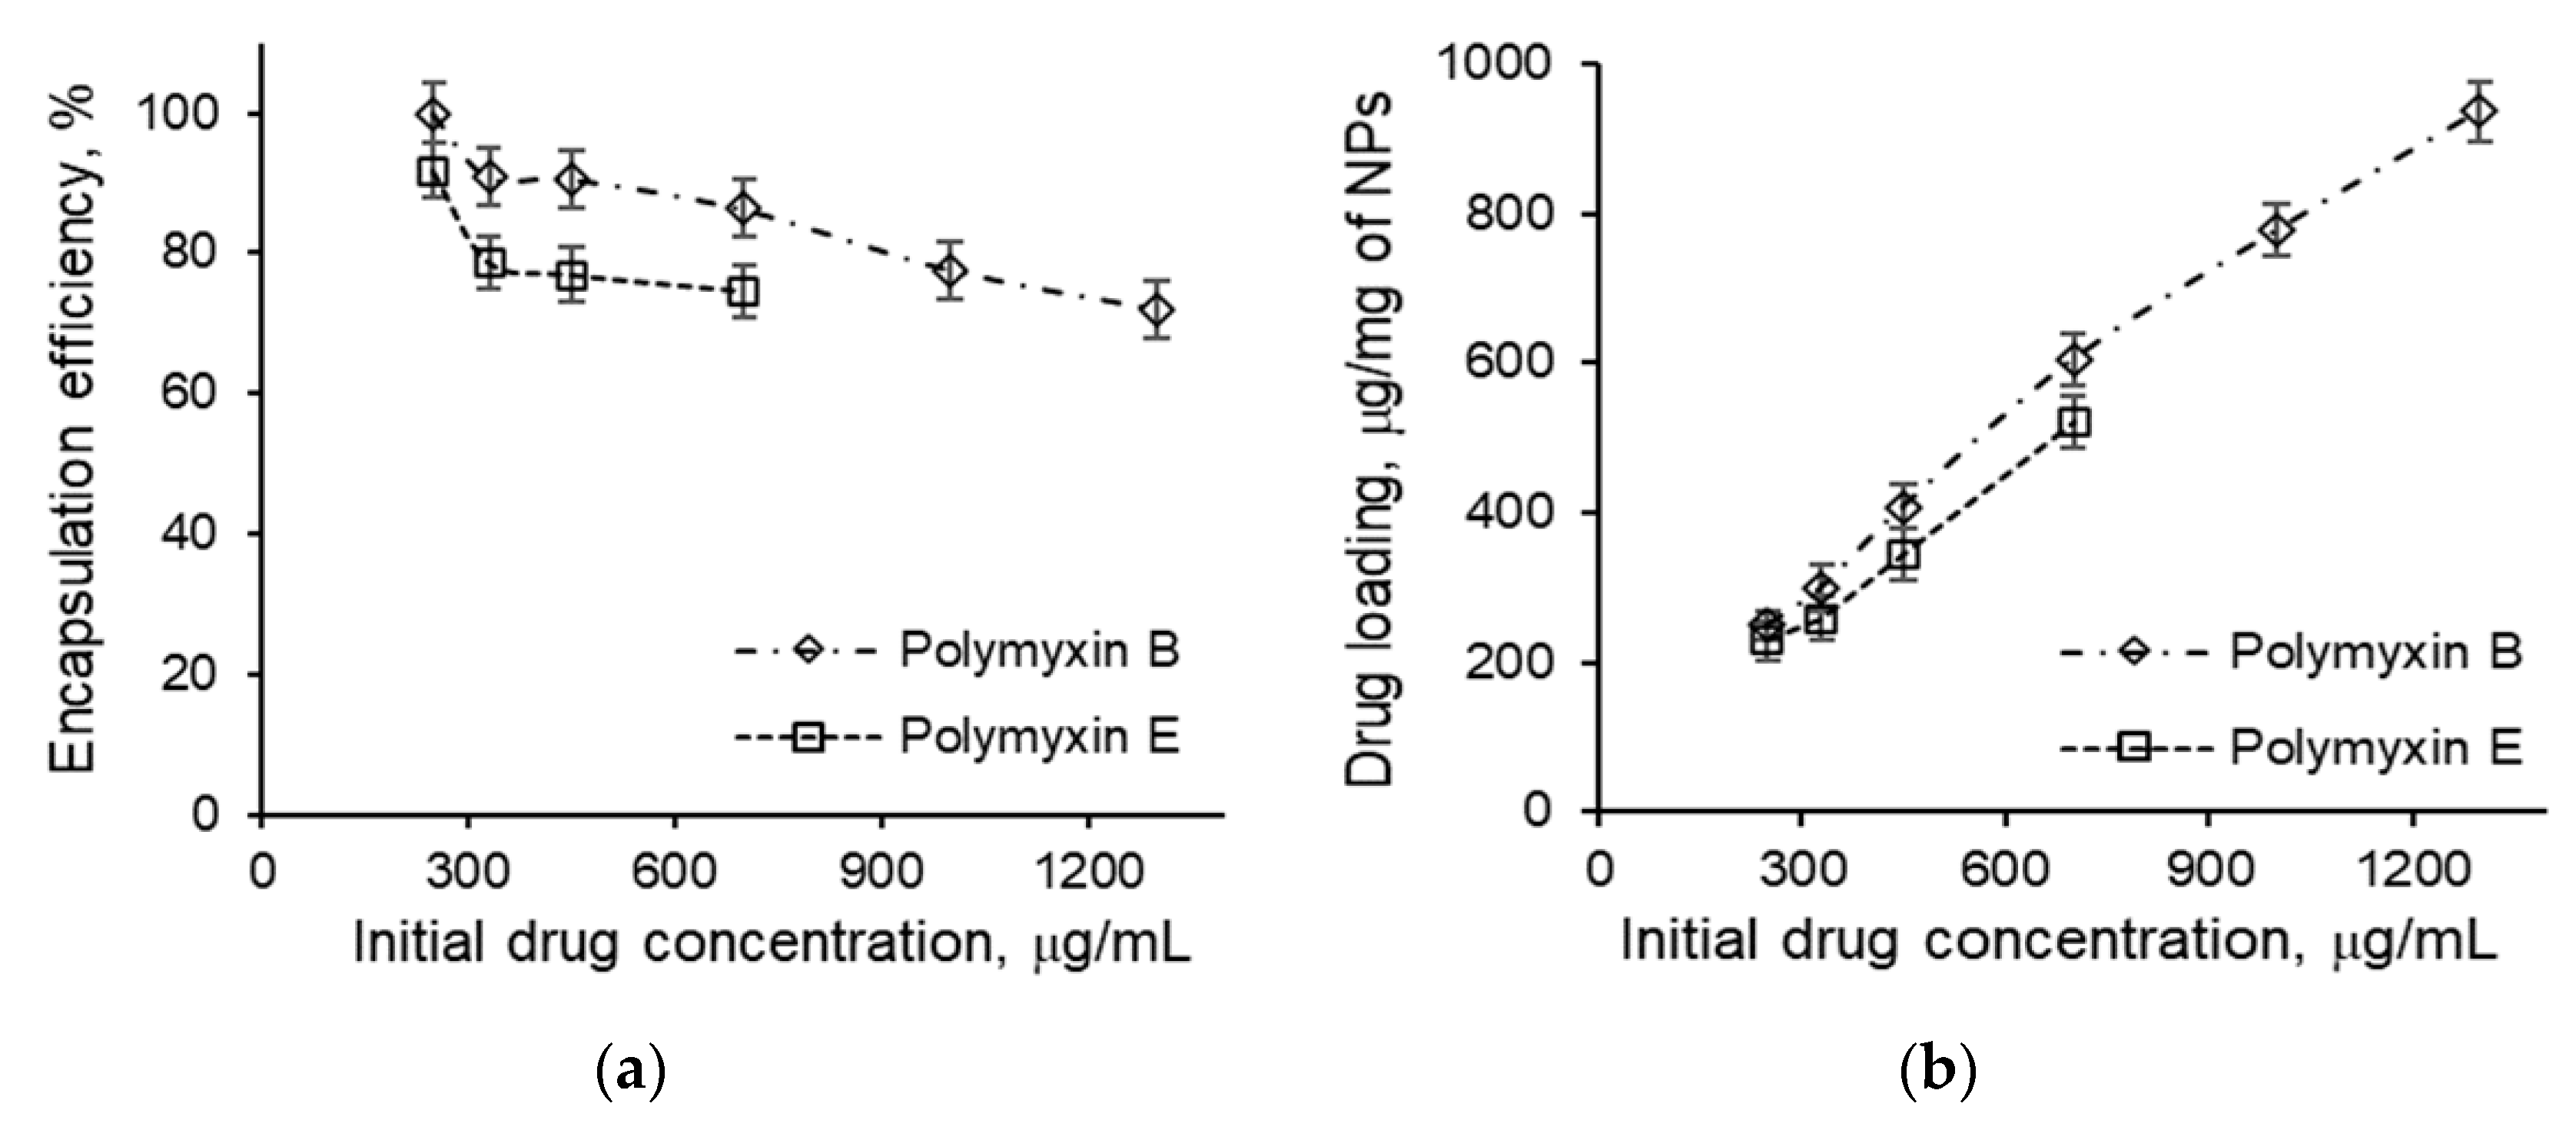
3.4. Loading of Polymyxins into Nanoparticles
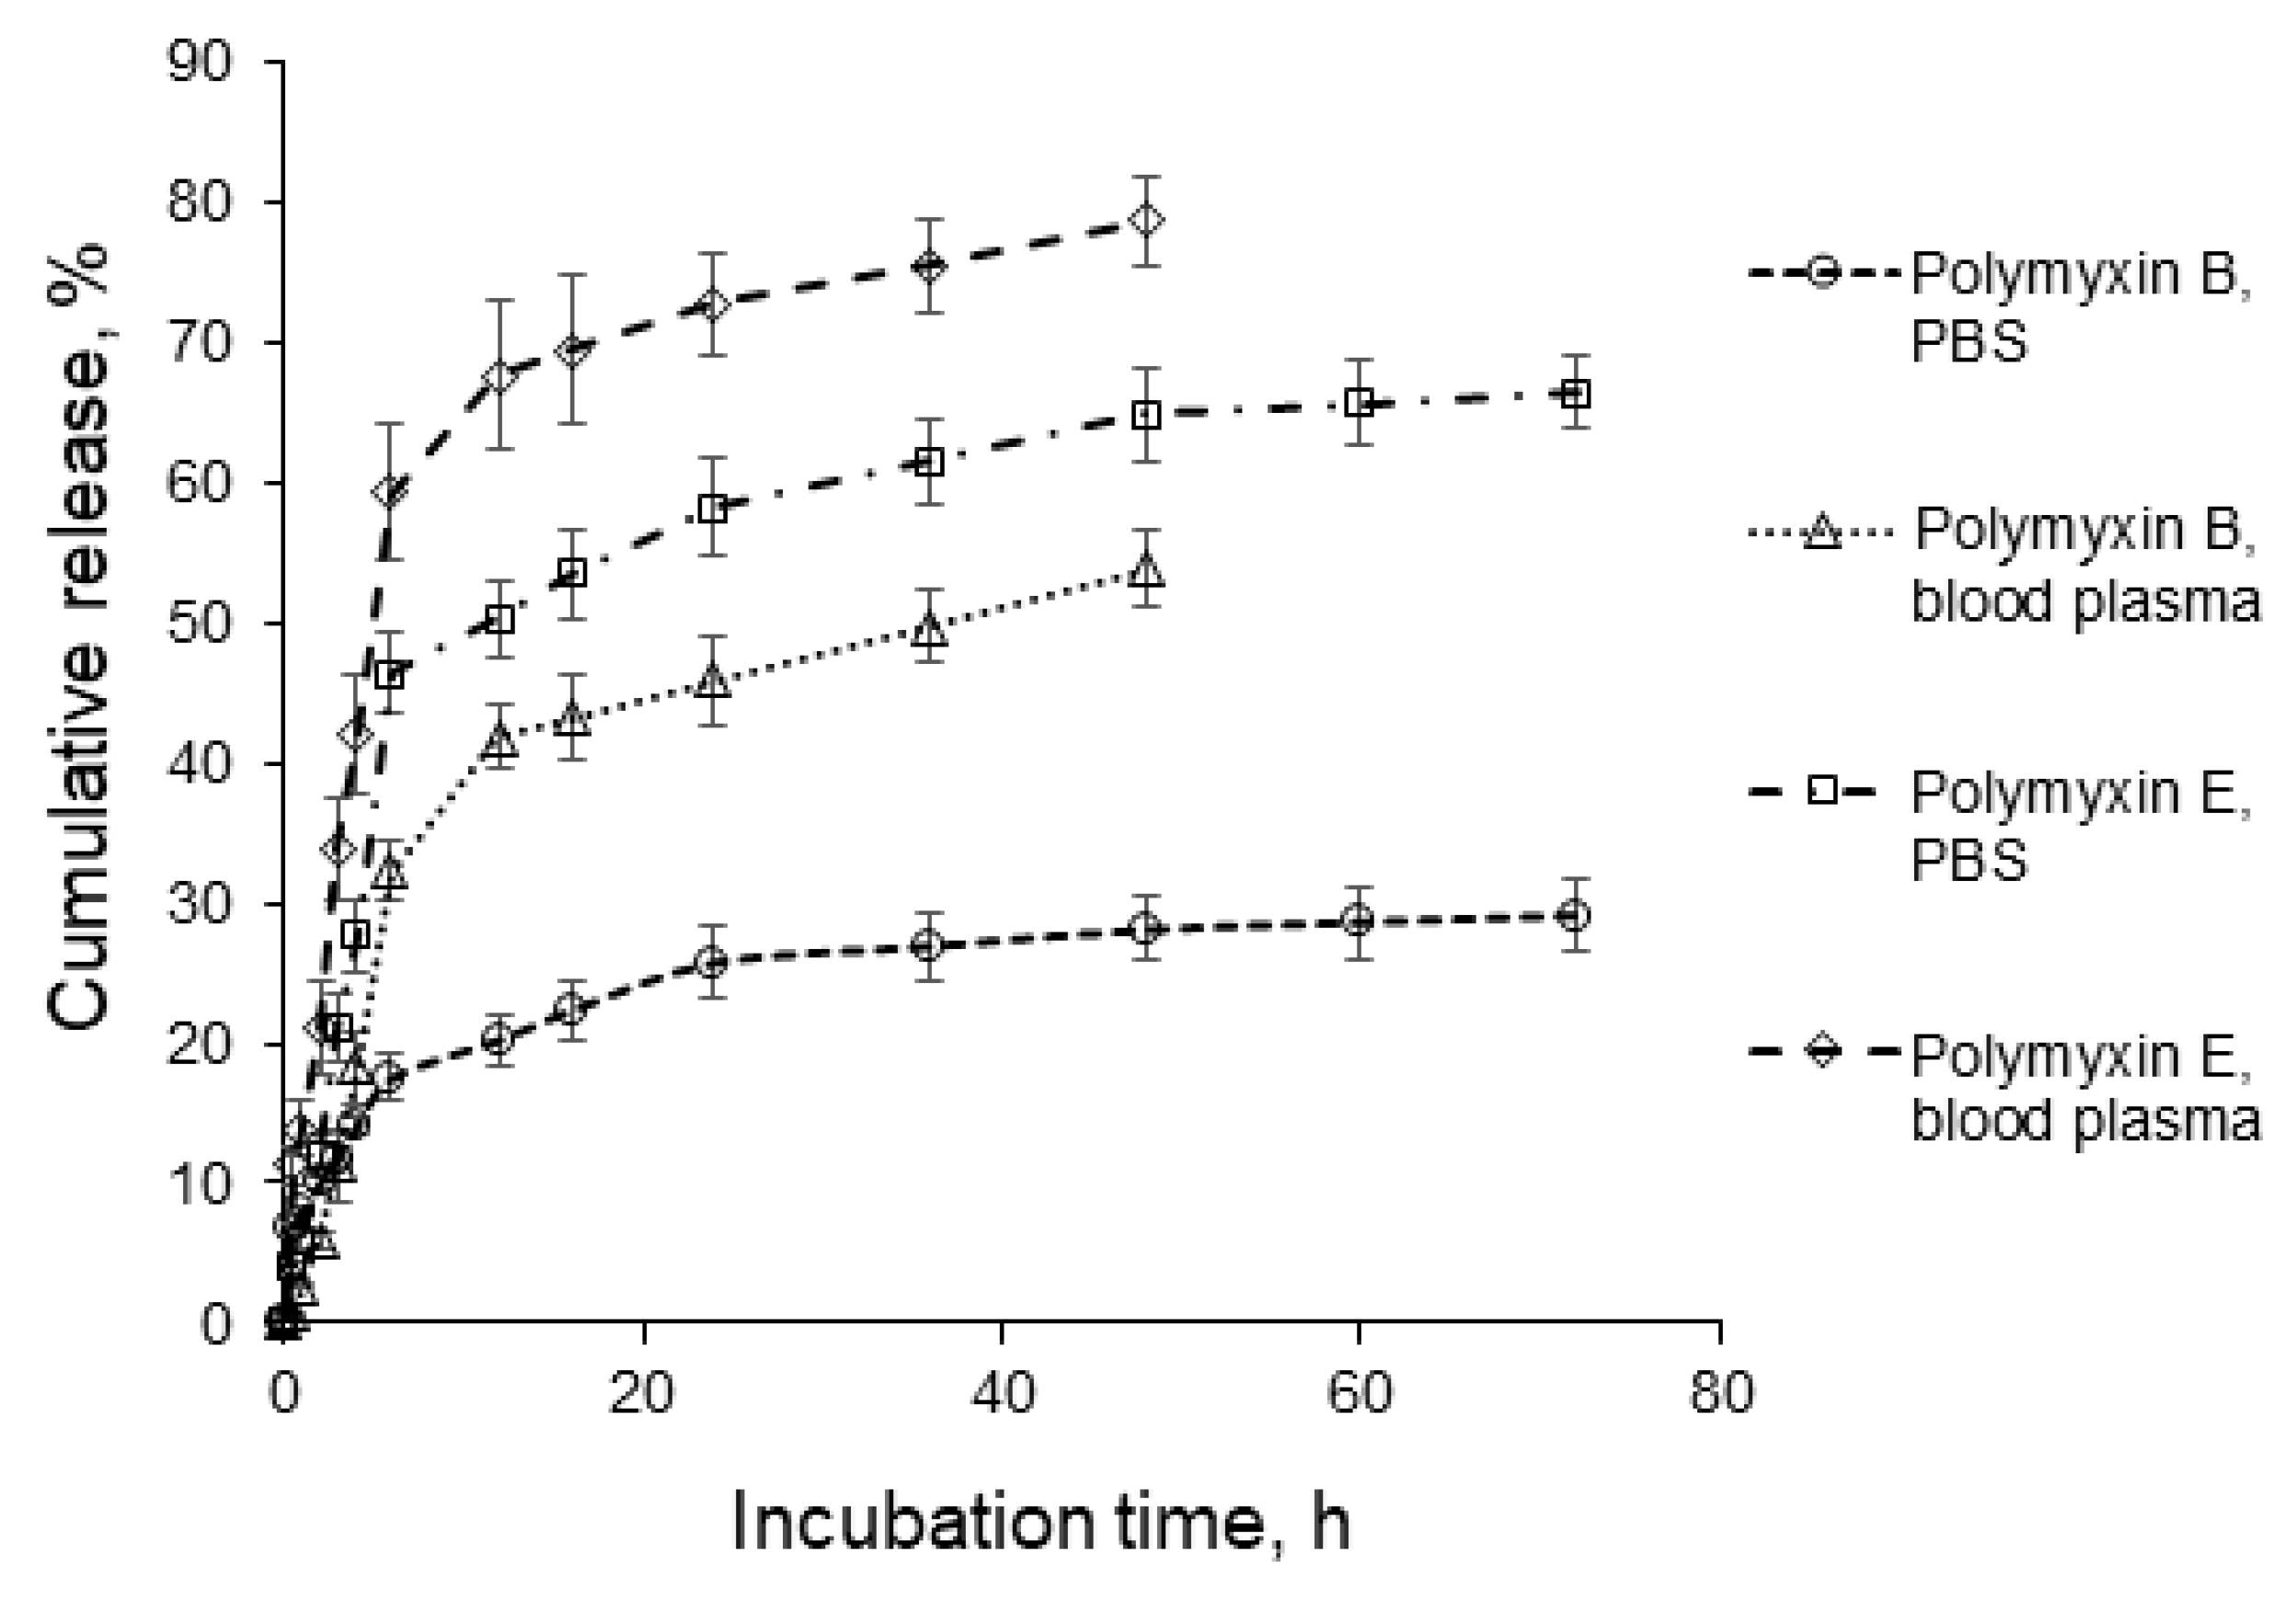
3.5. Polymyxin Release
3.6. Antibacterial Activity
4. Conclusions
Supplementary Materials
Author Contributions
Funding
Acknowledgments
Conflicts of Interest
References
- Practical Antimicrobial Therapeutics. In Veterinary Medicine; Constable, P.D., Hinchcliff, K.W., Done, S.H., Grünberg, W., Eds.; Elsevier: Amsterdam, The Netherlands, 2017; pp. 153–174. [Google Scholar]
- Cai, Y.; Lee, W.; Kwa, A.L. Polymyxin B versus colistin: An update. Expert Rev. Anti-Infect. Ther. 2015, 13, 1481–1497. [Google Scholar] [CrossRef]
- Roberts, K.D.; Azad, M.A.K.; Wang, J.; Horne, A.S.; Thompson, P.E.; Nation, R.L.; Velkov, T.; Li, J. Antimicrobial Activity and Toxicity of the Major Lipopeptide Components of Polymyxin B and Colistin: Last-Line Antibiotics against Multidrug-Resistant Gram-Negative Bacteria. ACS Infect. Dis. 2016, 1, 568–575. [Google Scholar] [CrossRef] [PubMed]
- Velkov, T.; Thompson, P.E.; Nation, R.L.; Li, J. Structure-Activity relationships of polymyxin antibiotics. J. Med. Chem. 2010, 53, 1898–1916. [Google Scholar] [CrossRef]
- Avedissian, S.N.; Liu, J.; Rhodes, N.J.; Lee, A.; Pais, G.M.; Hauser, A.R.; Scheetz, M.H. A review of the clinical pharmacokinetics of polymyxin b. Antibiotics 2019, 8, 31. [Google Scholar] [CrossRef] [PubMed]
- Landman, D.; Georgescu, C.; Martin, D.A.; Quale, J. Polymyxins revisited. Clin. Microbiol. Rev. 2008, 21, 449–465. [Google Scholar] [CrossRef]
- Nation, R.L.; Maria, M.H.; Falci, D.R.; Zavascki, A.P. Polymyxin acute kidney injury: Dosing and other strategies to reduce toxicity. Antibiotics 2019, 8, 24. [Google Scholar] [CrossRef]
- Falagas, M.E.; Kasiakou, S.K. Toxicity of polymyxins: A systematic review of the evidence from old and recent studies. Crit. Care 2006, 10, R27. [Google Scholar] [CrossRef] [PubMed]
- Velkov, T.; Dai, C.; Ciccotosto, G.D.; Cappai, R.; Hoyer, D.; Li, J. Polymyxins for CNS infections: Pharmacology and neurotoxicity. Pharmacol. Ther. 2018, 181, 85–90. [Google Scholar] [CrossRef]
- Dai, C.; Wang, Y.; Sharma, G.; Shen, J.; Velkov, T.; Xiao, X. Polymyxins–Curcumin combination antimicrobial therapy: Safety implications and efficacy for infection treatment. Antioxidants 2020, 9, 506. [Google Scholar] [CrossRef]
- Velkov, T.; Roberts, K.D.; Nation, R.L.; Thompson, P.E.; Li, J. Pharmacology of polymyxins: New insights into an ‘old’ class of antibiotics. Future Microbiol. 2013, 8, 711–724. [Google Scholar] [CrossRef]
- Falagas, M.E.; Kasiakou, S.K.; Saravolatz, L.D. Colistin: The Revival of Polymyxins for the Management of Multidrug-Resistant Gram-Negative Bacterial Infections. Clin. Infect. Dis. 2005, 40, 1333–1341. [Google Scholar] [CrossRef] [PubMed]
- Cassir, N.; Rolain, J.M.; Brouqui, P. A new strategy to fight antimicrobial resistance: The revival of old antibiotics. Front. Microbiol. 2014, 5, 551. [Google Scholar] [CrossRef] [PubMed]
- Allen, T.M.; Cullis, P.R. Liposomal drug delivery systems: From concept to clinical applications. Adv. Drug Deliv. Rev. 2013, 65, 36–48. [Google Scholar] [CrossRef]
- Casciaro, B.; D’Angelo, I.; Zhang, X.; Loffredo, M.R.; Conte, G.; Cappiello, F.; Quaglia, F.; Di, Y.P.P.; Ungaro, F.; Mangoni, M.L. Poly(lactide-co-glycolide) Nanoparticles for Prolonged Therapeutic Efficacy of Esculentin-1a-Derived Antimicrobial Peptides against Pseudomonas aeruginosa Lung Infection: In Vitro and in Vivo Studies. Biomacromolecules 2019, 20, 1876–1888. [Google Scholar] [CrossRef]
- Vijayan, A.; James, P.P.; Nanditha, C.K.; Vinod Kumar, G.S. Multiple cargo deliveries of growth factors and antimicrobial peptide using biodegradable nanopolymer as a potential wound healing system. Int. J. Nanomed. 2019, 14, 2253–2263. [Google Scholar] [CrossRef]
- Almaaytah, A.; Mohammed, G.K.; Abualhaijaa, A.; Al-Balas, Q. Development of novel ultrashort antimicrobial peptide nanoparticles with potent antimicrobial and antibiofilm activities against multidrug-resistant bacteria. Drug Des. Dev. 2017, 11, 3159–3170. [Google Scholar] [CrossRef] [PubMed]
- Nordström, R.; Nyström, L.; Andrén, O.C.J.; Malkoch, M.; Umerska, A.; Davoudi, M.; Schmidtchen, A.; Malmsten, M. Membrane interactions of microgels as carriers of antimicrobial peptides. J. Colloid Interface Sci. 2018, 513, 141–150. [Google Scholar] [CrossRef]
- Martin-Serrano, Á.; Gómez, R.; Ortega, P.; Mata, F.J.D. La Nanosystems as vehicles for the delivery of antimicrobial peptides (Amps). Pharmaceutics 2019, 11, 448. [Google Scholar] [CrossRef]
- Bolhassani, A. Improvements in chemical carriers of proteins and peptides. Cell Biol. Int. 2019, 43, 437–452. [Google Scholar] [CrossRef]
- Dubashynskaya, N.V.; Skorik, Y.A. Polymyxin Delivery Systems: Recent Advances and Challenges. Pharmaceuticals 2020, 13, 83. [Google Scholar] [CrossRef]
- Trafny, E.A.; Antos-Bielska, M.; Grzybowski, J. Antibacterial activity of liposome-encapsulated antibiotics against Pseudomonas aeruginosa attached to the matrix of human dermis. J. Microencapsul. 1999, 16, 419–429. [Google Scholar] [PubMed]
- Desai, T.R.; Tyrrell, G.J.; Ng, T.; Finlay, W.H. In Vitro Evaluation of Nebulization Properties, Antimicrobial Activity, and Regional Airway Surface Liquid Concentration of Liposomal Polymyxin B Sulfate. Pharm. Res. 2003, 20, 442–447. [Google Scholar] [CrossRef] [PubMed]
- Wallace, S.J.; Li, J.; Nation, R.L.; Prankerd, R.J.; Boyd, B.J. Interaction of Colistin and Colistin Methanesulfonate with Liposomes: Colloidal Aspects and Implications for Formulation. J. Pharm. Sci. 2012, 101, 3347–3359. [Google Scholar] [CrossRef] [PubMed]
- Wang, S.; Yu, S.; Lin, Y.; Zou, P.; Chai, G.; Yu, H.H.; Wickremasinghe, H.; Shetty, N.; Ling, J.; Li, J.; et al. Co-Delivery of Ciprofloxacin and Colistin in Liposomal Formulations with Enhanced in Vitro Antimicrobial Activities against Multidrug Resistant Pseudomonas aeruginosa. Pharm. Res. 2018, 35, 1–31. [Google Scholar] [CrossRef]
- Moreno-Sastre, M.; Pastor, M.; Esquisabel, A.; Sans, E.; Viñas, M.; Bachiller, D.; Pedraz, J.L. Stability study of sodium colistimethate-loaded lipid nanoparticles. J. Microencapsul. 2016, 33, 636–645. [Google Scholar] [CrossRef]
- Severino, P.; Silveira, E.F.; Loureiro, K.; Chaud, M.V.; Antonini, D.; Lancellotti, M.; Sarmento, V.H.; da Silva, C.F.; Santana, M.H.A.; Souto, E.B. Antimicrobial activity of polymyxin-loaded solid lipid nanoparticles (PLX-SLN): Characterization of physicochemical properties and in vitro efficacy. Eur. J. Pharm. Sci. 2017, 106, 177–184. [Google Scholar] [CrossRef]
- Severino, P.; Chaud, M.V.; Shimojo, A.; Antonini, D.; Lancelloti, M.; Santana, M.H.A.; Souto, E.B. Sodium alginate-cross-linked polymyxin B sulphate-loaded solid lipid nanoparticles: Antibiotic resistance tests and HaCat and NIH/3T3 cell viability studies. Colloids Surf. B Biointerfaces 2015, 129, 191–197. [Google Scholar] [CrossRef]
- Costa, J.S.R.; Medeiros, M.; Yamashiro-Kanashiro, E.H.; Rocha, M.C.; Cotrim, P.C.; Stephano, M.A.; Lancellotti, M.; Tavares, G.D.; Oliveira-Nascimento, L. Biodegradable nanocarriers coated with polymyxin b: Evaluation of leishmanicidal and antibacterial potential. PLoS Negl. Trop. Dis. 2019, 13, e0007388. [Google Scholar]
- Zhang, X.; Guo, R.; Xu, J.; Lan, Y.; Jiao, Y.; Zhou, C.; Zhao, Y. Poly(l-lactide)/halloysite nanotube electrospun mats as dual-drug delivery systems and their therapeutic efficacy in infected full-thickness burns. J. Biomater. Appl. 2015, 30, 512–525. [Google Scholar] [CrossRef]
- Coppi, G.; Iannuccelli, V.; Sala, N.; Bondi, M. Alginate microparticles for Polymyxin B Peyer’s patches uptake: Microparticles for antibiotic oral administration. J. Microencapsul. 2004, 21, 829–839. [Google Scholar] [CrossRef]
- Coppi, G.; Montanari, M.; Rossi, T.; Bondi, M.; Iannuccelli, V. Cellular uptake and toxicity of microparticles in a perspective of polymyxin B oral administration. Int. J. Pharm. 2010, 385, 42–46. [Google Scholar] [CrossRef] [PubMed]
- Liu, Y.H.; Kuo, S.C.; Yao, B.Y.; Fang, Z.S.; Lee, Y.T.; Chang, Y.C.; Chen, T.L.; Hu, C.M.J. Colistin nanoparticle assembly by coacervate complexation with polyanionic peptides for treating drug-resistant gram-negative bacteria. Acta Biomater. 2018, 82, 133–142. [Google Scholar] [CrossRef] [PubMed]
- Rodriguez, P.L.; Harada, T.; Christian, D.A.; Pantano, D.A.; Tsai, R.K.; Discher, D.E. Minimal “Self” Peptides That Inhibit Phagocytic Clearance and Enhance Delivery of Nanoparticles. Science 2013, 339, 971–975. [Google Scholar] [CrossRef] [PubMed]
- Wilder, R.; Mobashery, S. The use of triphosgene in preparation of N-carboxy-α-amino acid anhydrides. J. Org. Chem. 1992, 57, 2755–2756. [Google Scholar] [CrossRef]
- Osipova, O.; Sharoyko, V.; Zashikhina, N.; Zakharova, N.; Tennikova, T.; Urtti, A.; Korzhikova-Vlakh, E. Amphiphilic polypeptides for VEGF siRNA delivery into retinal epithelial cells. Pharmaceutics 2020, 12, 39. [Google Scholar] [CrossRef] [PubMed]
- Zashikhina, N.; Sharoyko, V.; Antipchik, M.; Tarasenko, I.; Anufrikov, Y.; Lavrentieva, A.; Tennikova, T.; Korzhikova-Vlakh, E. Novel Formulations of C-Peptide with Long-Acting Therapeutic Potential for Treatment of Diabetic Complications. Pharmaceutics 2019, 11, 27. [Google Scholar] [CrossRef] [PubMed]
- Zhang, Y.; Huo, M.; Zhou, J.; Zou, A.; Li, W.; Yao, C.; Xie, S. DDSolver: An add-in program for modeling and comparison of drug dissolution profiles. AAPS J. 2010, 12, 263–271. [Google Scholar] [CrossRef]
- Nesměrák, K.; Němcová, I. Determination of Critical Micelle Concentration by Electrochemical Means. Anal. Lett. 2006, 39, 1023–1040. [Google Scholar] [CrossRef]
- Imai, S.; Hirai, Y.; Nagao, C.; Sawamoto, M.; Terashima, T. Programmed Self-Assembly Systems of Amphiphilic Random Copolymers into Size-Controlled and Thermoresponsive Micelles in Water. Macromolecules 2018, 51, 398–409. [Google Scholar] [CrossRef]
- Pegg, J.C.; Czajka, A.; Hill, C.; James, C.; Peach, J.; Rogers, S.E.; Eastoe, J. Alternative Route to Nanoscale Aggregates with a pH-Responsive Random Copolymer. Langmuir 2017, 33, 2628–2638. [Google Scholar] [CrossRef]
- Marsden, H.R.; Gabrielli, L.; Kros, A. Rapid preparation of polymersomes by a water addition/solvent evaporation method. Polym. Chem. 2010, 1, 1512. [Google Scholar] [CrossRef]
- Tarasenko, I.; Zashikhina, N.; Guryanov, I.; Volokitina, M.; Biondi, B.; Fiorucci, S.; Formaggio, F.; Tennikova, T.; Korzhikova-Vlakh, E. Amphiphilic polypeptides with prolonged enzymatic stability for the preparation of self-assembled nanobiomaterials. RSC Adv. 2018, 8, 34603–34613. [Google Scholar] [CrossRef]
- Fundamental Biomedical Technologies. In Intracellular Delivery II: Fundamentals and Applications; Prokop, A., Iwasaki, Y., Harada, A., Eds.; Springer: Dordrecht, The Netherlands, 2014. [Google Scholar]
- Vonarbourg, A.; Passirani, C.; Saulnier, P.; Benoit, J.P. Parameters influencing the stealthiness of colloidal drug delivery systems. Biomaterials 2006, 27, 4356–4373. [Google Scholar] [CrossRef] [PubMed]
- Korzhikov-Vlakh, V.; Averianov, I.; Sinitsyna, E.; Nashchekina, Y.; Polyakov, D.; Guryanov, I.; Lavrentieva, A.; Raddatz, L.; Korzhikova-Vlakh, E.; Scheper, T.; et al. Novel Pathway for Efficient Covalent Modification of Polyester Materials of Different Design to Prepare Biomimetic Surfaces. Polymers 2018, 10, 1299. [Google Scholar] [CrossRef]
- Yu, S.; Wang, S.; Zou, P.; Chai, G.; Lin, Y.W.; Velkov, T.; Li, J.; Pan, W.; Zhou, Q.T. Inhalable liposomal powder formulations for co-delivery of synergistic ciprofloxacin and colistin against multi-drug resistant gram-negative lung infections. Int. J. Pharm. 2020, 575, 118915. [Google Scholar] [CrossRef]
- Fu, Y.-Y.; Zhang, L.; Yang, Y.; Liu, C.-W.; He, Y.-N.; Li, P.; Xian, Y. Synergetic Antibacterial Effect of Ultrasound Microbubbles Combined with Chitosan-Modified Polymyxin B Liposomes on Biofilm-producing Acinetobacter baumannii. Int. J. Nanomed. 2019, 14, 1805–1815. [Google Scholar] [CrossRef]
- Mathematical models of drug release. In Strategies to Modify the Drug Release from Pharmaceutical Systems; Elsevier: Amsterdam, The Netherlands, 2015; pp. 63–86.
- Omri, A.; Suntres, Z.E.; Shek, P.N. Enhanced activity of liposomal polymyxin B against Pseudomonas aeruginosa in a rat model of lung infection. Biochem. Pharmacol. 2002, 64, 1407–1413. [Google Scholar] [CrossRef]
- Alipour, M.; Halwani, M.; Omri, A.; Suntres, Z.E. Antimicrobial effectiveness of liposomal polymyxin B against resistant Gram-negative bacterial strains. Int. J. Pharm. 2008, 355, 293–298. [Google Scholar] [CrossRef]


| Sample | Glu NCA0/dPhe NCA0 (mol/mol) | SEC | SLS | HPLC | ||
|---|---|---|---|---|---|---|
| Mw | Mn | Ɖ | Mw | Glu/dPhe (mol/mol) | ||
| 1 | 80/20 | 7800 | 6500 | 1.20 | 7000 | 75/25 |
| 2 | 86/14 | 8100 | 6600 | 1.23 | 8000 | 80/20 |
| Sample | Characteristics | |||
|---|---|---|---|---|
| DH, nm | PDI | ζ-Potential, mV | CCM, µg/mL | |
| 1 | 150 ± 19 | 0.22 | −46.0 ± 0.9 | – |
| 2 | 162 ± 22 | 0.25 | −48.4 ± 1.8 | 4.2 |
| Sample | Subtype | m/z | Content, % |
|---|---|---|---|
| Polymyxin B | B1 | 602.3824 | 81.5 ± 0.6 |
| B2 | 595.3760 | 18.5 ± 0.6 | |
| Polymyxin E | E1 | 585.3890 | 31.1 ± 0.4 |
| E2 | 578.3808 | 68.9 ± 0.4 |
| Model | Polymyxin B | Polymyxin E | ||
|---|---|---|---|---|
| PBS | Human Blood Plasma | PBS | Human Blood Plasma | |
| Zero-order * | R2 = 0.6401 Kzo = 3.44 | R2 = 0.9471 Kzo = 4.75 | R2 = 0.9885 Kzo = 7.30 | R2 = 0.9740 Kzo = 10.37 |
| First-order * | R2 = 0.6900 Kfo = 0.04 | R2 = 0.9215 Kfo = 0.05 | R2 = 0.9620 Kfo = 0.09 | R2 = 0.9844 Kfo = 0.14 |
| Higuchi * | R2 = 0.9793 KH = 7.17 | R2 = 0.7064 KH = 8.88 | R2 = 0.8012 KH = 14.00 | R2 = 0.9180 KH = 20.57 |
| Higuchi ** | R2 = 0.8303 KH = 4.98 | R2 = 0.8968 KH = 8.82 | R2 = 0.8707 KH = 11.29 | R2 = 0.7938 KH = 14.47 |
| Korsmeyer-Peppas * | R2 = 0.9895 KKP = 7.91 n = 0.43 | R2 = 0.9970 KKP = 2.26 n = 1.49 | R2 = 0.9989 KKP = 5.64 n = 1.17 | R2 = 0.9915 KKP = 13.66 n = 0.81 |
| Hixon-Crowell * | R2 = 0.6741 KHC = 0.01 | R2 = 0.9302 KHC = 0.02 | R2 = 0.9720 KHC = 0.03 | R2 = 0.9863 KHC = 0.04 |
| Hopfenberg * | R2 = 0.6899 KHb = 0.01 | R2 = 0.9935 KHb = 0.13 | R2 = 0.9983 KHb = 0.12 | R2 = 0.9863 KHb = 0.04 |
| Hopfenberg ** | R2 = 0.3805 | R2 = 0.8804 | R2 = 0.8483 | R2 = 0.8714 |
| Baker-Lonsdale ** | R2 = 0.8638 KBL = 0.001 | R2 = 0.9105 KHb = 0.002 | R2 = 0.9130 KHb = 0.003 | R2 = 0.9121 KHb = 0.007 |
| Weibull ** | R2 = 0.9867 α = 10.8 β = 0.35 | R2 = 0.9226 α = 10.8 β = 0.59 | R2 = 0.9315 α = 6.8 β = 0.56 | R2 = 0.9497 α = 4.3 β = 0.55 |
| Gompertz *** | R2 = 0.9899 α = 2.5 β = 0.4 | R2 = 0.9664 α = 3.1 β = 1.0 | R2 = 0.9714 α = 2.5 β = 1.1 | R2 = 0.9785 α = 1.9 β = 1.3 |
| Peppas-Sahlin *** | R2 = 0.9967 K1 = 8.8 K2 = 0.7 m = 0.45 | R2 = 0.9564 K1 = 7.1 K2 = 0.2 m = 0.75 | R2 = 0.9584 K1 = 13.5 K2 = 0.7 m = 0.59 | R2 = 0.9687 K1 = 20.7 K2 = 1.4 m = 0.59 |
© 2020 by the authors. Licensee MDPI, Basel, Switzerland. This article is an open access article distributed under the terms and conditions of the Creative Commons Attribution (CC BY) license (http://creativecommons.org/licenses/by/4.0/).
Share and Cite
Iudin, D.; Zashikhina, N.; Demyanova, E.; Korzhikov-Vlakh, V.; Shcherbakova, E.; Boroznjak, R.; Tarasenko, I.; Zakharova, N.; Lavrentieva, A.; Skorik, Y.; et al. Polypeptide Self-Assembled Nanoparticles as Delivery Systems for Polymyxins B and E. Pharmaceutics 2020, 12, 868. https://doi.org/10.3390/pharmaceutics12090868
Iudin D, Zashikhina N, Demyanova E, Korzhikov-Vlakh V, Shcherbakova E, Boroznjak R, Tarasenko I, Zakharova N, Lavrentieva A, Skorik Y, et al. Polypeptide Self-Assembled Nanoparticles as Delivery Systems for Polymyxins B and E. Pharmaceutics. 2020; 12(9):868. https://doi.org/10.3390/pharmaceutics12090868
Chicago/Turabian StyleIudin, Dmitrii, Natalia Zashikhina, Elena Demyanova, Viktor Korzhikov-Vlakh, Elena Shcherbakova, Roman Boroznjak, Irina Tarasenko, Natalya Zakharova, Antonina Lavrentieva, Yury Skorik, and et al. 2020. "Polypeptide Self-Assembled Nanoparticles as Delivery Systems for Polymyxins B and E" Pharmaceutics 12, no. 9: 868. https://doi.org/10.3390/pharmaceutics12090868
APA StyleIudin, D., Zashikhina, N., Demyanova, E., Korzhikov-Vlakh, V., Shcherbakova, E., Boroznjak, R., Tarasenko, I., Zakharova, N., Lavrentieva, A., Skorik, Y., & Korzhikova-Vlakh, E. (2020). Polypeptide Self-Assembled Nanoparticles as Delivery Systems for Polymyxins B and E. Pharmaceutics, 12(9), 868. https://doi.org/10.3390/pharmaceutics12090868