The Comparison of Two Challenging Low Dose APIs in a Continuous Direct Compression Process


Abstract
1. Introduction
2. Materials and Methods
2.1. Materials
2.2. Methods
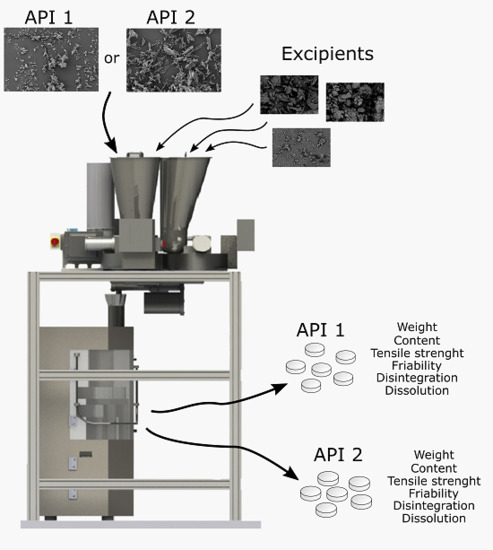
2.2.1. Continuous Manufacturing Line
2.2.2. Design of Experiments
2.2.3. Feeding and Mixing
2.2.4. Tableting and Sampling
2.2.5. Powder Properties
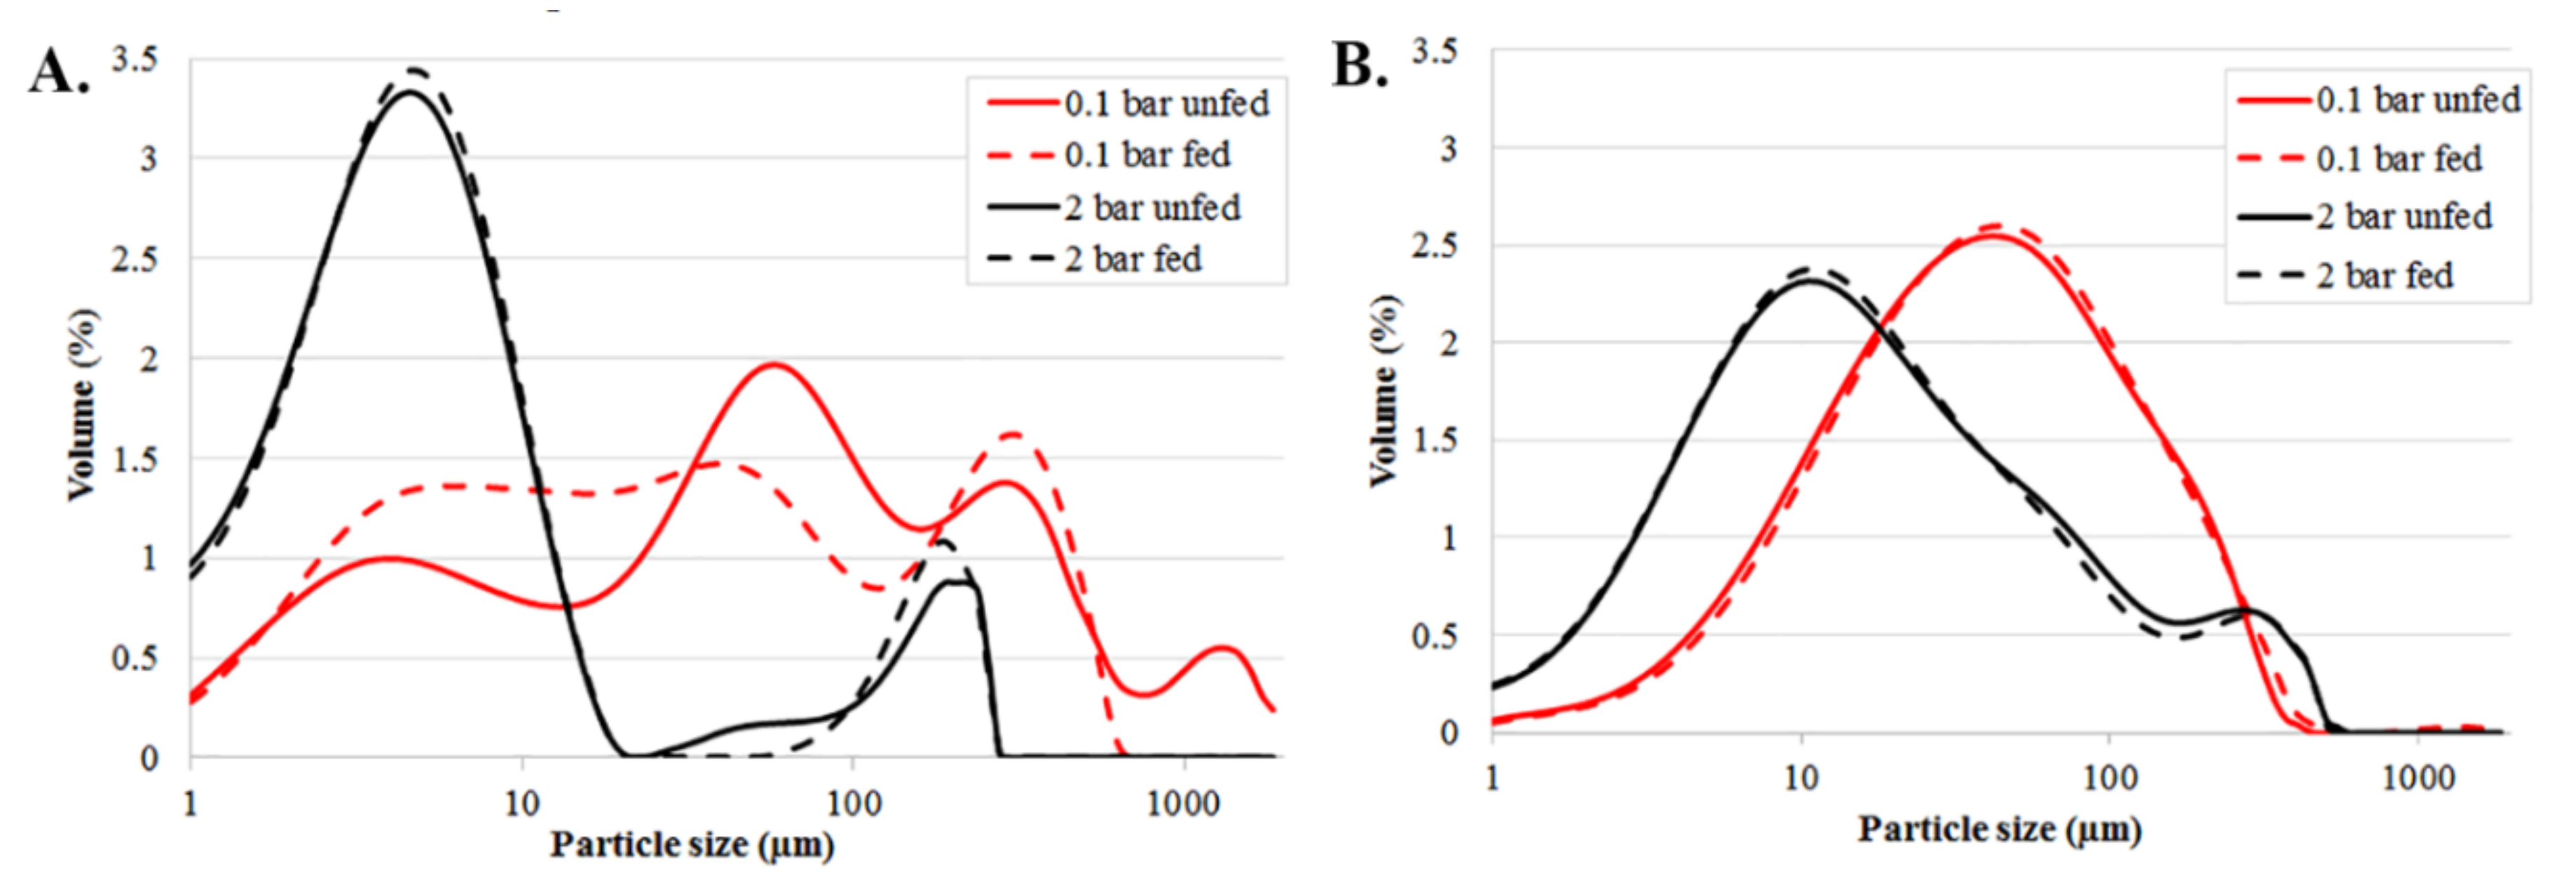
Particle Size Distribution
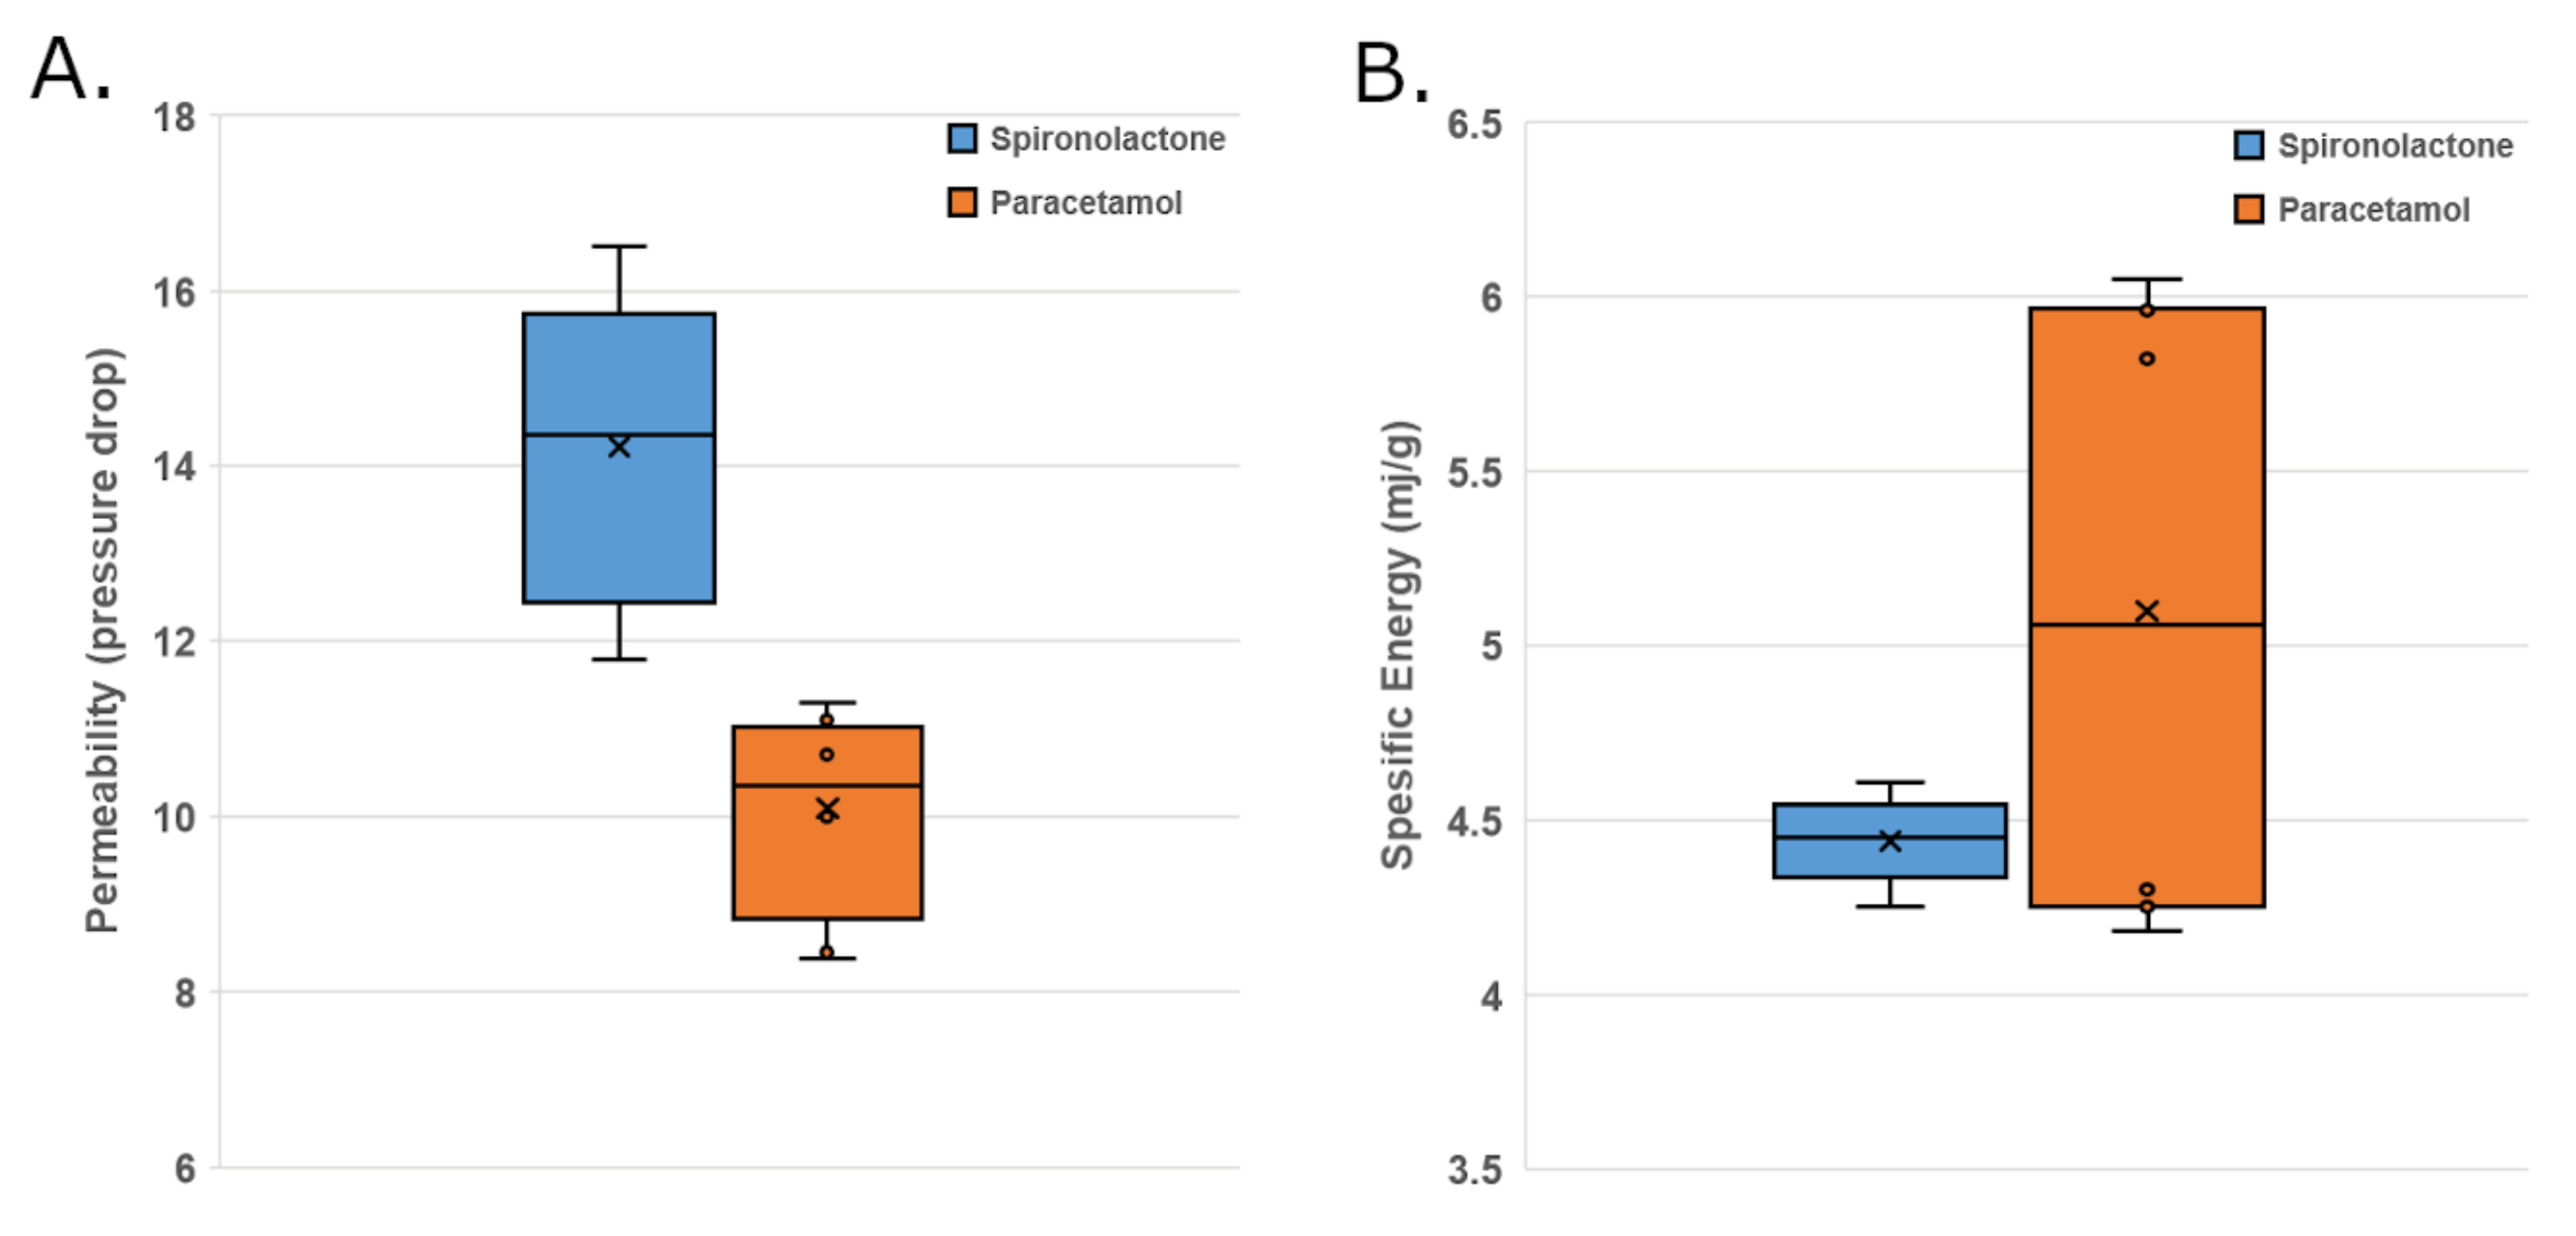
Powder Rheology
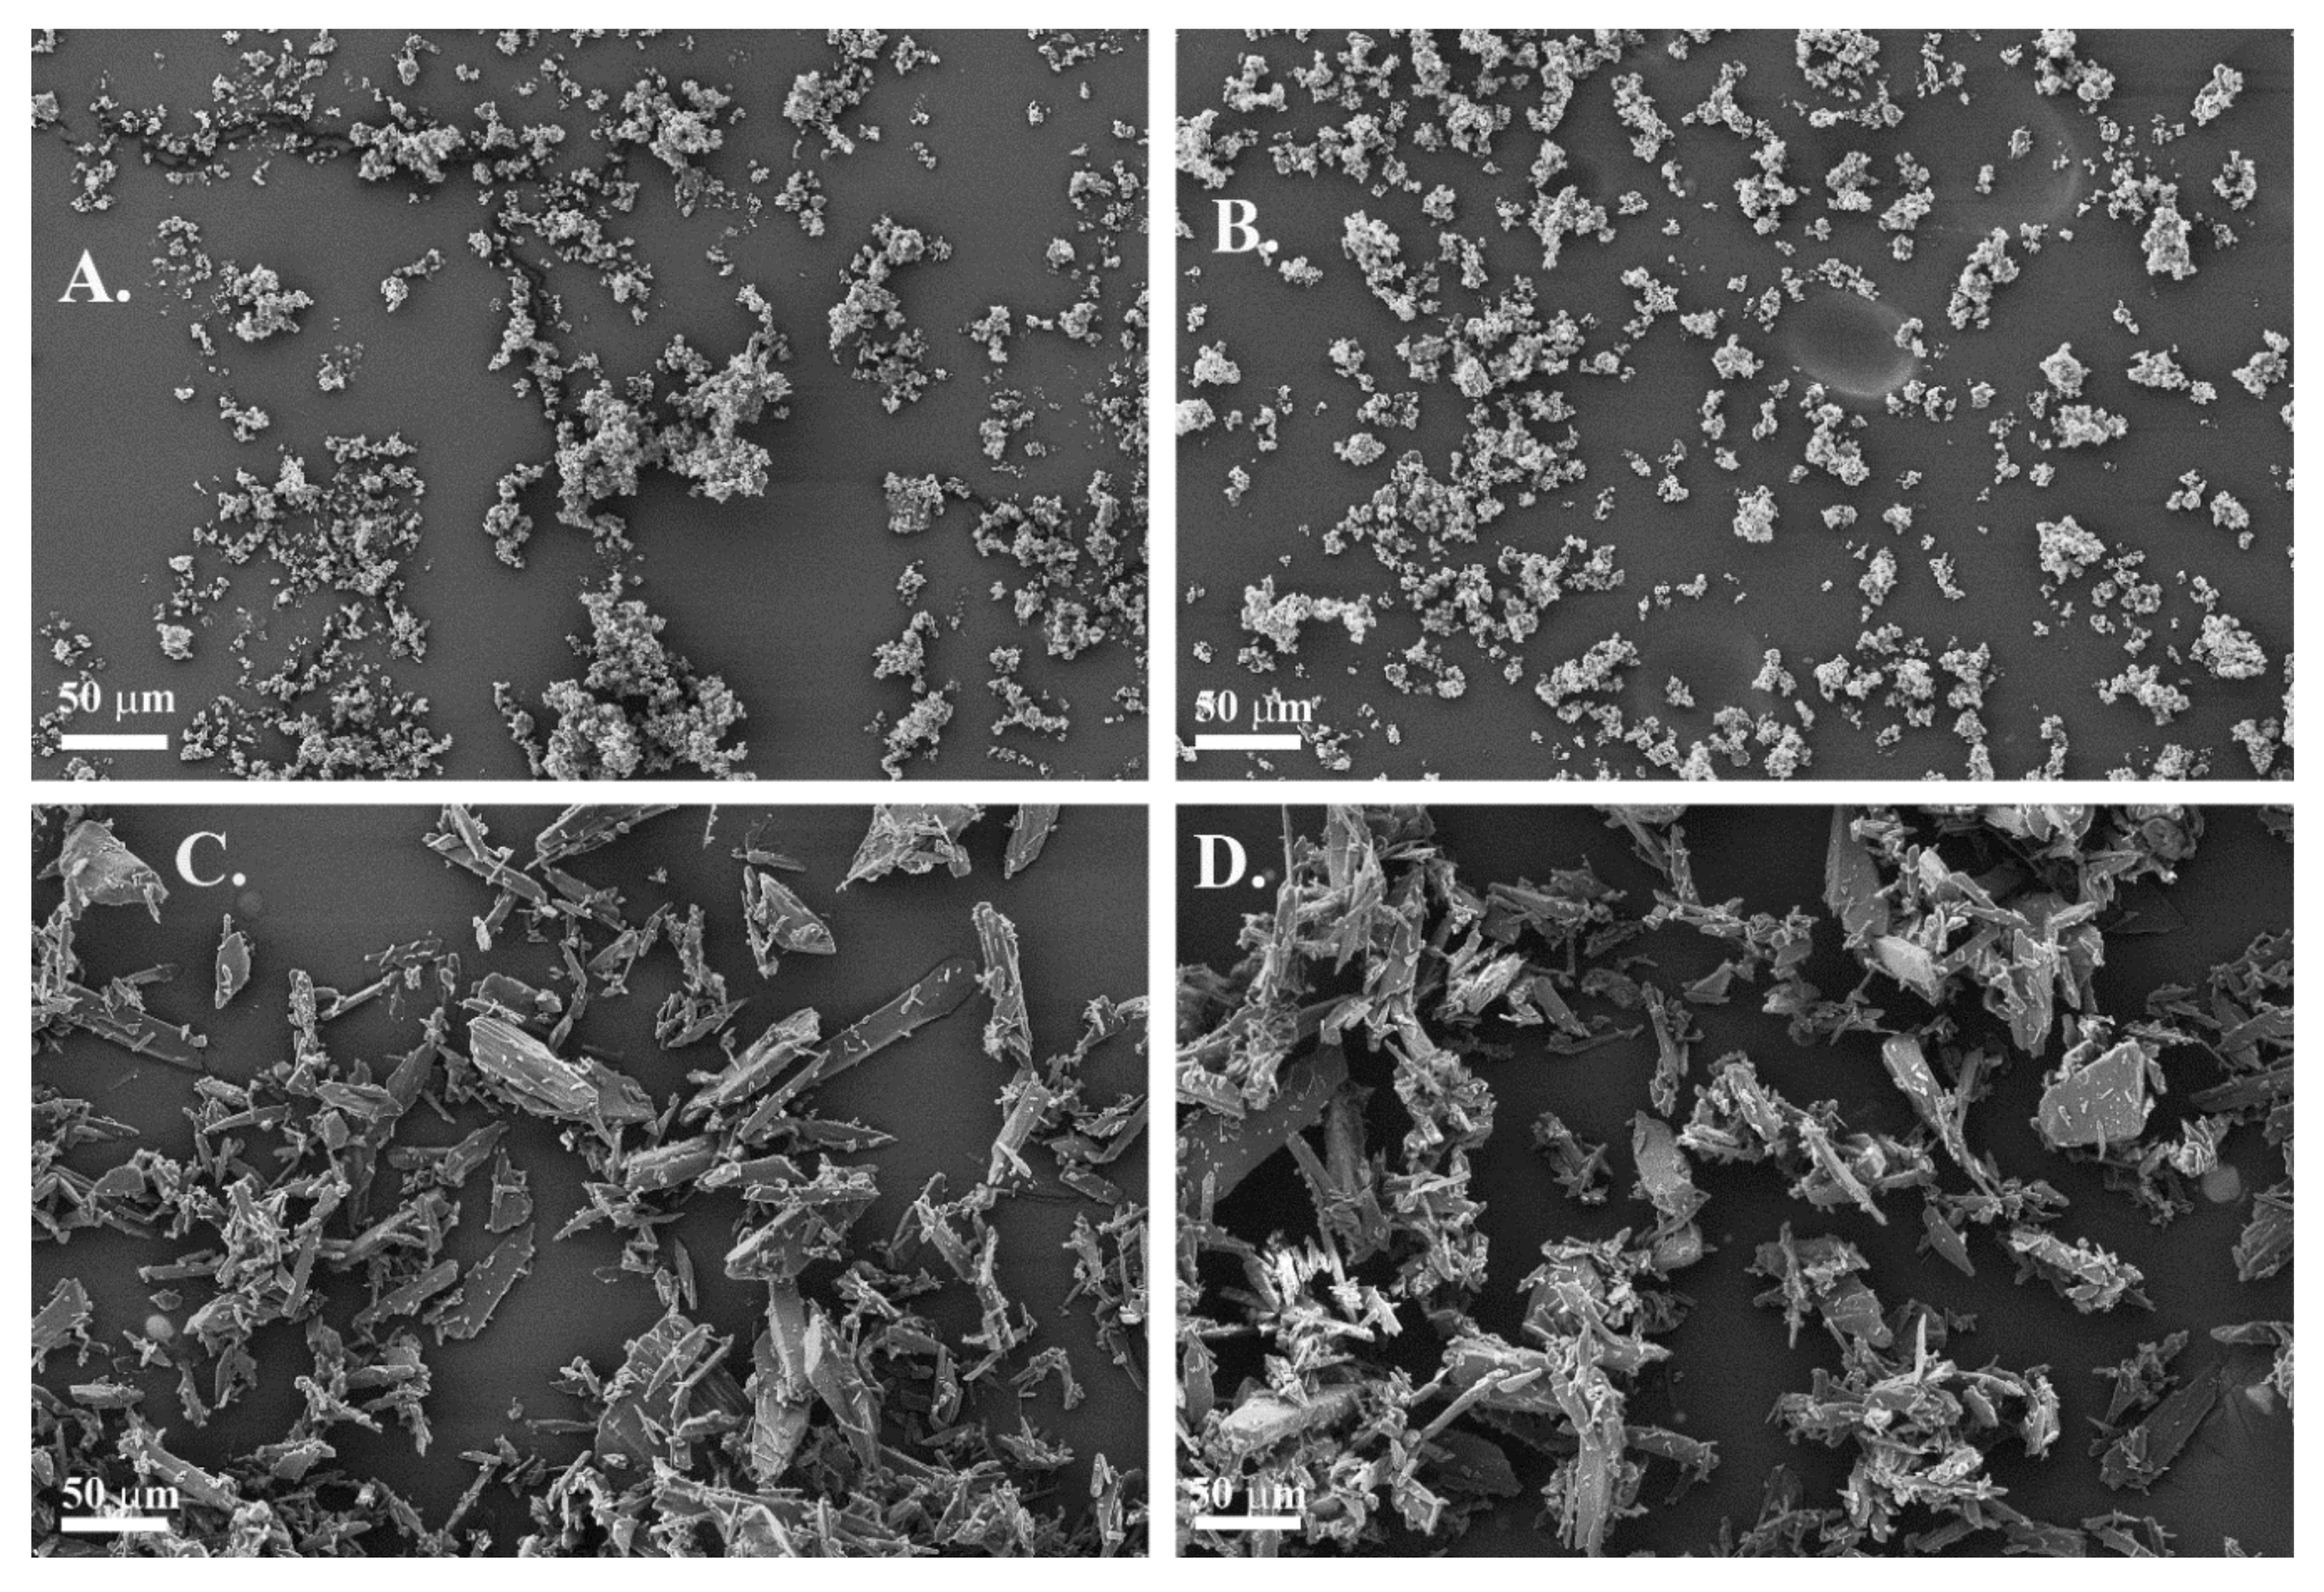
Scanning Electron Microscopy
2.2.6. Measurement of Tablet Properties
Tablet Dimensions and Tensile Strengths
Tablet Friability
Content Uniformity
Disintegration Time
Dissolution
2.2.7. Data Analysis
3. Results
3.1. API Properties
3.1.1. SEM
3.1.2. Particle Size Distribution
3.1.3. Powder Rheology Measurements of APIs
3.2. Powder Blends
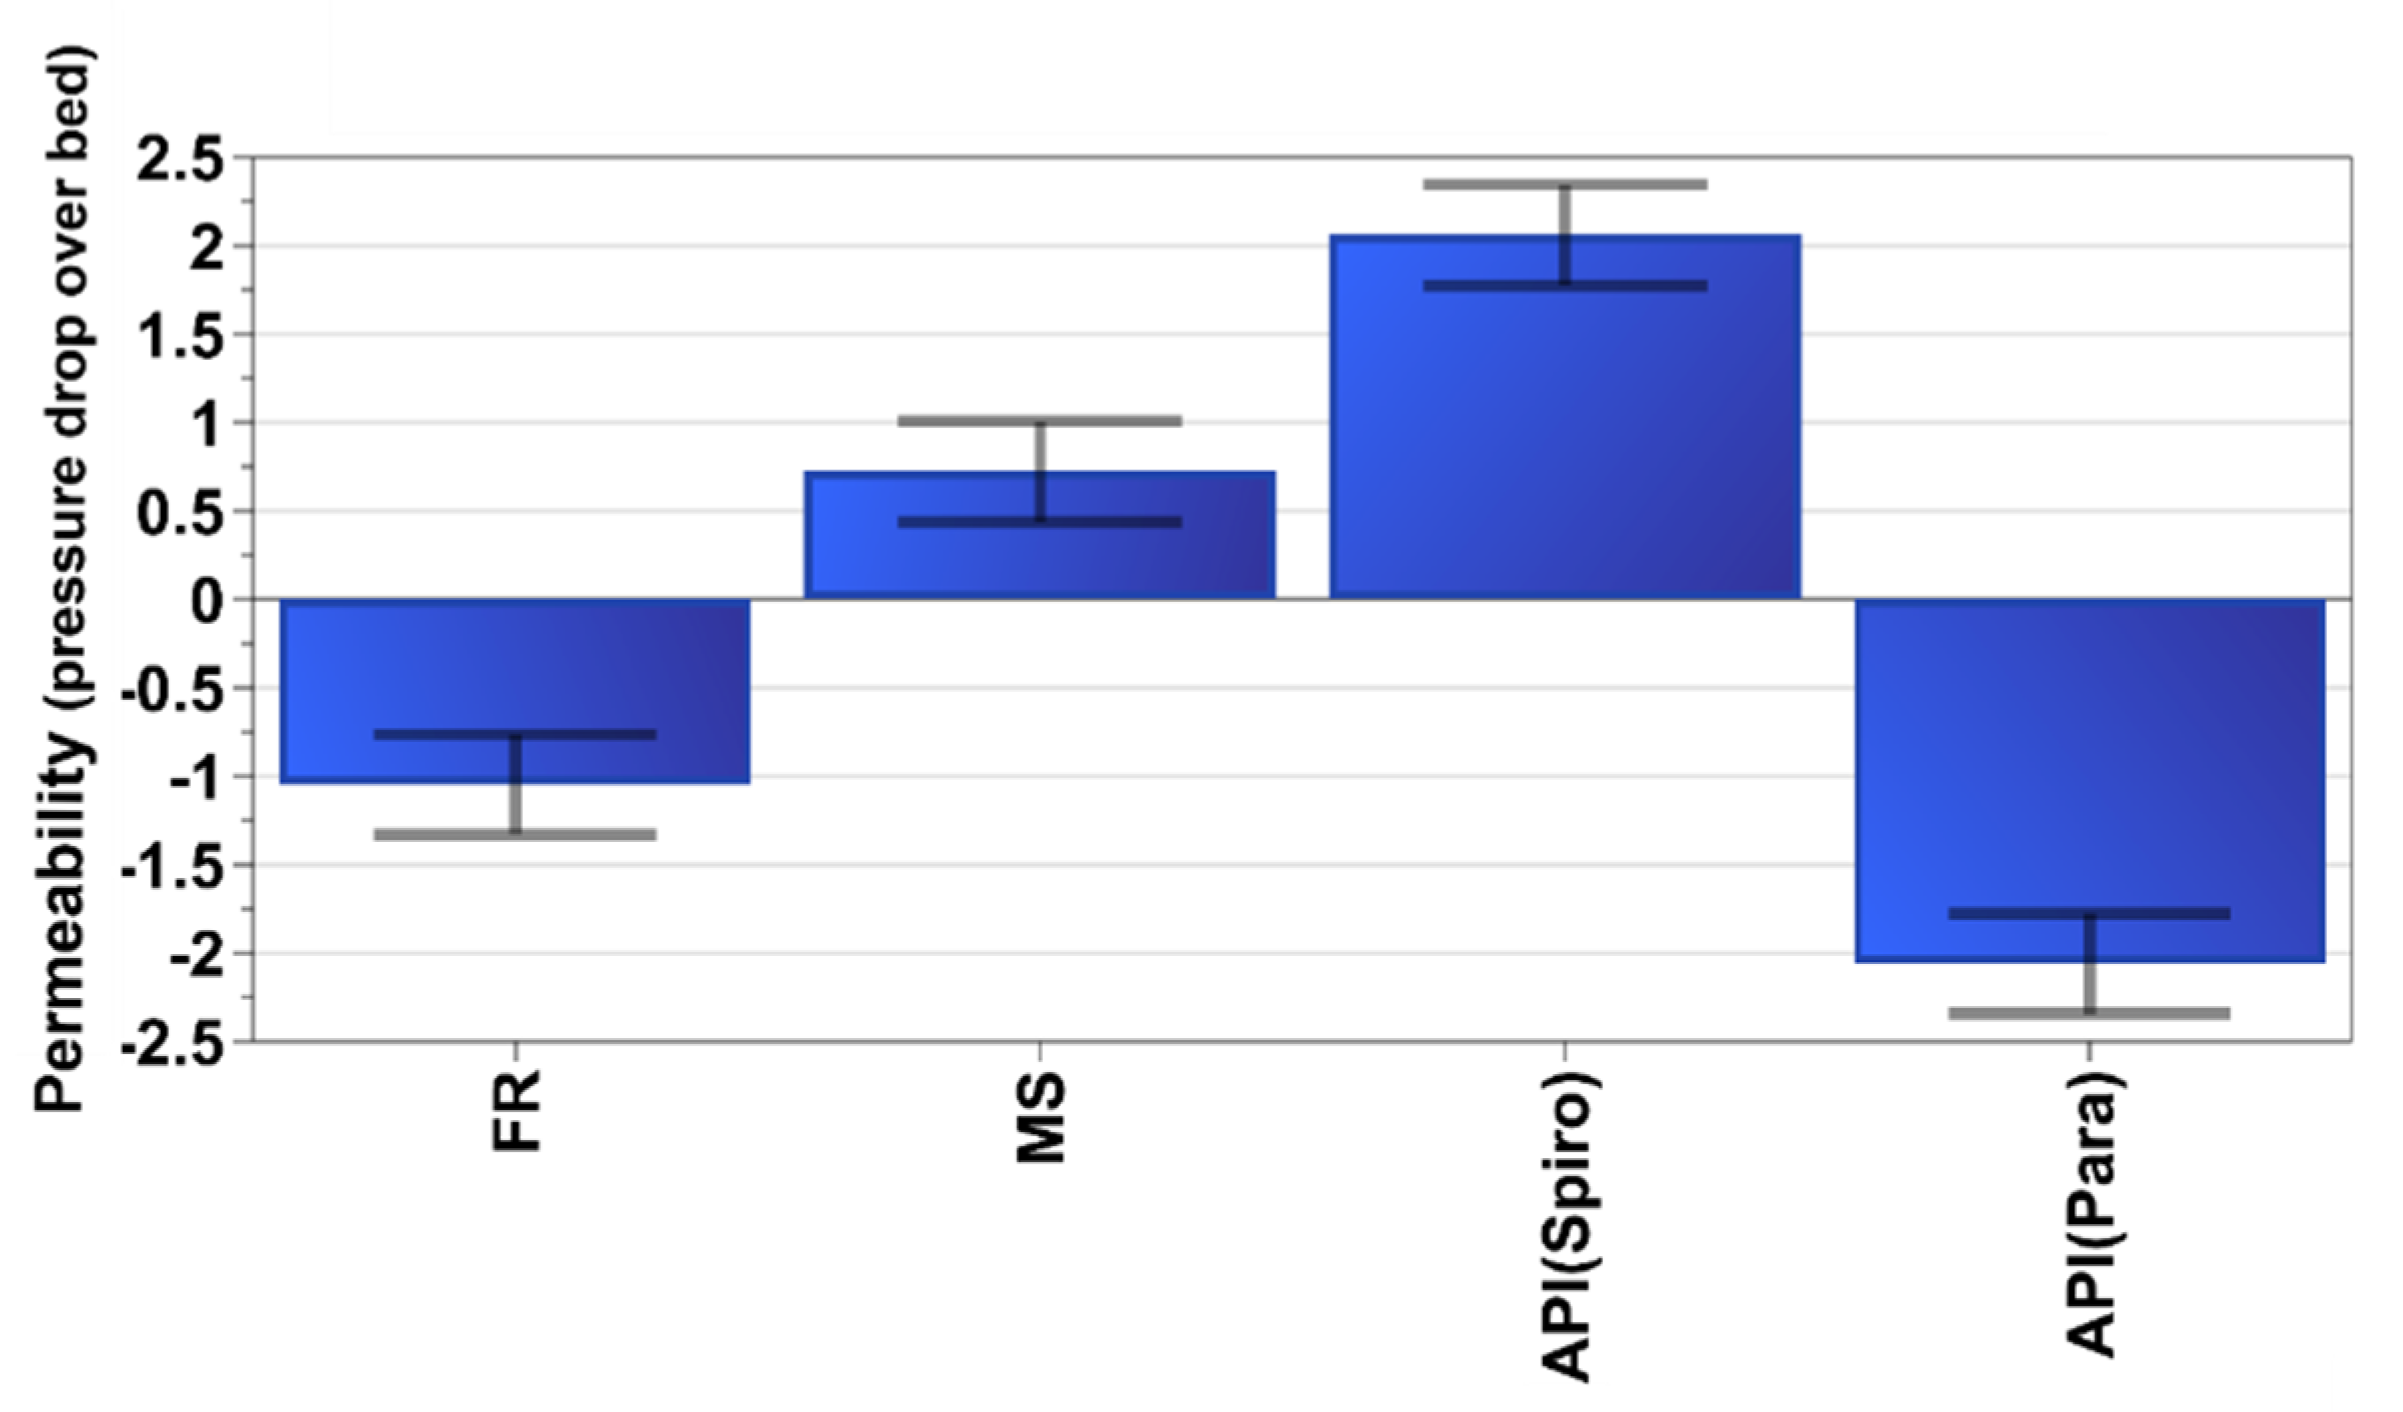
3.2.1. Powder Rheology Measurements of Powder Blends
3.2.2. Homogeneity/Feeder Data
3.2.3. SEM Imaging and EDS Analysis of Powder Blends
3.2.4. Mass Hold
3.3. Tablet Properties
3.3.1. Tablet Weight and Weight Variation
3.3.2. Tensile Strength and Friability of Tablets
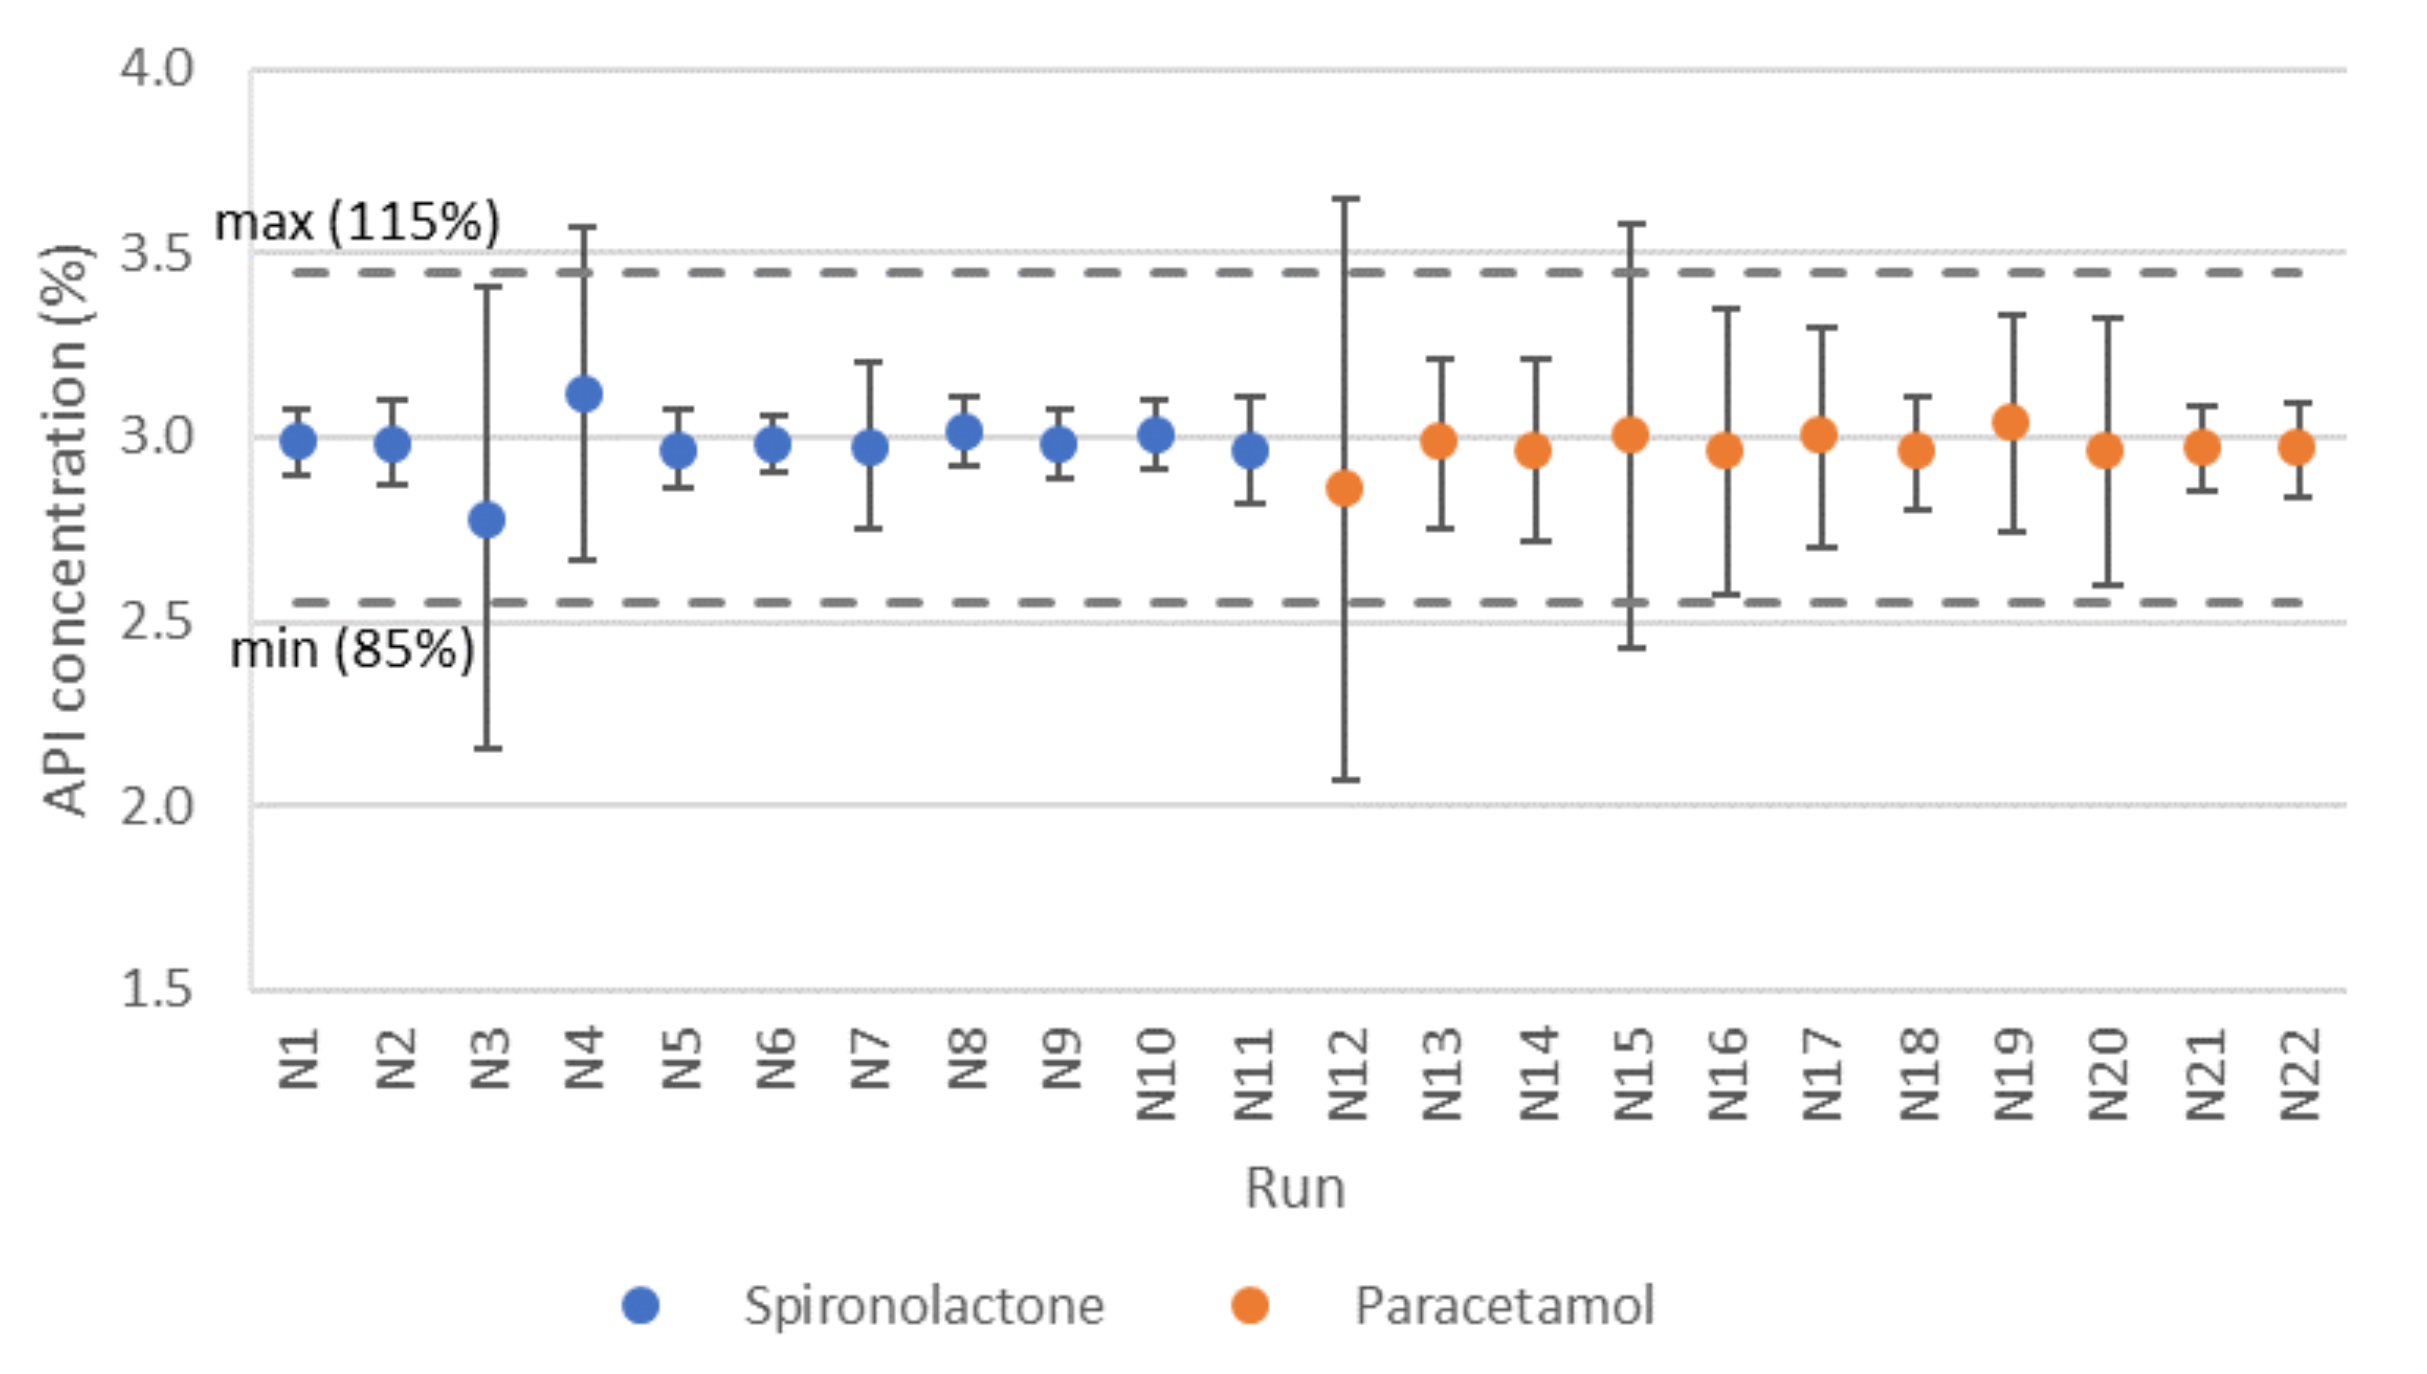
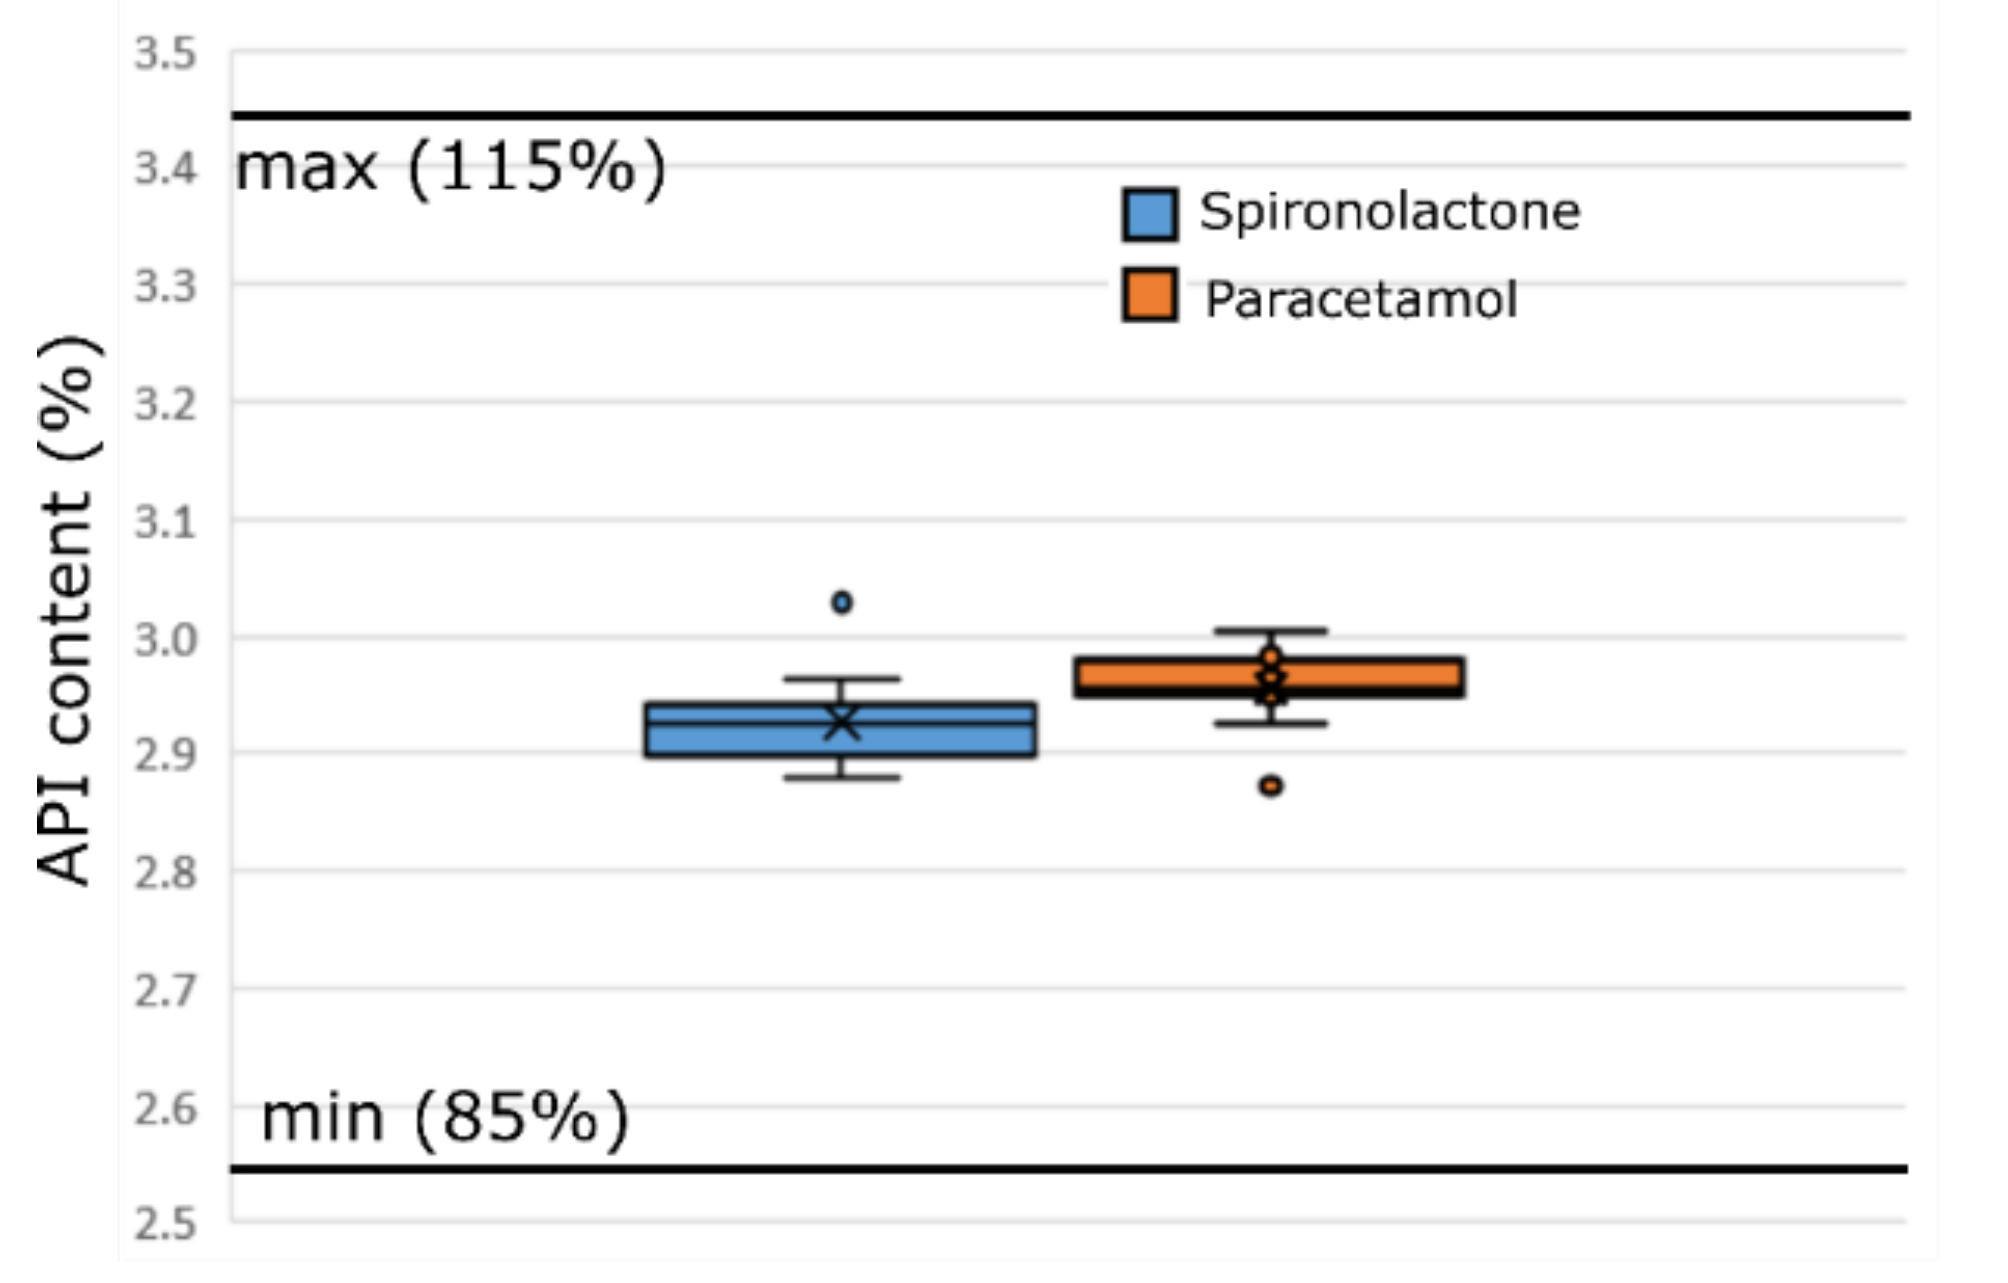
3.3.3. Uniformity of Content
3.3.4. Disintegration Time
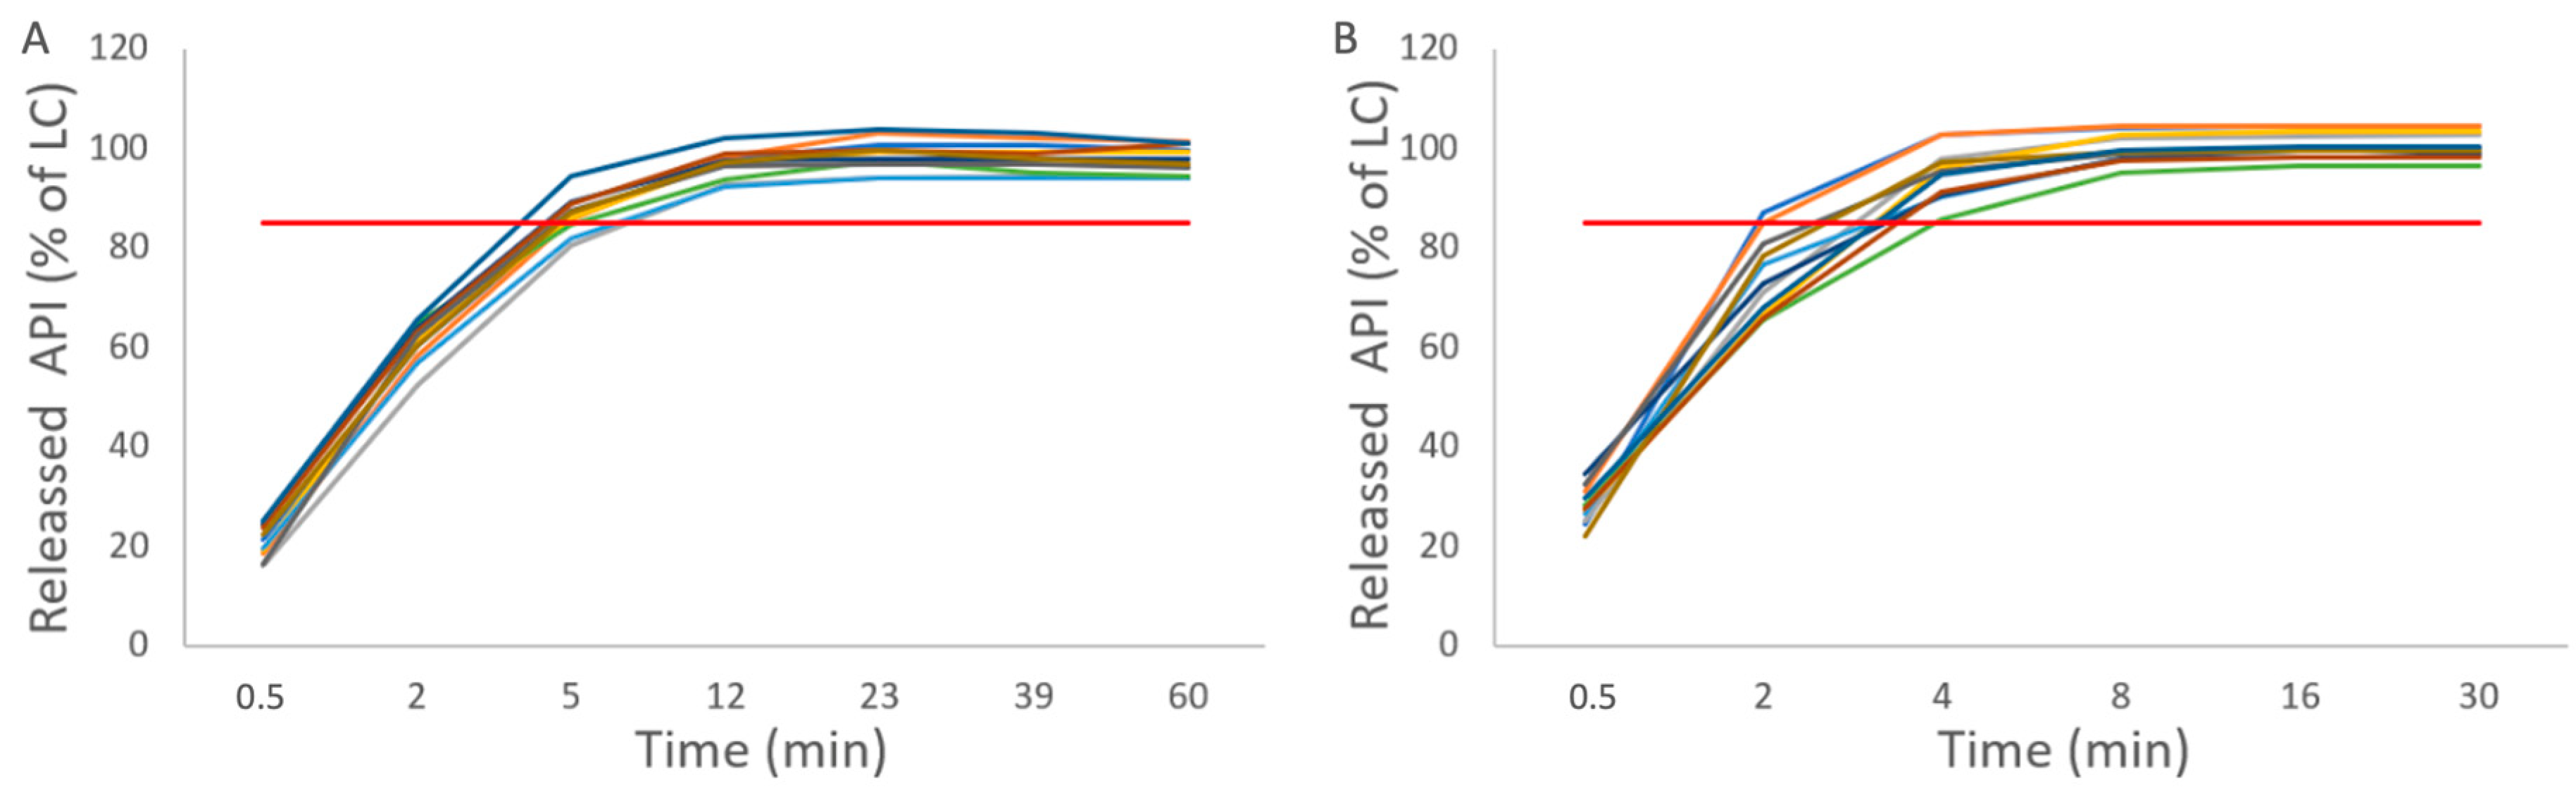
3.3.5. Dissolution
4. Discussion
5. Conclusions
Supplementary Materials
Author Contributions
Funding
Acknowledgments
Conflicts of Interest
References
- Hancock, B.C.; Garcia-Munoz, S. How do formulation and process parameters impact blend and unit dose uniformity? Further analysis of the product quality research institute blend uniformity working group industry survey. J. Pharm. Sci. 2013, 102, 982–986. [Google Scholar] [CrossRef] [PubMed]
- Bi, M.; Sun, C.C.; Alvarez, F.; Alvarez-Nunez, F. The manufacture of low-dose oral solid dosage form to support early clinical studies using an automated micro-filling system. AAPS PharmSciTech 2011, 12, 88–95. [Google Scholar] [CrossRef] [PubMed]
- Lacey, P.M.C. Developments in the theory of particle mixing. J. Appl. Chem. 1954, 4, 257–268. [Google Scholar] [CrossRef]
- Bridgwater, J. Fundamental powder mixing mechanisms. Powder Technol. 1976, 15, 215–236. [Google Scholar] [CrossRef]
- Staniforth, J.N. Relationship between particle packing and the physical stability of powder mixes. J. Pharm. Pharmacol. 1985, 37, 692–697. [Google Scholar] [CrossRef] [PubMed]
- Poux, M.; Fayolle, P.; Bertrand, J.; Bridoux, D.; Bousquet, J. Powder mixing: Some practical rules applied to agitated systems. Powder Technol. 1991, 68, 213–234. [Google Scholar] [CrossRef]
- Alexander, A.W.; Shinbrot, T.; Muzzio, F.J. Granular segregation in the double-cone blender: Transitions and mechanisms. Phys. Fluids 2001, 13, 578–587. [Google Scholar] [CrossRef]
- Oka, S.; Sahay, A.; Meng, W.; Muzzio, F. Diminished segregation in continuous powder mixing. Powder Technol. 2017, 309, 79–88. [Google Scholar] [CrossRef]
- Fan, L.T.; Chen, Y.; Lai, F.S. Recent developments in solids mixing. Powder Technol. 1990, 61, 255–287. [Google Scholar] [CrossRef]
- Huff, W.E.; Hagler, W.M., Jr. Density segregation of corn and wheat naturally contaminated with aflatoxin, deoxynivalenol and zearalenone. J. Food Prot. 1985, 48, 416–420. [Google Scholar] [CrossRef]
- Carson, J.W. Overcoming particle segregation in the pharmaceutical and cosmetics industries. Drug Dev. Ind. Pharm. 1988, 14, 2749–2758. [Google Scholar] [CrossRef]
- Prescott, J.K.; Hossfeld, R.J. Maintaining product uniformity and uninterrupted flow to direct-compression tableting presses. Pharm. Technol. 1994, 18, 99–114. [Google Scholar]
- Tang, P.; Puri, V.M. Methods for minimizing segregation: A review. Part. Sci. Technol. 2004, 22, 321–337. [Google Scholar] [CrossRef]
- Duffy, S.P.; Puri, V.M. Primary segregation shear cell for size-segregation analysis of binary mixtures. KONA Powder Part. J. 2002, 20, 196–207. [Google Scholar] [CrossRef]
- Yang, S.C. Density effect on mixing and segregation processes in a vibrated binary granular mixture. Powder Technol. 2006, 164, 65–74. [Google Scholar] [CrossRef]
- Tang, P.; Puri, V.M. Segregation quantification of two-component particulate mixtures: Effect of particle size, density, shape, and surface texture. Part. Sci. Technol. 2007, 25, 571–588. [Google Scholar] [CrossRef]
- Liss, E.D.; Conway, S.L.; Zega, J.A.; Glasser, B.J. Segregation of powders during gravity flow through vertical pipes. Pharm. Technol. 2004, 445, 78–96. [Google Scholar]
- Teżyk, M.; Jakubowska, E.; Milczewska, K.; Milanowski, B.; Voelkel, A.; Lulek, J. The influence of direct compression powder blend transfer method from the container to the tablet press on product critical quality attributes: A case study. Drug Dev. Ind. Pharm. 2017, 43, 911–916. [Google Scholar] [CrossRef]
- Berthiaux, H.; Marikh, K.; Gatumel, C. Continuous mixing of powder mixtures with pharmaceutical process constraints. Chem. Eng. Process. 2008, 47, 2315–2322. [Google Scholar] [CrossRef]
- Vanarase, A.U.; Muzzio, F.J. Effect of operating conditions and design parameters in a continuous powder mixer. Powder Technol. 2011, 208, 26–36. [Google Scholar] [CrossRef]
- Vanarase, A.U.; Osorio, J.G.; Muzzio, F.J. Effects of powder flow properties and shear environment on the performance of continuous mixing of pharmaceutical powders. Powder Technol. 2013, 246, 63–72. [Google Scholar] [CrossRef]
- Pawar, P.; Wang, Y.; Keyvan, G.; Callegari, G.; Cuitino, A.; Muzzio, F. Enabling real time release testing by NIR prediction of dissolution of tablets made by continuous direct compression (CDC). Int. J. Pharm. 2016, 512, 96–107. [Google Scholar] [CrossRef] [PubMed]
- Karttunen, A.; Wikström, H.; Tajarobi, P.; Fransson, M.; Sparén, A.; Marucci, M.; Ketolainen, J.; Folestad, S.; Korhonen, O.; Abrahmsén-Alami, S. Comparison between integrated continuous direct compression line and batch processing—The effect of raw material properties. Eur. J. Pharm. Sci. 2019, 133, 40–53. [Google Scholar] [CrossRef] [PubMed]
- Järvinen, K.; Hoehe, W.; Järvinen, M.; Poutiainen, S.; Juuti, M.; Borchert, S. In-Line monitoring of the drug content of powder mixtures and tablets by near-infrared spectroscopy during the continuous direct compression tableting process. Eur. J. Pharm. Sci. 2013, 48, 680–688. [Google Scholar] [CrossRef] [PubMed]
- Marikh, K.; Berthiaux, H.; Mizonov, V.; Barantseva, E. Experimental study of the stirring conditions taking place in a pilot plant continuous mixer of particulate solids. Powder Technol. 2005, 157, 138–143. [Google Scholar] [CrossRef]
- Pernenkil, L.; Cooney, C.L. A review on the continuous blending of powders. Chem. Eng. Sci. 2006, 61, 720–742. [Google Scholar] [CrossRef]
- Portillo, P.M.; Ierapetritou, M.G.; Muzzio, F.J. Characterization of continuous convective powder mixing processes. Powder Technol. 2008, 182, 368–378. [Google Scholar] [CrossRef]
- Cartwright, J.J.; Robertson, J.; D’Haene, D.; Burke, M.D.; Hennenkamp, J.R. Twin screw wet granulation: Loss in weight feeding of a poorly flowing active pharmaceutical ingredient. Powder Technol. 2013, 238, 116–121. [Google Scholar] [CrossRef]
- Ervasti, T.; Simonaho, S.P.; Ketolainen, J.; Forsberg, P.; Fransson, M.; Wikström, H.; Folestad, S.; Lakio, S.; Tajarobi, P.; Abrahmsén-Alami, S. Continuous manufacturing of extended release tablets via powder mixing and direct compression. Int. J. Pharm. 2015, 495, 290–301. [Google Scholar] [CrossRef]
- Engisch, W.E.; Muzzio, F.J. Feedrate deviations caused by hopper refill of loss-in-weight feeders. Powder Technol. 2015, 283, 389–400. [Google Scholar] [CrossRef]
- Blackshields, C.A.; Crean, A.M. Continuous powder feeding for pharmaceutical solid dosage form manufacture: A short review. Pharm. Dev. Technol. 2018, 23, 554–560. [Google Scholar] [CrossRef] [PubMed]
- Hanson, J. Control of a system of loss-in-weight feeders for drug product continuous manufacturing. Powder Technol. 2018, 331, 236–243. [Google Scholar] [CrossRef]
- Van Snick, B.; Holman, J.; Vanhoorne, V.; Kumar, A.; De Beer, T.; Remon, J.P.; Vervaet, C. Development of a continuous direct compression platform for low-dose drug products. Int. J. Pharm. 2017, 529, 329–346. [Google Scholar] [CrossRef] [PubMed]
- Kaneniwa, N.; Watari, N. Dissolution of slightly soluble drugs. I. Influence of particle size on dissolution behavior. Chem. Pharm. Bull. 1974, 22, 1699–1705. [Google Scholar] [CrossRef] [PubMed]
- Cartilier, L.H.; Moës, A.J. Effect of drug agglomerates upon the kinetics of mixing of low dosage cohesive powder mixtures. Drug Dev. Ind. Pharm. 1989, 15, 1911–1931. [Google Scholar] [CrossRef]
- He, X.; Han, X.; Ladyzhynsky, N.; Deanne, R. Assessing powder segregation potential by near infrared (NIR) spectroscopy and correlating segregation tendency to tabletting performance. Powder Technol. 2013, 236, 85–99. [Google Scholar] [CrossRef]
- Mao, C.; Thalladi, V.R.; Kim, D.K.; Ma, S.H.; Edgren, D.; Karaborni, S. Harnessing ordered mixing to enable direct-compression process for low-dose tablet manufacturing at production scale. Powder Technol. 2013, 239, 290–299. [Google Scholar] [CrossRef]
- Porion, P.; Sommier, N.; Faugère, A.; Evesque, P. Dynamics of size segregation and mixing of granular materials in a 3D-blender by NMR imaging investigation. Powder Technol. 2004, 141, 55–68. [Google Scholar] [CrossRef]
- Boukouvala, F.; Niotis, V.; Ramachandran, R.; Muzzio, F.J.; Ierapetritou, M.G. An integrated approach for dynamic flowsheet modeling and sensitivity analysis of a continuous tablet manufacturing process. Comput. Chem. Eng. 2012, 42, 30–47. [Google Scholar] [CrossRef]
- Van Snick, B.; Holman, J.; Cunningham, C.; Kumar, A.; Vercruysse, J.; De Beer, T.; Remon, J.P.; Vervaet, C. Continuous direct compression as manufacturing platform for sustained release tablets. Int. J. Pharm. 2017, 519, 390–407. [Google Scholar] [CrossRef]
- Järvinen, M.A.; Paaso, J.; Paavola, M.; Leiviskä, K.; Juuti, M.; Muzzio, F.; Järvinen, K. Continuous direct tablet compression: Effects of impeller rotation rate, total feed rate and drug content on the tablet properties and drug release. Drug Dev. Ind. Pharm. 2013, 39, 1802–1808. [Google Scholar] [CrossRef] [PubMed]
- Engisch, W.E.; Muzzio, F.J. Loss-In-Weight feeding trials case study: Pharmaceutical formulation. J. Pharm. Innov. 2015, 10, 56–75. [Google Scholar] [CrossRef]
- Lakio, S.; Tajarobi, P.; Wikström, H.; Fransson, M.; Arnehed, J.; Ervasti, T.; Simonaho, S.; Ketolainen, J.; Folestad, S.; Abrahmsén-Alami, S. Achieving a robust drug release from extended release tablets using an integrated continuous mixing and direct compression line. Int. J. Pharm. 2016, 511, 659–668. [Google Scholar] [CrossRef] [PubMed]
- Lakio, S.; Ervasti, T.; Tajarobi, P.; Wikström, H.; Fransson, M.; Karttunen, A.; Ketolainen, J.; Folestad, S.; Abrahmsén-Alami, S.; Korhonen, O. Provoking an end-to-end continuous direct compression line with raw materials prone to segregation. Eur. J. Pharm. Sci. 2017, 109, 514–524. [Google Scholar] [CrossRef]
- Fu, X.; Huck, D.; Makein, L.; Armstrong, B.; Willen, U.; Freeman, T. Effect of particle shape and size on flow properties of lactose powders. Particuology 2012, 10, 203–208. [Google Scholar] [CrossRef]
- Fell, J.T.; Newton, J.M. Determination of tablet strength by the diametral-compression test. J. Pharm. Sci. 1970, 59, 688–691. [Google Scholar] [CrossRef]
- Gao, Y.; Vanarase, A.; Muzzio, F.; Ierapetritou, M. Characterizing continuous powder mixing using residence time distribution. Chem. Eng. Sci. 2011, 66, 417–425. [Google Scholar] [CrossRef]
- Portillo, P.M.; Ierapetritou, M.G.; Muzzio, F.J. Effects of rotation rate, mixing angle, and cohesion in two continuous powder mixers—A statistical approach. Powder Technol. 2009, 194, 217–227. [Google Scholar] [CrossRef]
- Engisch, W.E.; Muzzio, F.J. Using residence time Ddstributions (RTDs) to address the traceability of raw materials in continuous pharmaceutical manufacturing. J. Pharm. Innov. 2016, 11, 64–81. [Google Scholar] [CrossRef]
- Karttunen, A.; Poms, J.; Sacher, S.; Sparén, A.; Ruiz Samblás, C.; Fransson, M.; Martin De Juan, L.; Remmelgas, J.; Wikström, H.; Hsiao, W.; et al. Robustness of a continuous direct compression line against disturbances in feeding. Int. J. Pharm. 2020, 574, 118882. [Google Scholar] [CrossRef]
- Wang, Y.; O’Connor, T.; Li, T.; Ashraf, M.; Cruz, C.N. Development and applications of a material library for pharmaceutical continuous manufacturing of solid dosage forms. Int. J. Pharm. 2019, 569, 118551. [Google Scholar] [CrossRef] [PubMed]
- Lakio, S.; Vajna, B.; Farkas, I.; Salokangas, H.; Marosi, G.; Yliruusi, J. Challenges in detecting magnesium stearate distribution in tablets. AAPS PharmSciTech 2013, 14, 435–444. [Google Scholar] [CrossRef] [PubMed]
- Taipale-Kovalainen, K.; Karttunen, A.; Niinikoski, H.; Ketolainen, J.; Korhonen, O. The effects of unintentional and intentional process disturbances on tablet quality during long continuous manufacturing runs. Eur. J. Pharm. Sci. 2019, 129, 10–20. [Google Scholar] [CrossRef] [PubMed]
- Pauli, V.; Roggo, Y.; Pellegatti, L.; Nguyen Trung, N.Q.; Elbaz, F.; Ensslin, S.; Kleinebudde, P.; Krumme, M. Process analytical technology for continuous manufacturing tableting processing: A case study. J. Pharm. Biomed. Anal. 2019, 162, 101–111. [Google Scholar] [CrossRef]
- Roggo, Y.; Pauli, V.; Jelsch, M.; Pellegatti, L.; Elbaz, F.; Ensslin, S.; Kleinebudde, P.; Krumme, M. Continuous manufacturing process monitoring of pharmaceutical solid dosage form: A case study. J. Pharm. Biomed. Anal. 2020, 179, 112971. [Google Scholar] [CrossRef]
- Sierra-Vega, N.O.; Román-Ospino, A.; Scicolone, J.; Muzzio, F.J.; Romañach, R.J.; Méndez, R. Assessment of blend uniformity in a continuous tablet manufacturing process. Int. J. Pharm. 2019, 560, 322–333. [Google Scholar] [CrossRef]


| Batch | Feed Rate (kg/h) | Mixer Speed (rpm) | API |
|---|---|---|---|
| N1 | 20 | 700 | Spironolactone |
| N2 | 12 | 700 | Spironolactone |
| N3 | 20 | 300 | Spironolactone |
| N4 | 12 | 300 | Spironolactone |
| N5 | 28 | 300 | Spironolactone |
| N6 | 20 | 700 | Spironolactone |
| N7 | 12 | 1100 | Spironolactone |
| N8 | 28 | 700 | Spironolactone |
| N9 | 20 | 1100 | Spironolactone |
| N10 | 28 | 1100 | Spironolactone |
| N11 | 20 | 700 | Spironolactone |
| N12 | 20 | 700 | Paracetamol |
| N13 | 20 | 1100 | Paracetamol |
| N14 | 20 | 300 | Paracetamol |
| N15 | 12 | 700 | Paracetamol |
| N16 | 12 | 300 | Paracetamol |
| N17 | 20 | 700 | Paracetamol |
| N18 | 28 | 300 | Paracetamol |
| N19 | 28 | 700 | Paracetamol |
| N20 | 12 | 1100 | Paracetamol |
| N21 | 28 | 1100 | Paracetamol |
| N22 | 20 | 700 | Paracetamol |
| Sample | SE (mJ/g) | Permeability (Pressure Drop, mBar) (5 mm/s) |
|---|---|---|
| Spironolactone | 91.55 | 64.6 |
| Paracetamol | 40.10 | 15.9 |
| N4 | 4.44 | 14.6 |
| N5 | 4.29 | 11.9 |
| N7 | 4.53 | 16.3 |
| N10 | 4.50 | 14.2 |
| N16 | 4.22 | 10.9 |
| N18 | 5.89 | 8.4 |
| N20 | 4.28 | 11.1 |
| N21 | 6.01 | 10.0 |
© 2020 by the authors. Licensee MDPI, Basel, Switzerland. This article is an open access article distributed under the terms and conditions of the Creative Commons Attribution (CC BY) license (http://creativecommons.org/licenses/by/4.0/).
Share and Cite
Ervasti, T.; Niinikoski, H.; Mäki-Lohiluoma, E.; Leppinen, H.; Ketolainen, J.; Korhonen, O.; Lakio, S. The Comparison of Two Challenging Low Dose APIs in a Continuous Direct Compression Process. Pharmaceutics 2020, 12, 279. https://doi.org/10.3390/pharmaceutics12030279
Ervasti T, Niinikoski H, Mäki-Lohiluoma E, Leppinen H, Ketolainen J, Korhonen O, Lakio S. The Comparison of Two Challenging Low Dose APIs in a Continuous Direct Compression Process. Pharmaceutics. 2020; 12(3):279. https://doi.org/10.3390/pharmaceutics12030279
Chicago/Turabian StyleErvasti, Tuomas, Hannes Niinikoski, Eero Mäki-Lohiluoma, Heidi Leppinen, Jarkko Ketolainen, Ossi Korhonen, and Satu Lakio. 2020. "The Comparison of Two Challenging Low Dose APIs in a Continuous Direct Compression Process" Pharmaceutics 12, no. 3: 279. https://doi.org/10.3390/pharmaceutics12030279
APA StyleErvasti, T., Niinikoski, H., Mäki-Lohiluoma, E., Leppinen, H., Ketolainen, J., Korhonen, O., & Lakio, S. (2020). The Comparison of Two Challenging Low Dose APIs in a Continuous Direct Compression Process. Pharmaceutics, 12(3), 279. https://doi.org/10.3390/pharmaceutics12030279