A Rational Design of a Biphasic Dissolution Setup—Modelling of Biorelevant Kinetics for a Ritonavir Hot-Melt Extruded Amorphous Solid Dispersion


Abstract
:
1. Introduction
- Adding surfactant;
- Using large volumes or flow-through apparatus;
- Cosolvents;
- pH-adjustment.
2. Materials and Methods
2.1. Materials
2.2. HPLC Method
2.3. Equilibrium Solubility
2.4. pKa Determination of Ritonavir
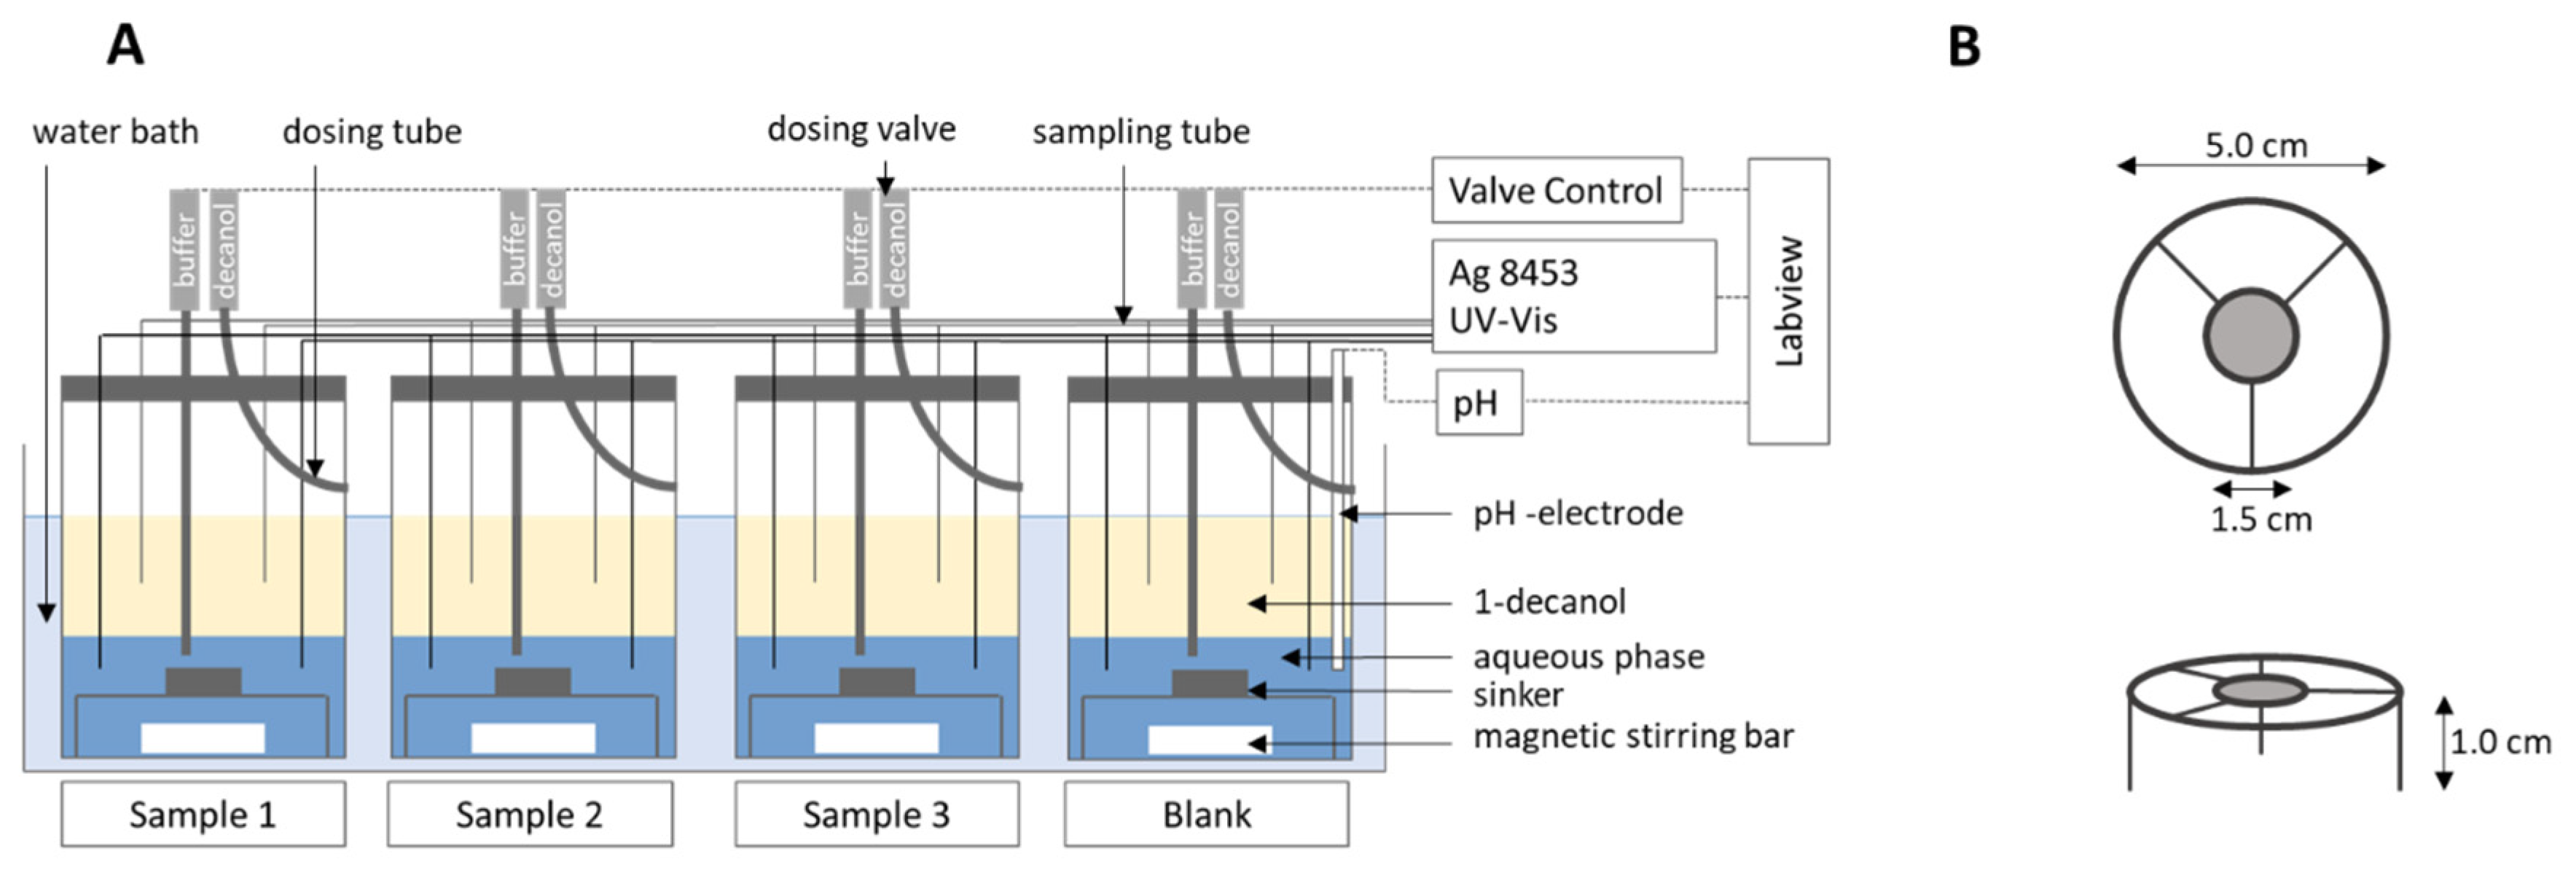
2.5. Fully Automated Biphasic Dissolution Apparatus (BiPHa+)
2.5.1. General Method Design
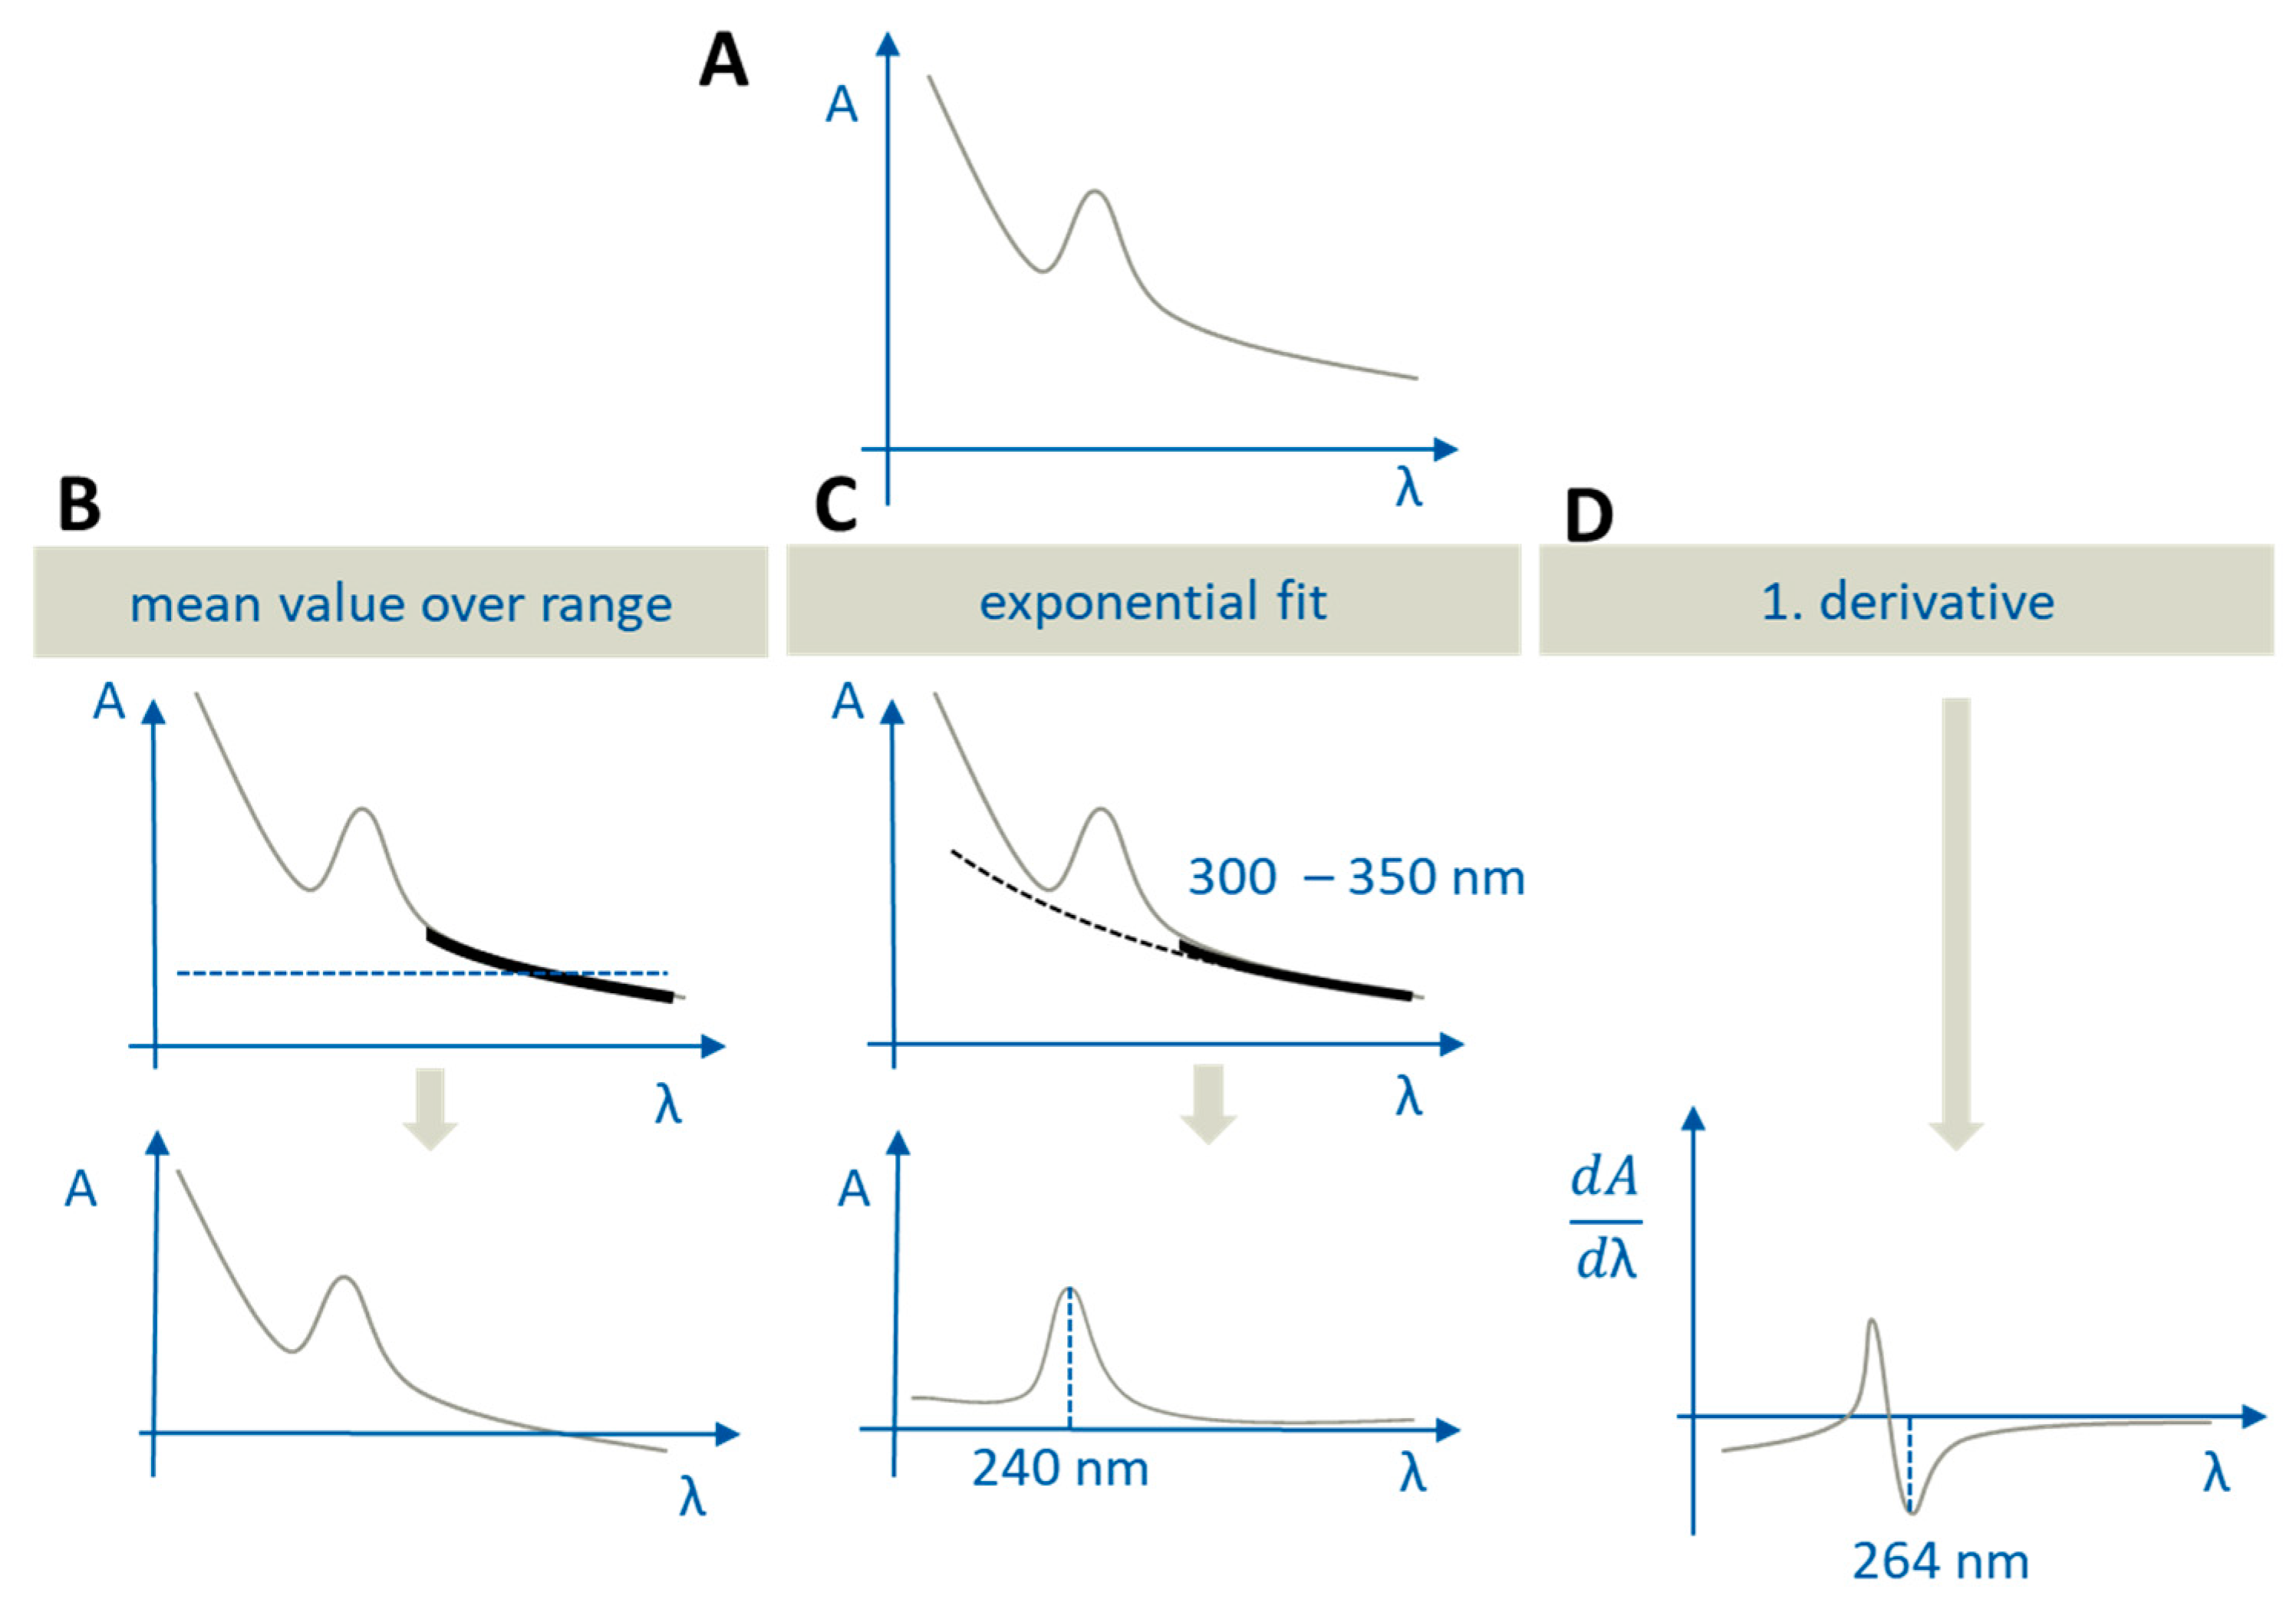
2.5.2. Quantification and Scattering Correction
- (a)
- In the aqueous phase, in order to perform scattering correction caused by precipitation or liquid–liquid phase separation (LLPS) of supersaturated solutions, formulation ingredients, or medium effects,
- (b)
- In the organic phase, in order to correct for an overlap of the absorption with partitioned excipient spectra.
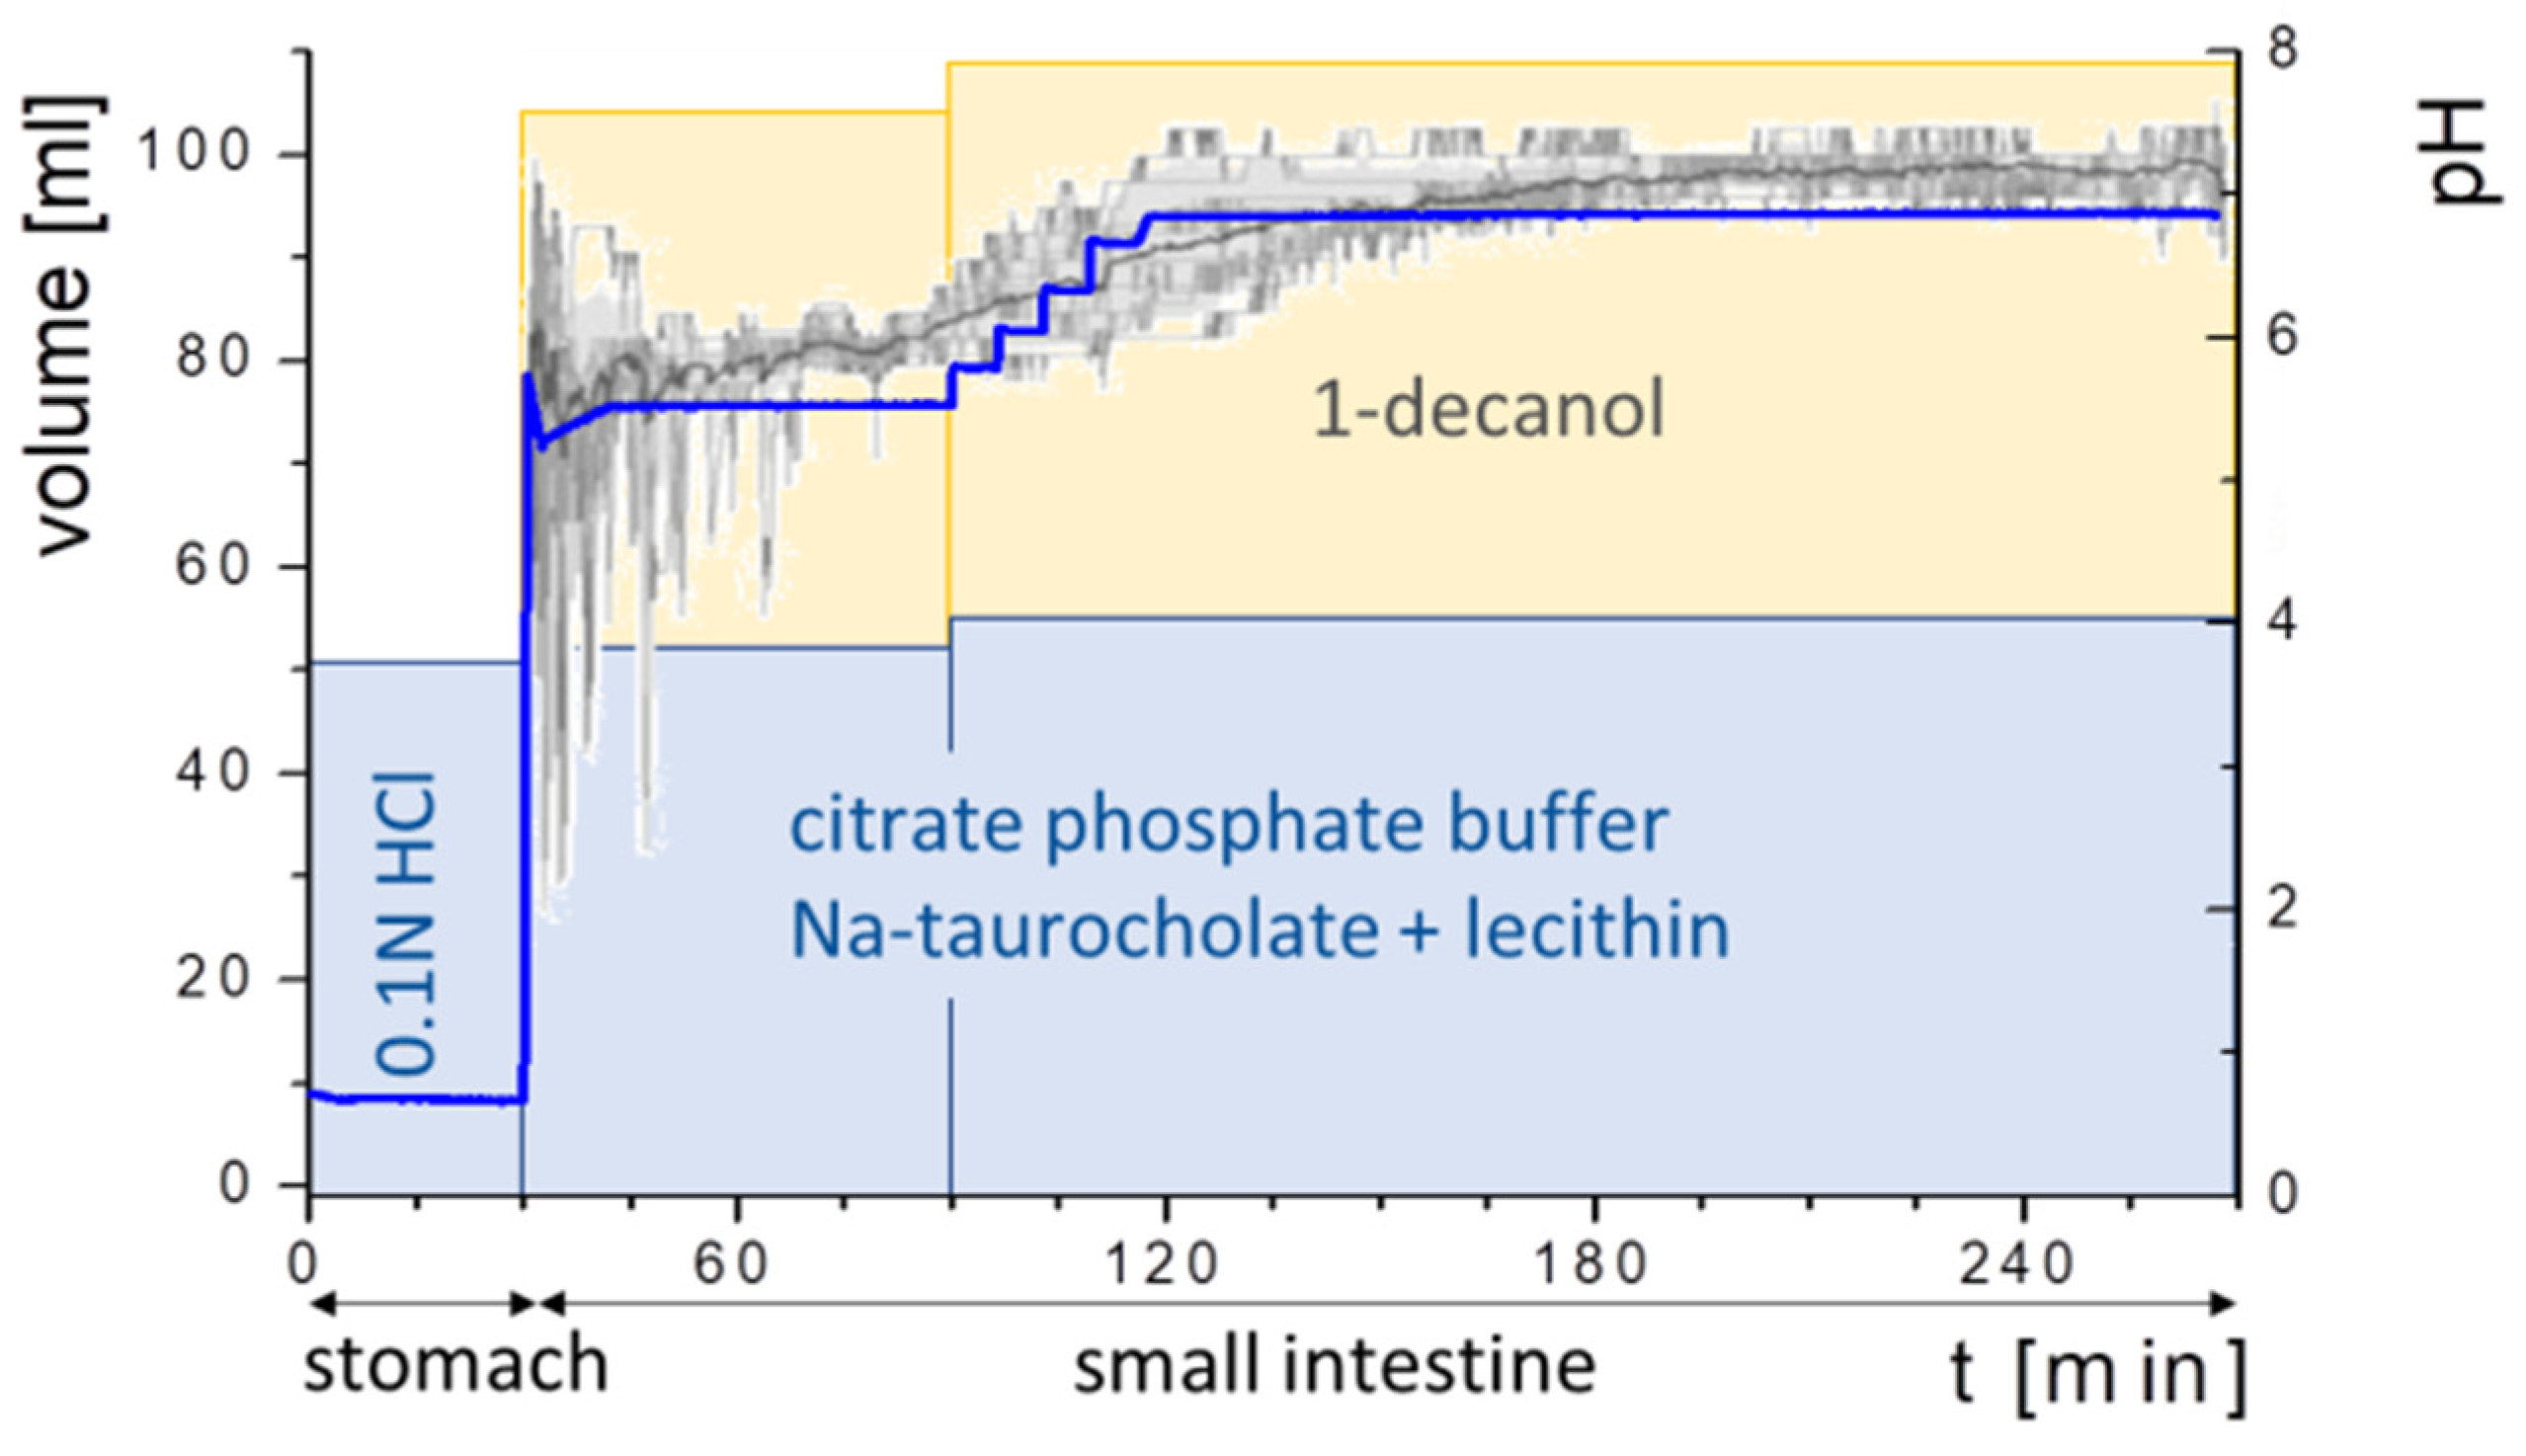
2.5.3. Buffer Design
- (a)
- Highly concentrated in order to minimize volume changes,
- (b)
- (c)
- Comparable osmolarity and buffer capacity to in vivo [23].
2.5.4. Addition of Bile Salts
- Bi-FaSSIF: pH-gradient with surfactant concentration of FaSSIF,
- Bi-FaSSIF-V2: pH-gradient with surfactant concentration of FaSSIF-V2,
- Buffer: pH-gradient without biorelevant surfactant.
2.5.5. Selection of Organic Medium
2.5.6. Experiment Sequence
2.6. Comparative Studies
2.6.1. Hydrodynamic Assessment
2.6.2. Comparison of the BiPHa+ Test with Established USP II/IV Biphasic Methods
2.7. Development of an Advanced Kinetic Model
3. Results and Discussion
3.1. Physiochemical Characterization
3.2. Buffer Development
3.3. Hydrodynamic Assessment
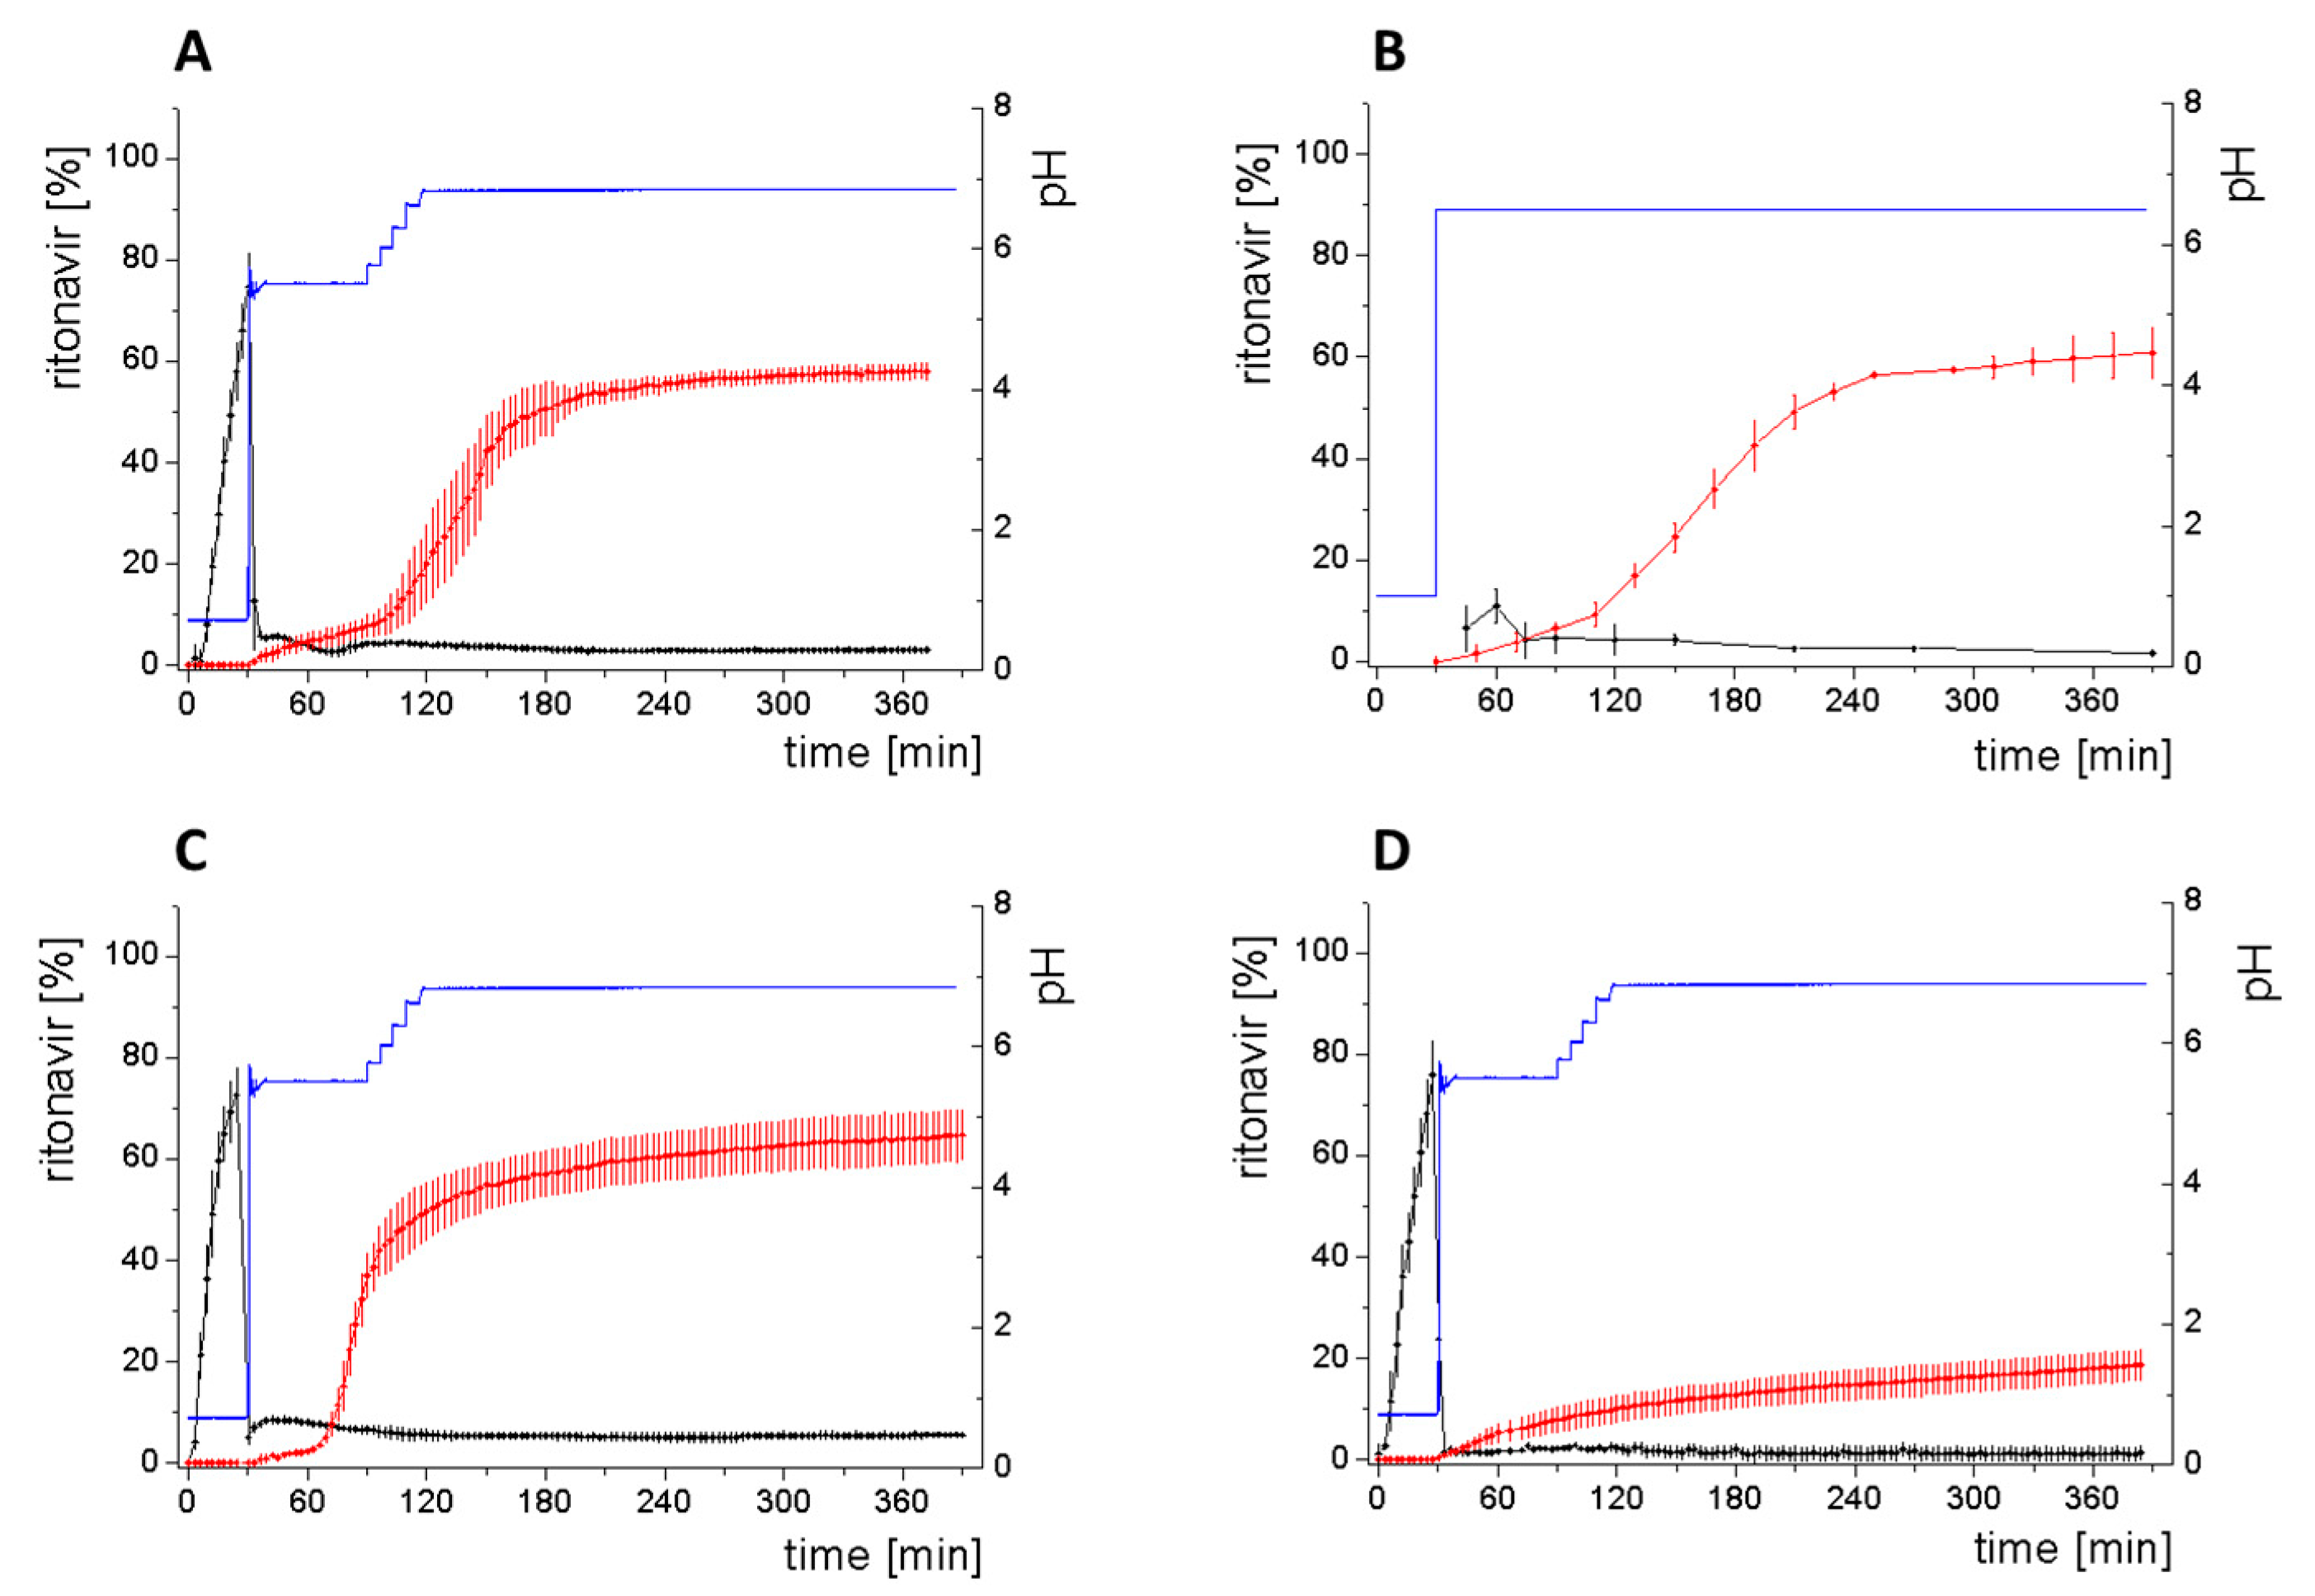
3.4. Comparison of All Dissolution Profiles
3.5. Kinetic Model
3.5.1. Physical Explanations of the Complex In Vitro Dissolution Kinetics for Ritonavir
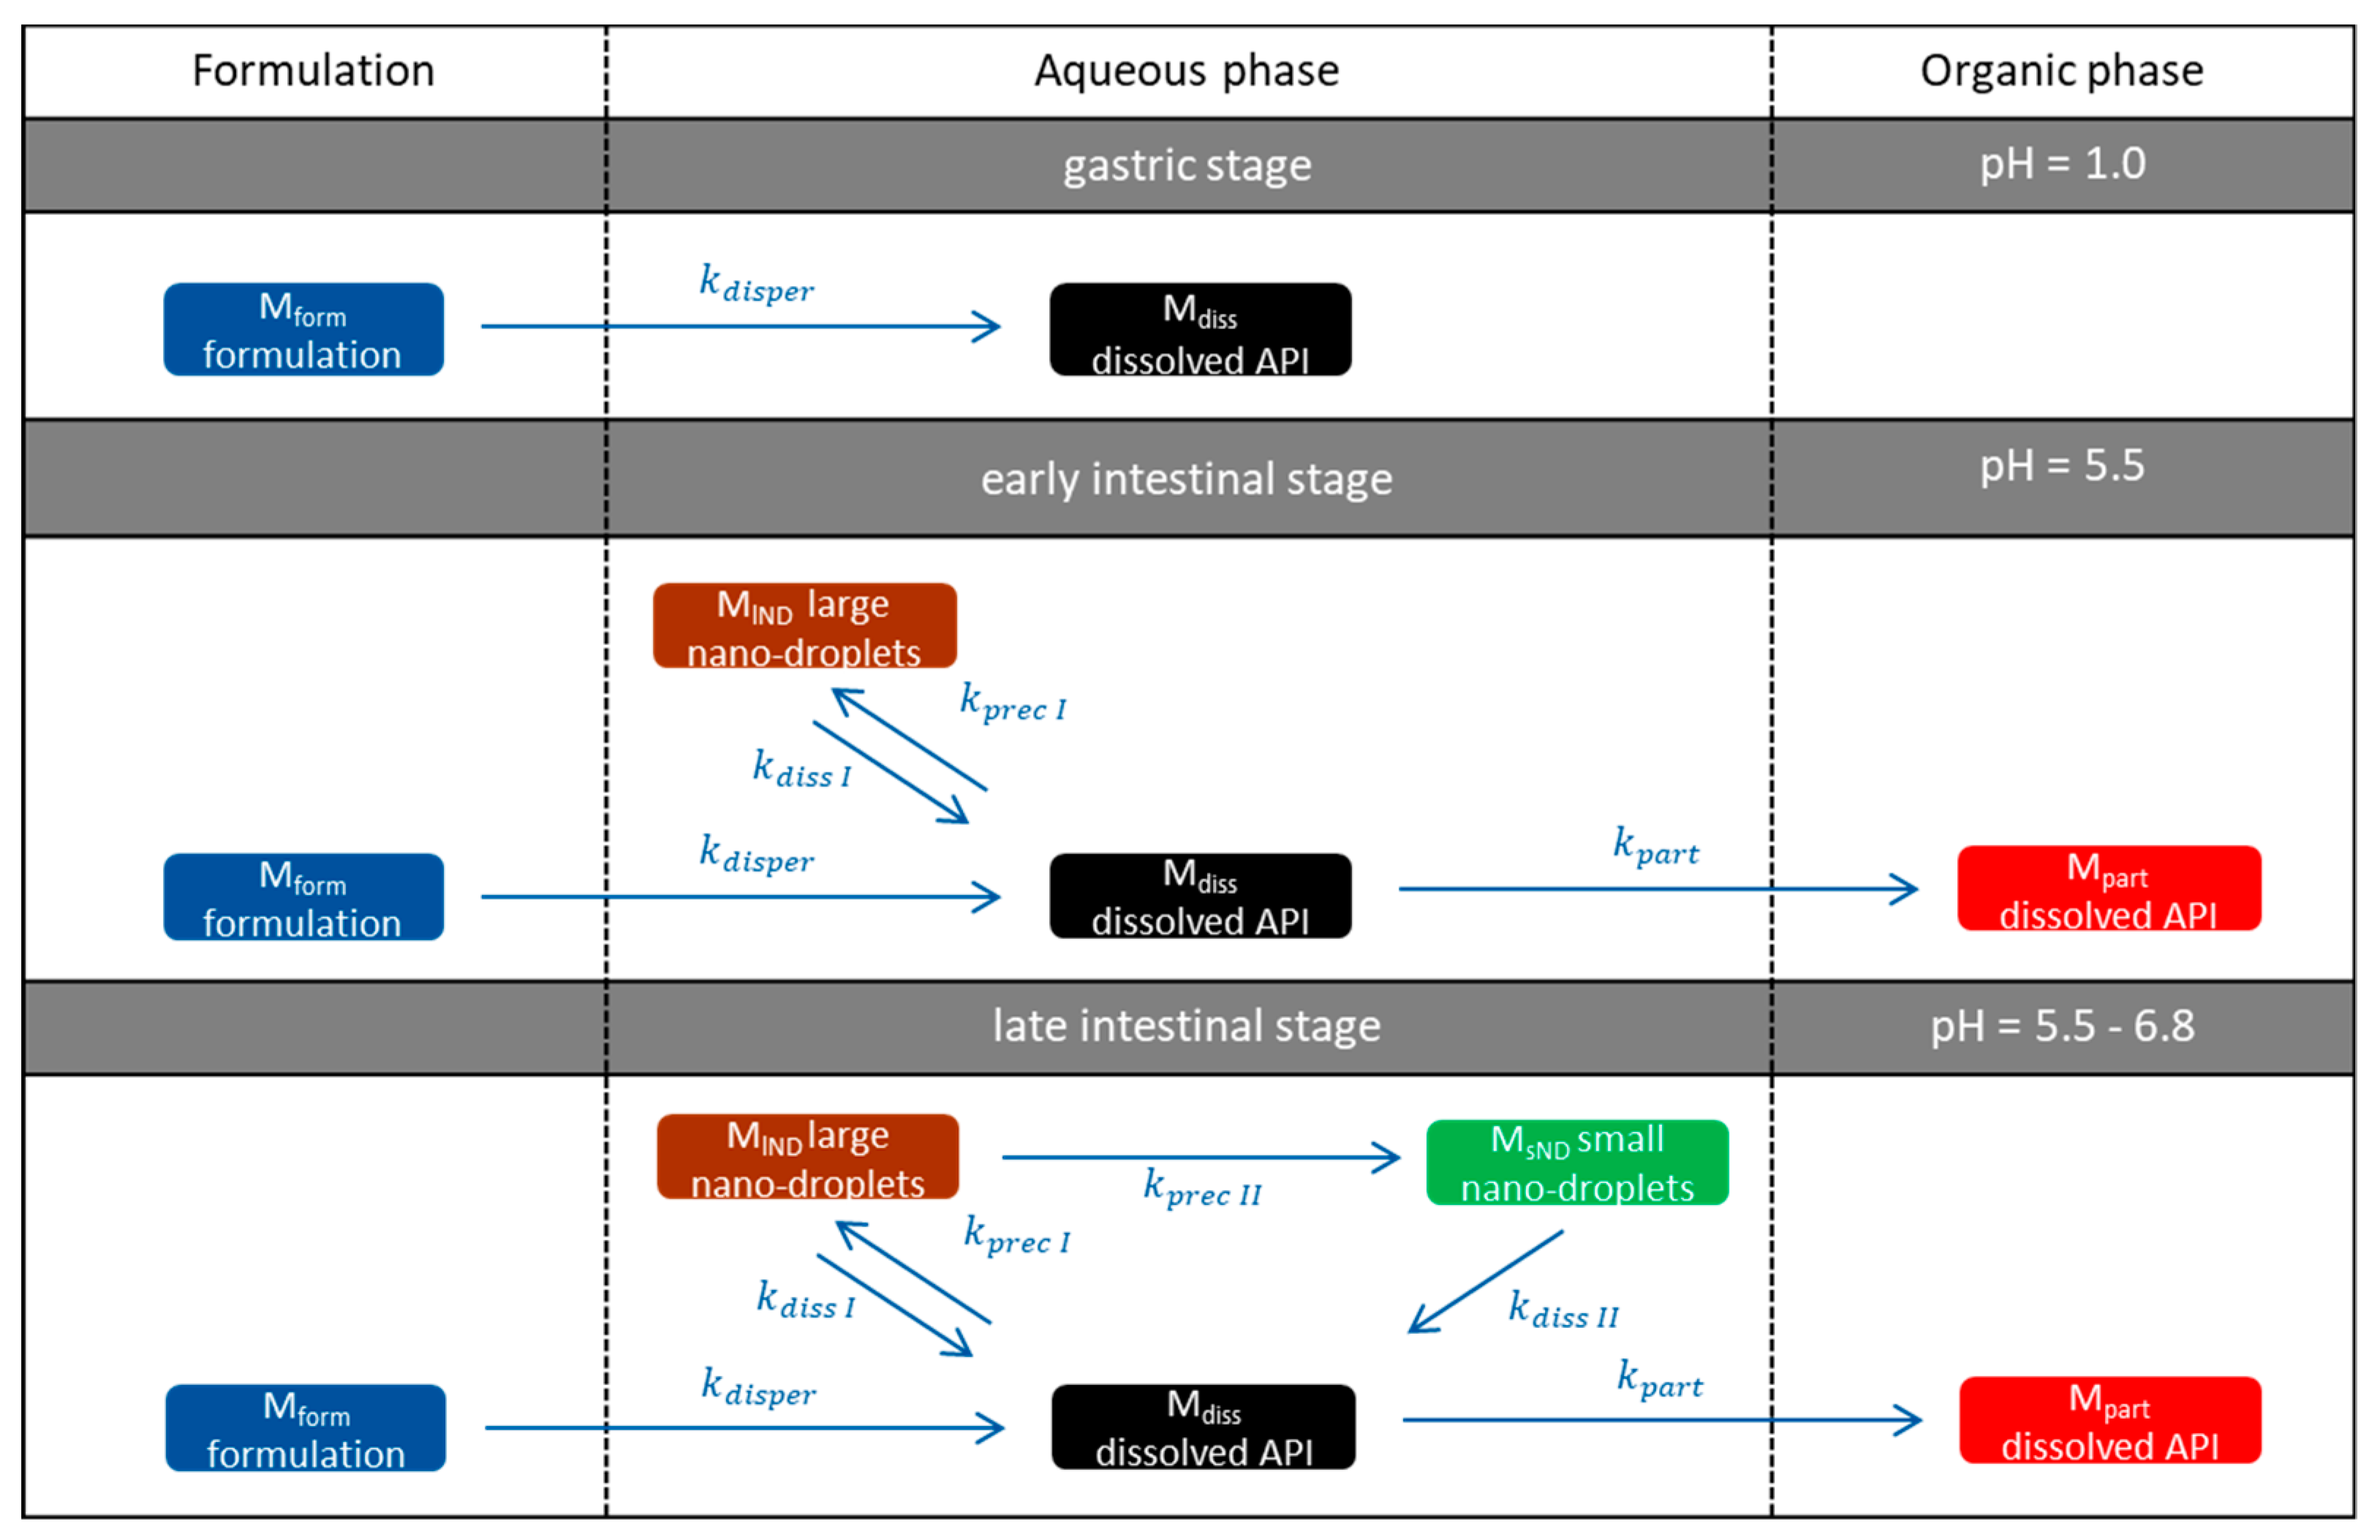
- Gastric stage—The ritonavir-containing ASD was tested for 30 min at pH 1.0 without the 1-decanol absorption layer. Upon contact with the dissolution medium the ritonavir-ASD disperses, API and excipients dissolve simultaneously [44], and a solution is generated. Dispersing of the ASD and dissolution of ritonavir are assumed as one irreversible step. Furthermore, it can be assumed that drug and polymer dissolve simultaneously for the given ritonavir-ASD at a drug load of 15% as demonstrated by Indulkar et al. [44].
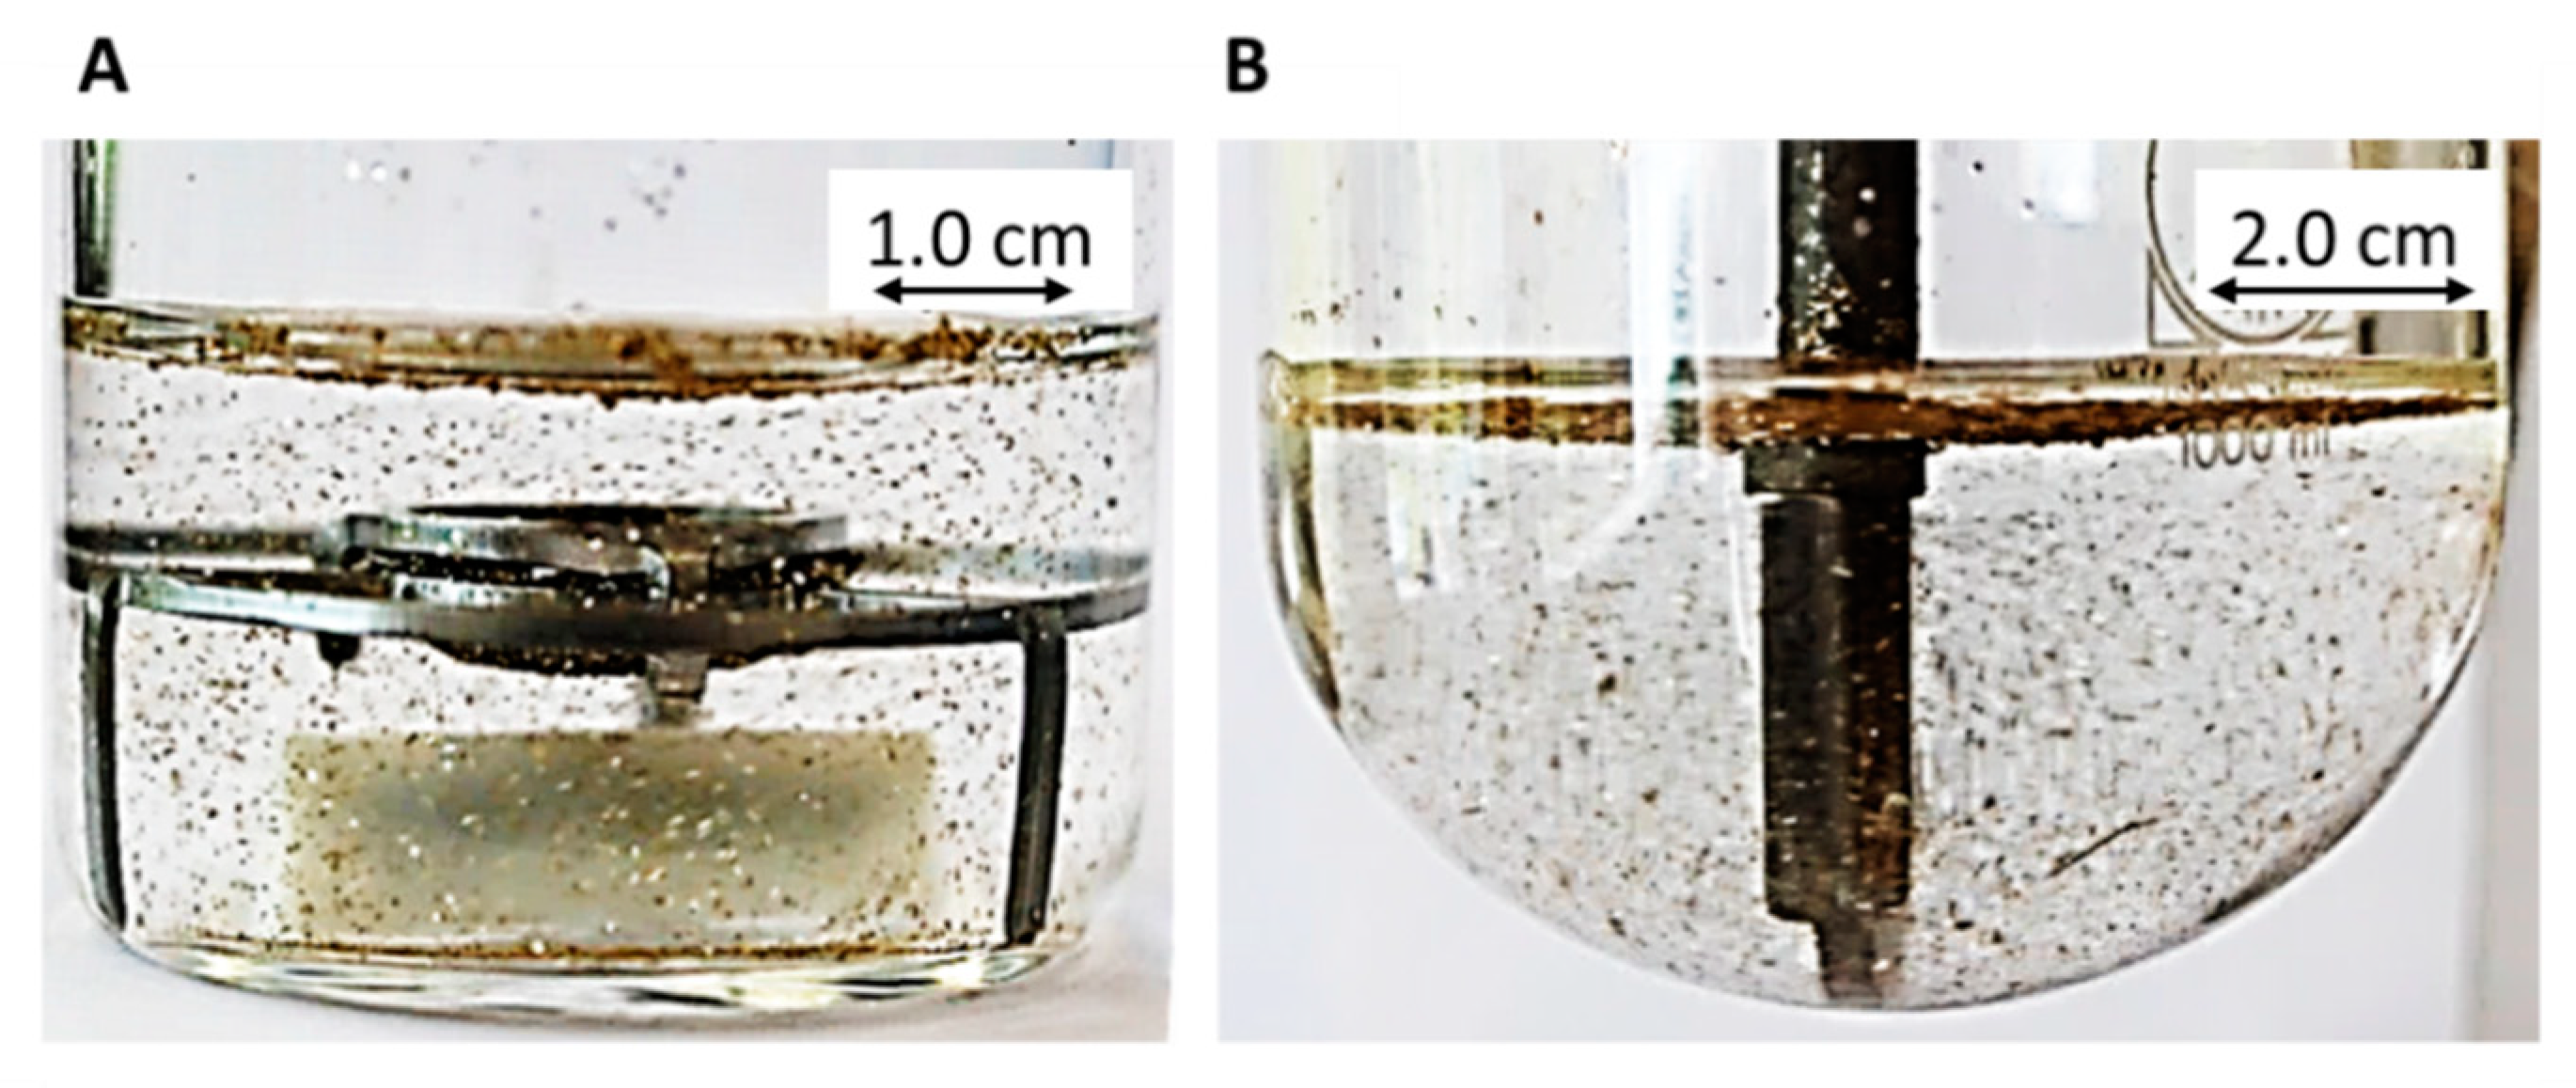
- Early intestinal stage—After covering the aqueous layer with 1-decanol and changing the pH from 1.0 to 5.5, a 2-compartment model for the simulated early intestine was applied (Figure 7). Liquid–liquid phase separation (LLPS) occurs from the solution, when crystallization is slow [41] and the amorphous solubility of the API is exceeded leading to the formation of nanosized API-rich nano-droplets [33,45].In the present kinetic model, the formation of the nano-droplets refers to the generation of the large nano-droplets as shown in Figure 8 and Figure 7. The ritonavir-rich nano-droplets provide a reservoir replenishing dissolved ritonavir that irreversibly partitioned into the organic layer [33,43,46,47].
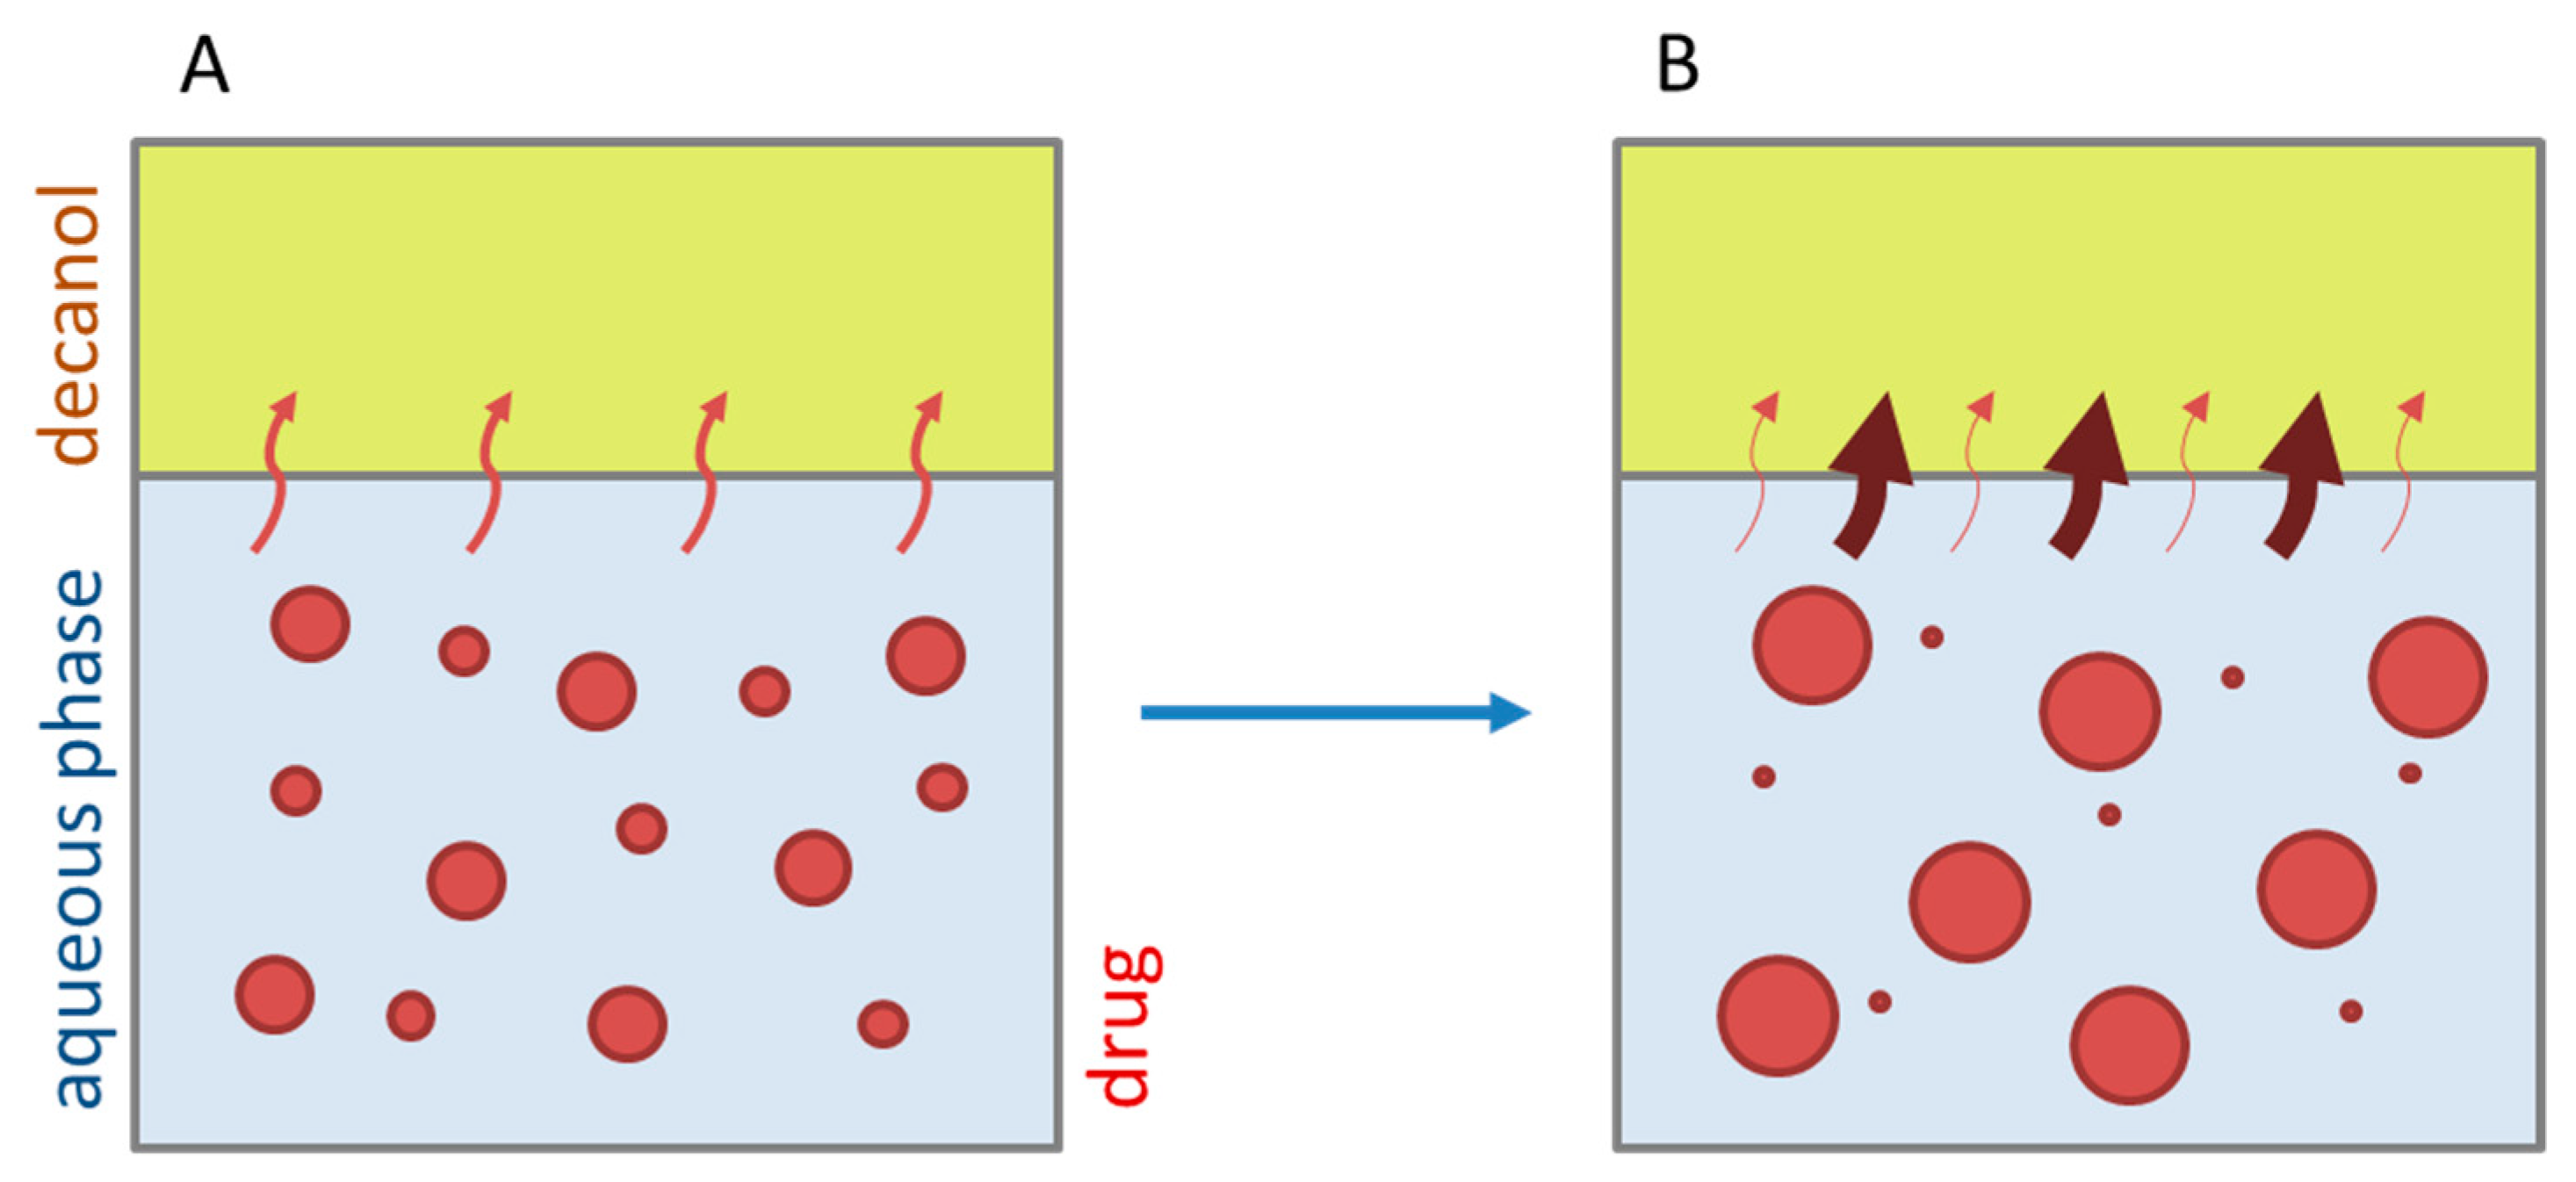
- Late intestinal stage—At the timepoint, where the partitioning of ritonavir into the organic phase substantially increases, the re-dissolution rate of ritonavir from the nano-droplets into the aqueous phase increases, while the particle size of the small nanoparticles decreases [48,49,50]. Furthermore, the particle size reduction can be further driven by Ostwald ripening of the nano-droplets [48] as also reported for nano-emulsions, which exhibit a typical size of 20 to 200 nm [51]. This is in the same size range as reported for the same ritonavir-ASD in a previous study [41,48]. The resulting dispersion formed in buffered aqueous medium contained particles at a mean diameter of approximately 60 nm in a monomodal particle size distribution [48]. Briefly, during the thermodynamically driven process of Ostwald ripening molecules on the surface of energetically unfavorable small particles (e.g., the API molecules from the nano-droplets) tend to detach from the particles and diffuse into the solution as free molecules generating a supersaturated solution. At the stage, where supersaturation is achieved, the free molecules have the tendency to condense on the surface of larger particles, or in our case, larger nano-droplets. Therefore, the smaller nano-droplets continue to shrink, while larger nano-droplets continue to grow as illustrated in Figure 8. While ritonavir is continuously removed by partitioning into the organic phase, the size of small nano-droplet decreases until they disappear. The continuously shrinking nano-droplets are described by forming small nano-droplets in the kinetic model (Figure 7). It is assumed that large nano-droplets and small nano-droplets lead to different kinetic properties in terms of the ritonavir dissolution from the nano-droplets due to their difference in particle size (Supplementary Materials).
- Mform: The undissolved ritonavir-ASD formulation,
- Mdiss: Dissolved ritonavir in the aqueous phase,
- MlND: Ritonavir-rich nano-droplets,
- MsND: Small, shrunken ritonavir-rich nano-droplets,
- Mpart: Dissolved ritonavir in the organic phase.
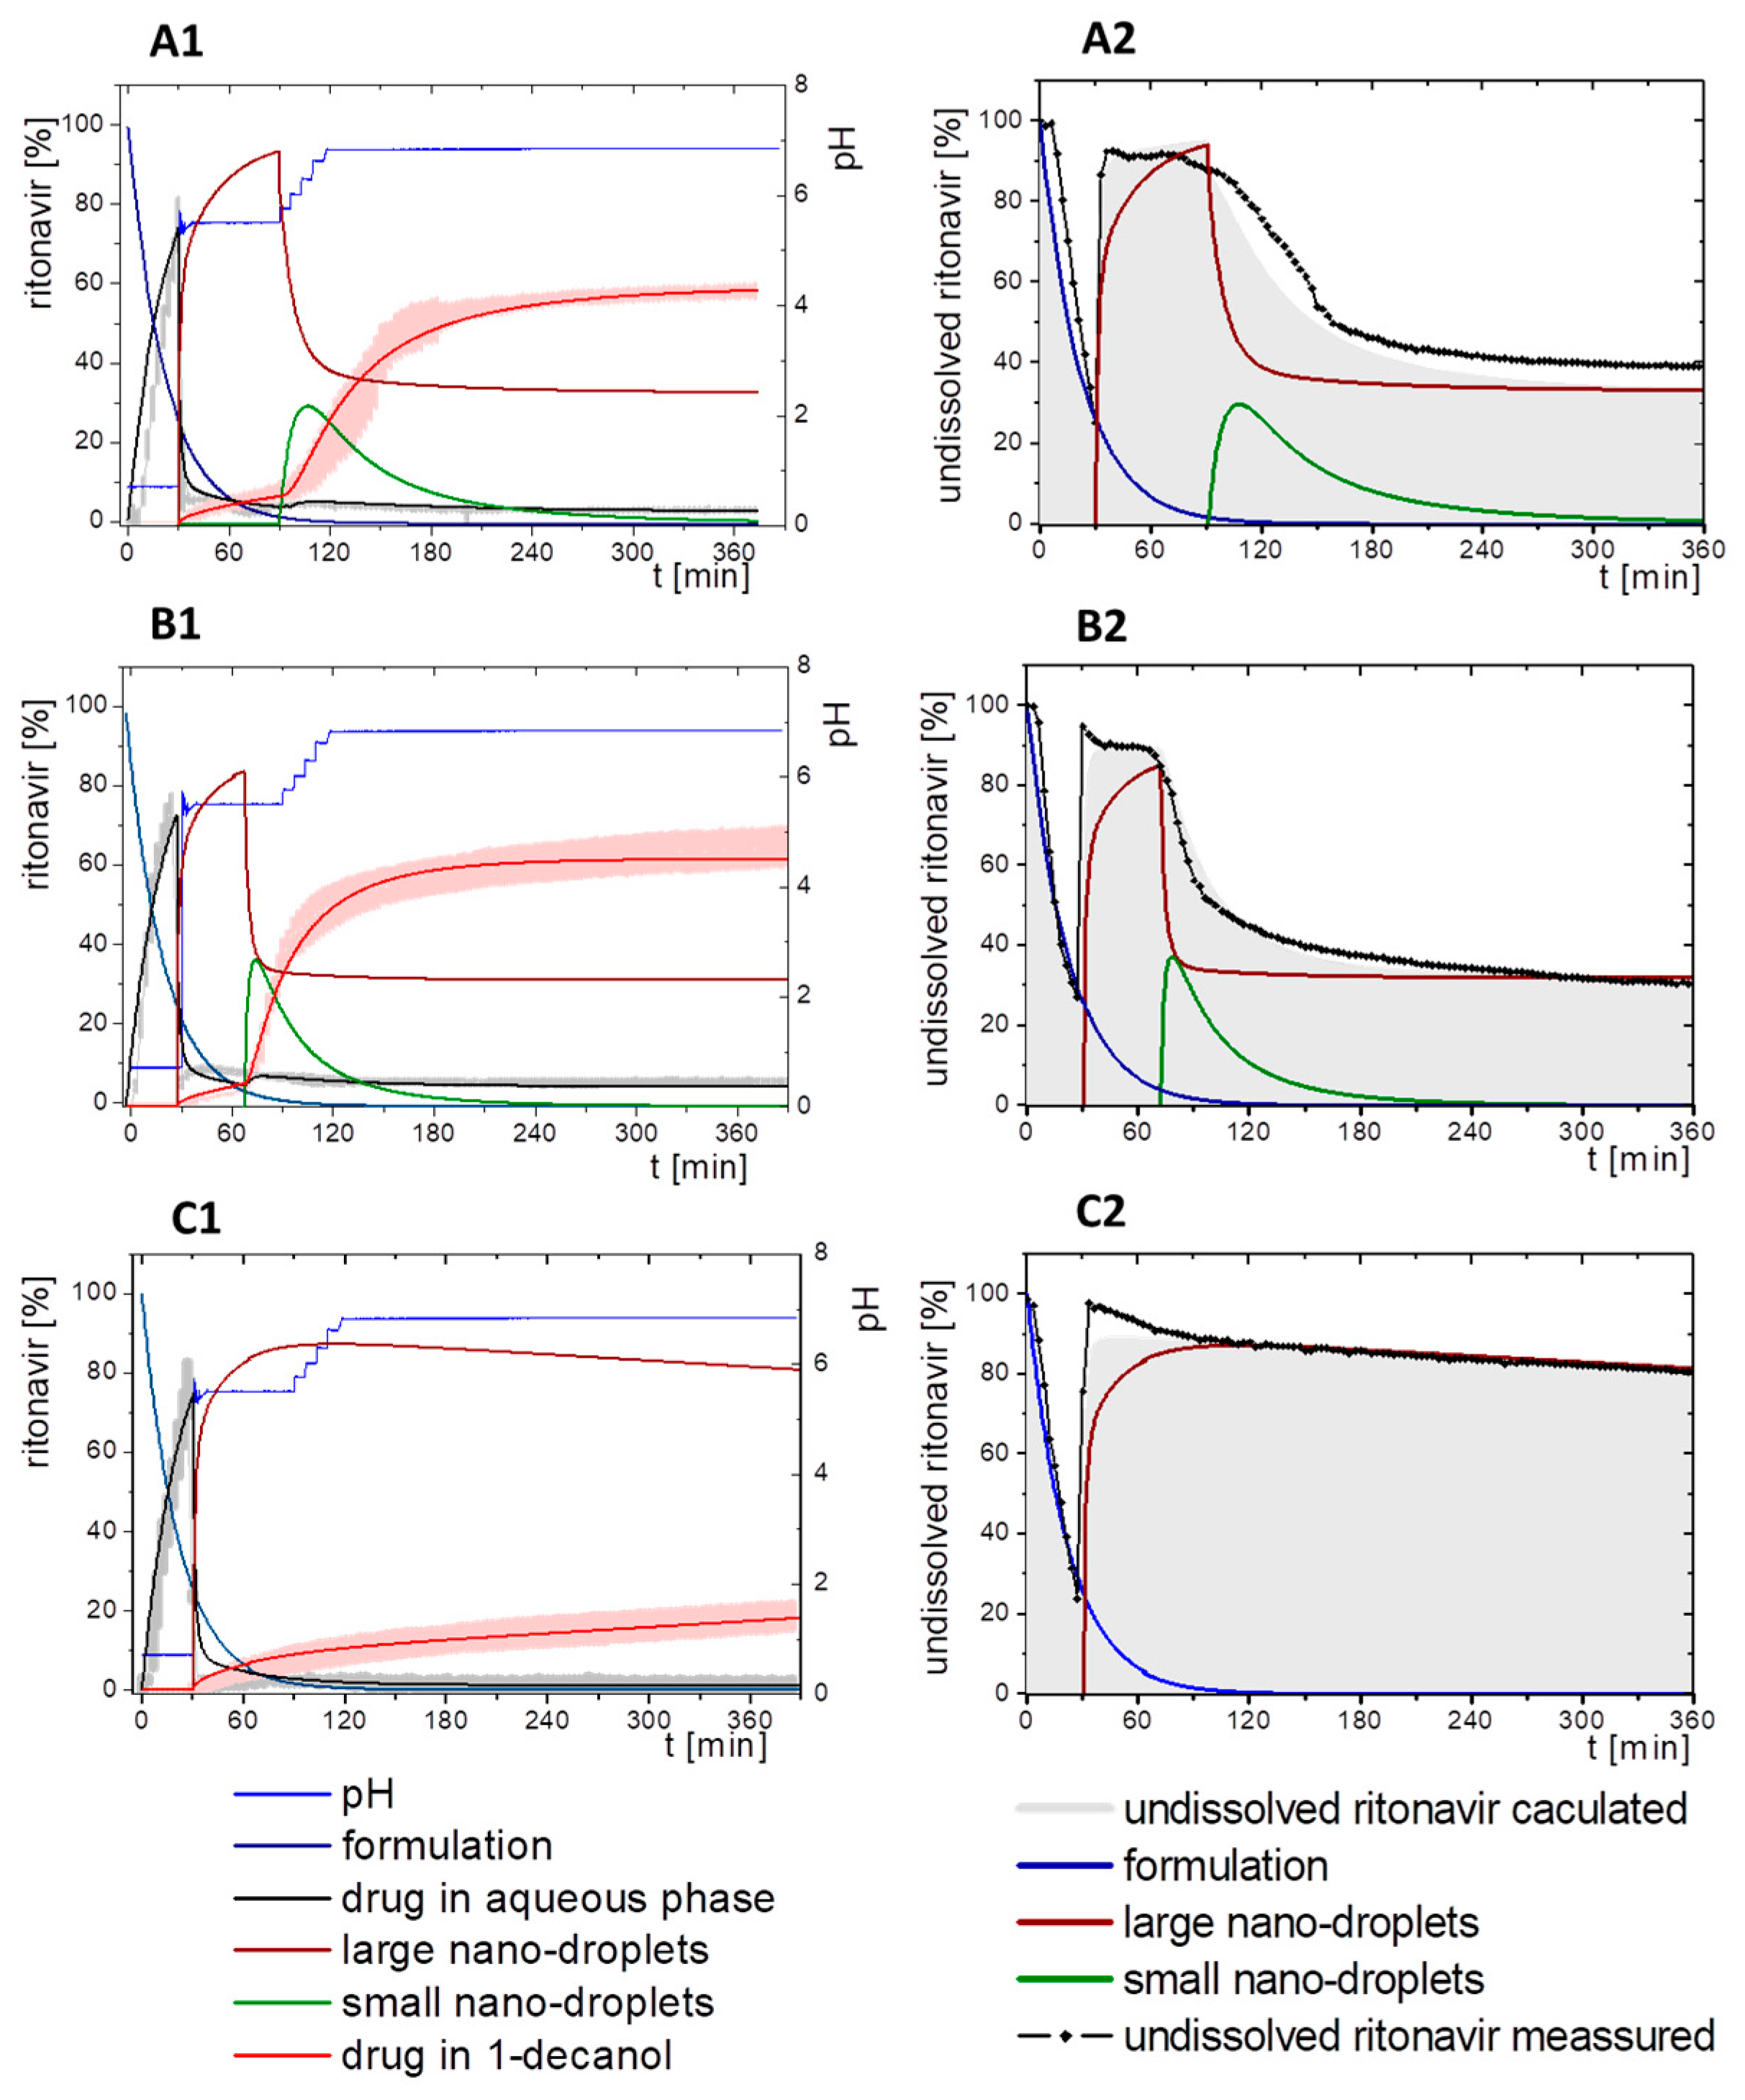
3.5.2. In-Silico Model Fitting of Ritonavir In Vitro Dissolution and Partitioning Kinetics
4. Conclusions
Supplementary Materials
Author Contributions
Funding
Acknowledgments
Conflicts of Interest
References
- Tong, C.; Lozano, R.; Mao, Y.; Mirza, T.; Löbenberg, R.; Nickerson, B.; Gray, V.; Wang, Q. The value of in vitro dissolution in drug development: A position paper from the AAPS in vitro release and dissolution focus group. Pharm. Technol. 2009, 33, 52–64. [Google Scholar]
- Grady, H.; Elder, D.; Webster, G.K.; Mao, Y.; Lin, Y.; Flanagan, T.; Mann, J.; Blanchard, A.; Cohen, M.J.; Lin, J.; et al. Industry’s View on Using Quality Control, Biorelevant, and Clinically Relevant Dissolution Tests for Pharmaceutical Development, Registration, and Commercialization. J. Pharm. Sci. 2018, 107, 34–41. [Google Scholar] [CrossRef] [PubMed] [Green Version]
- Phillips, D.J.; Pygall, S.R.; Cooper, V.B.; Mann, J.C. Overcoming sink limitations in dissolution testing: A review of traditional methods and the potential utility of biphasic systems: Dissolution testing: Biphasic systems. J. Pharm. Pharmacol. 2012, 64, 1549–1559. [Google Scholar] [CrossRef] [PubMed]
- Allaboun, H.; Alkhamis, K.A.; Al Jbour, N.D. Effect of surfactant on dissolution of spherical particles in micellar systems. Eur. J. Pharm. Biopharm. 2007, 65, 188–197. [Google Scholar] [CrossRef] [PubMed]
- Heng, P.W.S.; Wan, L.S.C.; Ang, T.S.H. Role of Surfactant on Drug Release from Tablets. Drug Dev. Ind. Pharm. 1990, 16, 951–962. [Google Scholar] [CrossRef]
- El-Massik, M.A.; Darwish, I.A.; Hassan, E.E.; El-Khordagui, L.K. Development of a dissolution medium for glibenclamide. Int. J. Pharm. 1996, 140, 69–76. [Google Scholar] [CrossRef]
- Sironi, D.; Rosenberg, J.; Bauer-Brandl, A.; Brandl, M. PermeaLoopTM, a novel in vitro tool for small-scale drug-dissolution/permeation studies. J. Pharm. Biomed. Anal. 2018, 156, 247–251. [Google Scholar] [CrossRef]
- Gao, Y.; Carr, R.A.; Spence, J.K.; Wang, W.W.; Turner, T.M.; Lipari, J.M.; Miller, J.M. A pH-Dilution Method for Estimation of Biorelevant Drug Solubility along the Gastrointestinal Tract: Application to Physiologically Based Pharmacokinetic Modeling. Mol. Pharm. 2010, 7, 1516–1526. [Google Scholar] [CrossRef]
- Polster, C.S.; Atassi, F.; Wu, S.-J.; Sperry, D.C. Use of Artificial Stomach−Duodenum Model for Investigation of Dosing Fluid Effect on Clinical Trial Variability. Mol. Pharm. 2010, 7, 1533–1538. [Google Scholar] [CrossRef]
- Pestieau, A.; Evrard, B. In vitro biphasic dissolution tests and their suitability for establishing in vitro-in vivo correlations: A historical review. Eur. J. Pharm. Sci. 2017, 102, 203–219. [Google Scholar] [CrossRef]
- Thiry, J.; Broze, G.; Pestieau, A.; Tatton, A.S.; Baumans, F.; Damblon, C.; Krier, F.; Evrard, B. Investigation of a suitable in vitro dissolution test for itraconazole-based solid dispersions. Eur. J. Pharm. Sci. 2016, 85, 94–105. [Google Scholar] [CrossRef] [PubMed]
- Xu, H.; Shi, Y.; Vela, S.; Marroum, P.; Gao, P. Developing Quantitative In Vitro – In Vivo Correlation for Fenofibrate Immediate-Release Formulations With the Biphasic Dissolution-Partition Test Method. J. Pharm. Sci. 2018, 107, 476–487. [Google Scholar] [CrossRef] [PubMed] [Green Version]
- Locher, K.; Borghardt, J.M.; Frank, K.J.; Kloft, C.; Wagner, K.G. Evolution of a mini-scale biphasic dissolution model: Impact of model parameters on partitioning of dissolved API and modelling of in vivo-relevant kinetics. Eur. J. Pharm. Biopharm. 2016, 105, 166–175. [Google Scholar] [CrossRef] [PubMed]
- Heigoldt, U.; Sommer, F.; Daniels, R.; Wagner, K.-G. Predicting in vivo absorption behavior of oral modified release dosage forms containing pH-dependent poorly soluble drugs using a novel pH-adjusted biphasic in vitro dissolution test. Eur. J. Pharm. Biopharm. 2010, 76, 105–111. [Google Scholar] [CrossRef] [PubMed]
- Bevernage, J.; Brouwers, J.; Brewster, M.E.; Augustijns, P. Evaluation of gastrointestinal drug supersaturation and precipitation: Strategies and issues. Int. J. Pharm. 2013, 453, 25–35. [Google Scholar] [CrossRef]
- Blanquet, S.; Zeijdner, E.; Beyssac, E.; Meunier, J.-P.; Denis, S.; Havenaar, R.; Alric, M. A Dynamic Artificial Gastrointestinal System for Studying the Behavior of Orally Administered Drug Dosage Forms Under Various Physiological Conditions. Pharm. Res. 2004, 21, 585–591. [Google Scholar] [CrossRef]
- Mudie, D.M.; Shi, Y.; Ping, H.; Gao, P.; Amidon, G.L.; Amidon, G.E. Mechanistic analysis of solute transport in an in vitro physiological two-phase dissolution apparatus. Biopharm. Drug Dispos. 2012, 33, 378–402. [Google Scholar] [CrossRef] [PubMed] [Green Version]
- Todaro, V.; Persoons, T.; Grove, G.; Healy, A.M.; D’Arcy, D.M. Characterization and Simulation of Hydrodynamics in the Paddle, Basket and Flow-Through Dissolution Testing Apparatuses—A Review. Dissolution Technol. 2017, 24, 24–36. [Google Scholar] [CrossRef]
- Locher, K.; Borghardt, J.M.; Wachtel, H.; Schaefer, K.J.; Wagner, K.G. Mechanistic study on hydrodynamics in the mini-scale biphasic dissolution model and its influence on in vitro dissolution and partitioning. Eur. J. Pharm. Sci. 2018, 124, 328–338. [Google Scholar] [CrossRef]
- Schönherr, D.; Wollatz, U.; Haznar-Garbacz, D.; Hanke, U.; Box, K.J.; Taylor, R.; Ruiz, R.; Beato, S.; Becker, D.; Weitschies, W. Characterisation of selected active agents regarding pKa values, solubility concentrations and pH profiles by SiriusT3. Eur. J. Pharm. Biopharm. 2015, 92, 155–170. [Google Scholar] [CrossRef]
- Owen, T. Fundamentals of UV-Visible Spectroscopy: A Primer; Agilent Technologies: Santa Clara, CA, USA, 2000. [Google Scholar]
- Koziolek, M.; Grimm, M.; Becker, D.; Iordanov, V.; Zou, H.; Shimizu, J.; Wanke, C.; Garbacz, G.; Weitschies, W. Investigation of pH and Temperature Profiles in the GI Tract of Fasted Human Subjects Using the Intellicap® System. J. Pharm. Sci. 2015, 104, 2855–2863. [Google Scholar] [CrossRef] [PubMed]
- Dressman, J.B.; Amidon, G.L.; Reppas, C.; Shah, V.P. Dissolution Testing as a Prognostic Tool for Oral Drug Absorption: Immediate Release Dosage Forms. Pharm. Res. 1998, 15, 11–22. [Google Scholar] [CrossRef] [PubMed] [Green Version]
- Boni, J.E.; Brickl, R.S.; Dressman, J. Is bicarbonate buffer suitable as a dissolution medium? J. Pharm. Pharmacol. 2007, 59, 1375–1382. [Google Scholar] [CrossRef] [PubMed]
- McIlvaine, T.C. A Buffer Solution for Colorimetric Comparison. J. Biol. Chem. 1921, 49, 183–186. [Google Scholar]
- Fuchs, A.; Dressman, J.B. Composition and Physicochemical Properties of Fasted-State Human Duodenal and Jejunal Fluid: A Critical Evaluation of the Available Data. J. Pharm. Sci. 2014, 103, 3398–3411. [Google Scholar] [CrossRef]
- Bloch, H.M.; Thornton, J.R.; Heaton, K.W. Effects of fasting on the composition of gallbladder bile. Gut 1980, 21, 1087–1089. [Google Scholar] [CrossRef] [Green Version]
- Marques, M. Dissolution Media Simulating Fasted and Fed States. Dissolution Technol. 2004, 11, 16–19. [Google Scholar] [CrossRef]
- Markopoulos, C.; Andreas, C.J.; Vertzoni, M.; Dressman, J.; Reppas, C. In-vitro simulation of luminal conditions for evaluation of performance of oral drug products: Choosing the appropriate test media. Eur. J. Pharm. Biopharm. 2015, 93, 173–182. [Google Scholar] [CrossRef]
- Grundy, J.S.; Anderson, K.E.; Rogers, J.A.; Foster, R.T. Studies on dissolution testing of the nifedipine gastrointestinal therapeutic system. I. Description of a two-phase in vitro dissolution test. J. Control. Release 1997, 48, 1–8. [Google Scholar] [CrossRef]
- Smith, R.N.; Hansch, C.; Ames, M.M. Selection of a reference partitioning system for drug design work. J. Pharm. Sci. 1975, 64, 599–606. [Google Scholar] [CrossRef]
- Kinoshita, K.; Ishikawa, H.; Shinoda, K. Solubility of Alcohols in Water Determined the Surface Tension Measurements. Bull. Chem. Soc. Jpn. 1958, 31, 1081–1082. [Google Scholar] [CrossRef] [Green Version]
- Xu, H.; Vela, S.; Shi, Y.; Marroum, P.; Gao, P. In Vitro Characterization of Ritonavir Drug Products and Correlation to Human in Vivo Performance. Mol. Pharm. 2017, 14, 3801–3814. [Google Scholar] [CrossRef] [PubMed]
- Frank, K.J.; Locher, K.; Zecevic, D.E.; Fleth, J.; Wagner, K.G. In vivo predictive mini-scale dissolution for weak bases: Advantages of pH-shift in combination with an absorptive compartment. Eur. J. Pharm. Sci. 2014, 61, 32–39. [Google Scholar] [CrossRef] [PubMed]
- Pestieau, A.; Lebrun, S.; Cahay, B.; Brouwers, A.; Streel, B.; Cardot, J.-M.; Evrard, B. Evaluation of different in vitro dissolution tests based on level A in vitro–in vivo correlations for fenofibrate self-emulsifying lipid-based formulations. Eur. J. Pharm. Biopharm. 2017, 112, 18–29. [Google Scholar] [CrossRef] [PubMed]
- Xu, H.; Krakow, S.; Shi, Y.; Rosenberg, J.; Gao, P. In vitro characterization of ritonavir formulations and correlation to in vivo performance in dogs. Eur. J. Pharm. Sci. Off. J. Eur. Fed. Pharm. Sci. 2018, 115, 286–295. [Google Scholar] [CrossRef] [PubMed]
- AbbVie Ltd. Fachinformation Norvir 100mg Filmtablette 2017. Available online: https://www.patienteninfo-service.de/a-z-liste/n/norvir-100-mg-filmtabletten/ (accessed on 5 March 2020).
- McMahon, W.; Birdsall, H.A.; Johnson, G.R.; Camilli, C.T. Degradation Studies of Polyethylene Terephthalate. J. Chem. Eng. Data 1959, 4, 57–79. [Google Scholar] [CrossRef]
- Shi, Y.; Gao, P.; Gong, Y.; Ping, H. Application of a Biphasic Test for Characterization of In Vitro Drug Release of Immediate Release Formulations of Celecoxib and Its Relevance to In Vivo Absorption. Mol. Pharm. 2010, 7, 1458–1465. [Google Scholar] [CrossRef]
- Mitchell, M.; Muftakhidinov, B.; Winchen, T. Engauge Digitizer Software. 2018. Available online: http://markummitchell.github.io/engauge-digitizer/ (accessed on 5 March 2020).
- Sun, Y.; Deac, A.; Zhang, G.G.Z. Assessing Physical Stability of Colloidal Dispersions Using a Turbiscan Optical Analyzer. Mol. Pharm. 2019, 16, 877–885. [Google Scholar] [CrossRef]
- Law, D.; Schmitt, E.A.; Marsh, K.C.; Everitt, E.A.; Wang, W.; Fort, J.J.; Krill, S.L.; Qiu, Y. Ritonavir–PEG 8000Amorphous Solid Dispersions: In vitro and In vivo Evaluations. J. Pharm. Sci. 2004, 93, 563–570. [Google Scholar] [CrossRef]
- Taylor, L.S.; Zhang, G.G.Z. Physical chemistry of supersaturated solutions and implications for oral absorption. Adv. Drug Deliv. Rev. 2016, 101, 122–142. [Google Scholar] [CrossRef]
- Indulkar, A.S.; Lou, X.; Zhang, G.G.Z.; Taylor, L.S. Insights into the Dissolution Mechanism of Ritonavir–Copovidone Amorphous Solid Dispersions: Importance of Congruent Release for Enhanced Performance. Mol. Pharm. 2019, 16, 1327–1339. [Google Scholar] [CrossRef] [PubMed]
- Frank, K.J.; Westedt, U.; Rosenblatt, K.M.; Hölig, P.; Rosenberg, J.; Mägerlein, M.; Fricker, G.; Brandl, M. The amorphous solid dispersion of the poorly soluble ABT-102 forms nano/microparticulate structures in aqueous medium: Impact on solubility. Int. J. Nanomed. 2012, 7, 5757–5768. [Google Scholar]
- Ilevbare, G.A.; Taylor, L.S. Liquid–Liquid Phase Separation in Highly Supersaturated Aqueous Solutions of Poorly Water-Soluble Drugs: Implications for Solubility Enhancing Formulations. Cryst. Growth Des. 2013, 13, 1497–1509. [Google Scholar] [CrossRef]
- Deneau, E.; Steele, G. An In-Line Study of Oiling Out and Crystallization. Org. Process Res. Dev. 2005, 9, 943–950. [Google Scholar] [CrossRef]
- Tho, I.; Liepold, B.; Rosenberg, J.; Maegerlein, M.; Brandl, M.; Fricker, G. Formation of nano/micro-dispersions with improved dissolution properties upon dispersion of ritonavir melt extrudate in aqueous media. Eur. J. Pharm. Sci. 2010, 40, 25–32. [Google Scholar] [CrossRef]
- Ely, D.R.; Edwin García, R.; Thommes, M. Ostwald–Freundlich diffusion-limited dissolution kinetics of nanoparticles. Powder Technol. 2014, 257, 120–123. [Google Scholar] [CrossRef]
- Tadros, T.F. Nanodispersions; De Gruyter Graduate: Berlin, Germany, 2016. [Google Scholar]
- Solans, C.; Izquierdo, P.; Nolla, J.; Azemar, N.; Garciacelma, M. Nano-emulsions. Curr. Opin. Colloid Interface Sci. 2005, 10, 102–110. [Google Scholar] [CrossRef]
- Pahomi, G.; Corlan, G.; Sandulovici, R. Study of the influence of bile salts and lecithin on distribution of ketoconazole between plasma and methylene chloride. Farmacia 2012, 60, 13. [Google Scholar]
- Xu, H.; Wang, W.; Shi, Y.; Gao, P. Characterization of the Partition Rate of Ibuprofen Across the Water-Octanol Interface and the Influence of Common Pharmaceutical Excipients. J. Pharm. Sci. 2019, 108, 525–537. [Google Scholar] [CrossRef] [Green Version]


| Component | McIlvaine | Human | |||
|---|---|---|---|---|---|
| Citrate | Phosphate | Carbonate | Phosphate | Organic Acid | |
| 2.2 | 2.2 | ||||
| 3.1 | 3.5 | ||||
| pKa | 4.8 | ≈5 | |||
| 6.4 | 6.4 | ||||
| 7.2 | 7.2 | ||||
| 12.2 | 10.3 | 12.2 | |||
| BiPHa+ | USP II/IV Biphasic Method [33] | |
|---|---|---|
| Radius | ||
| Mixing | Magnetic stirrer | Paddle |
| (Biphasic) Vessel | Cylindric vessel | USP II vessel |
| Parameter | Value |
|---|---|
| pKa 1 | 1.9 |
| pKa 2 | 2.5 |
| s (0.1N HCl) [µg/mL] | 382.8 |
| s (6.8N Buffer) [µg/mL] | 0.96 |
| s (FaSSIF-V2) [µg/mL] | 4.3 |
| LLPS [µg/mL] | 40 [33] |
| s (1-decanol) [mg/mL] | 23.9 |
| Log P | 4.3 [42] |
| Composition | dVpH5.5 [mL] | dVpH6.8 [mL] | Capacity [mM/pH] | Osmolarity [mosmol/L] | |
|---|---|---|---|---|---|
| K-Citrate | 0.525 M | 2.12 | 2.54 | 11.9 | 245–257 |
| K-Phosphate | 0.225 M | ||||
| NaOH | 1.7 M | ||||
| FaSSIF-V1 | 12 | 270 | |||
| FaSSIF-V2 | 10 | 180 | |||
| UV-Vis | HPLC | Xu et al. [33] | |
|---|---|---|---|
| Organic layer | 58.1% ± 1.5% | 57.6% ± 5.1% | 60% ± 9.1% |
| Aqueous Layer | 3.0% ± 0.3% | 2.1% ± 0.4% | ~2.0% (SD not available) |
| Gastric Stage—Model for dispersing of the formulation and dissolution of ritonavir at pH = 1.0 | |||
| Mform: undissolved ritonavir in the ritonavir-ASD formulation | 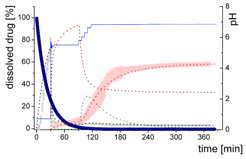 | ||
| (4) | - Simultaneous dispersing of the formulation and dissolution of ritonavir | ||
| Mdiss: dissolved ritonavir in the aqueous phase | 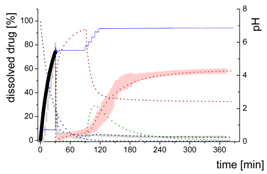 | ||
| (5) | + Simultaneous formulation dispersion and dissolution of ritonavir | ||
| Early intestinal stage—Simple precipitation-absorption model after initial pH-shift to 5.5 | |||
| Mdiss: dissolved ritonavir in the aqueous phase | 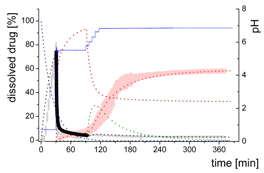 | ||
| (6) | + Simultaneous dispersion and dissolution - Precipitation of ritonavir as ritonavir-rich nano-droplets (normalized by saturation solubility) + Re-dissolution of ritonavir-rich nano-droplets (normalized by saturation solubility) - Absorption of ritonavir by organic phase | ||
| MlND: Large nano-droplets in the aqueous phase | 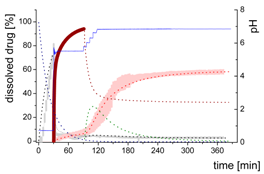 | ||
| (7) | + Precipitation of dissolved ritonavir as ritonavir-rich nano-droplets - Re-dissolution of ritonavir-rich nano-droplets | ||
| Mpart: Compartment: dissolved ritonavir in the 1-decanol phase | 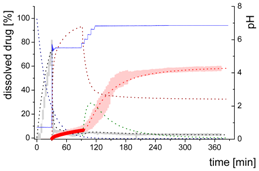 | ||
| (8) | + Absorption of dissolved ritonavir by the organic phase | ||
| Late intestinal stage—Precipitation-absorption model including a nano-droplet transformation after a stepwise pH-shift to 6.8 | |||
| Mdiss: dissolved ritonavir in the aqueous phase | 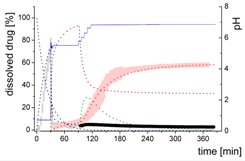 | ||
| (9) | + Simultaneous formulation dispersion and dissolution of ritonavir - Precipitation of dissolved ritonavir as ritonavir-rich nano-droplets + Re-dissolution of ritonavir-rich nano-droplets + Re-dissolution of small ritonavir-rich nano-droplets - Absorption of dissolved ritonavir by the organic phase | ||
| MlND: Large nano-droplets in the aqueous phase | 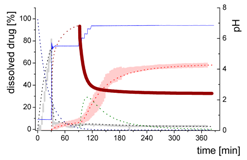 | ||
| (10) | + Precipitation of dissolved ritonavir as ritonavir-rich nano-droplets - Re-dissolution of ritonavir-rich nano-droplets - Transformation of large nano-droplets into small ritonavir-rich nano-droplets (normalization to the amount of large nano-droplets) | ||
| MsND: Small nano-droplets in the aqueous phase | 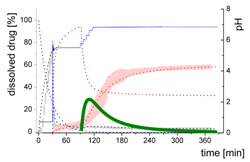 | ||
| (11) | + Transformation of ritonavir-rich nano-droplets into small nano-droplets (normalization to the amount of large nano-droplets) - Faster re-dissolution of small ritonavir-rich nano-droplets | ||
| Mpart: dissolved ritonavir in the 1-decanol phase |  | ||
| (12) | + ritonavir partitioning into the organic layer during transformation process | ||
| Typ | Bi-FaSSIF-V2 | Bi-FaSSIF | Buffer | |||||
|---|---|---|---|---|---|---|---|---|
| t [min] | 0 | 30 | 80 | 0 | 30 | 65 | 0 | 30 |
| kdisper [min−1] | 0.045 | 0.045 | 0.045 | 0.045 | 0.045 | 0.045 | 0.045 | 0.045 |
| kdis1 [min−1] | 0.009 | 0.009 | 0.009 | 0.009 | 0.009 | |||
| kprec1 [min−1] | 2.0 | 2.0 | 2.0 | 2.0 | 2.0 | |||
| kdis2 [min−1] | 0.04 | 0.05 | ||||||
| kprec2 [min−1] | 0.6 | 0.70 | ||||||
| kpart [min−1] | 0.015 | 0.45 | 0.015 | 0.55 | 0.023 | |||
| sat | 3% (12 µg/mL) | 3% (12 µg/mL) | 5% (20 µg/mL) | 5% (20 µg/mL) | 2–5% (10 µg/mL) | |||
| max | 35% | 32% | ||||||
© 2020 by the authors. Licensee MDPI, Basel, Switzerland. This article is an open access article distributed under the terms and conditions of the Creative Commons Attribution (CC BY) license (http://creativecommons.org/licenses/by/4.0/).
Share and Cite
Denninger, A.; Westedt, U.; Rosenberg, J.; Wagner, K.G. A Rational Design of a Biphasic Dissolution Setup—Modelling of Biorelevant Kinetics for a Ritonavir Hot-Melt Extruded Amorphous Solid Dispersion. Pharmaceutics 2020, 12, 237. https://doi.org/10.3390/pharmaceutics12030237
Denninger A, Westedt U, Rosenberg J, Wagner KG. A Rational Design of a Biphasic Dissolution Setup—Modelling of Biorelevant Kinetics for a Ritonavir Hot-Melt Extruded Amorphous Solid Dispersion. Pharmaceutics. 2020; 12(3):237. https://doi.org/10.3390/pharmaceutics12030237
Chicago/Turabian StyleDenninger, Alexander, Ulrich Westedt, Jörg Rosenberg, and Karl G. Wagner. 2020. "A Rational Design of a Biphasic Dissolution Setup—Modelling of Biorelevant Kinetics for a Ritonavir Hot-Melt Extruded Amorphous Solid Dispersion" Pharmaceutics 12, no. 3: 237. https://doi.org/10.3390/pharmaceutics12030237
APA StyleDenninger, A., Westedt, U., Rosenberg, J., & Wagner, K. G. (2020). A Rational Design of a Biphasic Dissolution Setup—Modelling of Biorelevant Kinetics for a Ritonavir Hot-Melt Extruded Amorphous Solid Dispersion. Pharmaceutics, 12(3), 237. https://doi.org/10.3390/pharmaceutics12030237