Systematic Development and Optimization of Inhalable Pirfenidone Liposomes for Non-Small Cell Lung Cancer Treatment

 ,
,  ,
, 
Abstract
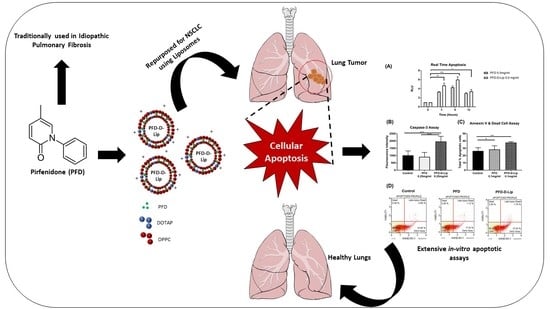
1. Introduction
2. Materials and Methods
2.1. Materials
2.2. Methods
2.2.1. UPLC Method Development for Pirfenidone (PFD)
2.2.2. Formulation and Optimization of Pirfenidone Liposomes
2.2.3. Characterization of Liposomes
Particle Size, Poly Dispersity Index (PDI), Zeta Potential, and Phospholipid Quantification
Drug Content
In-Vitro Release Studies
Morphological Analysis Using Transmission Electron Microscopy (TEM)
Solid State Characterization Studies
2.2.4. Cellular Uptake Studies
2.2.5. Stability Studies
2.2.6. Cytotoxicity Studies
2.2.7. Scratch Assay
2.2.8. Clonogenic Assay
2.2.9. In-vitro Angiogenesis Study
2.2.10. 3D Spheroid Study
2.2.11. Mechanism of Action
Real-time Annexin Apoptosis Assay
Caspase-3 Induction assay
Muse Annexin V and Dead Cell Assay
Western Blot Studies
Statistical Analysis
3. Results
3.1. UPLC Method Development for PFD
3.2. Formulation and Optimization of Pirfenidone Liposomes
3.3. Characterization of Liposomes
3.3.1. Particle Size, Poly Dispersity Index (PDI), Zeta Potential
3.3.2. Drug Content
3.3.3. In-Vitro Drug Release Studies
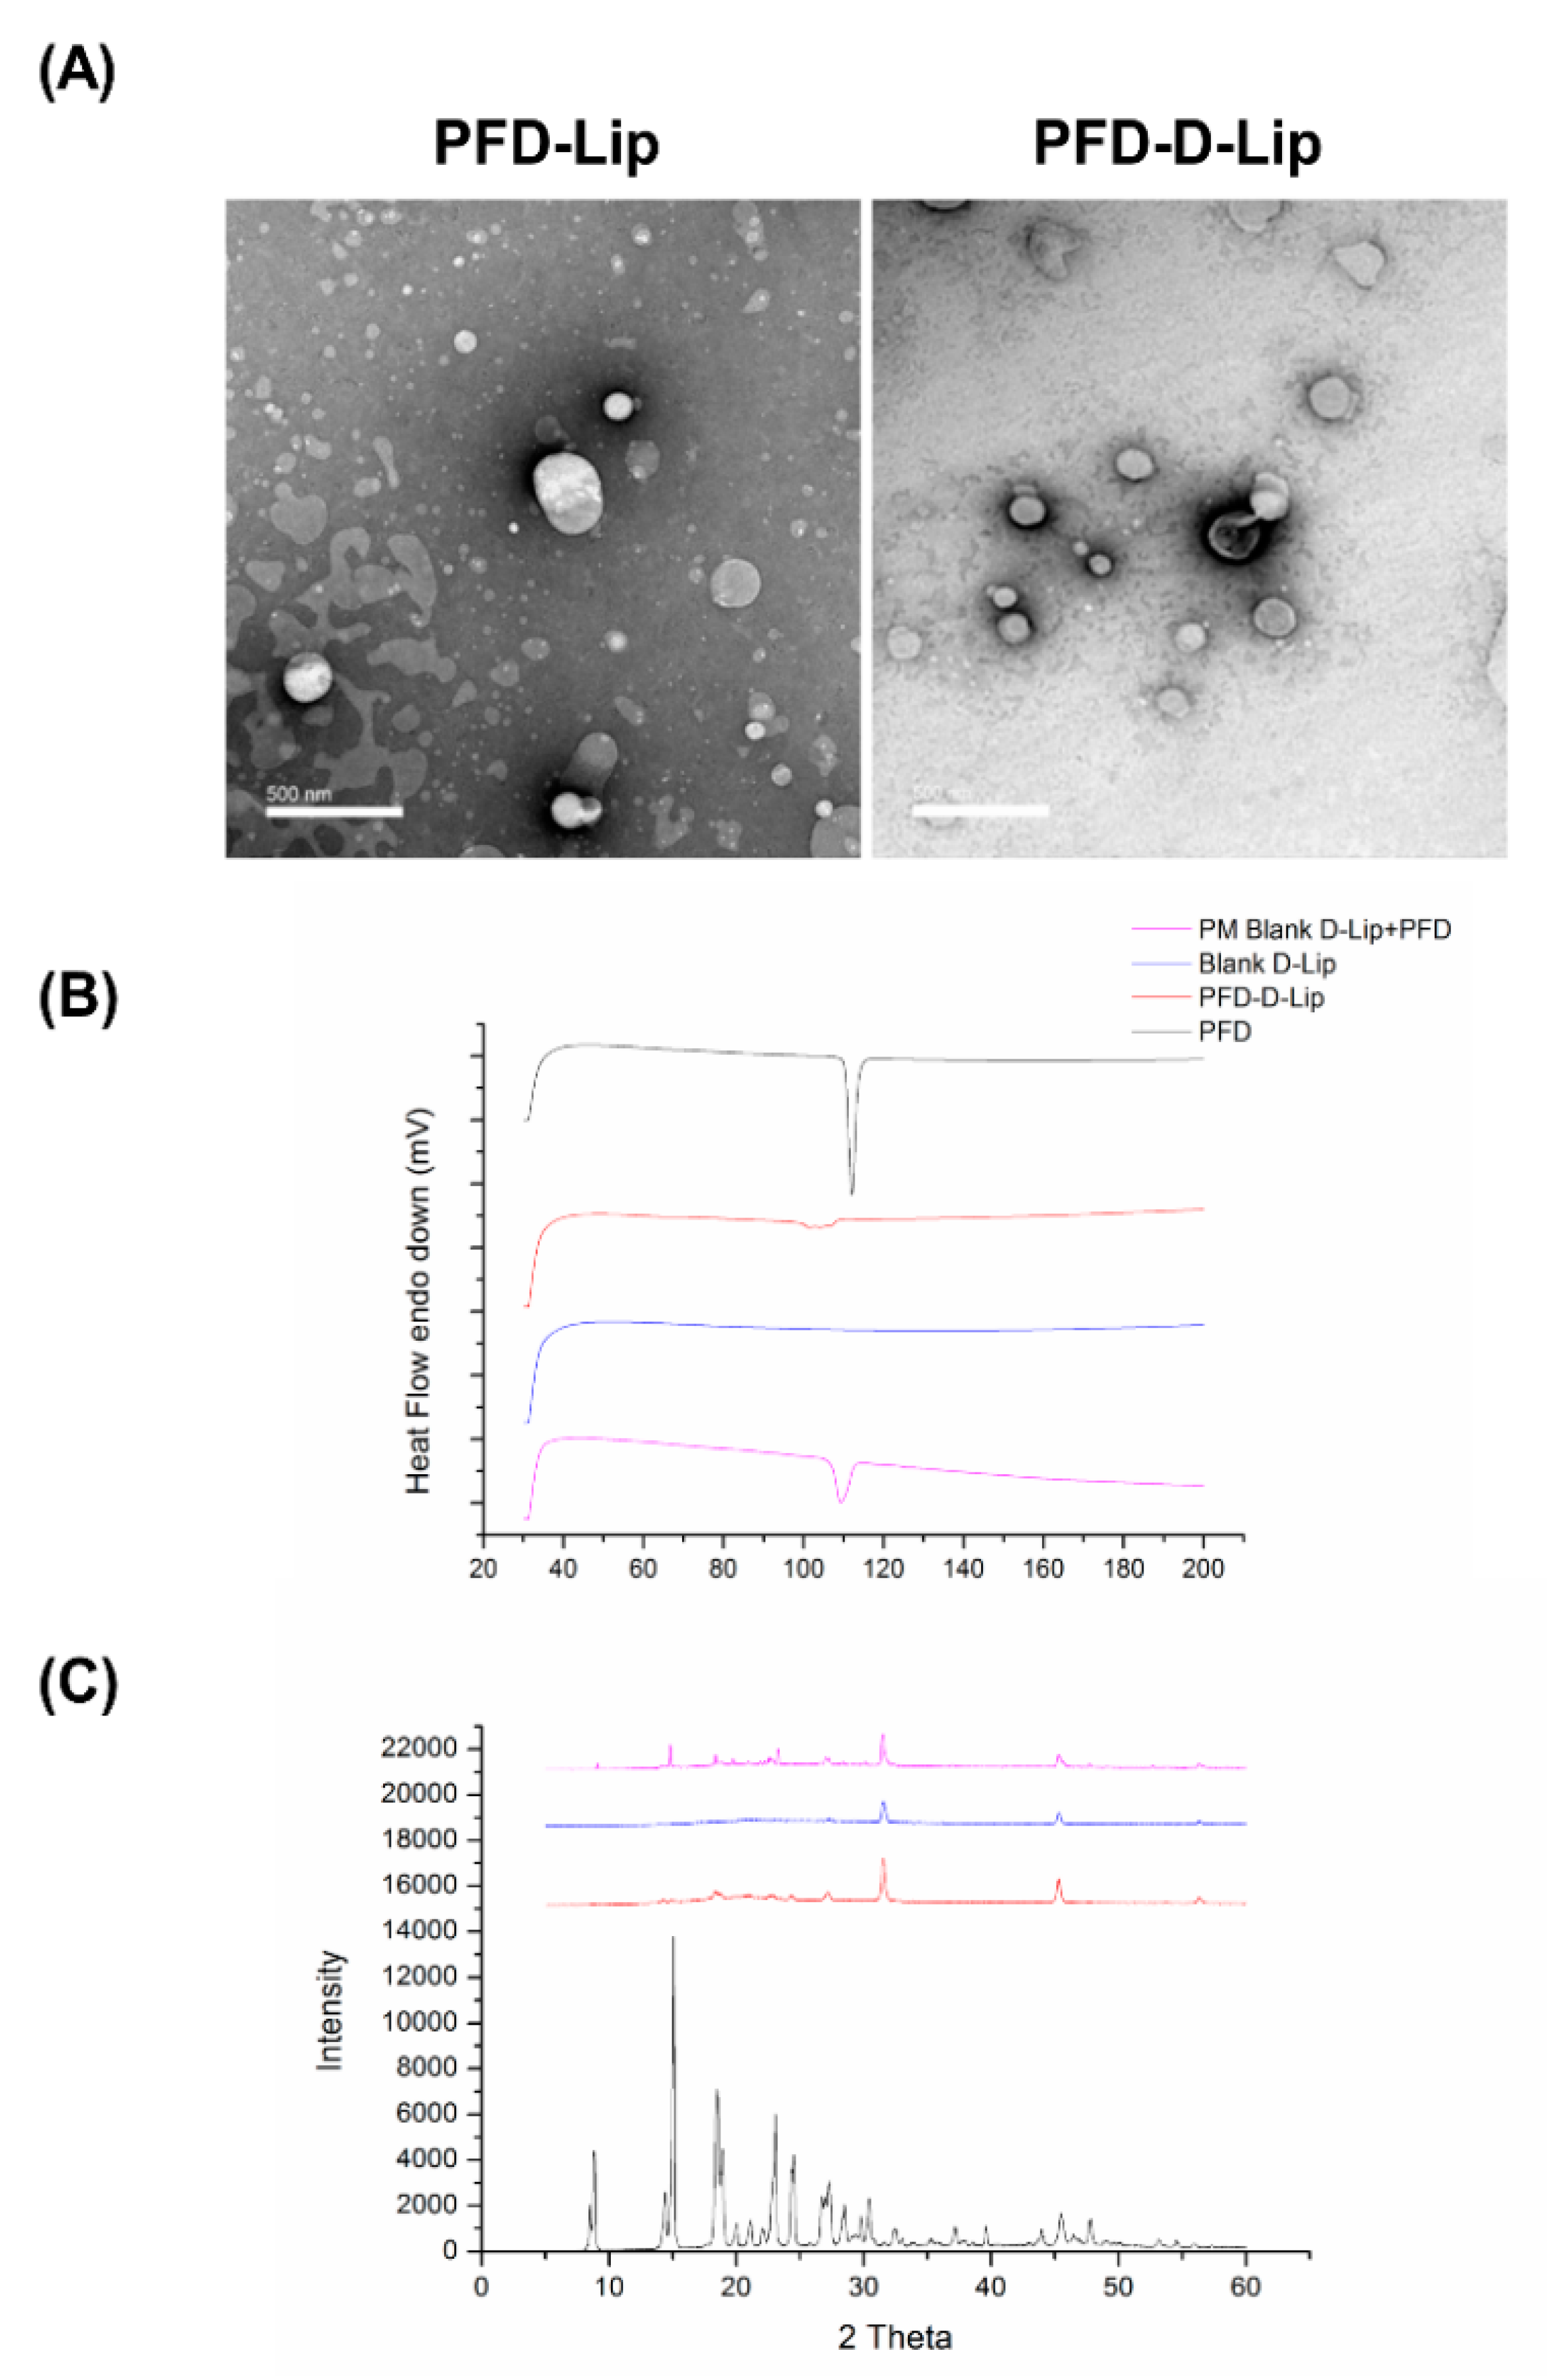
3.3.4. Morphological Analysis using Transmission Electron Microscopy (TEM)
3.3.5. Solid State Characterization Studies
3.3.6. In-vitro Lung Deposition Studies Using Next Generation Cascade Impactor (NGI)
3.4. Stability Studies
3.5. Cellular Uptake Studies
3.6. Cytotoxicity Studies
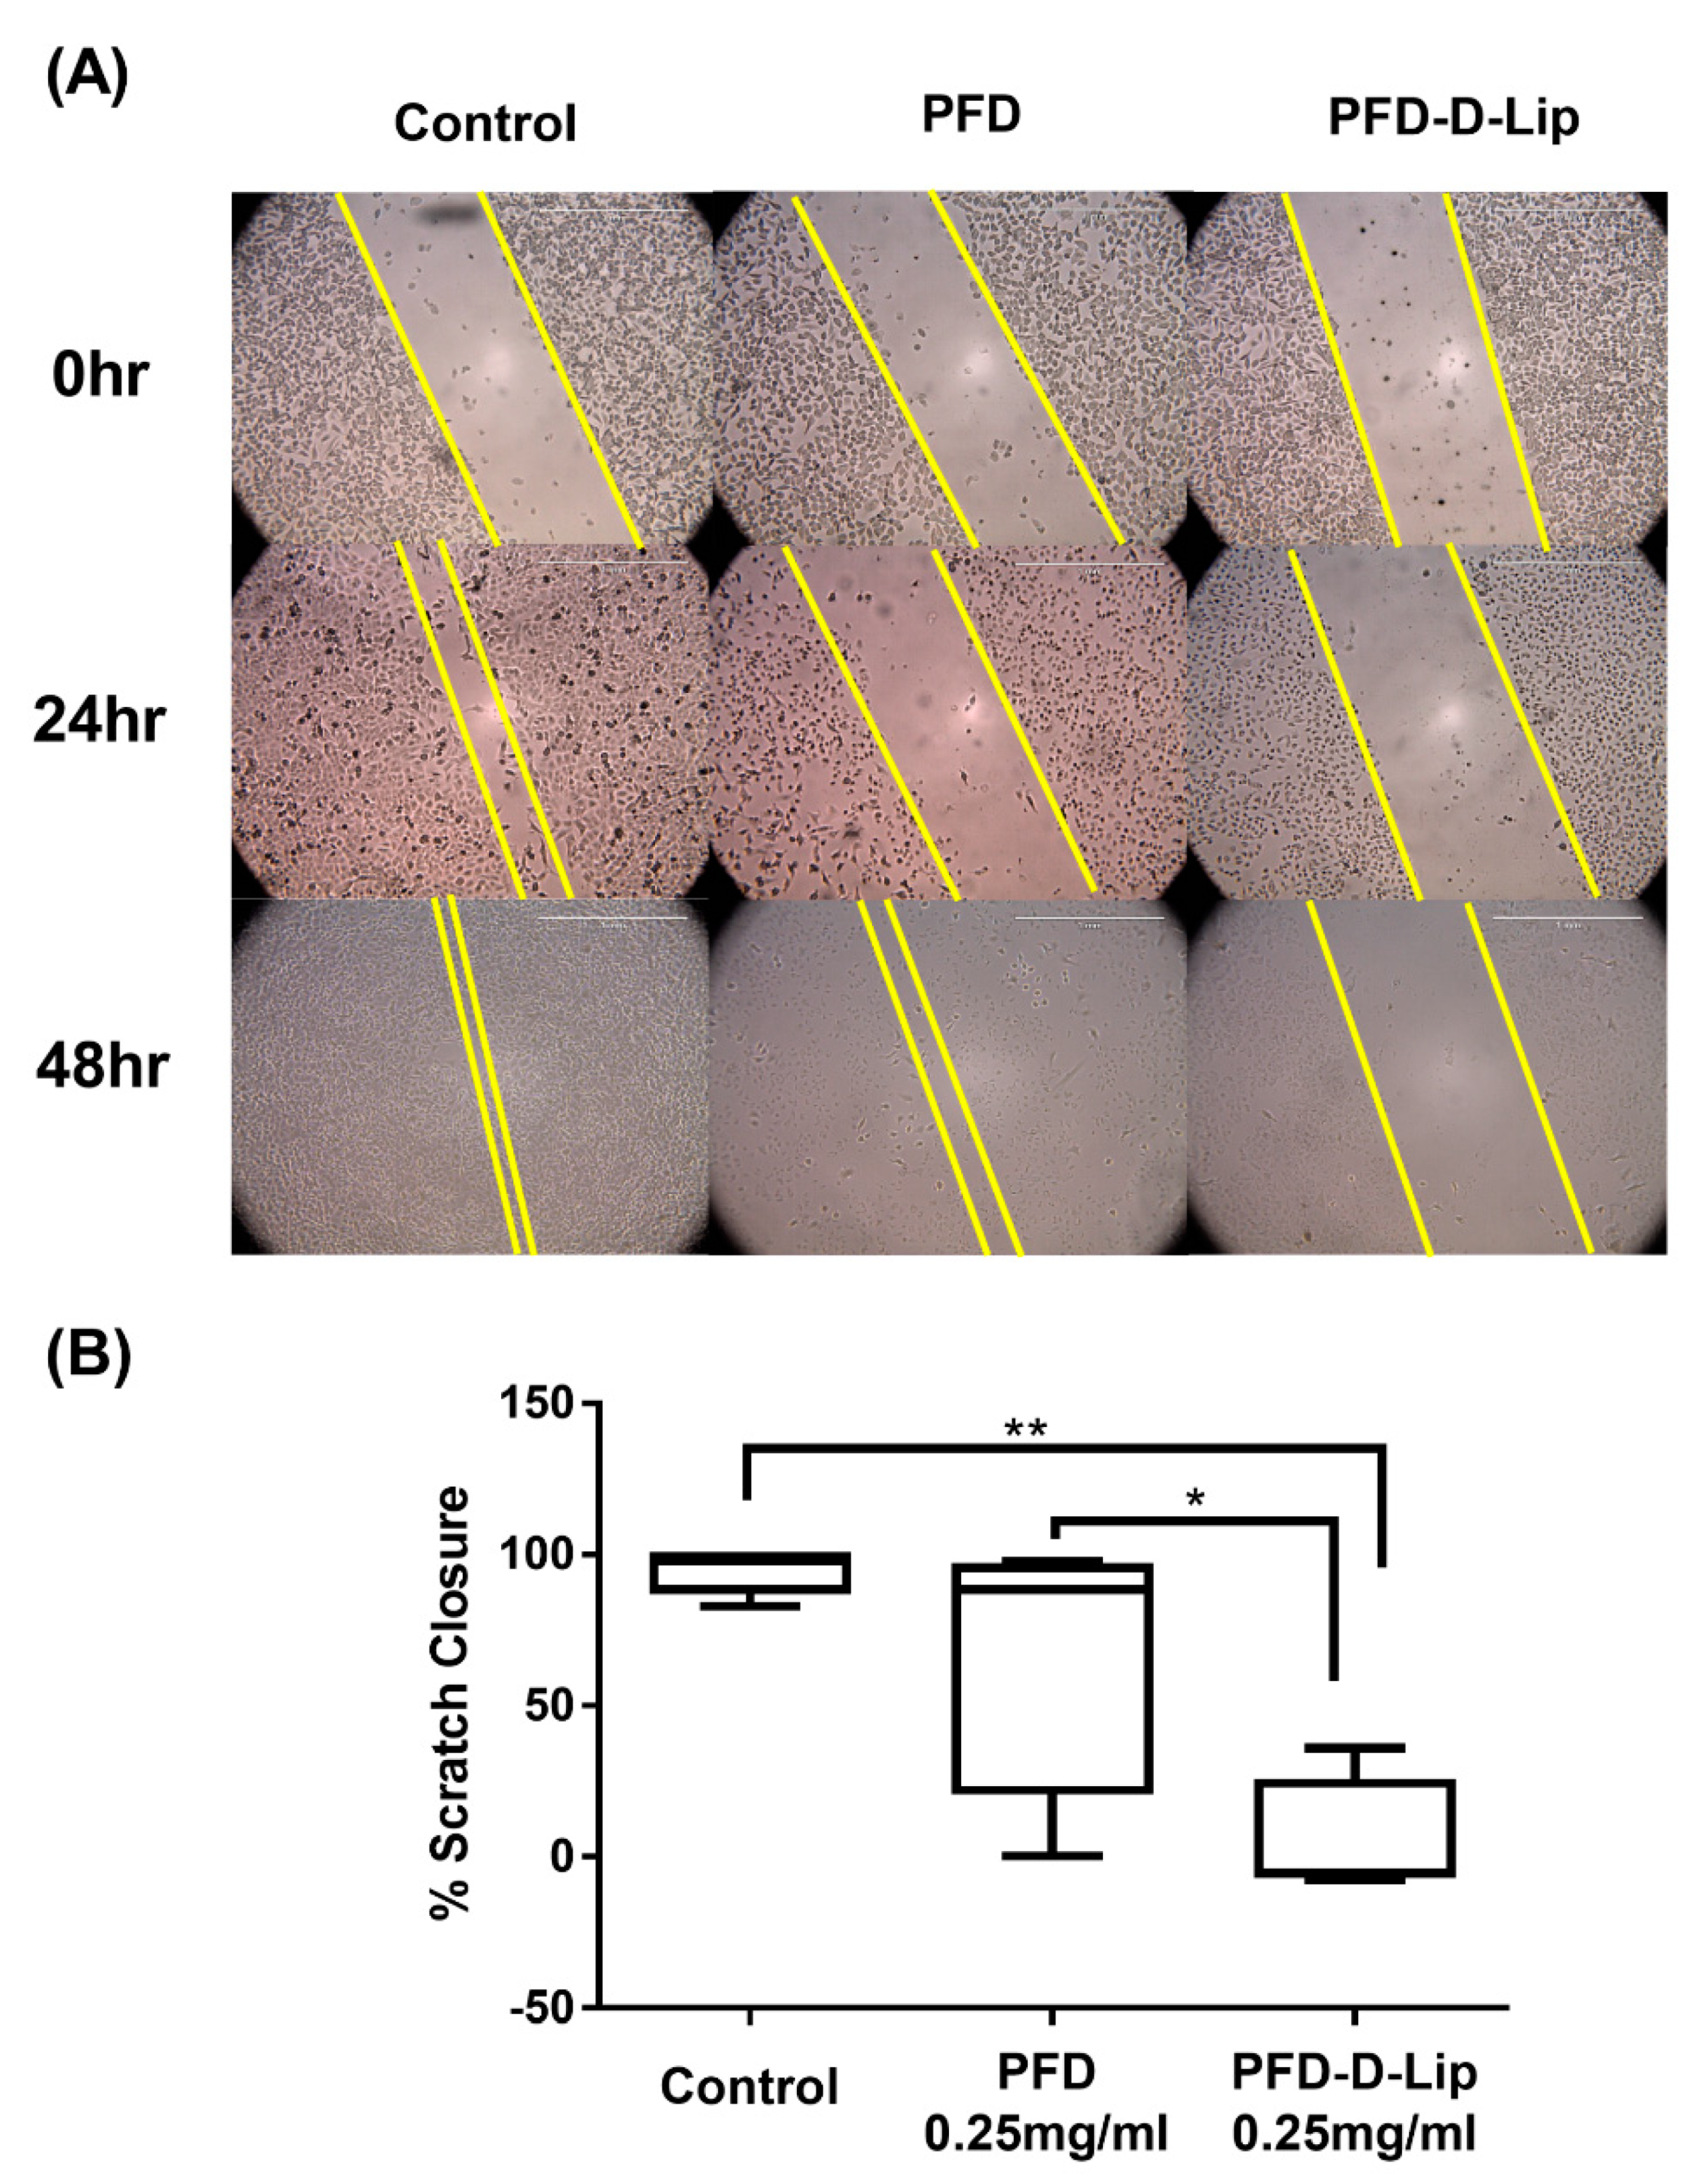
3.7. Scratch Assay for Wound Healing and Cell-Cell Interaction
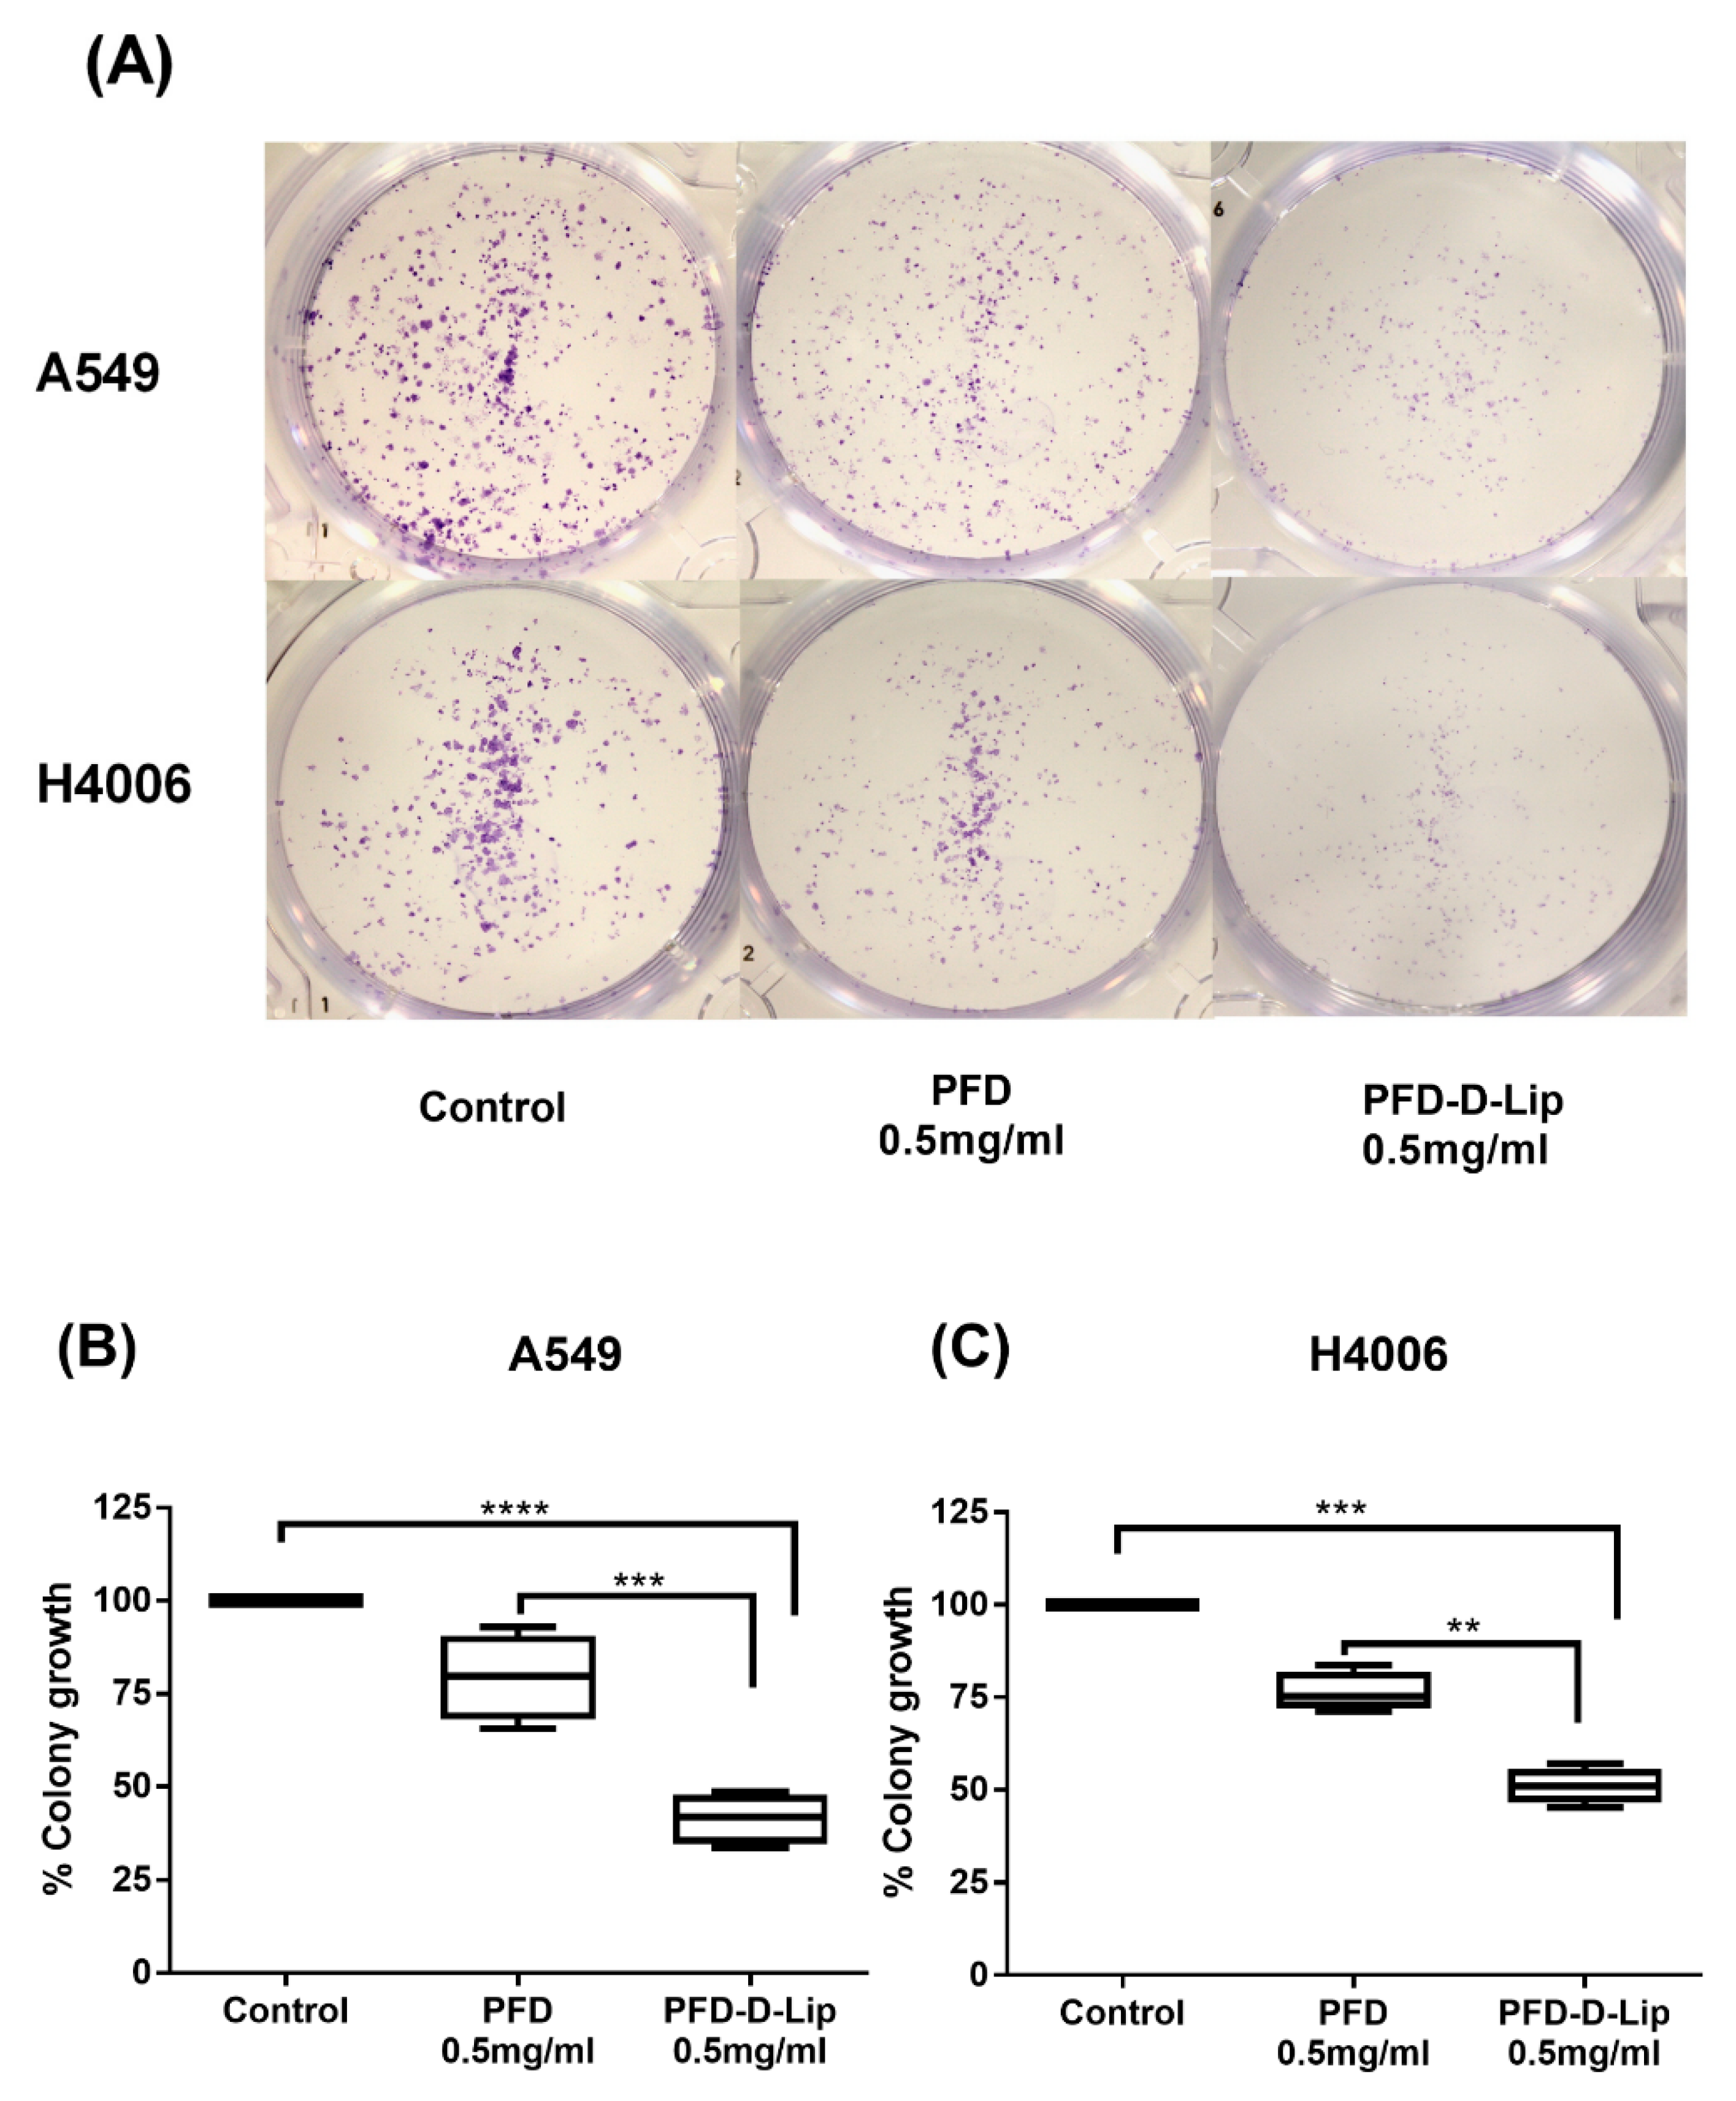
3.8. Clonogenic Assay
3.9. In-vitro Angiogenesis Study
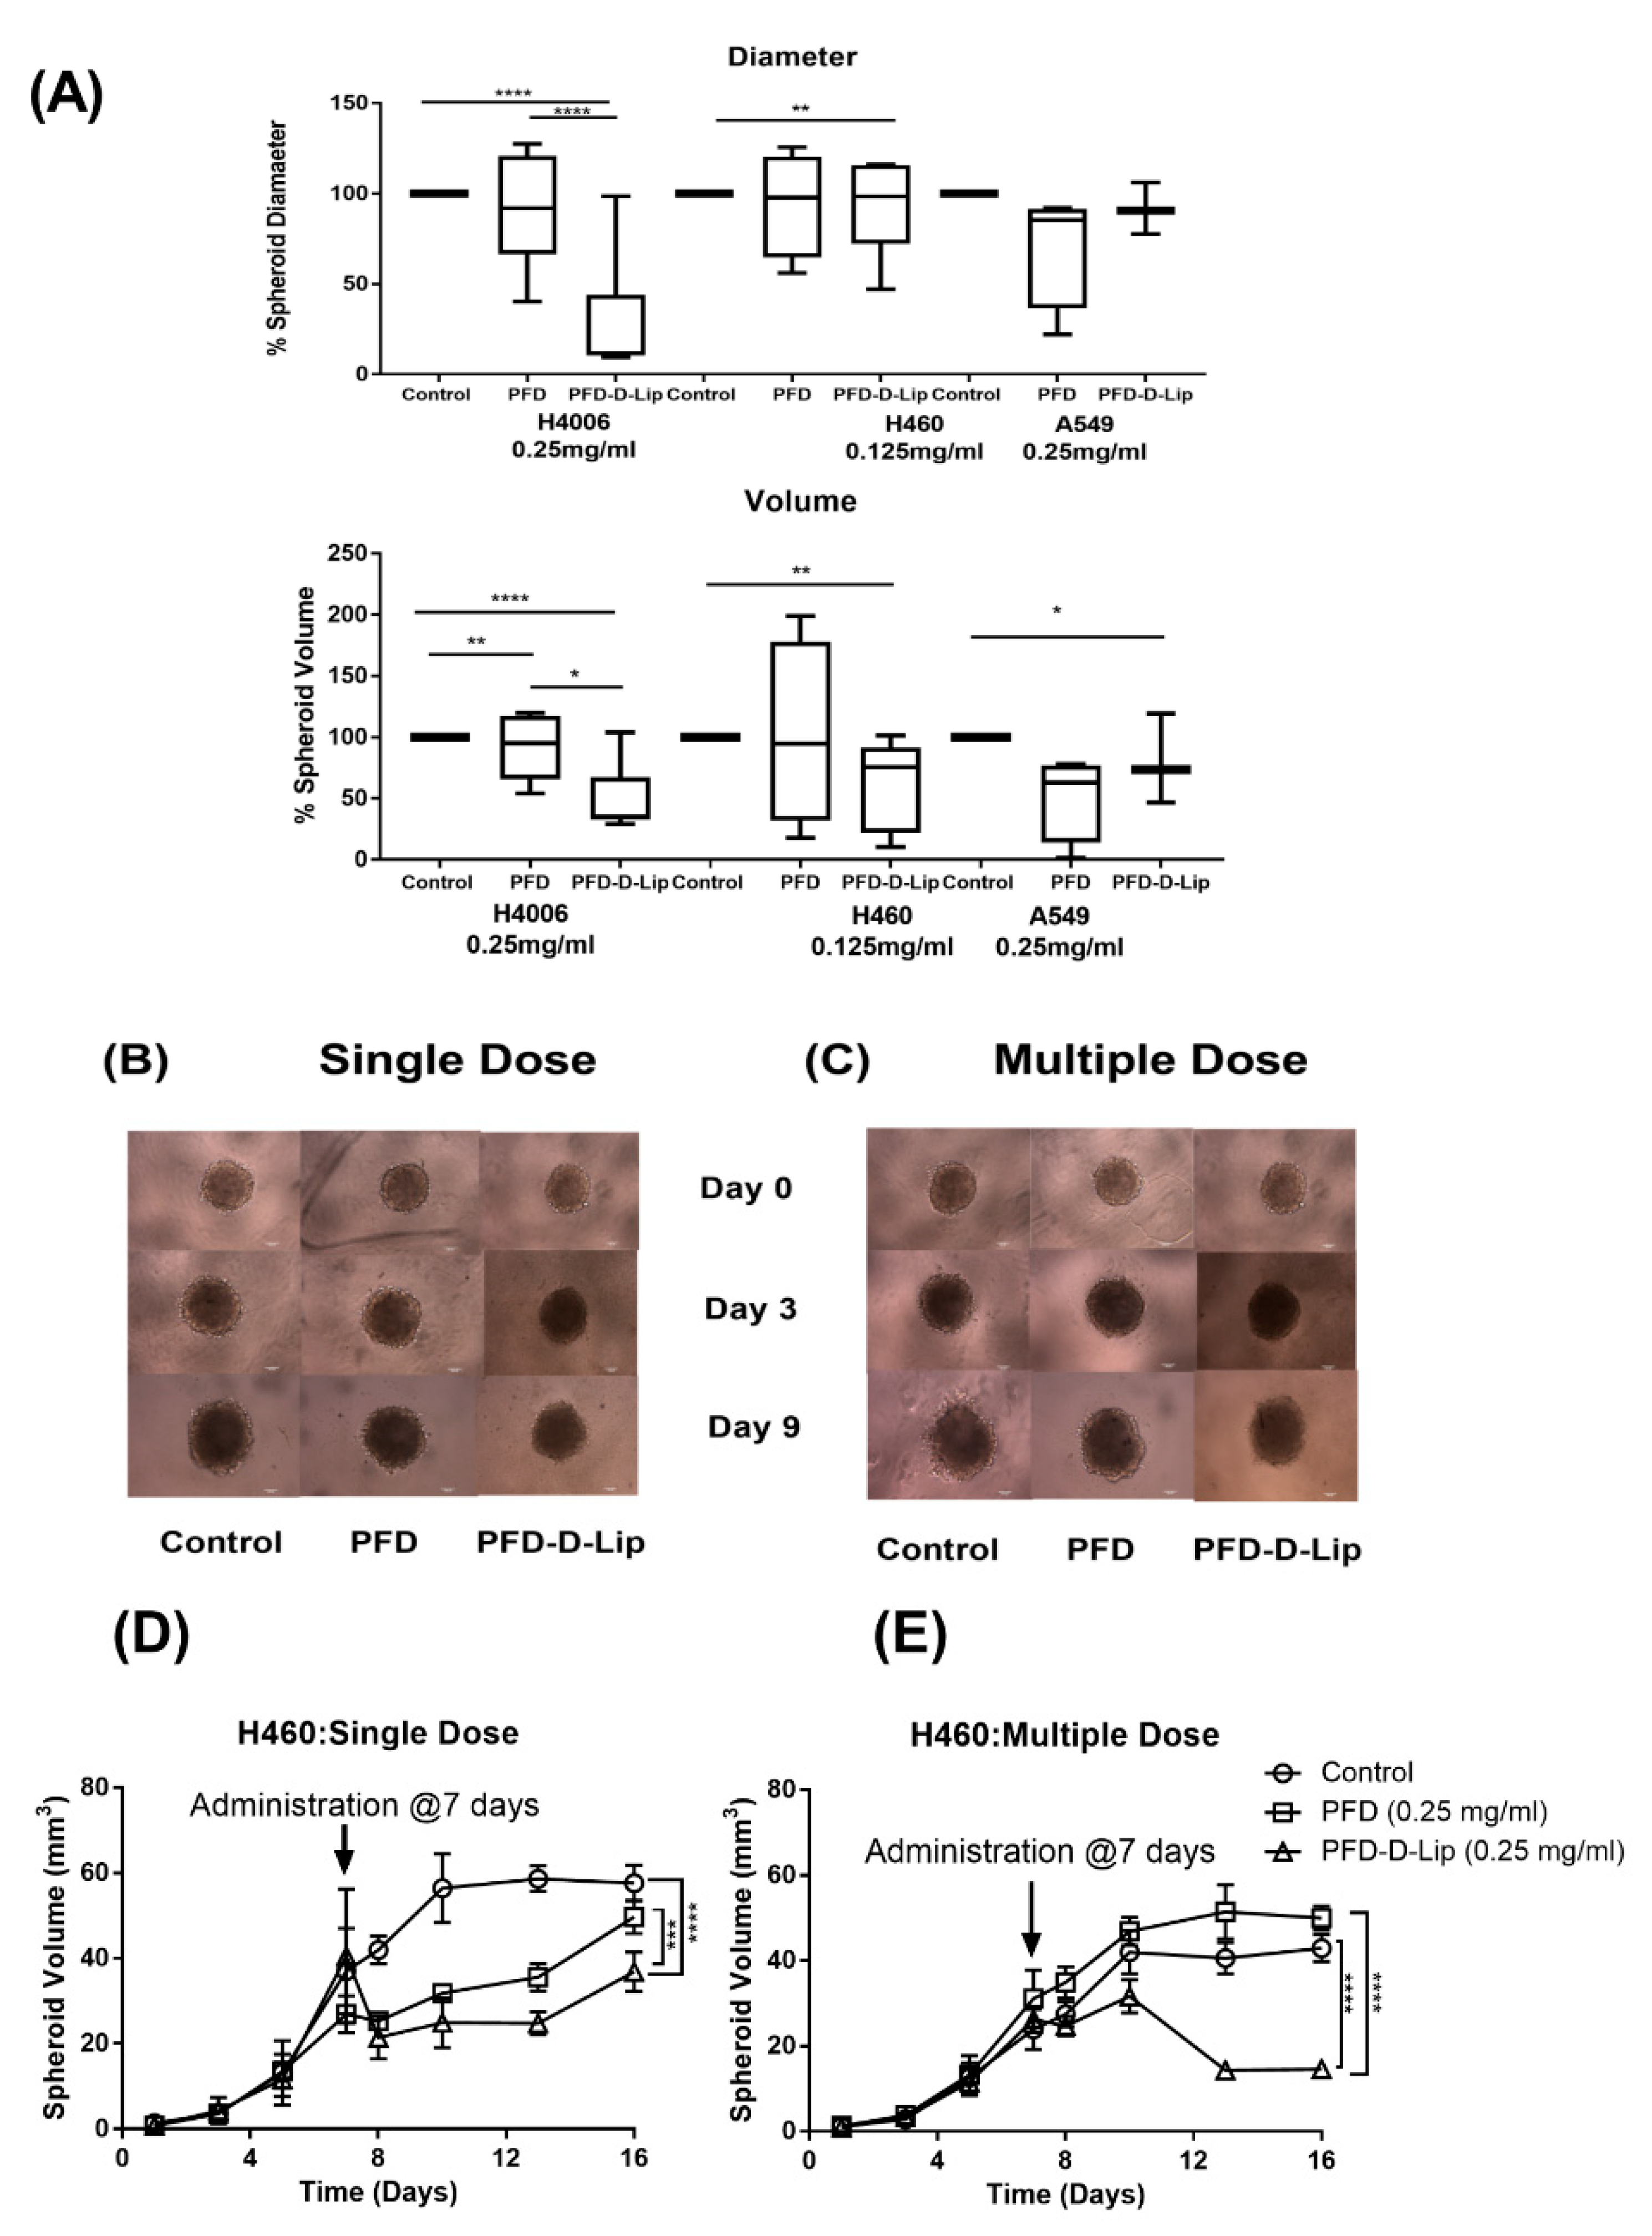
3.10. 3D Spheroid Cell Culture Study
3.11. Mechanism of Action
3.11.1. Real-time Annexin Apoptosis Assay
3.11.2. Caspase-3 Induction Assay
3.11.3. Muse Annexin V Dead Cell Assay
3.11.4. Western Blot Studies
4. Discussion
5. Conclusion
Supplementary Materials
Author Contributions
Funding
Conflicts of Interest
References
- Lin, C.; Wong, B.C.K.; Chen, H.; Bian, Z.; Zhang, G.; Zhang, X.; Kashif Riaz, M.; Tyagi, D.; Lin, G.; Zhang, Y.; et al. Pulmonary delivery of triptolide-loaded liposomes decorated with anti-carbonic anhydrase IX antibody for lung cancer therapy. Sci. Rep. 2017, 7, 1097. [Google Scholar]
- Siegel, R.L.; Miller, K.D.; Jemal, A. Cancer statistics, 2019. CA Cancer J. Clin. 2019, 69, 7–34. [Google Scholar] [CrossRef]
- Ju, R.; Cheng, L.; Xiao, Y.; Wang, X.; Li, C.; Peng, X.; Li, X. PTD modified paclitaxel anti-resistant liposomes for treatment of drug-resistant non-small cell lung cancer. J. Liposome Res. 2018, 28, 236–248. [Google Scholar] [CrossRef]
- Zappa, C.; Mousa, S.A. Non-small cell lung cancer: Current treatment and future advances. Transl. Lung Cancer Res. 2016, 5, 288–300. [Google Scholar] [CrossRef]
- Song, X.; Ju, R.; Xiao, Y.; Wang, X.; Liu, S.; Fu, M.; Liu, J.; Gu, L.; Li, X.; Cheng, L. Application of multifunctional targeting epirubicin liposomes in the treatment of non-small-cell lung cancer. Int. J. Nanomed. 2017, 12, 7433–7451. [Google Scholar] [CrossRef]
- Reck, M.; Popat, S.; Reinmuth, N.; Ruysscher, D.D.; Kerr, K.M.; Peters, S. Metastatic non-small-cell lung cancer (NSCLC): ESMO Clinical Practice Guidelines for diagnosis, treatment and follow-up †. Ann. Oncol. 2014, 25, iii27–iii39. [Google Scholar] [CrossRef]
- Qiu, Z.; Chen, Z.; Zhang, C.; Zhong, W. Achievements and futures of immune checkpoint inhibitors in non-small cell lung cancer. Exp. Hematol. Oncol. 2019, 8, 19. [Google Scholar] [CrossRef]
- Wu, H.; Zhong, Q.; Zhong, R.; Huang, H.; Xia, Z.; Ke, Z.; Zhang, Z.; Song, J.; Jia, X. Preparation and antitumor evaluation of self-assembling oleanolic acid-loaded Pluronic P105/d-α-tocopheryl polyethylene glycol succinate mixed micelles for non-small-cell lung cancer treatment. Int. J. Nanomed. 2016, 11, 6337–6352. [Google Scholar] [CrossRef]
- Lee, W.-H.; Loo, C.-Y.; Ghadiri, M.; Leong, C.-R.; Young, P.M.; Traini, D. The potential to treat lung cancer via inhalation of repurposed drugs. Adv. Drug Deliv. Rev. 2018, 133, 107–130. [Google Scholar]
- Lee, W.-H.; Loo, C.-Y.; Traini, D.; Young, P.M. Inhalation of nanoparticle-based drug for lung cancer treatment: Advantages and challenges. Asian J. Pharm. Sci. 2015, 10, 481–489. [Google Scholar] [CrossRef]
- Kulkarni, N.S.; Guererro, Y.; Gupta, N.; Muth, A.; Gupta, V. Exploring potential of quantum dots as dual modality for cancer therapy and diagnosis. J. Drug Deliv. Sci. Technol. 2019, 49, 352–364. [Google Scholar] [CrossRef]
- Kim, E.S. Chemotherapy resistance in lung cancer. Adv. Exp. Med. Biol. 2016, 893, 189–209. [Google Scholar]
- Xue, H.; Li, J.; Xie, H.; Wang, Y. Review of drug repositioning approaches and resources. Int. J. Biol. Sci. 2018, 14, 1232–1244. [Google Scholar] [CrossRef]
- Chong, C.R.; Sullivan, D.J. New uses for old drugs. Nature 2007, 448, 645–646. [Google Scholar] [CrossRef]
- Parvathaneni, V.; Kulkarni, N.S.; Muth, A.; Gupta, V. Drug repurposing: A promising tool to accelerate the drug discovery process. Drug Discov. Today 2019. [Google Scholar] [CrossRef]
- Mediavilla-Varela, M.; Boateng, K.; Noyes, D.; Antonia, J.S. The anti-fibrotic agent pirfenidone synergizes with cisplatin in killing tumor cells and cancer-associated fibroblasts. BMC Cancer 2016, 16. [Google Scholar] [CrossRef]
- Fujiwara, A.; Shintani, Y.; Funaki, S.; Kawamura, T.; Kimura, T.; Minami, M.; Okumura, M. Pirfenidone plays a biphasic role in inhibition of epithelial-mesenchymal transition in non-small cell lung cancer. Lung Cancer Amst. Neth. 2017, 106, 8–16. [Google Scholar] [CrossRef]
- Usugi, E.; Ishii, K.; Hirokawa, Y.; Kanayama, K.; Matsuda, C.; Uchida, K.; Shiraishi, T.; Watanabe, M. Antifibrotic agent pirfenidone suppresses proliferation of human pancreatic cancer cells by inducing G0/G1 cell cycle arrest. Pharmacology 2019, 103, 250–256. [Google Scholar] [CrossRef]
- Margaritopoulos, G.A.; Vasarmidi, E.; Antoniou, K.M. Pirfenidone in the treatment of idiopathic pulmonary fibrosis: An evidence-based review of its place in therapy. Core Evid. 2016, 11, 11–22. [Google Scholar] [CrossRef]
- Rudokas, M.; Najlah, M.; Alhnan, M.A.; Elhissi, A. Liposome delivery systems for inhalation: A critical review highlighting formulation issues and anticancer applications. Med. Princ. Pract. 2016, 25, 60–72. [Google Scholar] [CrossRef]
- Zaru, M.; Mourtas, S.; Klepetsanis, P.; Fadda, A.M.; Antimisiaris, S.G. Liposomes for drug delivery to the lungs by nebulization. Eur. J. Pharm. Biopharm. 2007, 67, 655–666. [Google Scholar]
- Shirley, M. Amikacin liposome inhalation suspension: A review in mycobacterium avium complex lung disease. Drugs 2019, 79, 555–562. [Google Scholar] [CrossRef]
- Abdelaziz, H.M.; Gaber, M.; Abd-Elwakil, M.M.; Mabrouk, M.T.; Elgohary, M.M.; Kamel, N.M.; Kabary, D.M.; Freag, M.S.; Samaha, M.W.; Mortada, S.M.; et al. Inhalable particulate drug delivery systems for lung cancer therapy: Nanoparticles, microparticles, nanocomposites and nanoaggregates. J. Control. Release 2018, 269, 374–392. [Google Scholar] [CrossRef]
- Angius, F.; Floris, A. Liposomes and MTT cell viability assay: An incompatible affair. Toxicology 2015, 29, 314–319. [Google Scholar]
- Baczynska, D.; Widerak, K.; Ugorski, M.; Langner, M. Surface charge and the association of liposomes with colon carcinoma cells. Z. Nat. C J. Biosci. 2001, 56, 872–877. [Google Scholar]
- Costa, A.P.; Xu, X.; Burgess, D.J. Freeze-anneal-thaw cycling of unilamellar liposomes: Effect on encapsulation efficiency. Pharm. Res. 2014, 31, 97–103. [Google Scholar] [CrossRef]
- Gupta, V.; Gupta, N.; Shaik, I.H.; Mehvar, R.; McMurtry, I.F.; Oka, M.; Nozik-Grayck, E.; Komatsu, M.; Ahsan, F. Liposomal fasudil, a rho-kinase inhibitor, for prolonged pulmonary preferential vasodilation in pulmonary arterial hypertension. J. Control. Release Off. J. Control. Release Soc. 2013, 167, 189–199. [Google Scholar] [CrossRef]
- Meng, H.; Xu, Y. Pirfenidone-loaded liposomes for lung targeting: Preparation and in vitro/in vivo evaluation. Drug Des. Devel. Ther. 2015, 9, 3369–3376. [Google Scholar]
- Togami, K.; Miyao, A.; Miyakoshi, K.; Kanehira, Y.; Tada, H.; Chono, S. Efficient delivery to human lung fibroblasts (WI-38) of pirfenidone incorporated into liposomes modified with truncated basic fibroblast growth factor and its inhibitory effect on collagen synthesis in idiopathic pulmonary fibrosis. Biol. Pharm. Bull. 2015, 38, 270–276. [Google Scholar]
- Marques, M.R.C.; Loebenberg, R. May almukainzi simulated biological fluids with possible application in dissolution testing. Dissolut. Technol. 2011, 18, 15–28. [Google Scholar] [CrossRef]
- Stocke, N.A.; Meenach, S.A.; Arnold, S.M.; Mansour, H.M.; Hilt, J.Z. Formulation and characterization of inhalable magnetic nanocomposite microparticles (MnMs) for targeted pulmonary delivery via spray drying. Int. J. Pharm. 2015, 479, 320–328. [Google Scholar] [CrossRef]
- Price, D.N.; Stromberg, L.R.; Kunda, N.K.; Muttil, P. In vivo pulmonary delivery and magnetic-targeting of dry powder nano-in-microparticles. Mol. Pharm. 2017, 14, 4741–4750. [Google Scholar] [CrossRef]
- Kulkarni, N.S.; Parvathaneni, V.; Shukla, S.K.; Barasa, L.; Perron, J.C.; Yoganathan, S.; Muth, A.; Gupta, V. Tyrosine kinase inhibitor conjugated quantum dots for non-small cell lung cancer (NSCLC) treatment. Eur. J. Pharm. Sci. Off. J. Eur. Fed. Pharm. Sci. 2019, 133, 145–159. [Google Scholar] [CrossRef]
- Liang, C.-C.; Park, A.Y.; Guan, J.-L. In vitro scratch assay: A convenient and inexpensive method for analysis of cell migration in vitro. Nat. Protoc. 2007, 2, 329. [Google Scholar] [CrossRef]
- Franken, N.A.P.; Rodermond, H.M.; Stap, J.; Haveman, J.; van Bree, C. Clonogenic assay of cells in vitro. Nat. Protoc. 2006, 1, 2315. [Google Scholar] [CrossRef]
- Geissmann, Q. OpenCFU, a new free and open-source software to count cell colonies and other circular objects. PLoS ONE 2013, 8, e54072. [Google Scholar] [CrossRef]
- Hall, R.D.; Le, T.M.; Haggstrom, D.E.; Gentzler, R.D. Angiogenesis inhibition as a therapeutic strategy in non-small cell lung cancer (NSCLC). Transl. Lung Cancer Res. 2015, 4, 515–523. [Google Scholar]
- Miller, J.E.; Monsanto, S.P.; Ahn, S.H.; Khalaj, K.; Fazleabas, A.T.; Young, S.L.; Lessey, B.A.; Koti, M.; Tayade, C. Interleukin-33 modulates inflammation in endometriosis. Sci. Rep. 2017, 7, 17903. [Google Scholar] [CrossRef]
- Shukla, S.K.; Kulkarni, N.S.; Chan, A.; Parvathaneni, V.; Farrales, P.; Muth, A.; Gupta, V. Metformin-encapsulated liposome delivery system: An effective treatment approach against breast cancer. Pharmaceutics 2019, 11, 559. [Google Scholar] [CrossRef]
- Martin, S.J.; Reutelingsperger, C.P.; McGahon, A.J.; Rader, J.A.; van Schie, R.C.; LaFace, D.M.; Green, D.R. Early redistribution of plasma membrane phosphatidylserine is a general feature of apoptosis regardless of the initiating stimulus: Inhibition by overexpression of Bcl-2 and Abl. J. Exp. Med. 1995, 182, 1545–1556. [Google Scholar] [CrossRef]
- Kota, S.; Hou, S.; Guerrant, W.; Madoux, F.; Troutman, S.; Fernandez-Vega, V.; Alekseeva, N.; Madala, N.; Scampavia, L.; Kissil, J.; et al. A novel three-dimensional high-throughput screening approach identifies inducers of a mutant KRAS selective lethal phenotype. Oncogene 2018, 37, 4372–4384. [Google Scholar] [CrossRef] [PubMed]
- Gross, K.; Karagiannides, I.; Thomou, T.; Koon, H.W.; Bowe, C.; Kim, H.; Giorgadze, N.; Tchkonia, T.; Pirtskhalava, T.; Kirkland, J.L.; et al. Substance P promotes expansion of human mesenteric preadipocytes through proliferative and antiapoptotic pathways. Am. J. Physiol. Gastrointest. Liver Physiol. 2009, 296, G1012–G1019. [Google Scholar] [CrossRef]
- Bozzuto, G.; Molinari, A. Liposomes as nanomedical devices. Int. J. Nanomed. 2015, 10, 975–999. [Google Scholar] [CrossRef] [PubMed]
- Dash, S.; Murthy, P.N.; Nath, L.; Chowdhury, P. Kinetic modeling on drug release from controlled drug delivery systems. Acta Pol. Pharm. 2010, 67, 217–223. [Google Scholar]
- Soni, S.R.; Bhunia, B.K.; Kumari, N.; Dan, S.; Mukherjee, S.; Mandal, B.B.; Ghosh, A. Therapeutically effective controlled release formulation of pirfenidone from nontoxic biocompatible carboxymethyl pullulan-Poly(Vinyl Alcohol) interpenetrating polymer networks. ACS Omega 2018, 3, 11993–12009. [Google Scholar] [CrossRef]
- Moreno-Sastre, M.; Pastor, M.; Salomon, C.J.; Esquisabel, A.; Pedraz, J.L. Pulmonary drug delivery: A review on nanocarriers for antibacterial chemotherapy. J. Antimicrob. Chemother. 2015, 70, 2945–2955. [Google Scholar] [CrossRef]
- Patlolla, R.R.; Chougule, M.; Patel, A.R.; Jackson, T.; Tata, P.N.; Singh, M. Formulation, characterization and pulmonary deposition of nebulized celecoxib encapsulated nanostructured lipid carriers. J. Control. Release Off. J. Control. Release Soc. 2010, 144, 233–241. [Google Scholar] [CrossRef]
- Chibowski, E.; Szcześ, A. Zeta potential and surface charge of DPPC and DOPC liposomes in the presence of PLC enzyme. Adsorption 2016, 22, 755–765. [Google Scholar] [CrossRef]
- Rajendran, V.; Jain, M.V. In vitro tumorigenic assay: Colony forming assay for cancer stem cells. Methods Mol. Biol. Clifton NJ 2018, 1692, 89–95. [Google Scholar]
- Roudsari, L.C.; West, J.L. Studying the influence of angiogenesis in in vitro cancer model systems. Adv. Drug Deliv. Rev. 2016, 97, 250–259. [Google Scholar] [CrossRef]
- Vaidya, B.; Parvathaneni, V.; Kulkarni, N.S.; Shukla, S.K.; Damon, J.K.; Sarode, A.; Kanabar, D.; Garcia, J.V.; Mitragotri, S.; Muth, A.; et al. Cyclodextrin modified erlotinib loaded PLGA nanoparticles for improved therapeutic efficacy against non-small cell lung cancer. Int. J. Biol. Macromol. 2019, 122, 338–347. [Google Scholar] [CrossRef] [PubMed]
- Kupcho, K.; Shultz, J.; Hurst, R.; Hartnett, J.; Zhou, W.; Machleidt, T.; Grailer, J.; Worzella, T.; Riss, T.; Lazar, D.; et al. A real-time, bioluminescent annexin V assay for the assessment of apoptosis. Apoptosis 2019, 24, 184–197. [Google Scholar] [CrossRef] [PubMed]
- Zou, W.-J.; Huang, Z.; Jiang, T.-P.; Shen, Y.-P.; Zhao, A.-S.; Zhou, S.; Zhang, S. Pirfenidone inhibits proliferation and promotes apoptosis of hepatocellular carcinoma cells by inhibiting the Wnt/β-Catenin signaling pathway. Med. Sci. Monit. Int. Med. J. Exp. Clin. Res. 2017, 23, 6107–6113. [Google Scholar] [CrossRef]
- Vivanco, I.; Sawyers, C.L. The phosphatidylinositol 3-Kinase–AKT pathway in human cancer. Nat. Rev. Cancer 2002, 2, 489. [Google Scholar] [CrossRef] [PubMed]
- Sercombe, L.; Veerati, T.; Moheimani, F.; Wu, S.Y.; Sood, A.K.; Hua, S. Advances and challenges of liposome assisted drug delivery. Front. Pharmacol. 2015, 6, 286. [Google Scholar] [CrossRef]
- Olusanya, T.O.B.; Haj Ahmad, R.R.; Ibegbu, D.M.; Smith, J.R.; Elkordy, A.A. Liposomal drug delivery systems and anticancer drugs. Molecules 2018, 23, 907. [Google Scholar] [CrossRef]
- Jose, A.; Mandapalli, P.K.; Venuganti, V.V.K. Liposomal hydrogel formulation for transdermal delivery of pirfenidone. J. Liposome Res. 2016, 26, 139–147. [Google Scholar] [CrossRef]
- Dong, Y.; Feng, S.-S. Methoxy poly(ethylene glycol)-poly(lactide) (MPEG-PLA) nanoparticles for controlled delivery of anticancer drugs. Biomaterials 2004, 25, 2843–2849. [Google Scholar] [CrossRef]
- Kawakami, S.; Suzuki, S.; Yamashita, F.; Hashida, M. Induction of apoptosis in A549 human lung cancer cells by all-trans retinoic acid incorporated in DOTAP/cholesterol liposomes. J. Control. Release 2006, 110, 514–521. [Google Scholar] [CrossRef]
- Kang, J.H.; Jang, W.Y.; Ko, Y.T. The effect of surface charges on the cellular uptake of liposomes investigated by live cell imaging. Pharm. Res. 2017, 34, 704–717. [Google Scholar] [CrossRef]
- Miao, Z.-L.; Deng, Y.-J.; Du, H.-Y.; Suo, X.-B.; Wang, X.-Y.; Wang, X.; Wang, L.; Cui, L.-J.; Duan, N. Preparation of a liposomal delivery system and its in vitro release of rapamycin. Exp. Ther. Med. 2015, 9, 941–946. [Google Scholar] [CrossRef]
- Dabbagh, A.; Abu Kasim, N.H.; Yeong, C.H.; Wong, T.W.; Abdul Rahman, N. Critical parameters for particle-based pulmonary delivery of chemotherapeutics. J. Aerosol Med. Pulm. Drug Deliv. 2017, 31, 139–154. [Google Scholar] [CrossRef]
- Kozono, S.; Ohuchida, K.; Eguchi, D.; Ikenaga, N.; Fujiwara, K.; Cui, L.; Mizumoto, K.; Tanaka, M. Pirfenidone inhibits pancreatic cancer desmoplasia by regulating stellate cells. Cancer Res. 2013, 73, 2345–2356. [Google Scholar] [CrossRef]
- Yang, Y.; Ye, Y.; Lin, X.; Wu, K.; Yu, M. Inhibition of pirfenidone on TGF-beta2 induced proliferation, migration and epithlial-mesenchymal transition of human lens epithelial cells line SRA01/04. PLoS ONE 2013, 8. [Google Scholar] [CrossRef]
- Wang, J.; Yang, Y.; Xu, J.; Lin, X.; Wu, K.; Yu, M. Pirfenidone inhibits migration, differentiation, and proliferation of human retinal pigment epithelial cells in vitro. Mol. Vis. 2013, 19, 2626–2635. [Google Scholar]
- DeCicco-Skinner, K.L.; Henry, G.H.; Cataisson, C.; Tabib, T.; Gwilliam, J.C.; Watson, N.J.; Bullwinkle, E.M.; Falkenburg, L.; O’Neill, R.C.; Morin, A.; et al. Endothelial cell tube formation assay for the in vitro study of angiogenesis. J. Vis. Exp. 2014, e51312. [Google Scholar] [CrossRef]
- Liu, X.; Yang, Y.; Guo, X.; Liu, L.; Wu, K.; Yu, M. The antiangiogenesis effect of pirfenidone in wound healing in vitro. J. Ocul. Pharmacol. Ther. Off. J. Assoc. Ocul. Pharmacol. Ther. 2017, 33, 693–703. [Google Scholar] [CrossRef]
- Li, C.; Rezov, V.; Joensuu, E.; Vartiainen, V.; Rönty, M.; Yin, M.; Myllärniemi, M.; Koli, K. Pirfenidone decreases mesothelioma cell proliferation and migration via inhibition of ERK and AKT and regulates mesothelioma tumor microenvironment in vivo. Sci. Rep. 2018, 8, 10070. [Google Scholar] [CrossRef]
- In, G.K.; Nieva, J. Emerging chemotherapy agents in lung cancer: Nanoparticles therapeutics for non-small cell lung cancer. Transl. Cancer Res. 2015, 4, 340–355. [Google Scholar]
- Zhai, G.; Wu, J.; Yu, B.; Guo, C.; Yang, X.; Lee, R.J. A transferrin receptor-targeted liposomal formulation for docetaxel. J. Nanosci. Nanotechnol. 2010, 10, 5129–5136. [Google Scholar] [CrossRef]
- Chen, M.; Zhang, J.; Yu, S.; Wang, S.; Zhang, Z.; Chen, J.; Xiao, J.; Wang, Y. Anti-lung-cancer activity and liposome-based delivery systems of β-Elemene. Evid. Based Complement. Altern. Med. 2012, 2012, 259523. [Google Scholar] [CrossRef] [PubMed]
- Komiya, C.; Tanaka, M.; Tsuchiya, K.; Shimazu, N.; Mori, K.; Furuke, S.; Miyachi, Y.; Shiba, K.; Yamaguchi, S.; Ikeda, K.; et al. Antifibrotic effect of pirfenidone in a mouse model of human nonalcoholic steatohepatitis. Sci. Rep. 2017, 7, 44754. [Google Scholar] [CrossRef] [PubMed]
- Zhang, L.; Wu, J.; Ling, M.T.; Zhao, L.; Zhao, K.-N. The role of the PI3K/Akt/mTOR signalling pathway in human cancers induced by infection with human papillomaviruses. Mol. Cancer 2015, 14, 87. [Google Scholar] [CrossRef] [PubMed]
- Nakayama, S.; Sng, N.; Carretero, J.; Welner, R.; Hayashi, Y.; Yamamoto, M.; Tan, A.J.; Yamaguchi, N.; Yasuda, H.; Li, D.; et al. β-catenin contributes to lung tumor development induced by EGFR mutations. Cancer Res. 2014, 74, 5891–5902. [Google Scholar] [CrossRef] [PubMed]
- Sun, Y.; Zhang, Y.; Chi, P. Pirfenidone suppresses TGF-β1-induced human intestinal fibroblasts activities by regulating proliferation and apoptosis via the inhibition of the Smad and PI3K/AKT signaling pathway. Mol. Med. Rep. 2018, 18, 3907–3913. [Google Scholar] [CrossRef]


| Code | Molar ratio and Total Lipid (mM) | Technique | Drug Quantity | Hydrating Medium | Particle Size (nm) | PDI | Zeta Potential (mV) | % Entrapment |
|---|---|---|---|---|---|---|---|---|
| F1 | 7:3 (20 mM) | Passive; Extrusion | 5 mg | 2.5 mg drug/mL water | 179.0 | 0.156 | - | 2.135 |
| F2 | 5:5 (20 mM) | Passive; Extrusion | 5 mg | 2.5 mg drug/mL water | 120.4 | 0.120 | - | 1.138 |
| F3 | 7:3 (20 mM) | Active pH 3.0; Extrusion | 5 mg | Water | 582.4 | 0.232 | - | 0.251 |
| F4 | 5:5 (20 mM) | Active pH 3.0; Extrusion | 5 mg | Water | 138.1 | 0.038 | - | 0.404 |
| F5 | 5:5 (10 mM) | Passive; Ultra Probe sonication | 5 mg | Water | 92.74 | 0.202 | -5.9 | 71.7 |
| F6 | 5:5 (10 mM) | Passive; Ultra Probe sonication and Freeze-thawed | 5 mg | HEPES buffer | 120.9 | 0.350 | 0.369 | 97.7 |
| F7 | 5:5 (10 mM) | Passive; Ultra Probe sonication and Freeze-thawed | 10 mg | HEPES buffer | 187.7 | 0.383 | -1.13 | 106.7 |
| F8 (PFD–Lip) | 5:5 (10 mM) Regular | Passive; Probe sonication and Freeze-thawed | 20 mg | HEPES buffer | 214.08 ± 7.3 | 0.4 ± 0.1 | 0.02 ± 1.3 | 100.58 ± 1.5 |
| F9 (PFD–D-Lip) | 5:5 (10 mM) DOTAP (5%) | Passive; Probe sonication and Freeze-thawed | 20 mg | HEPES buffer | 211.8 ± 12 | 0.3 ± 0.07 | 42.2 ± 10 | 98.2 ± 4.7 |
| F10 | 5:5 (10 mM) DOTAP (10%) | Passive; Probe sonication and Freeze-thawed | 20 mg | HEPES buffer | 243.2 | 0.323 | 46.9 | 104.7 |
| Cell Line | Pirfenidone | PFD–Lip | PFD–D-Lip |
|---|---|---|---|
| A549 | 0.43 ± 0.11 | 0.37 ± 0.21 | 0.2 ± 0.19 |
| H4006 | 0.45 ± 0.01 | 0.42 ± 0.04 | 0.34 ± 0.03 a, b |
| H157 | 0.57 ± 0.11 | 0.35 ± 0.11 | 0.24 ± 0.08 c |
| H460 | 0.27 ± 0.08 | 0.19 ± 0.06 | 0.15 ± 0.1 |
© 2020 by the authors. Licensee MDPI, Basel, Switzerland. This article is an open access article distributed under the terms and conditions of the Creative Commons Attribution (CC BY) license (http://creativecommons.org/licenses/by/4.0/).
Share and Cite
Parvathaneni, V.; Kulkarni, N.S.; Shukla, S.K.; Farrales, P.T.; Kunda, N.K.; Muth, A.; Gupta, V. Systematic Development and Optimization of Inhalable Pirfenidone Liposomes for Non-Small Cell Lung Cancer Treatment. Pharmaceutics 2020, 12, 206. https://doi.org/10.3390/pharmaceutics12030206
Parvathaneni V, Kulkarni NS, Shukla SK, Farrales PT, Kunda NK, Muth A, Gupta V. Systematic Development and Optimization of Inhalable Pirfenidone Liposomes for Non-Small Cell Lung Cancer Treatment. Pharmaceutics. 2020; 12(3):206. https://doi.org/10.3390/pharmaceutics12030206
Chicago/Turabian StyleParvathaneni, Vineela, Nishant S. Kulkarni, Snehal K. Shukla, Pamela T. Farrales, Nitesh K. Kunda, Aaron Muth, and Vivek Gupta. 2020. "Systematic Development and Optimization of Inhalable Pirfenidone Liposomes for Non-Small Cell Lung Cancer Treatment" Pharmaceutics 12, no. 3: 206. https://doi.org/10.3390/pharmaceutics12030206
APA StyleParvathaneni, V., Kulkarni, N. S., Shukla, S. K., Farrales, P. T., Kunda, N. K., Muth, A., & Gupta, V. (2020). Systematic Development and Optimization of Inhalable Pirfenidone Liposomes for Non-Small Cell Lung Cancer Treatment. Pharmaceutics, 12(3), 206. https://doi.org/10.3390/pharmaceutics12030206