Solid Lipid Nanoparticles as Formulative Strategy to Increase Oral Permeation of a Molecule Active in Multidrug-Resistant Tuberculosis Management


 ,
,  ,
,  ,
,  and
and
Abstract
: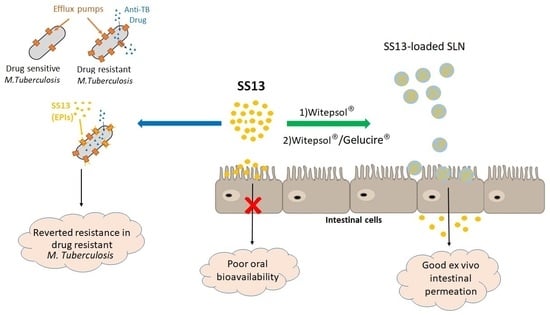
1. Introduction
2. Materials and Methods
2.1. Materials
2.2. Antimycobacterial Activity Assay
2.3. Determination of SS13 Solubility and Partition Coefficient
2.4. Preparation of SLNs
2.5. Evaluation of SS13 Loading
2.6. Analysis of Particle Size, Polydispersity and Zeta Potential of Loaded and Unloaded SLNs
2.7. Morphological Analysis
2.7.1. Transmission Electron Microscopy
2.7.2. Atomic Force Microscopy
2.8. Fourier Transform Infrared Spectrometry Analysis
2.9. X-ray Analysis
2.10. Physical Stability Studies
2.11. In Vitro SS13 Release Study
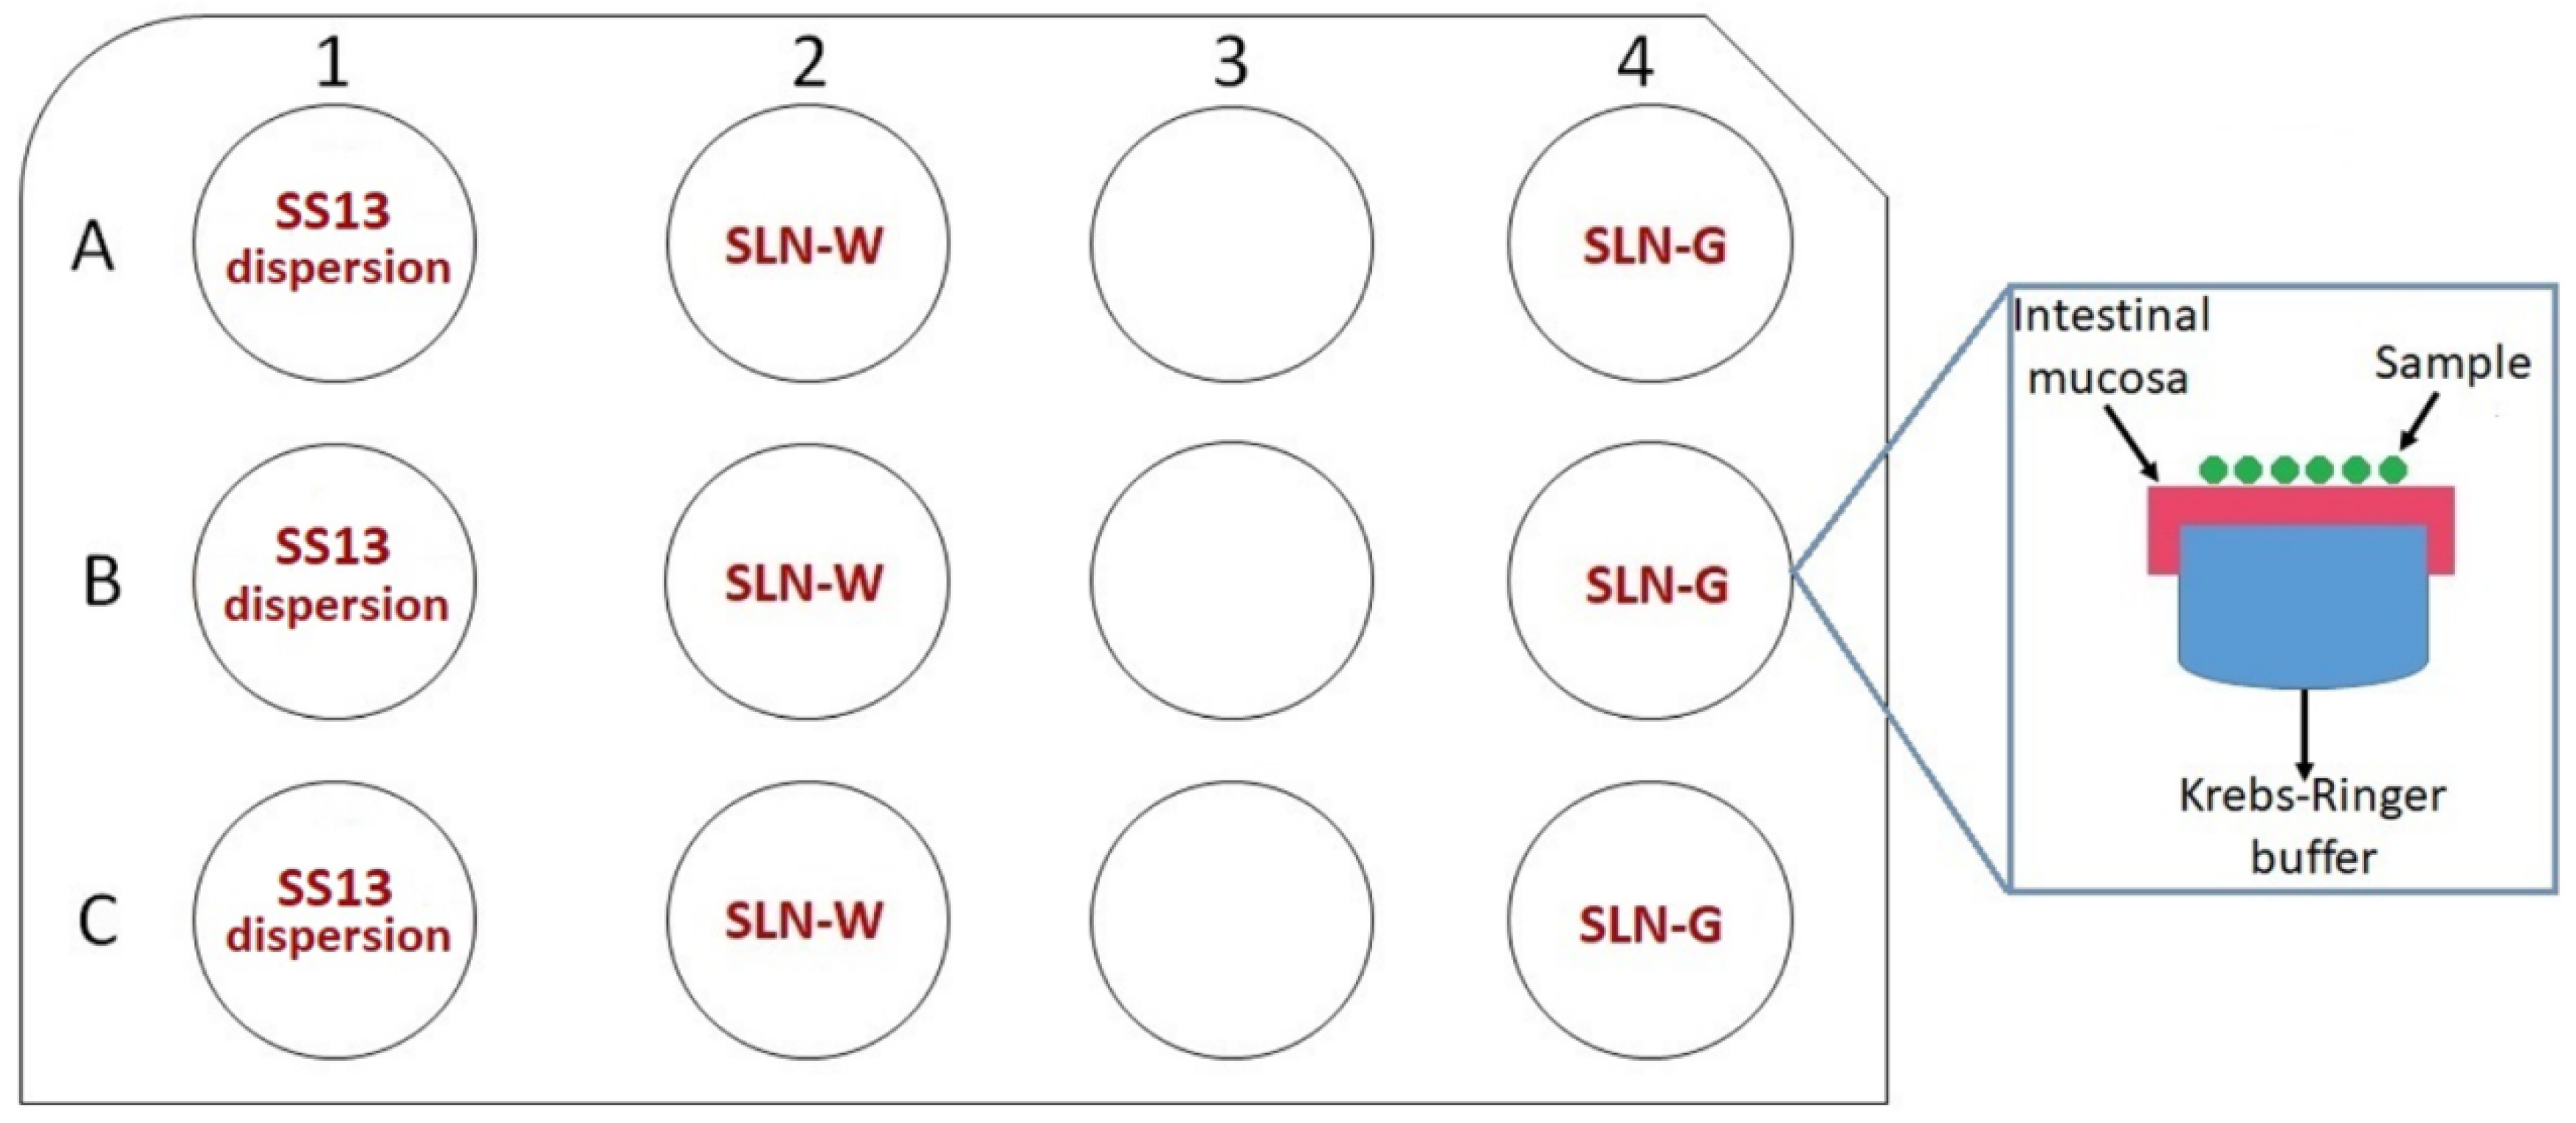
2.12. Ex Vivo Permeation Studies on Intestinal Mucosa
2.13. In Vitro Cytotoxicity Evaluation
2.13.1. Cell Culture
2.13.2. MTT Assay
2.14. Statistical Analysis
3. Results and Discussion
3.1. Antimycobacterial Activity Assay
3.2. Determination of SS13 Solubility and Partition Coefficient
3.3. Preparation of SLNs
3.4. Determination of SS13 Loading
3.5. Analysis of Particle Size, Polydispersity and Zeta Potential of Loaded and Unloaded SLNs
3.6. Morphological Analysis
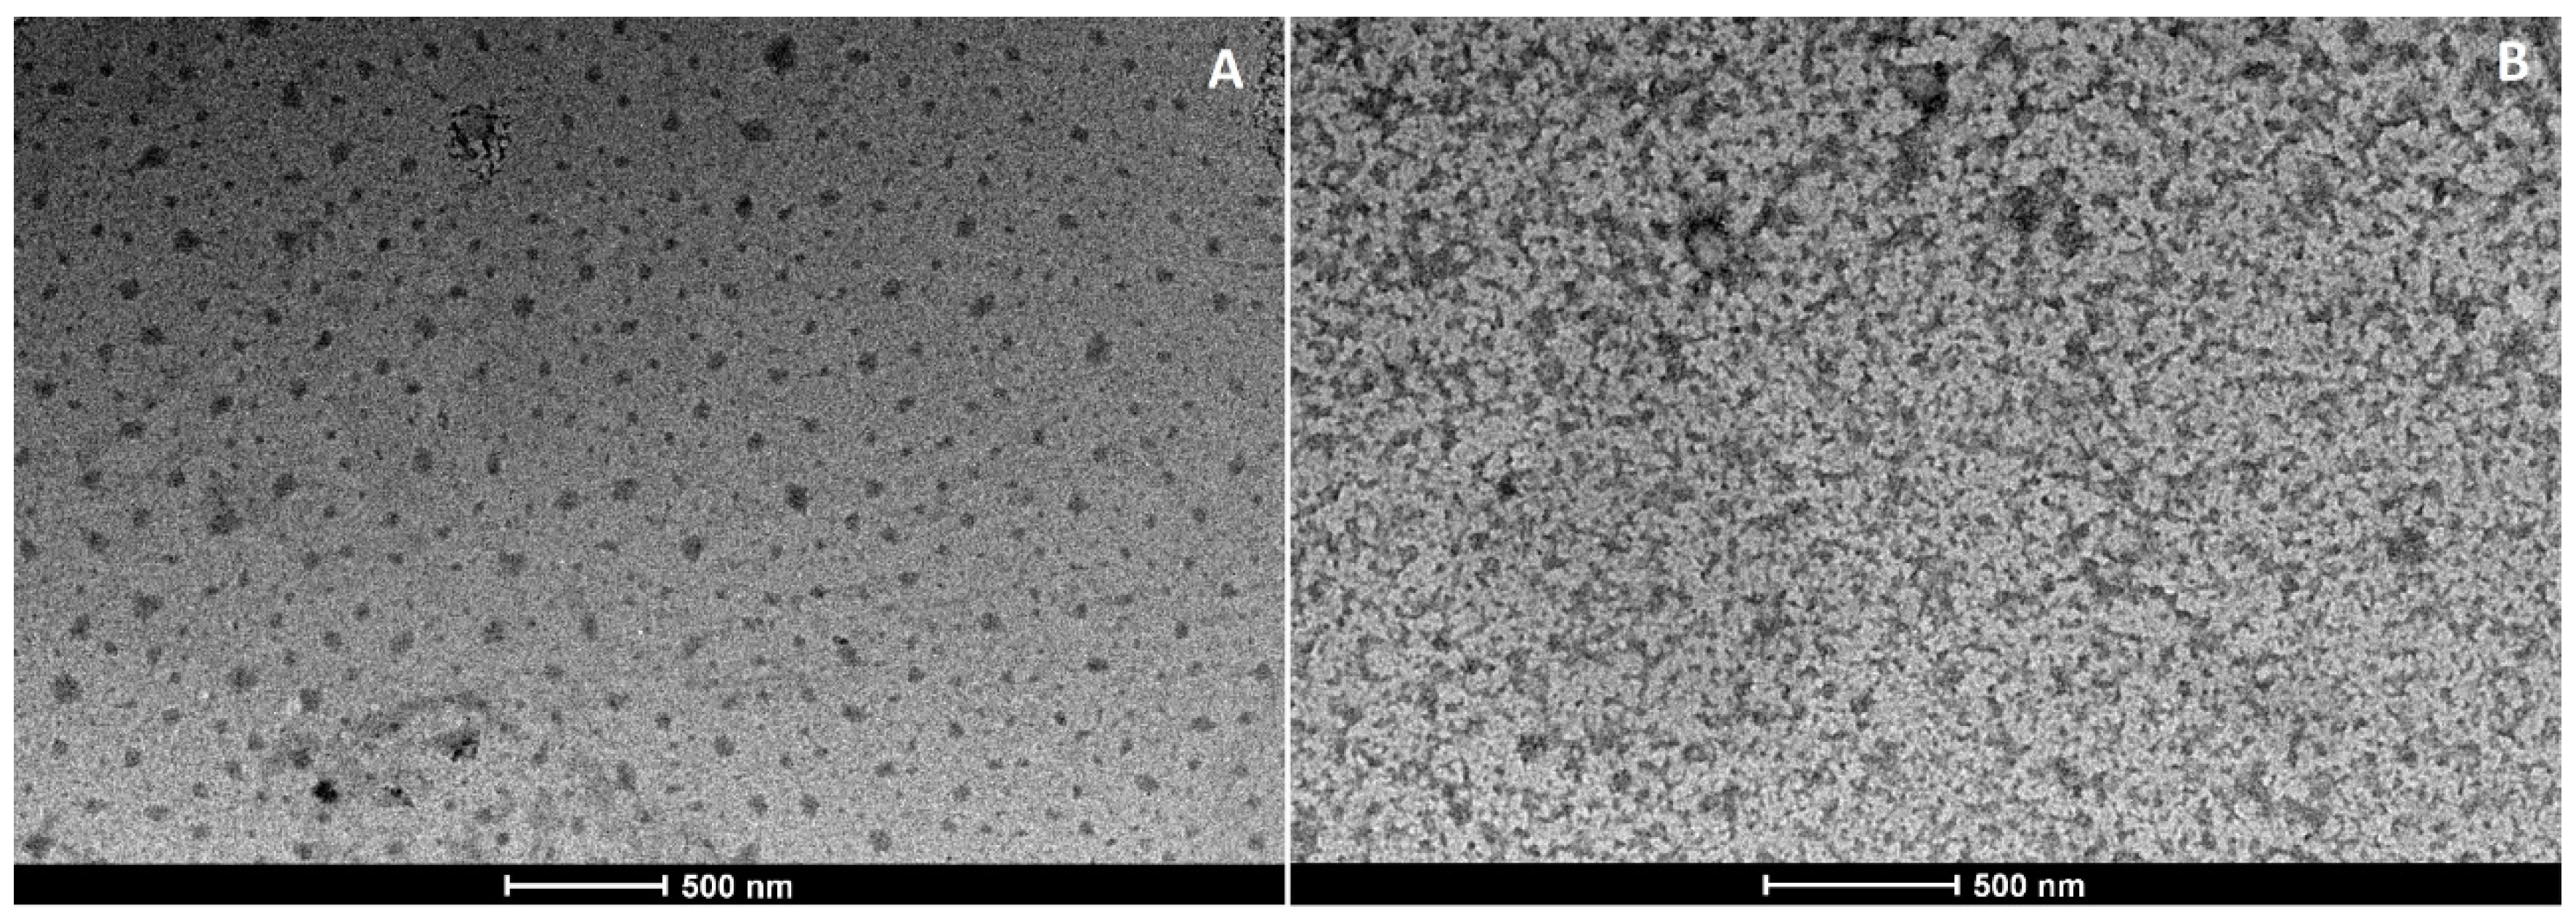
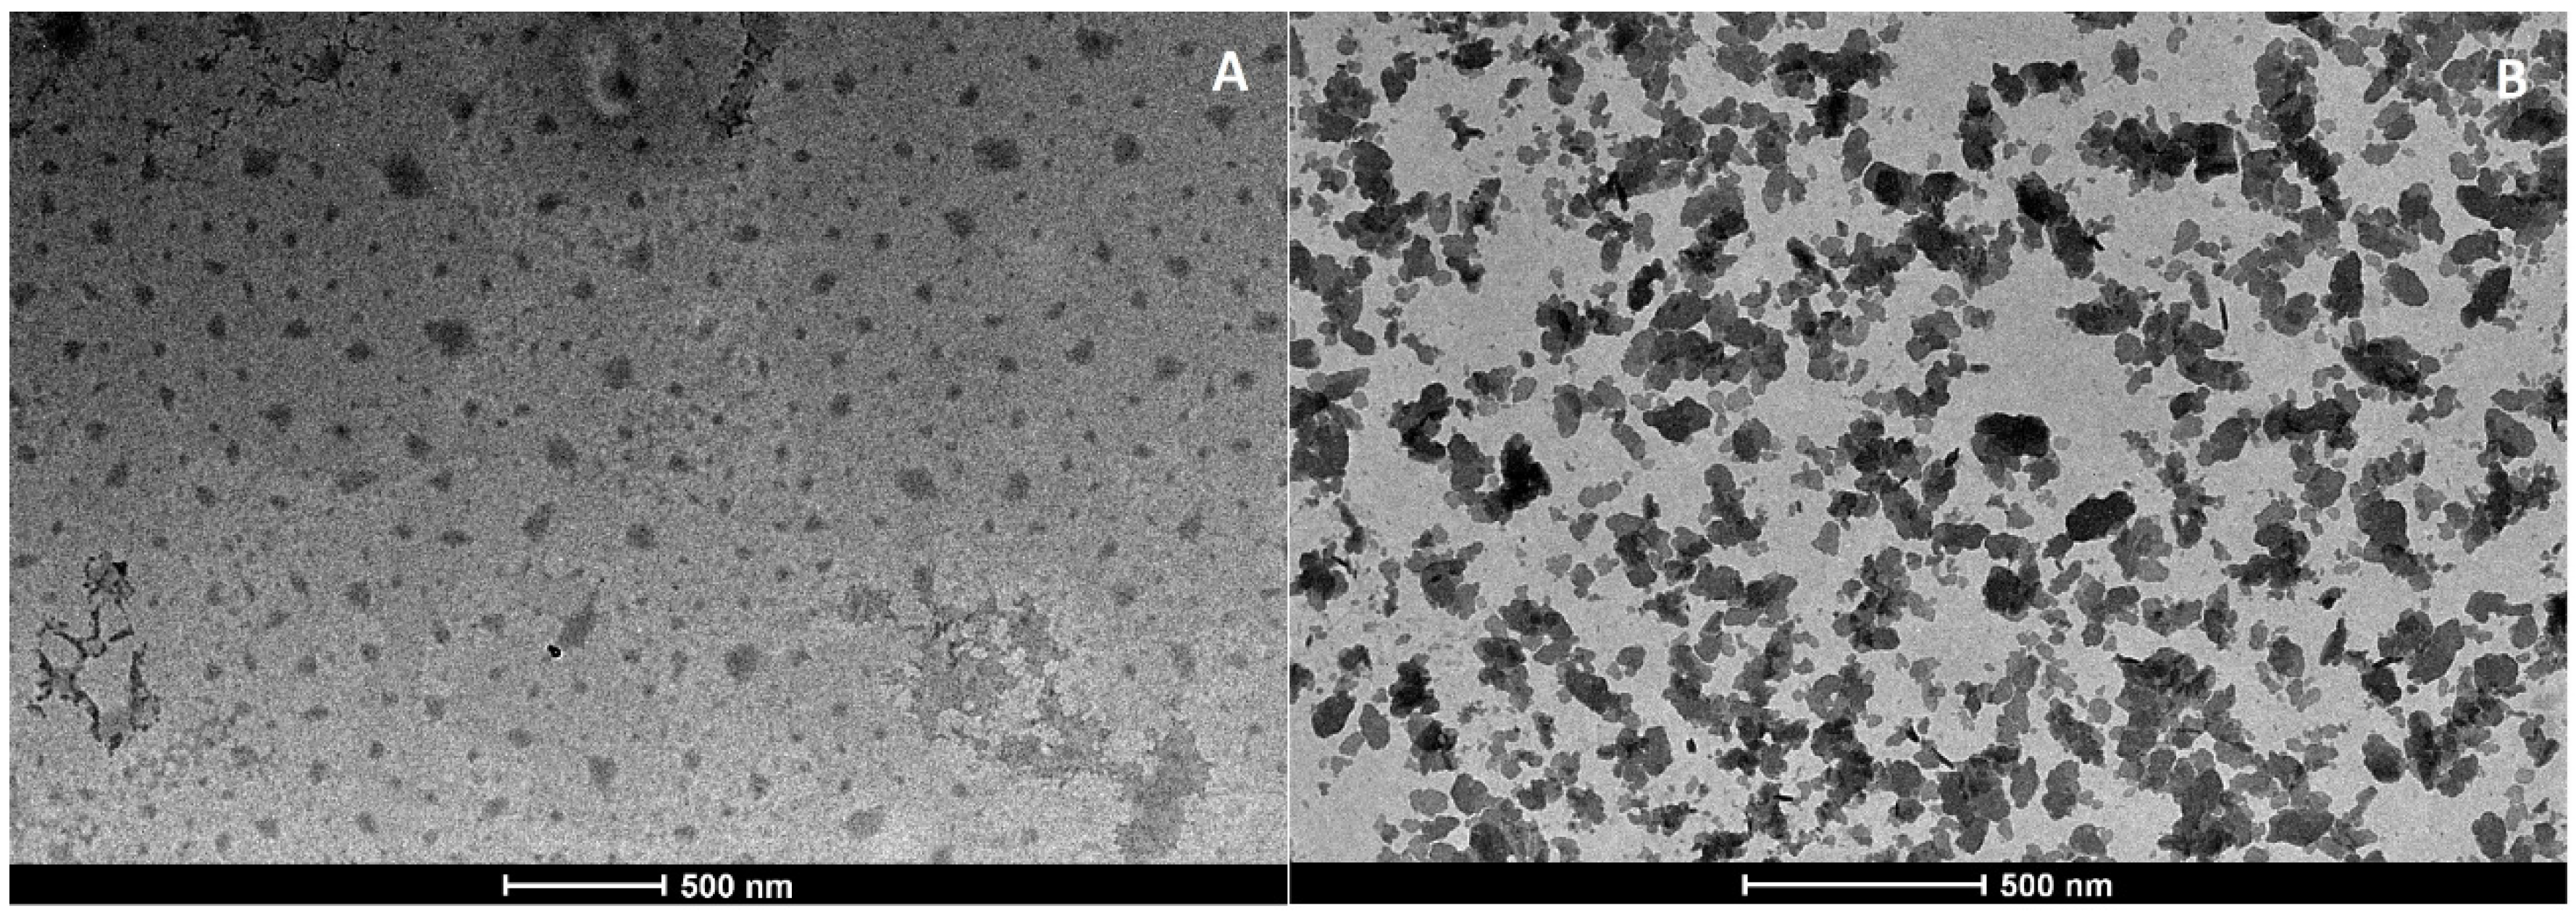
3.6.1. Transmission Electron Microscopy
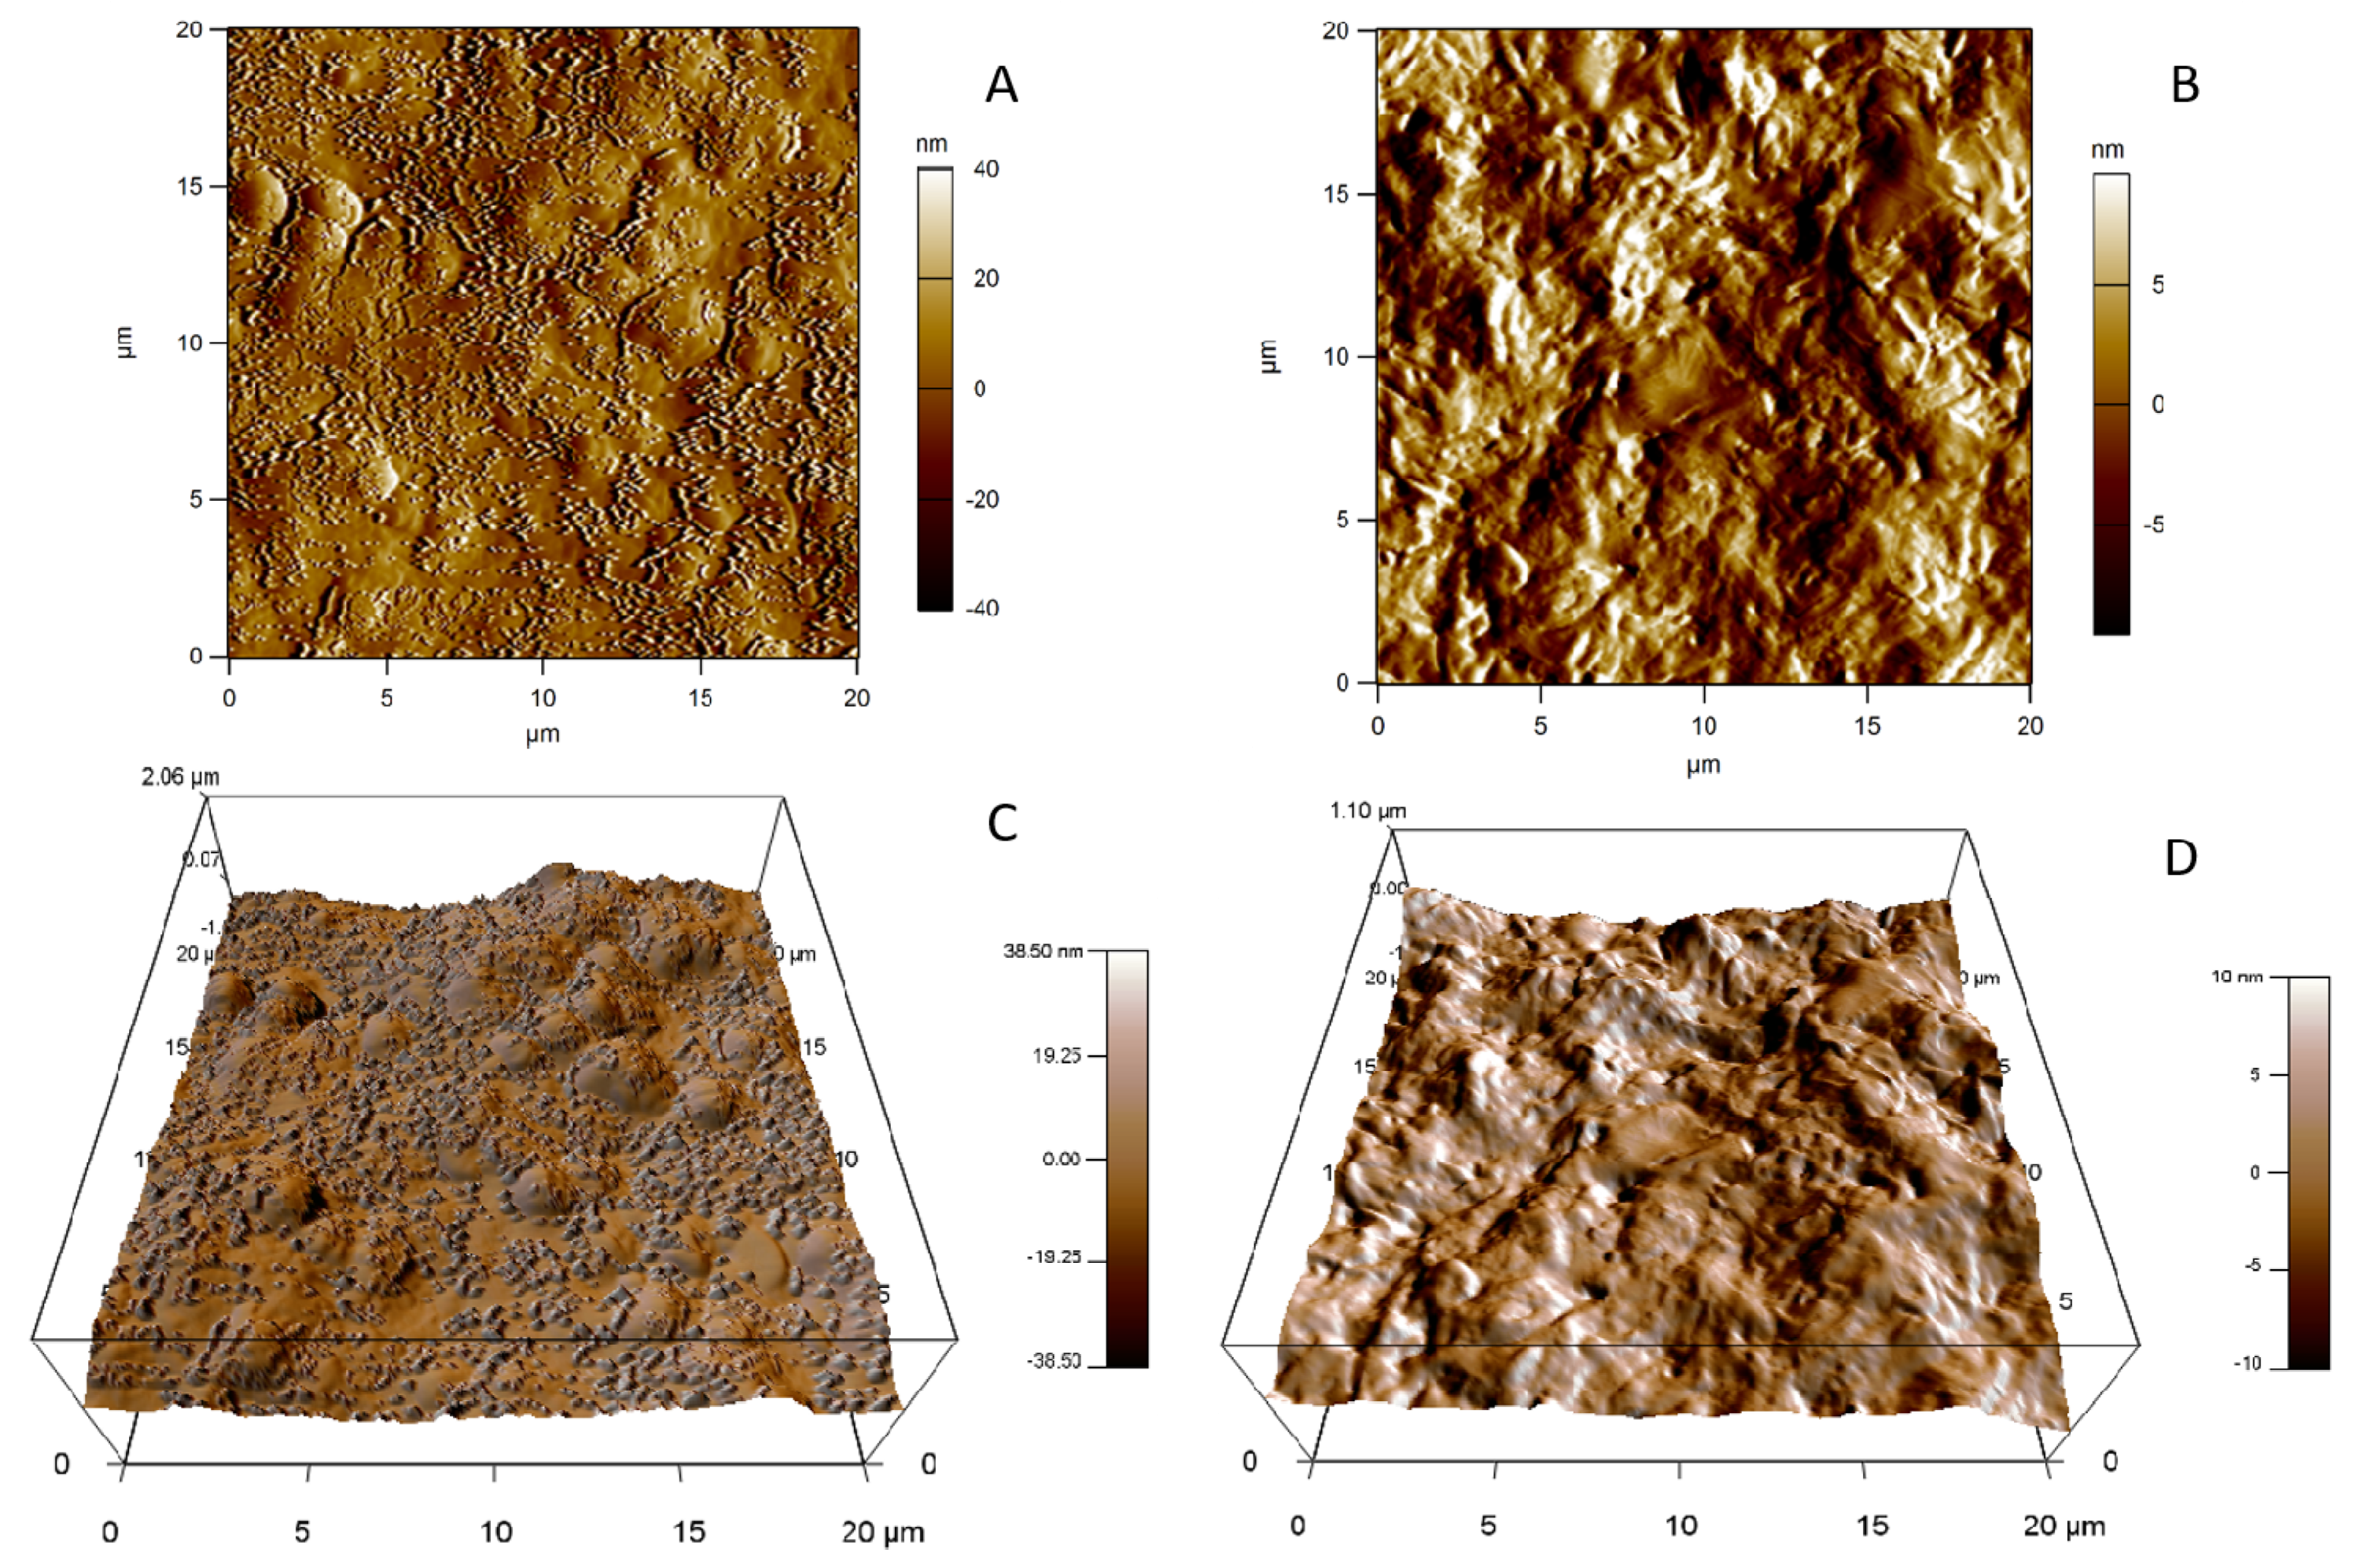
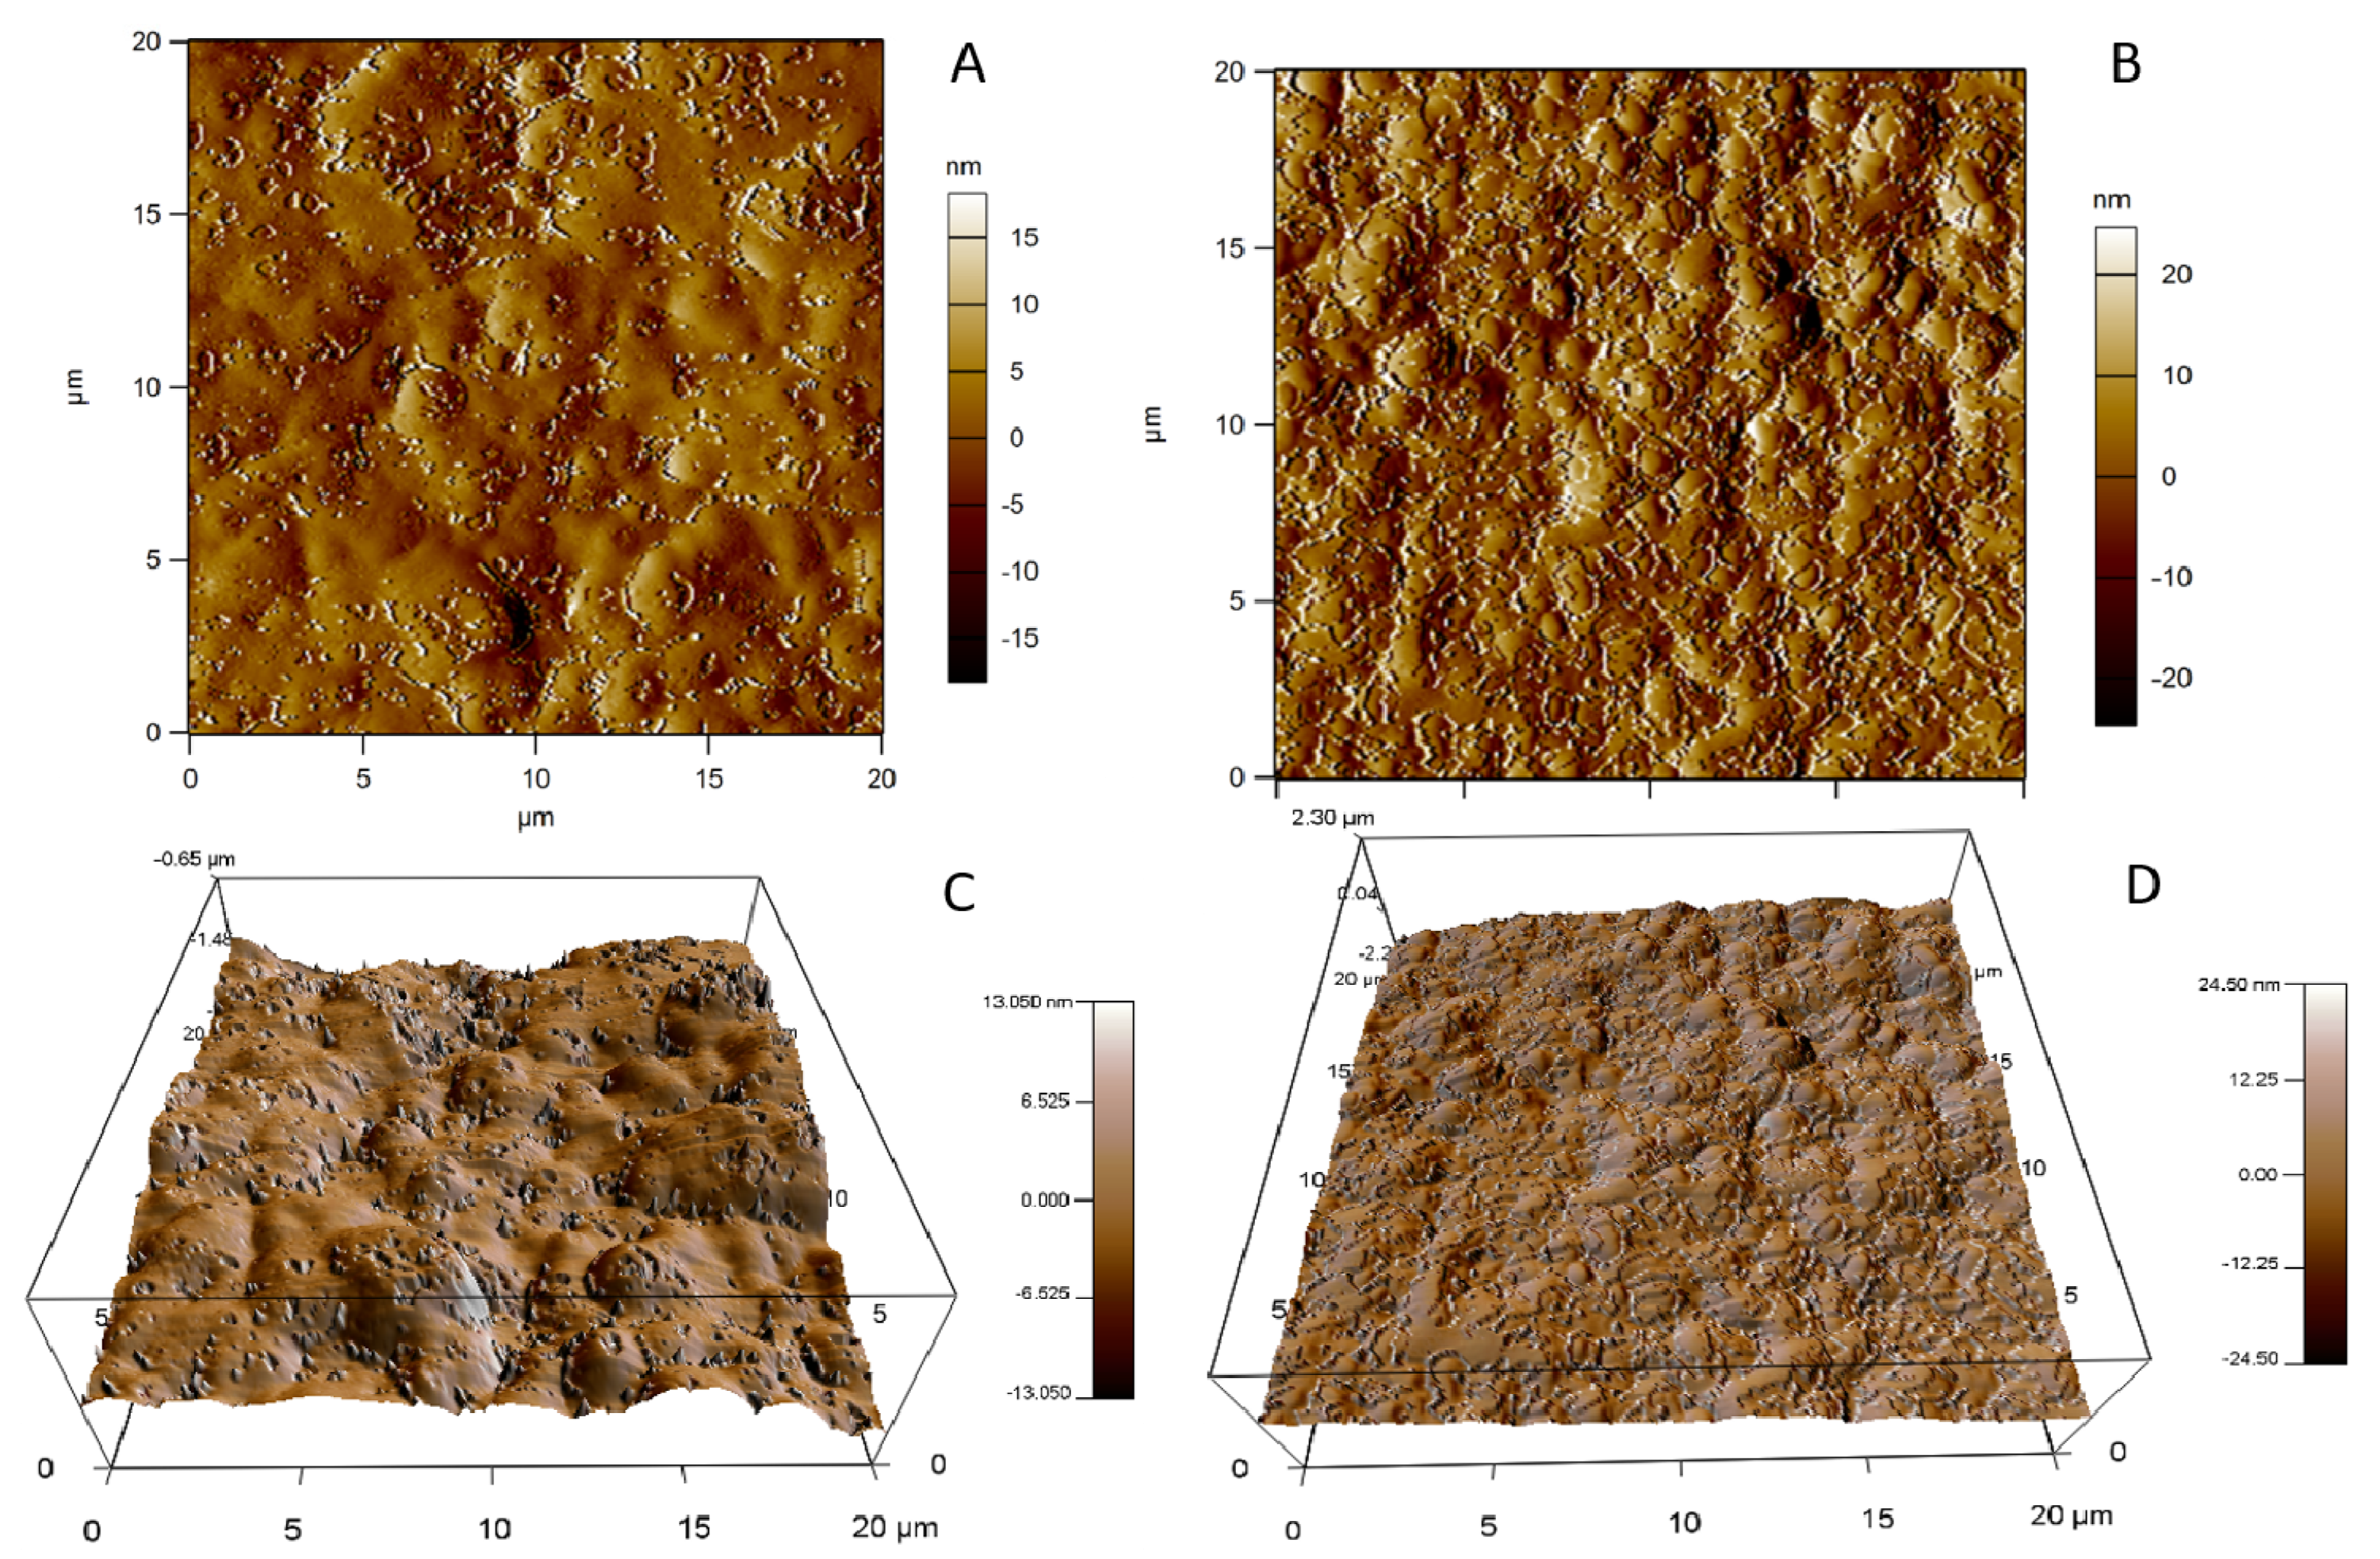
3.6.2. Atomic Force Microscopy
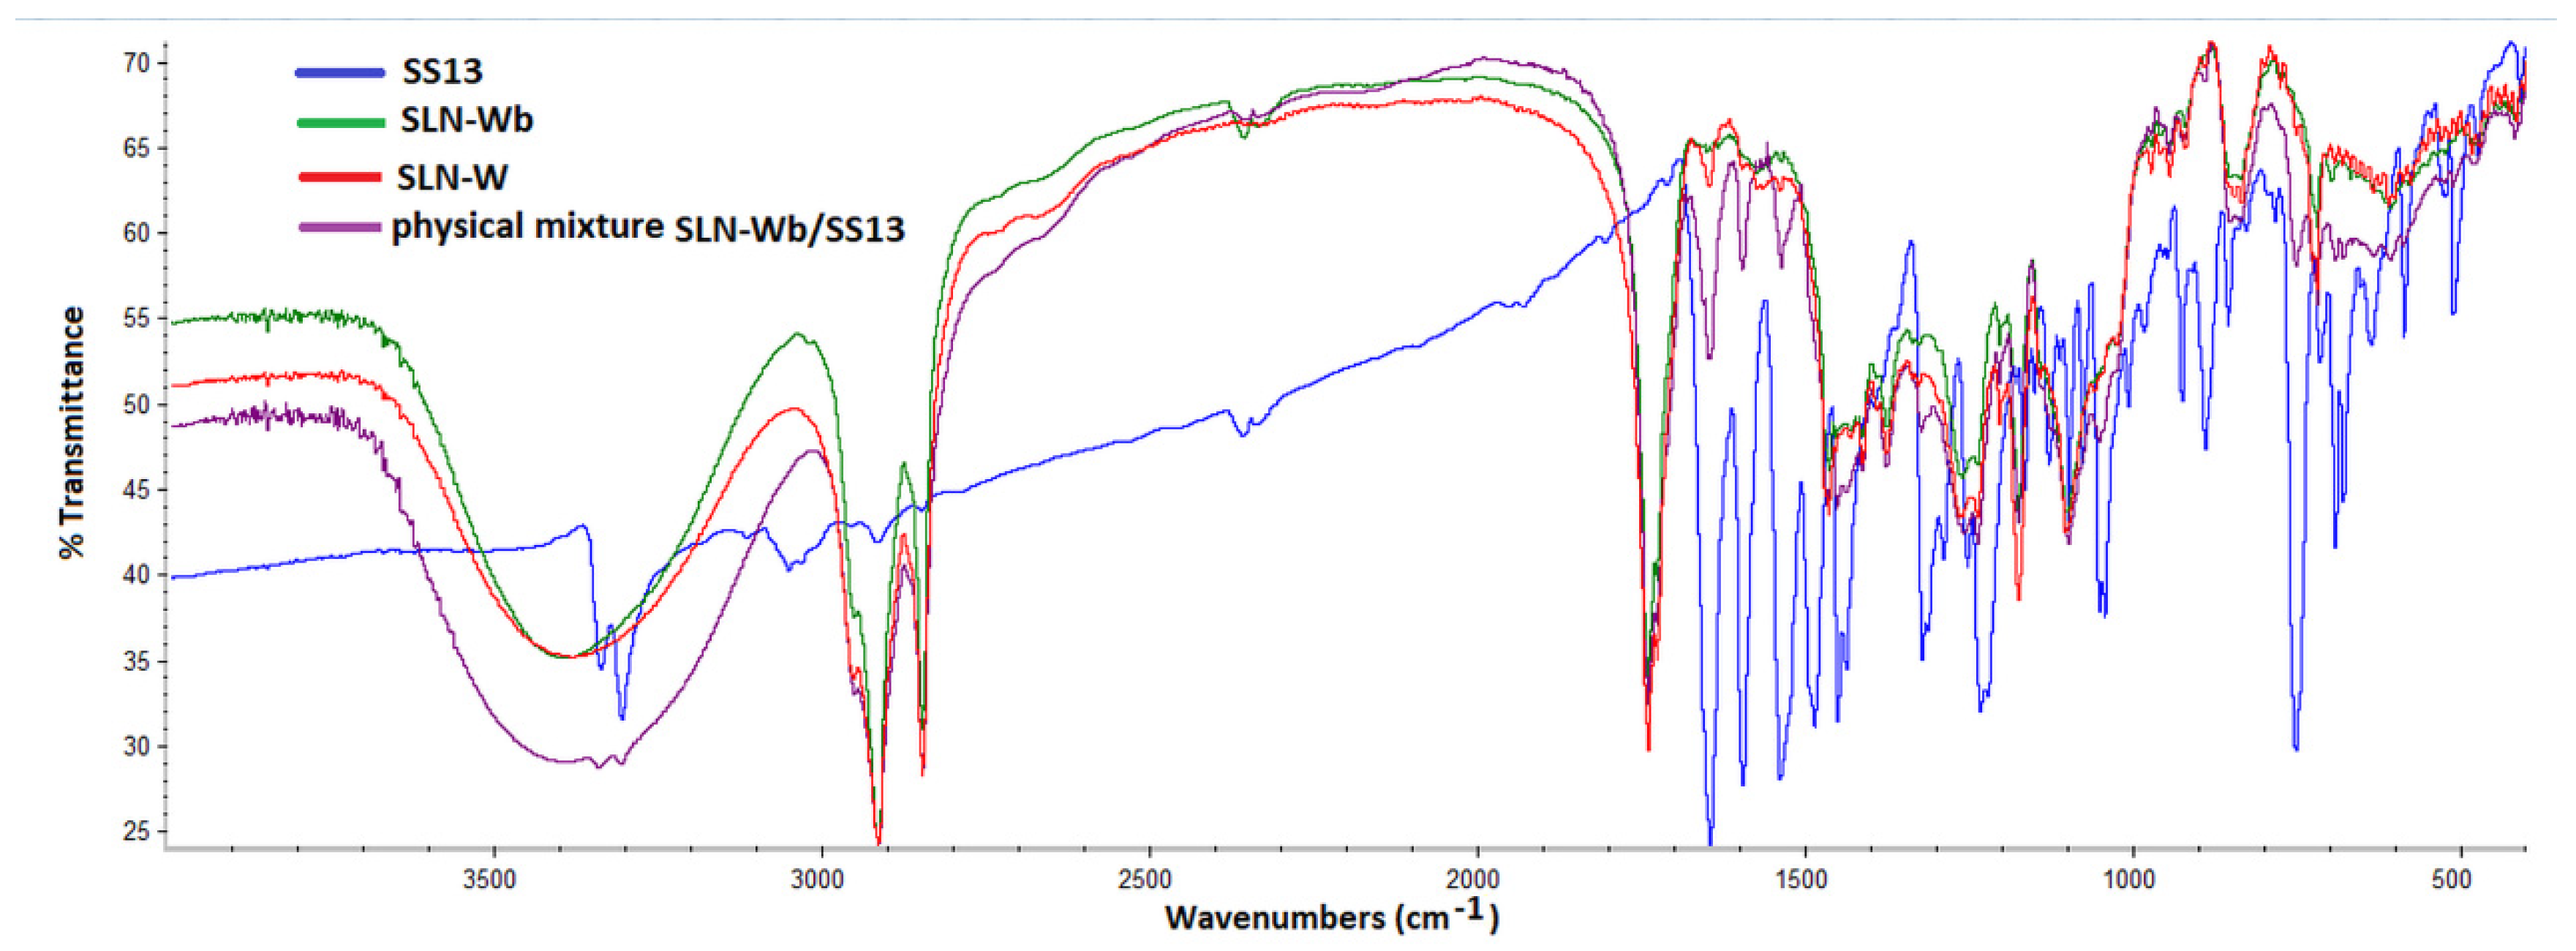
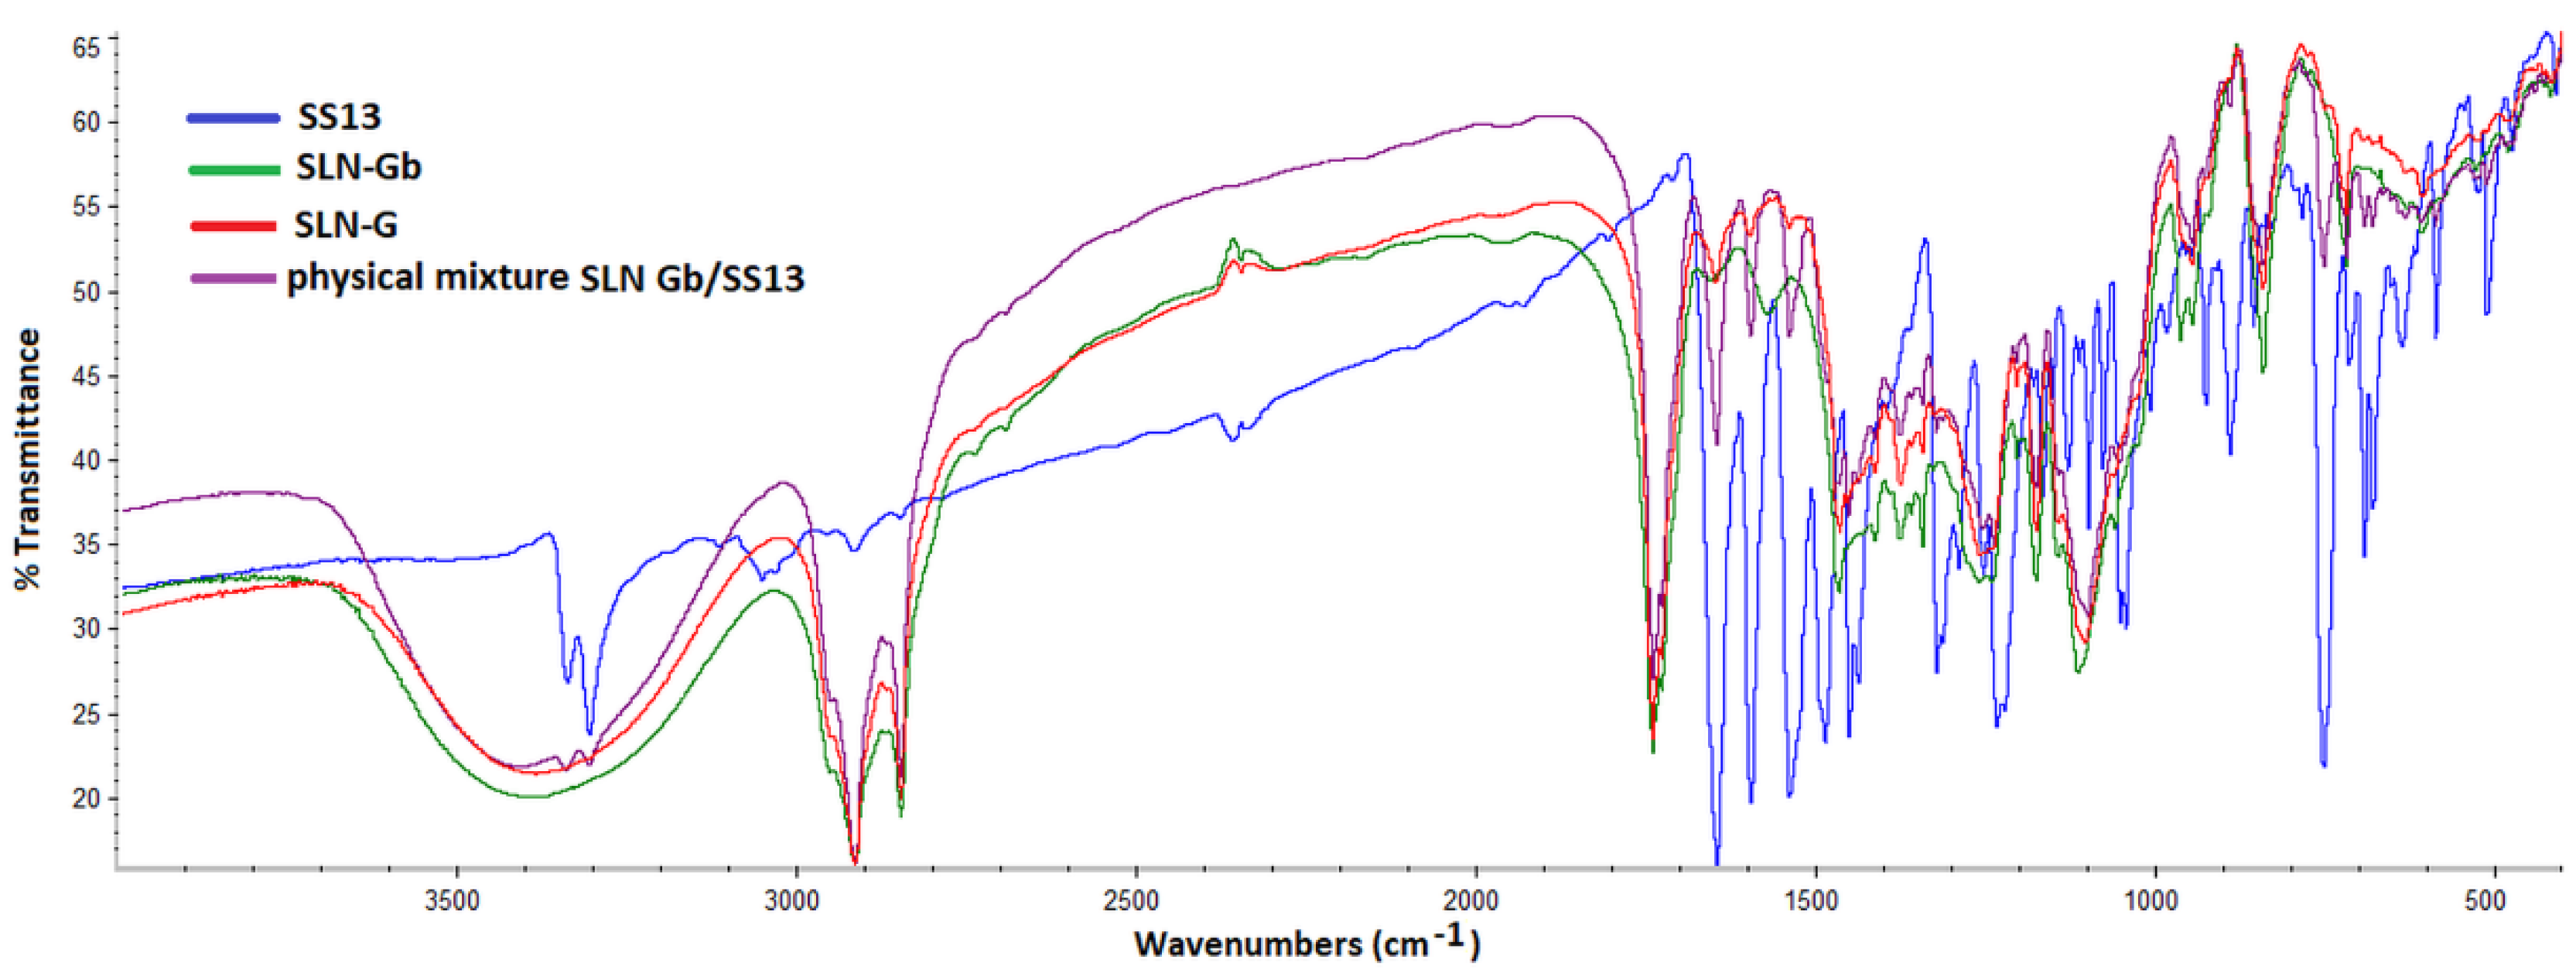
3.7. Fourier Transform Infrared Spectrometry Analysis
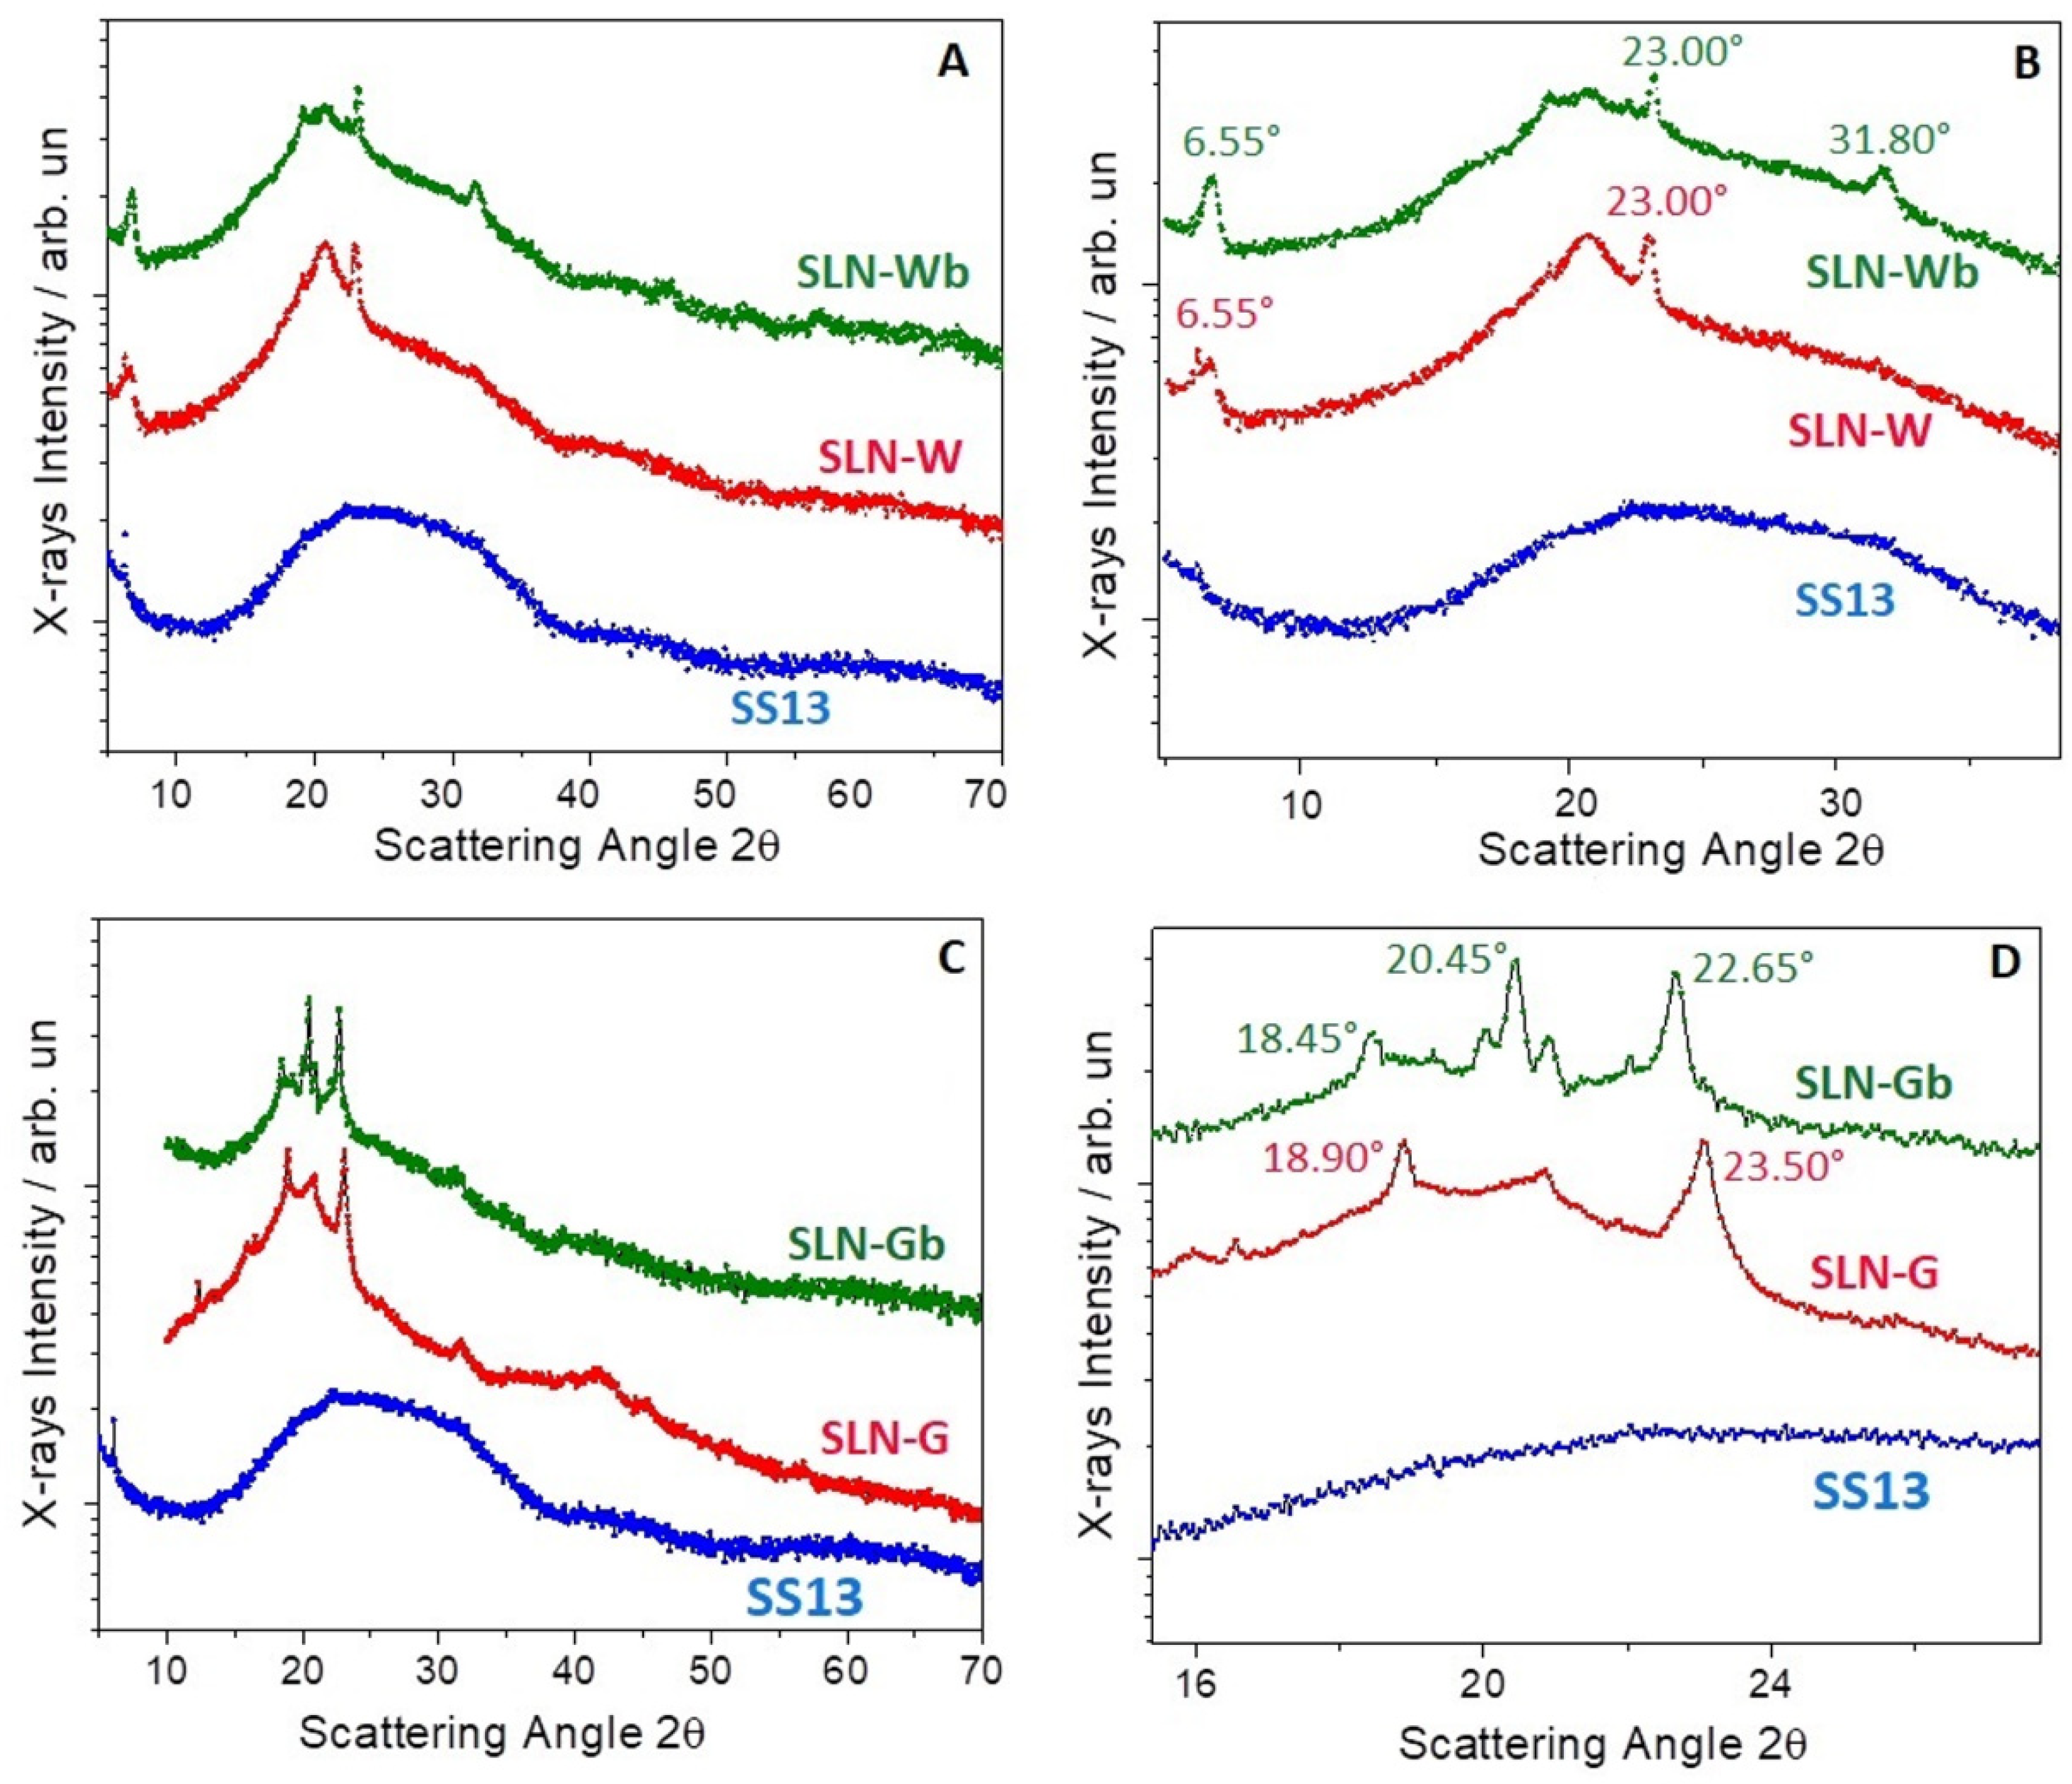
3.8. X-ray Analysis
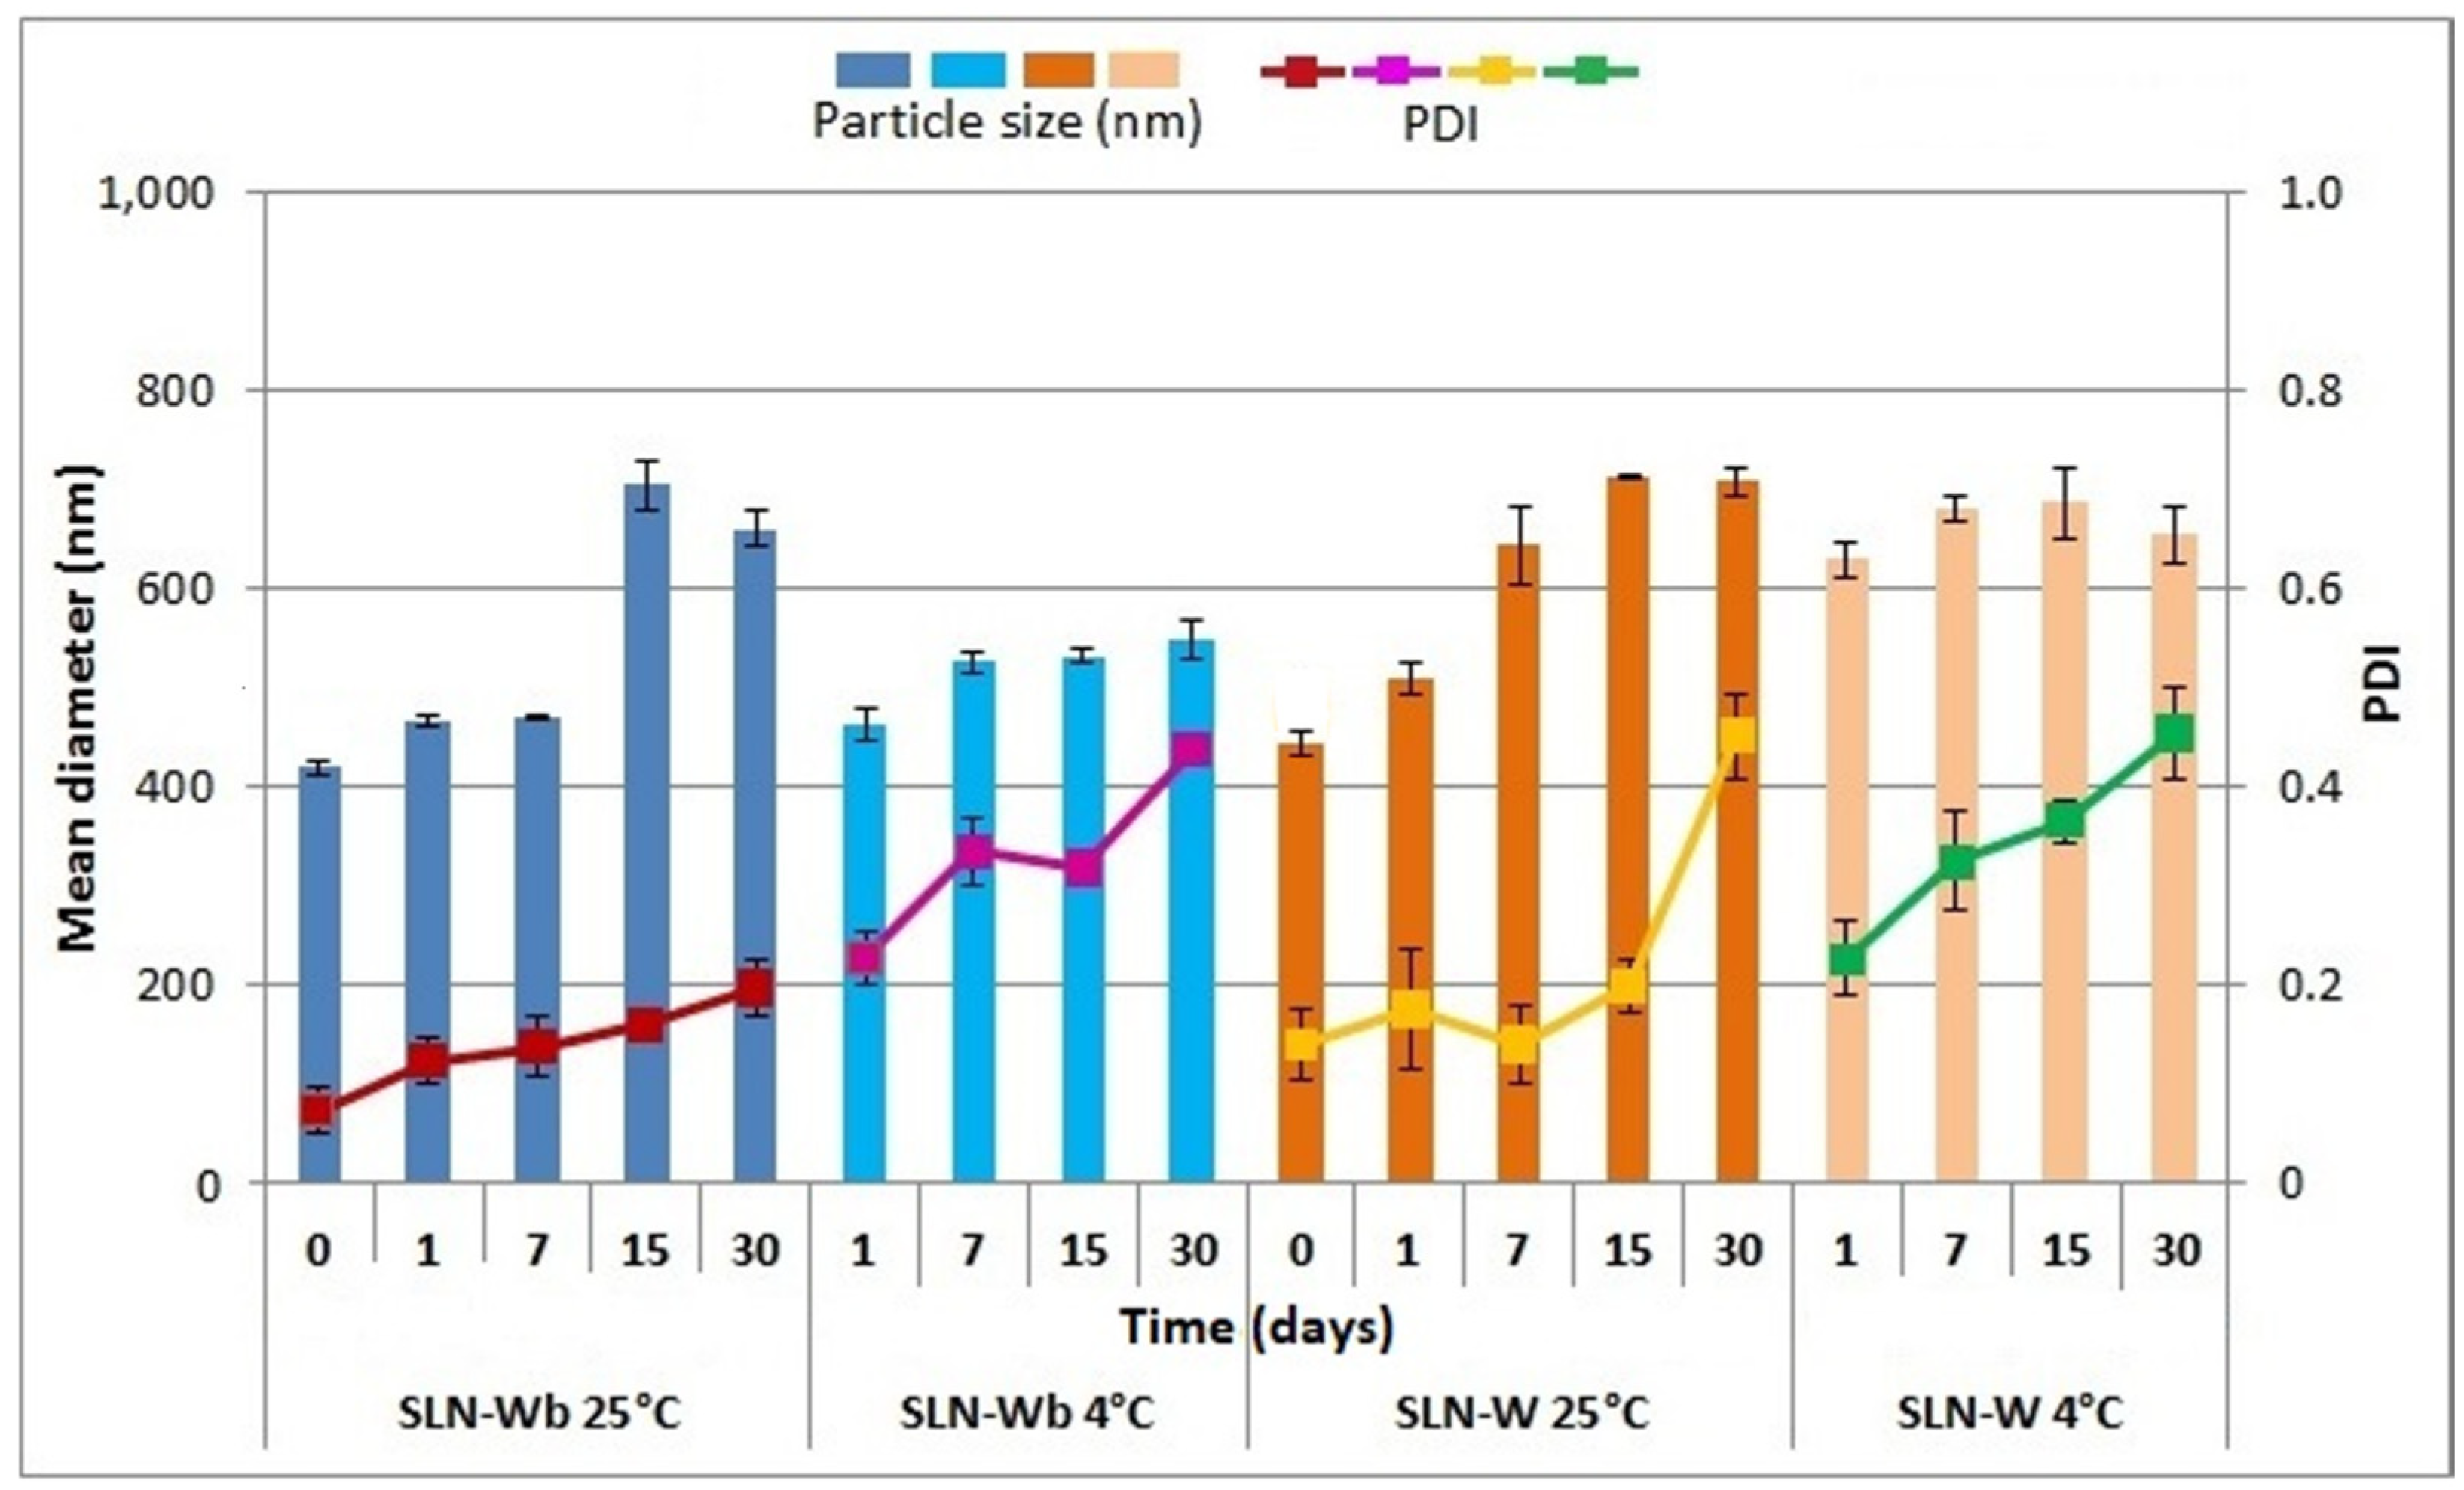
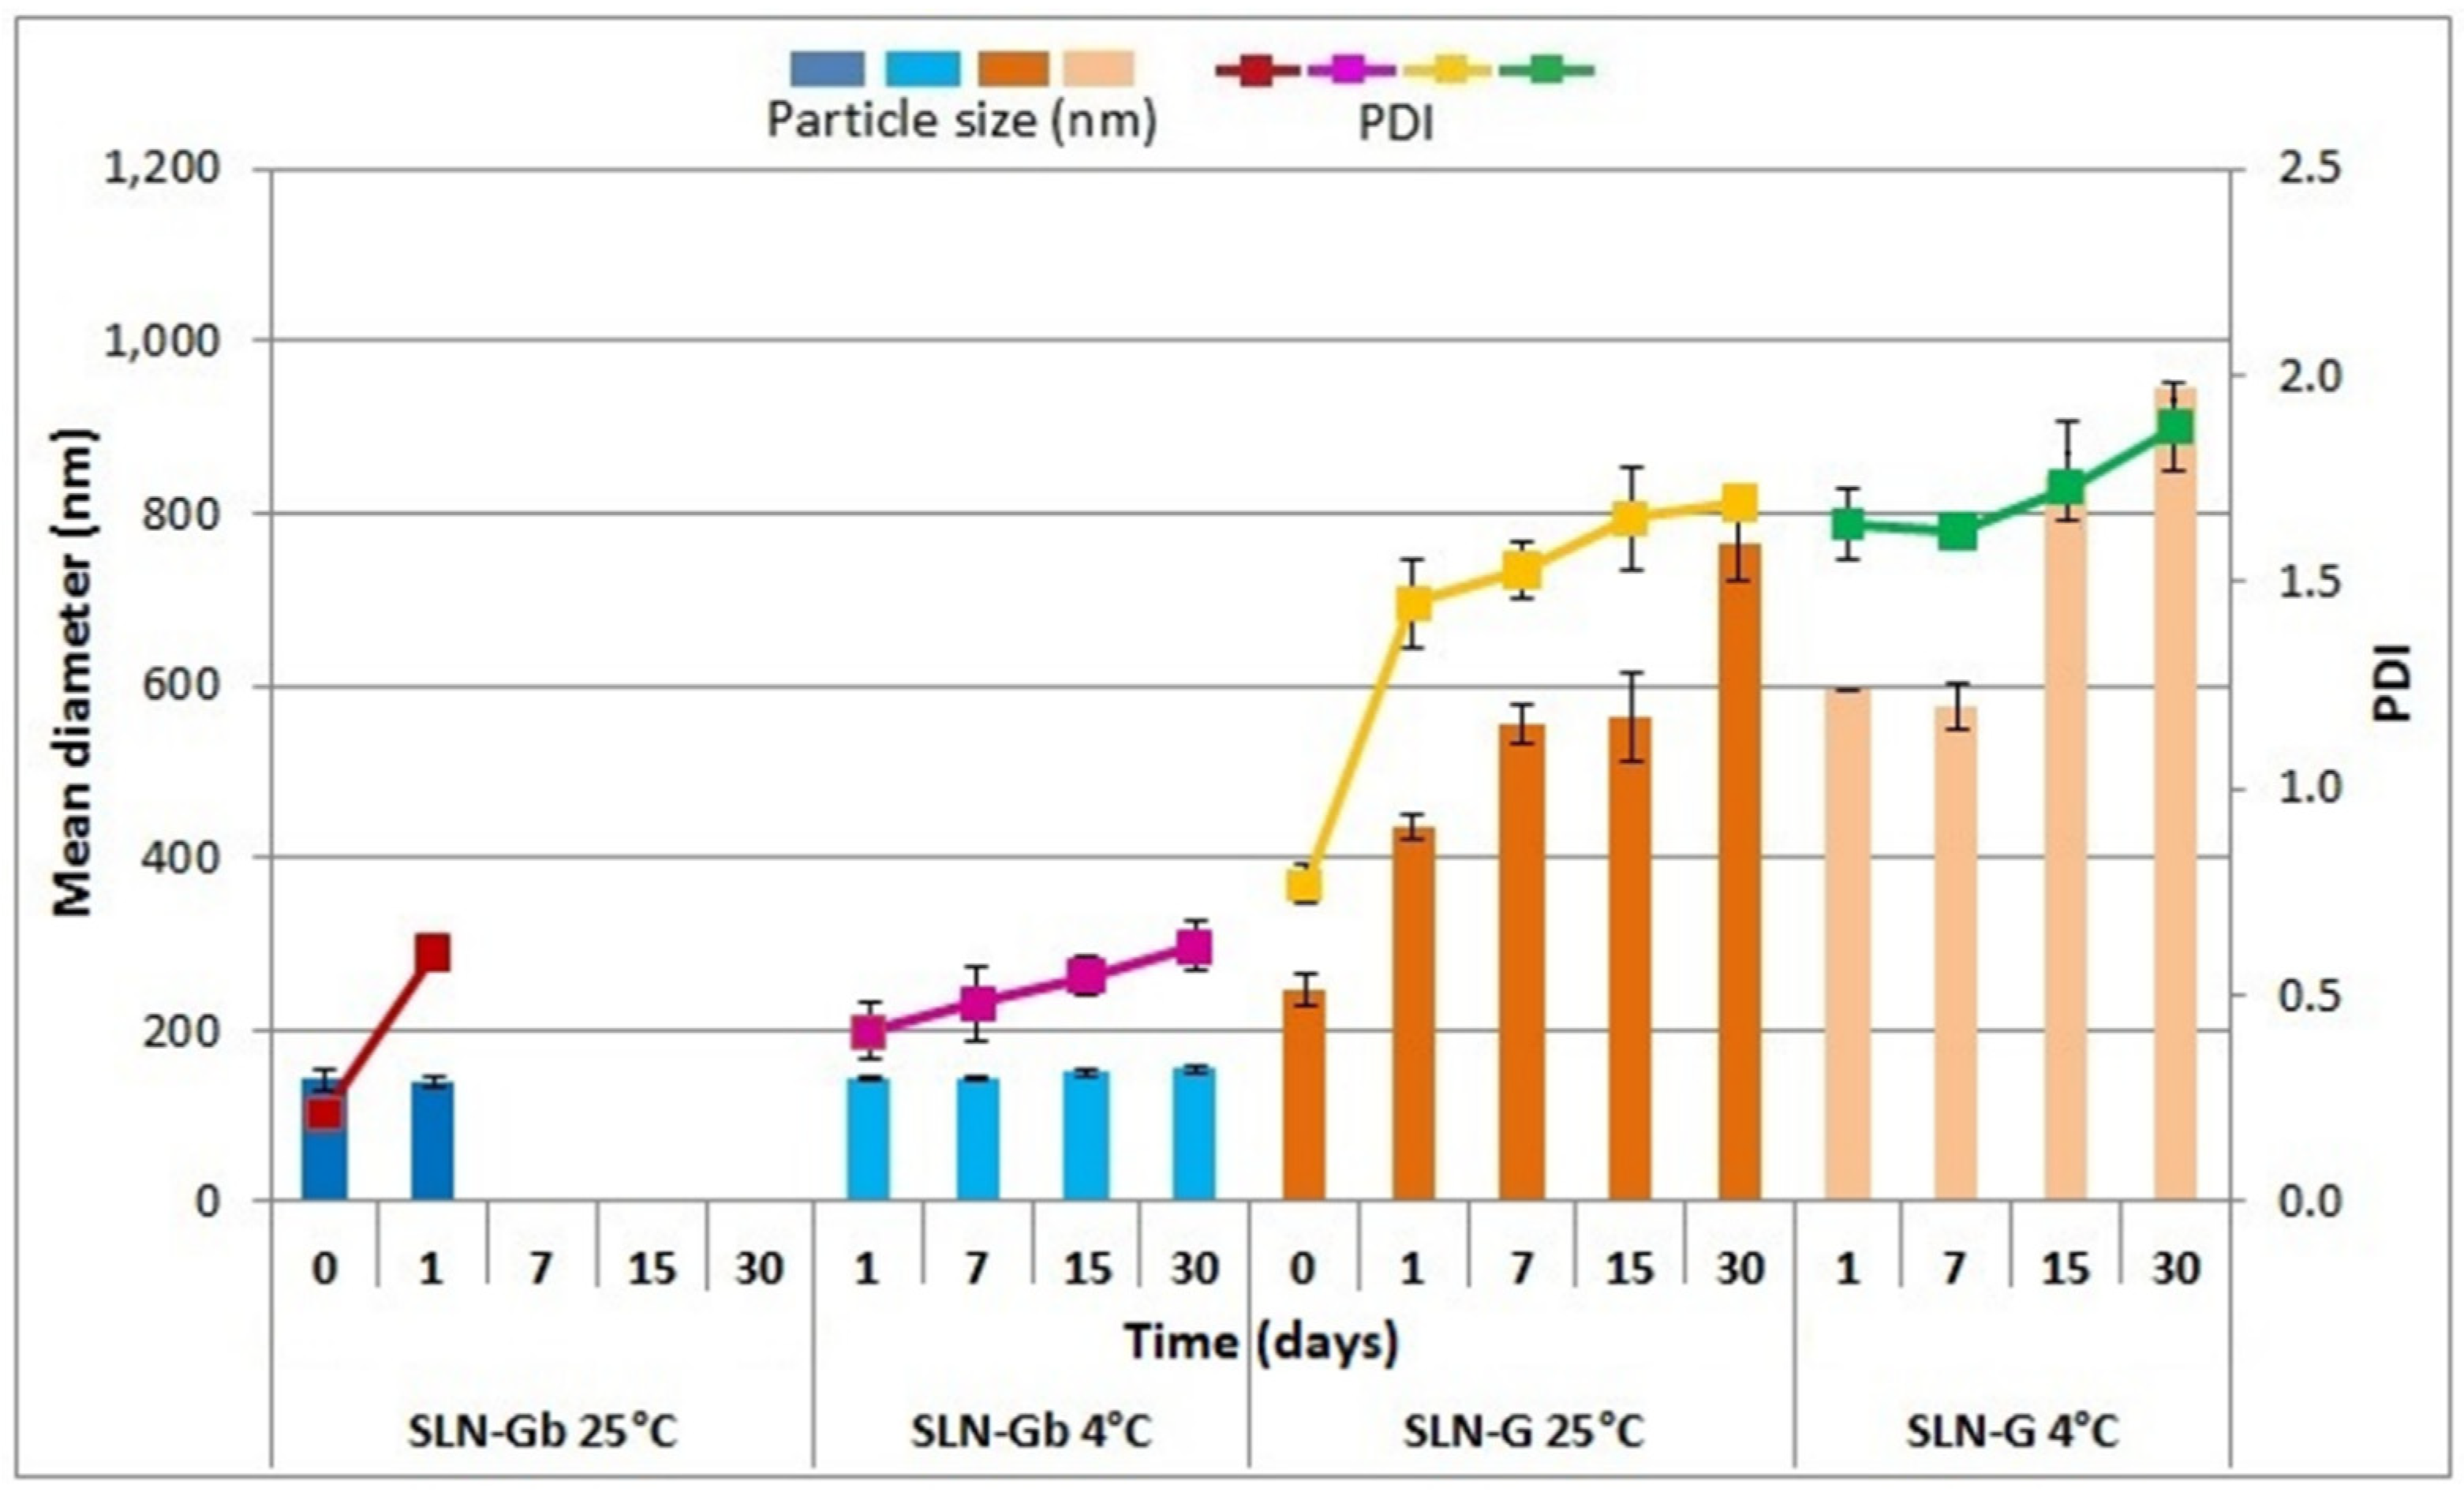
3.9. Physical Stability Studies
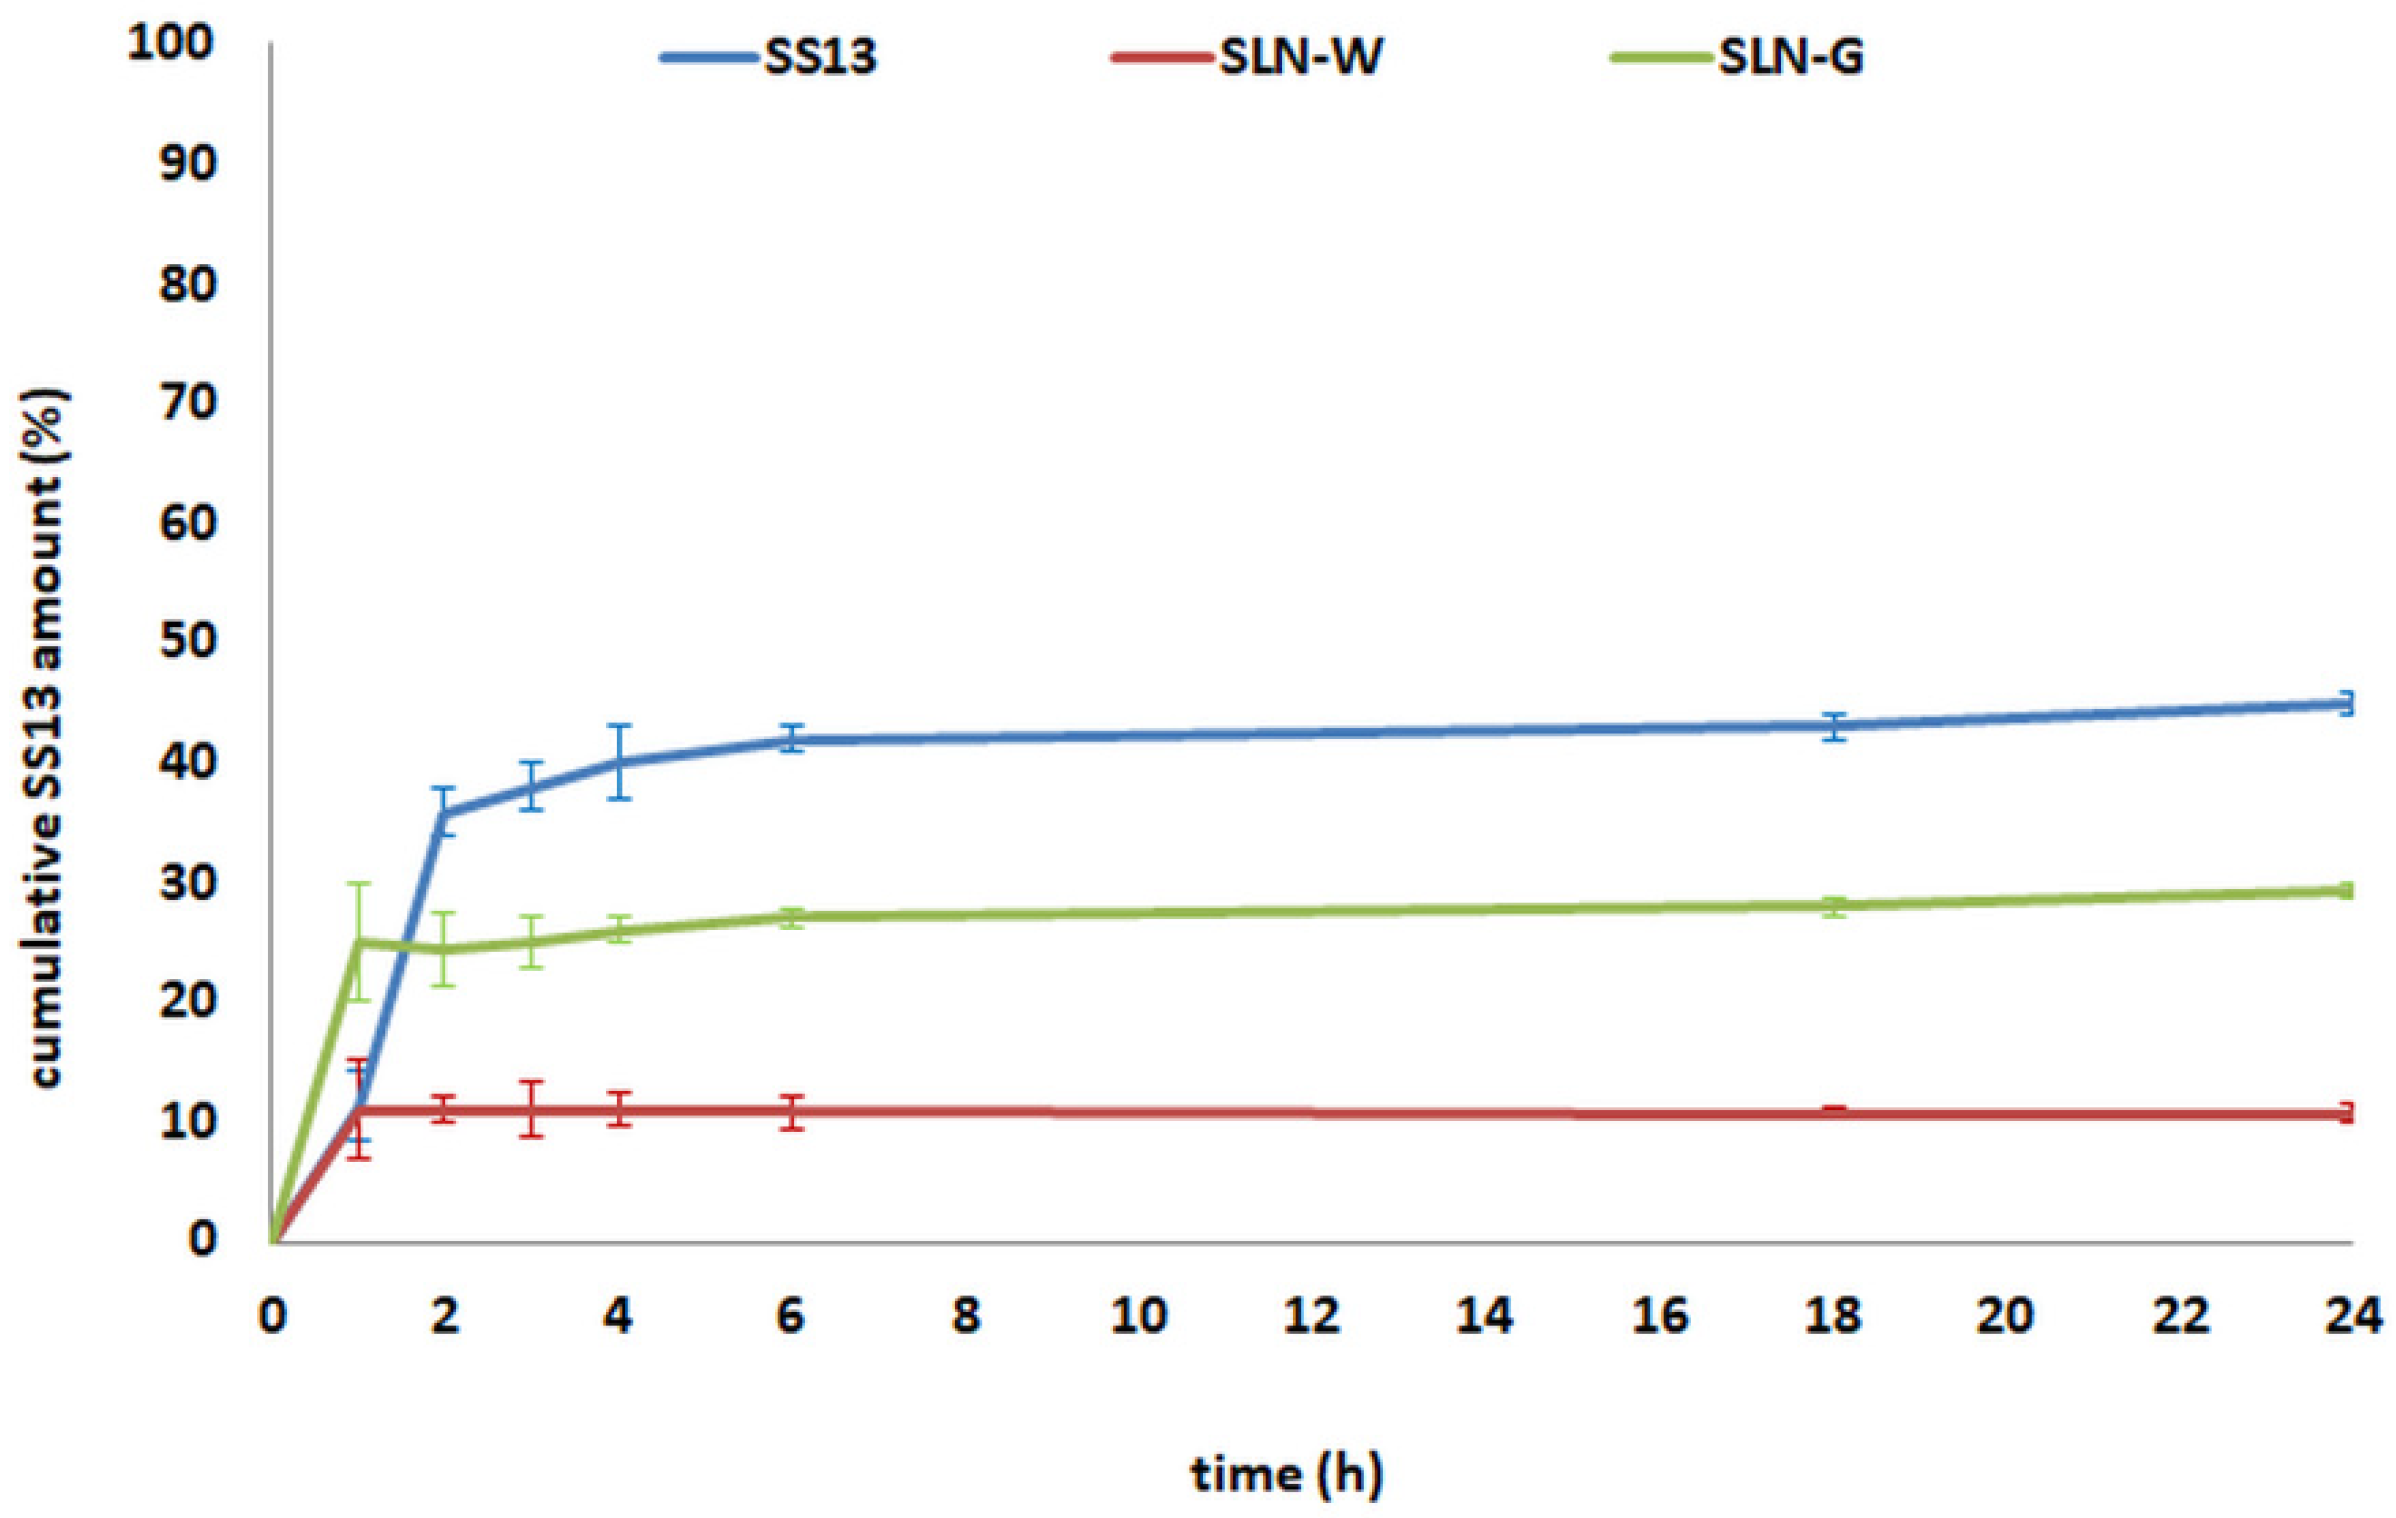
3.10. In Vitro SS13 Release Study
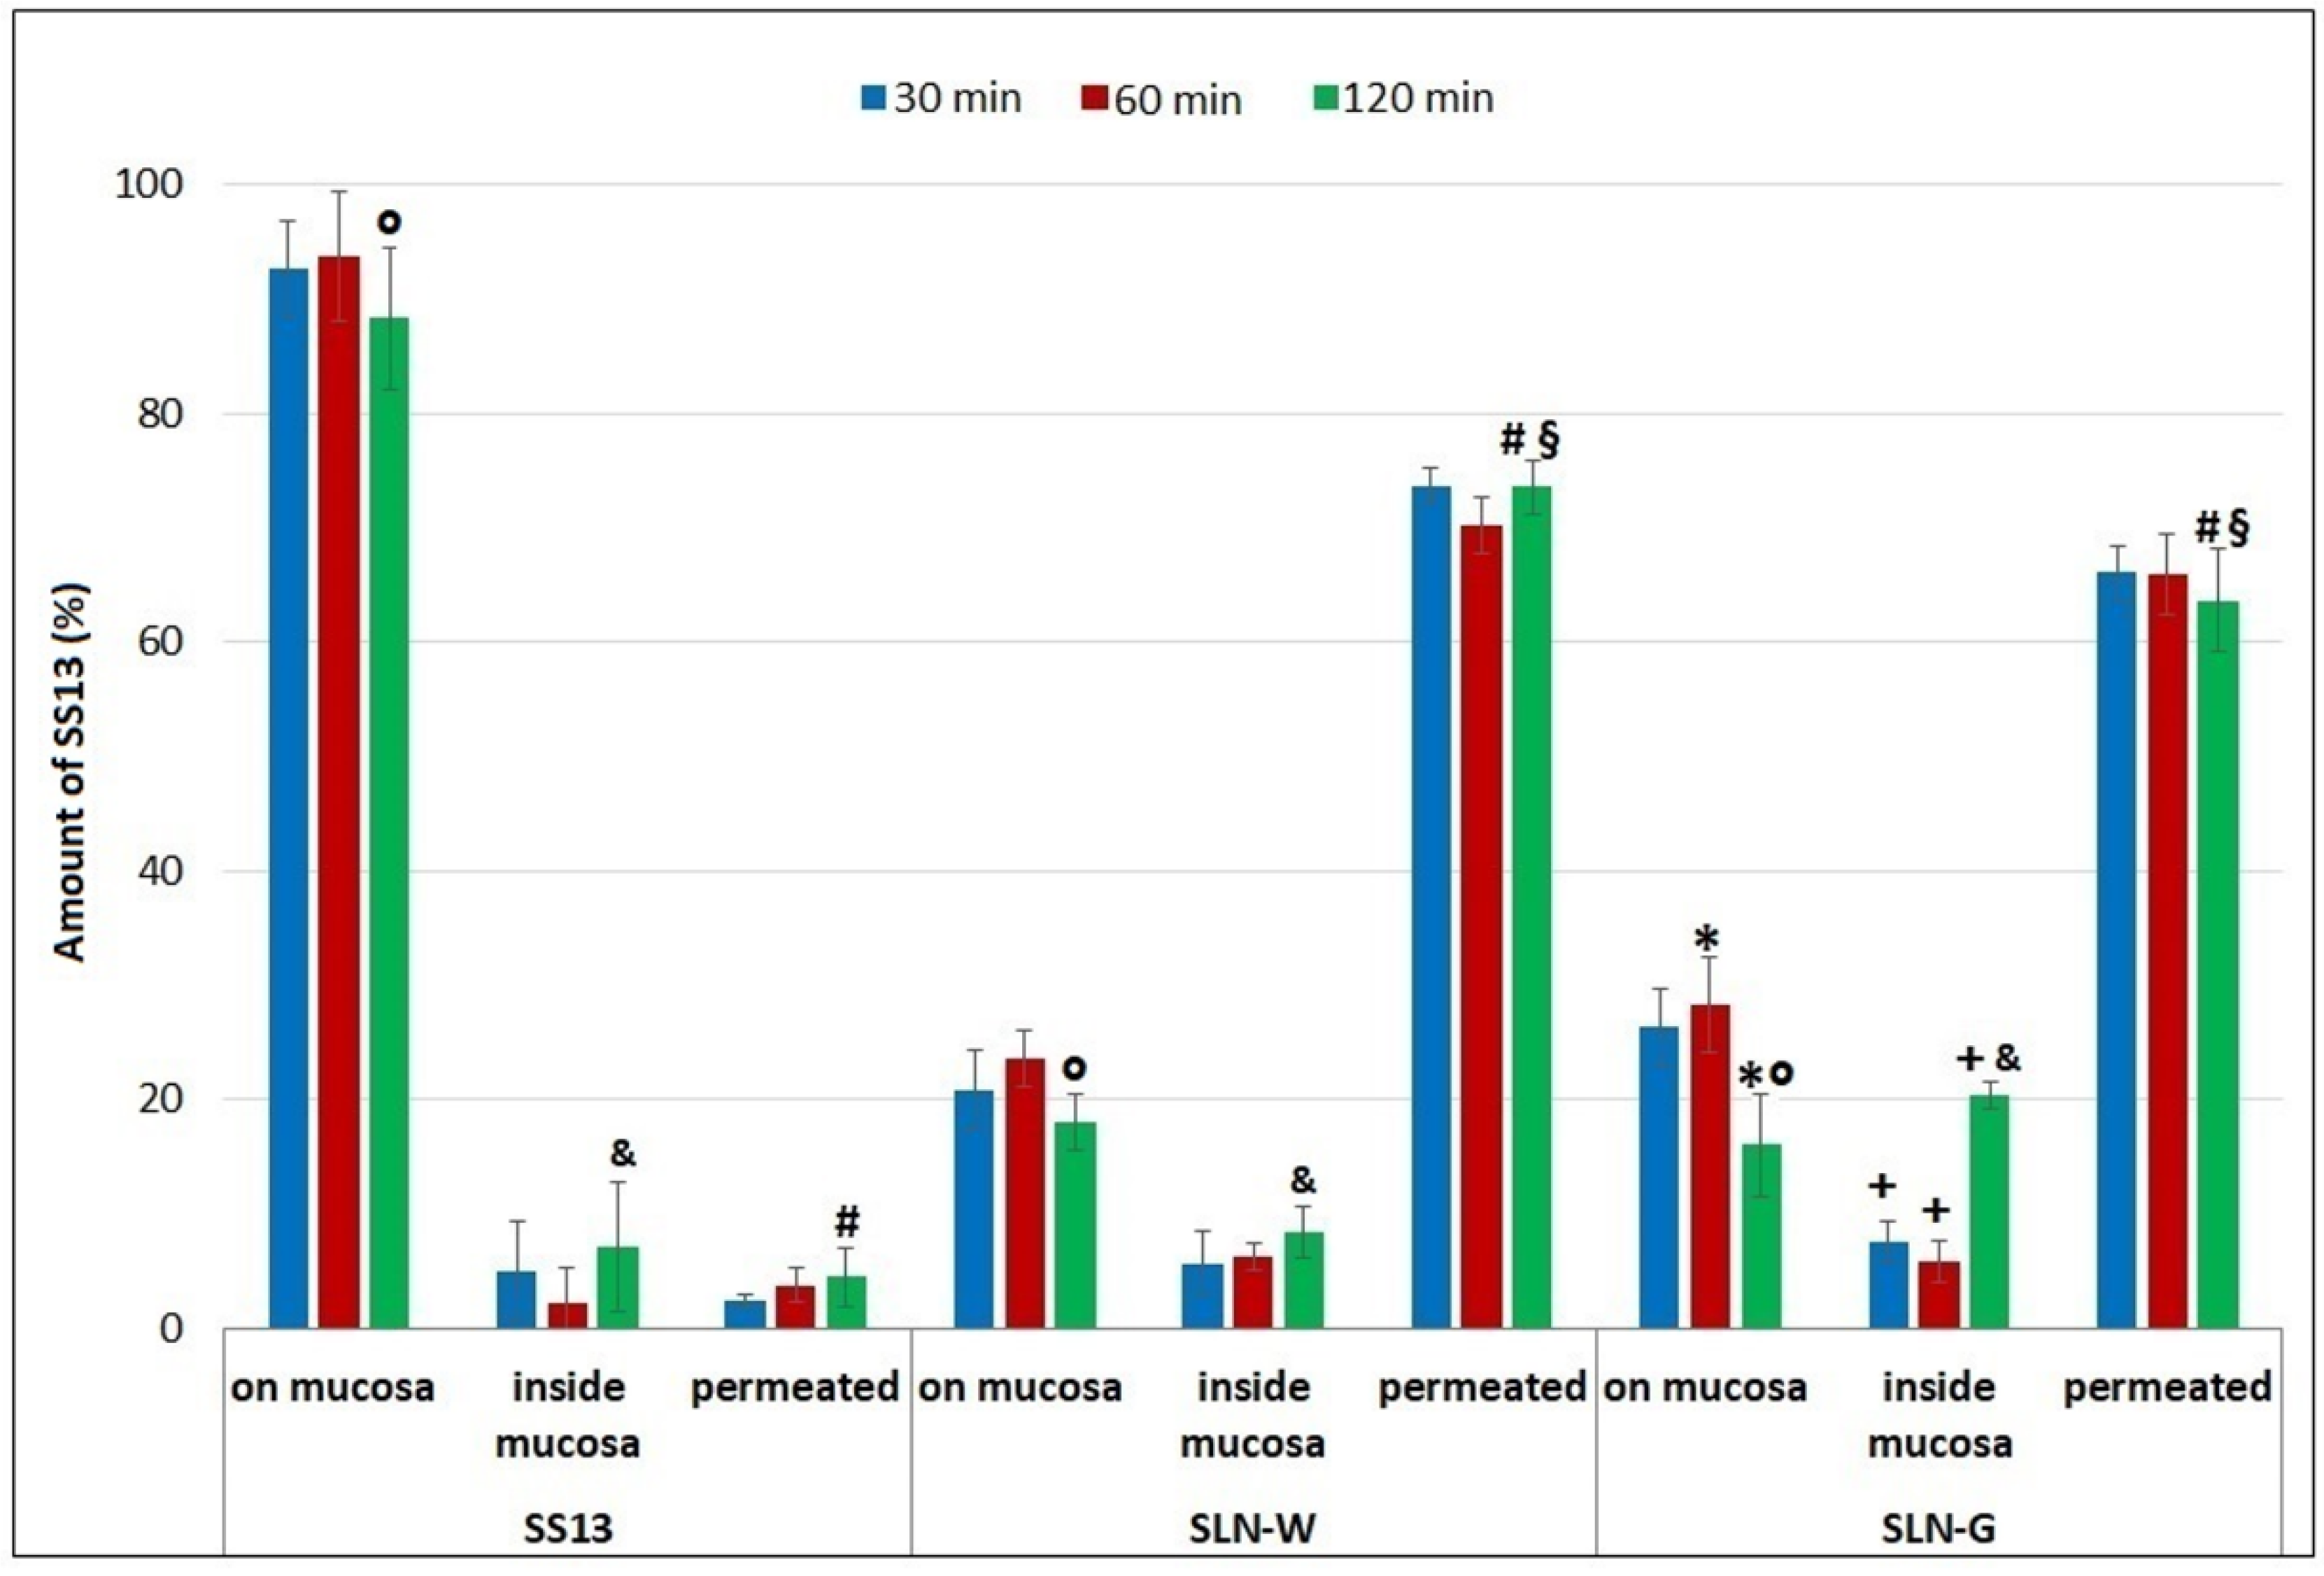
3.11. Ex Vivo Permeation Studies on Intestinal Mucosa
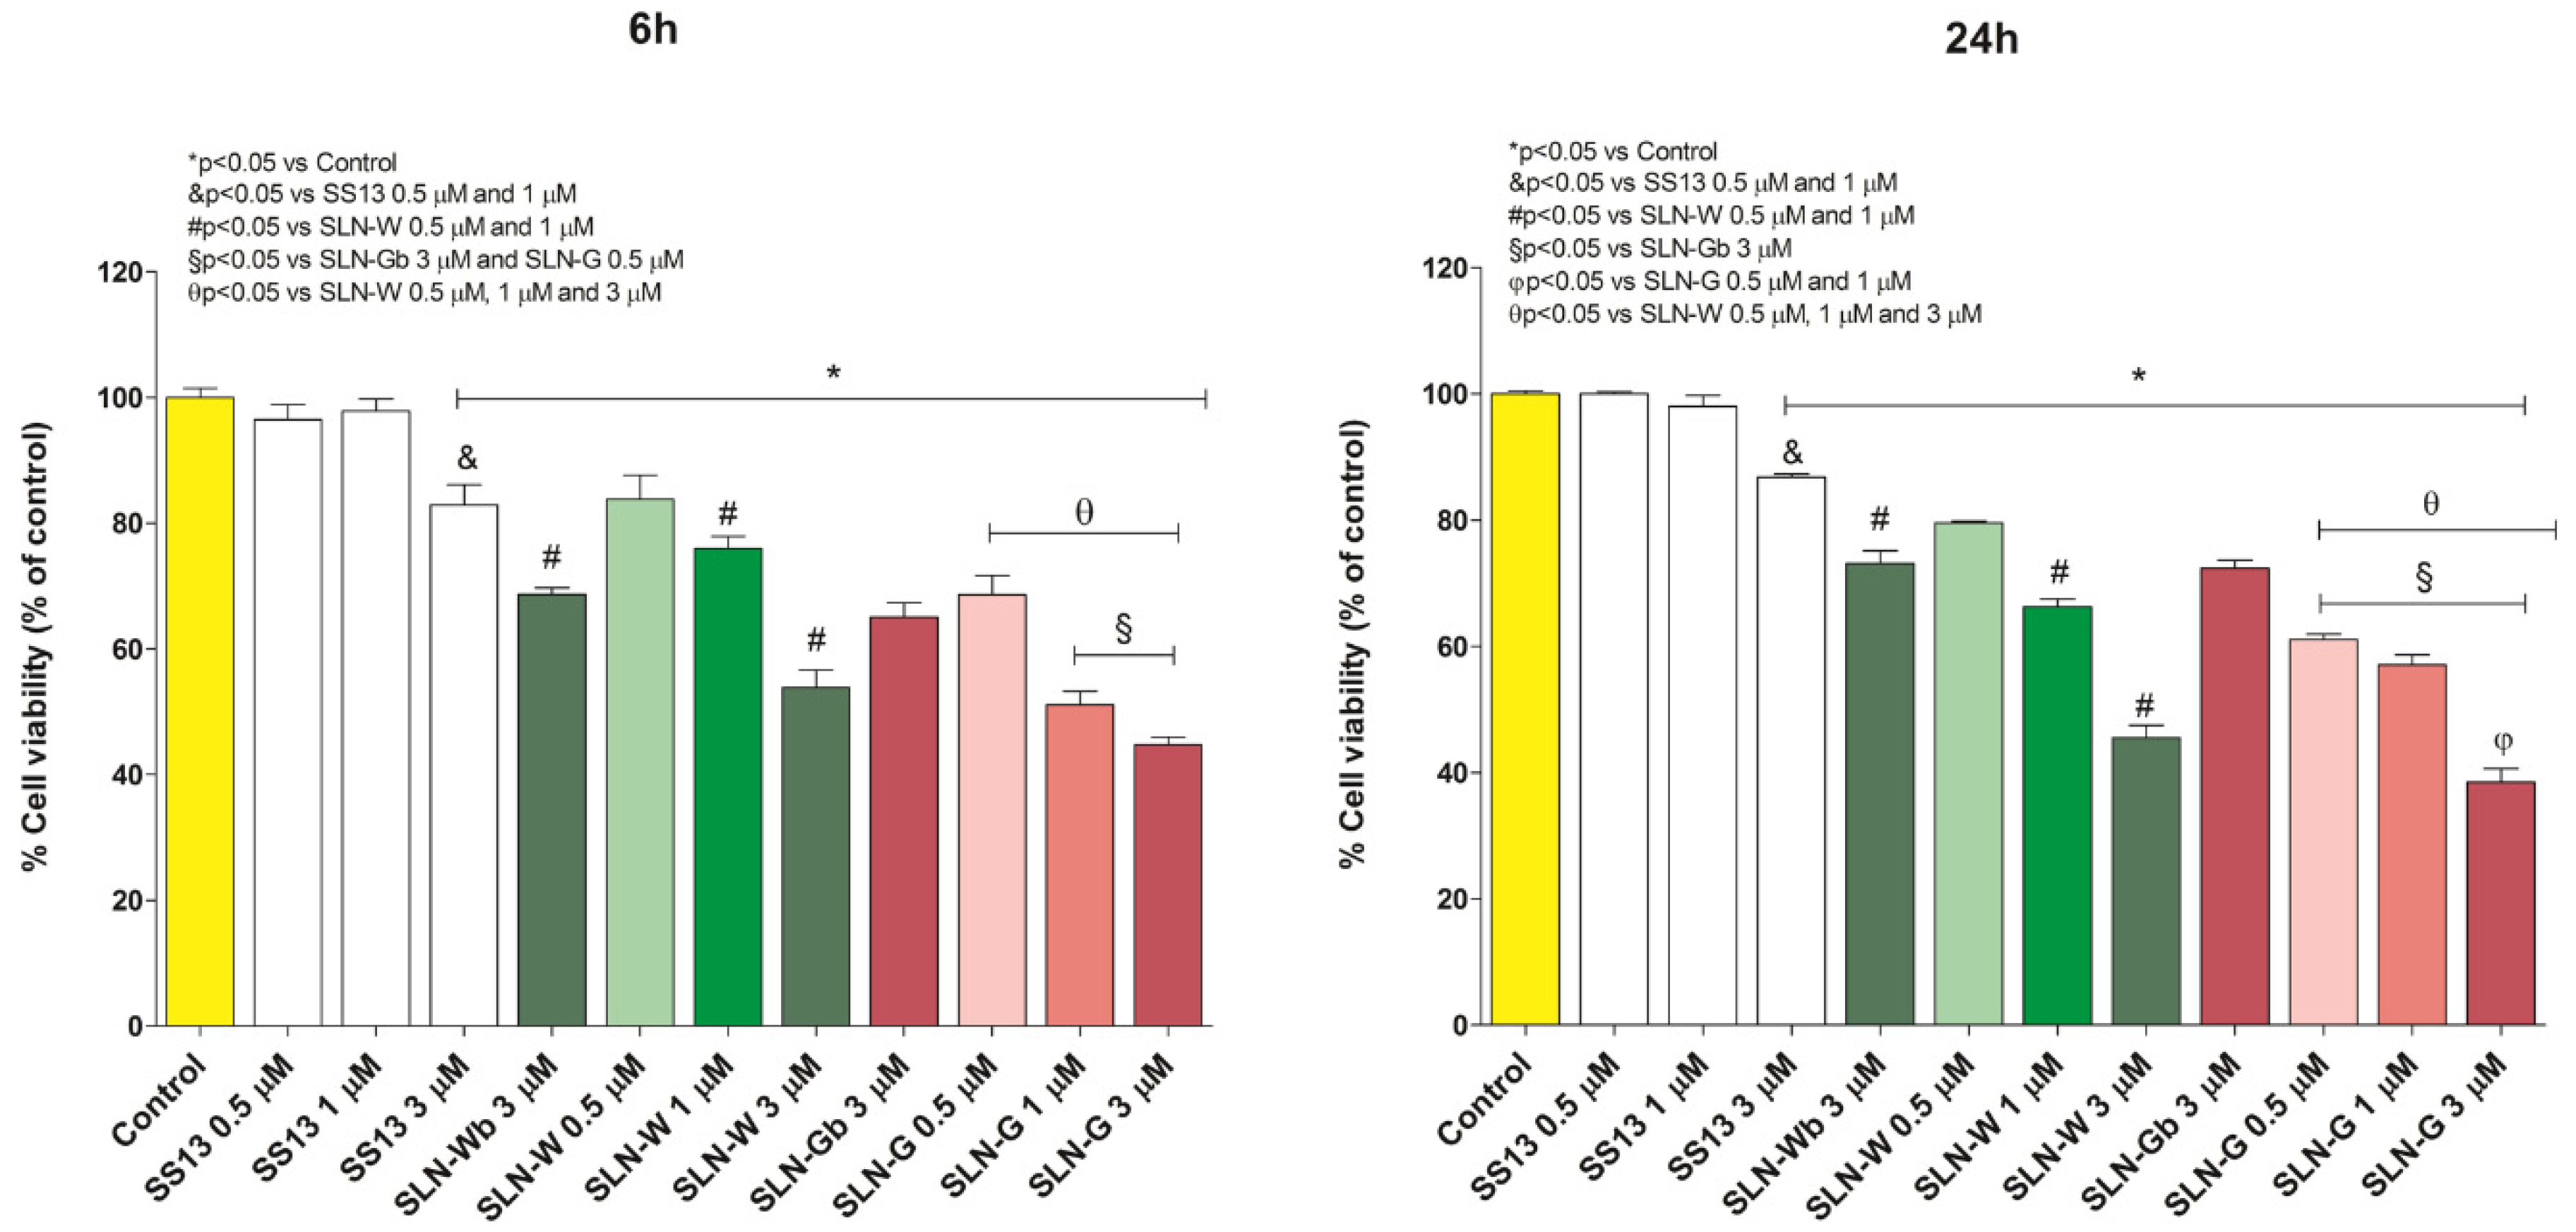
3.12. In Vitro Cytotoxicity Evaluation
MTT Assay
4. Conclusions
Author Contributions
Funding
Acknowledgments
Conflicts of Interest
References
- Taghizade Moghaddam, H.; Emami Moghadam, Z.; Khademi, G.; Bahreini, A.; Saeidi, M. Tuberculosis: Past, present and future. Int. J. Pediatr. 2016, 4, 1243–1254. [Google Scholar]
- World Health Organization. Global Tuberculosis Report 2019; World Health Organization: Geneva, Switzerland, 2019. [Google Scholar]
- World Health Organization. WHO Guidelines on Tuberculosis Infection Prevention and Control: 2019 Update (No. WHO/CDS/TB/2019.1); World Health Organization: Geneva, Switzerland, 2019. [Google Scholar]
- Zumla, A.; Chakaya, J.; Centis, R.; D’Ambrosio, L.; Mwaba, P.; Bates, M.; Kapata, N.; Nyirenda, T.; Chanda, D.; Mfinanga, S.; et al. Tuberculosis treatment and management-an update on treatment regimens, trials, new drugs, and adjunct therapies. Lancet Resp. Med. 2015, 3, 220–234. [Google Scholar] [CrossRef]
- Silva, D.R.; Mello, F.C.Q.; Migliori, G.B. Tuberculosis series 2020. J. Bras. Pneumol. 2020, 45, 1–2. [Google Scholar]
- Palomino, J.C.; Martin, A. Drug Resistance Mechanisms in Mycobacterium tuberculosis. Antibiotics 2014, 3, 317–340. [Google Scholar] [CrossRef] [PubMed] [Green Version]
- Escribano, I.; Rodriguez, J.C.; Llorca, B.; Garcia-Pachon, E.; Ruiz, M.; Royo, G. Importance of the efflux pump systems in the resistance of Mycobacterium tuberculosis to fluoroquinolones and linezolid. Chemotherapy 2007, 53, 397–401. [Google Scholar] [CrossRef] [PubMed]
- Carta, A.; Bua, A.; Corona, P.; Piras, S.; Briguglio, I.; Molicotti, P.; Zanetti, S.; Laurini, E.; Aulic, S.; Fermeglia, M.; et al. Design, synthesis and antitubercular activity of 4-alkoxy-triazoloquinolones able to inhibit the M. tuberculosis DNA gyrase. Eur. J. Med. Chem. 2019, 161, 399–415. [Google Scholar] [CrossRef]
- Sarathy, J.P.; Dartois, V.; Lee, E.J.D. The role of transport mechanisms in Mycobacterium tuberculosis drug resistance and tolerance. Pharmaceuticals 2012, 5, 1210–1235. [Google Scholar] [CrossRef] [Green Version]
- Carta, A.; Loriga, M.; Piras, S.; Paglietti, G.; Colla, P.L.; Busonera, B.; Collu, G.; Loddo, R. Synthesis of variously substituted 3-phenoxymethyl quinoxalin-2-ones and quinoxalines capable to potentiate in vitro the antiproliferative activity of anticancer drugs in multi-drug resistant cell lines. Med. Chem. 2006, 2, 113–122. [Google Scholar]
- Carta, A.; Piras, S.; Paglietti, G.; Pricl, S.; La Colla, P.; Busonara, B.; Loddo, R. 2(3)-Aryl-thio(oxy)-methylquinoxaline derivatives: A new class of P-glycoprotein-mediated drug efflux inhibitors. Med. Chem. 2008, 4, 194–205. [Google Scholar] [CrossRef]
- Zhang, X.; Guan, J.; Ni, R.; Li, L.C.; Mao, S. Preparation and solidification of redispersible nanosuspensions. J. Pharm. Sci. 2014, 103, 2166–2176. [Google Scholar] [CrossRef]
- Pridgen, E.M.; Alexis, F.; Farokhzad, O.C. Polymeric nanoparticle drug delivery technologies for oral delivery applications. Expert Opin. Drug. Deliv. 2015, 12, 1459–1473. [Google Scholar] [CrossRef] [PubMed] [Green Version]
- Obinu, A.; Gavini, E.; Rassu, G.; Riva, F.; Calligaro, A.; Bonferoni, M.C.; Maestri, M.; Giunchedi, P. Indocyanine green loaded polymeric nanoparticles: Physicochemical characterization and interaction studies with Caco-2 cell line by light and transmission electron microscopy. Nanomaterials 2020, 10, 133. [Google Scholar] [CrossRef] [PubMed] [Green Version]
- Rostami, E.; Kashanian, S.; Azandaryani, A.H.; Faramarzi, H.; Dolatabadi, J.E.N.; Omidfar, K. Drug targeting using solid lipid nanoparticles. Chem. Phys. Lipids 2014, 181, 56–61. [Google Scholar] [CrossRef] [PubMed]
- Üner, M. Preparation, characterization and physico-chemical properties of solid lipid nanoparticles (SLN) and nanostructured lipid carriers (NLC): Their benefits as colloidal drug carrier systems. Pharmazie 2006, 61, 375–386. [Google Scholar]
- Ji, H.; Tang, J.; Li, M.; Ren, J.; Zheng, N.; Wu, L. Curcumin-loaded solid lipid nanoparticles with Brij78 and TPGS improved in vivo oral bioavailability and in situ intestinal absorption of curcumin. Drug Deliv. 2016, 23, 459–470. [Google Scholar] [CrossRef]
- Pooja, D.; Kulhari, H.; Kuncha, M.; Rachamalla, S.S.; Adams, D.J.; Bansal, V.; Sistla, R. Improving efficacy, oral bioavailability, and delivery of paclitaxel using protein-grafted solid lipid nanoparticles. Mol. Pharm. 2016, 13, 3903–3912. [Google Scholar] [CrossRef]
- Wang, H.; Wang, H.; Yang, W.; Yu, M.; Sun, S.; Xie, B. Improved oral bioavailability and liver targeting of sorafenib solid lipid nanoparticles in rats. AAPS PharmSciTech 2018, 19, 761–768. [Google Scholar] [CrossRef]
- Üner, M.; Wissing, S.A.; Yener, G.; Müller, R.H. Skin moisturizing effect and skin penetration of ascorbyl palmitate entrapped in solid lipid nanoparticles (SLN) and nanostructured lipid carriers (NLC) incorporated into hydrogel. Pharmazie 2005, 60, 751–755. [Google Scholar]
- Martins, S.; Tho, I.; Reimold, I.; Fricker, G.; Souto, E.; Ferreira, D.; Brandl, M. Brain delivery of camptothecin by means of solid lipid nanoparticles: Formulation design, in vitro and in vivo studies. Int. J. Pharm. 2012, 439, 49–62. [Google Scholar] [CrossRef]
- Rassu, G.; Soddu, E.; Posadino, A.M.; Pintus, G.; Sarmento, B.; Giunchedi, P.; Gavini, E. Nose-to-brain delivery of BACE1 siRNA loaded in solid lipid nanoparticles for Alzheimer’s therapy. Colloids Surf. B Biointerfaces 2017, 152, 296–301. [Google Scholar] [CrossRef]
- Nepal, P.R.; Han, H.K.; Choi, H.K. Preparation and in vitro–in vivo evaluation of Witepsol® H35 based self-nanoemulsifying drug delivery systems (SNEDDS) of coenzyme Q10. Eur. J. Pharm. Sci. 2010, 39, 224–232. [Google Scholar] [CrossRef] [PubMed]
- Campos, D.A.; Madureira, A.R.; Gomes, A.M.; Sarmento, B.; Pintado, M.M. Optimization of the production of solid Witepsol nanoparticles loaded with rosmarinic acid. Colloids Surf. B Biointerfaces 2014, 115, 109–117. [Google Scholar] [CrossRef] [PubMed]
- Cavallari, C.; Fini, A.; Ceschel, G. Design of olanzapine/lutrol solid dispersions of improved stability and performances. Pharmaceutics 2013, 5, 570–590. [Google Scholar] [CrossRef] [PubMed] [Green Version]
- Panigrahi, K.C.; Patra, C.N.; Jena, G.K.; Ghose, D.; Jena, J.; Panda, S.K.; Sahu, M. Gelucire: A versatile polymer for modified release drug delivery system. Future J. Pharm. Sci. 2018, 4, 102–108. [Google Scholar] [CrossRef]
- Apley, M.; Crist, G.B.; Fellner, V.; Gonzalez, M.A.; Hunter, R.P.; Martinez, M.N.; Messenheimer, J.R.; Modric, S.; Papich, M.G.; Parr, A.F.; et al. Determination of Thermodynamic Solubility of Active Pharmaceutical Ingredients for Veterinary Species: A New USP General Chapter. Dissolut. Technol. 2017, 41, 36–39. [Google Scholar] [CrossRef]
- OECD 107 Method. OECD Guideline for the Testing of Chemicals. Partition Coefficient (n-Octanol/Water): Shake Flask Method. Adopted by the Council on 27th July 1995. Available online: https://www.oecd.org/chemicalsafety/risk-assessment/1948169.pdf (accessed on 23 November 2020).
- Abouelmagd, S.A.; Sun, B.; Chang, A.C.; Ku, Y.J.; Yeo, Y. Release kinetics study of poorly water-soluble drugs from nanoparticles: Are we doing it right? Mol. Pharm. 2015, 12, 997–1003. [Google Scholar] [CrossRef] [Green Version]
- Porcu, E.P.; Salis, A.; Rassu, G.; Maestri, M.; Galafassi, J.; Bruni, G.; Giunchedi, P.; Gavini, E. Engineered polymeric microspheres obtained by multi-step method as potential systems for transarterial embolization and intraoperative imaging of HCC: Preliminary evaluation. Eur. J. Pharm. Biopharm. 2017, 117, 160–167. [Google Scholar] [CrossRef]
- Zheng, Y.; Zuo, Z.; Chow, A.H. Lack of effect of β-cyclodextrin and its water-soluble derivatives on in vitro drug transport across rat intestinal epithelium. Int. J. Pharm. 2006, 309, 123–128. [Google Scholar] [CrossRef]
- Van de Kerkhof, E.; de Graaf, I.; Groothuis, G.M.M. In vitro methods to study intestinal drug metabolism. Curr. Drug Metab. 2007, 8, 658–675. [Google Scholar] [CrossRef]
- Rassu, G.; Porcu, E.P.; Fancello, S.; Obinu, A.; Senes, N.; Galleri, G.; Migheli, R.; Gavini, E.; Giunchedi, P. Intranasal delivery of genistein-loaded nanoparticles as a potential preventive system against neurodegenerative disorders. Pharmaceutics 2019, 11, 8. [Google Scholar] [CrossRef] [Green Version]
- Masiiwa, W.L.; Gadaga, L.L. Intestinal permeability of artesunate-loaded solid lipid nanoparticles using the everted gut method. J. Drug Deliv. 2018, 2018, 1–9. [Google Scholar] [CrossRef] [PubMed]
- Rutkowska, E.; Pajak, K.; Jóźwiak, K. Lipophilicity–methods of determination and its role in medicinal chemistry. Acta Pol. Pharma. 2013, 70, 3–18. [Google Scholar]
- Rothwell, J.A.; Day, A.J.; Morgan, M.R. Experimental determination of octanol–water partition coefficients of quercetin and related flavonoids. J. Agric. Food Chem. 2005, 53, 4355–4360. [Google Scholar] [CrossRef] [PubMed]
- Mohsin, K.; Alamri, R.; Ahmad, A.; Raish, M.; Alanazi, F.K.; Hussain, M.D. Development of self-nanoemulsifying drug delivery systems for the enhancement of solubility and oral bioavailability of fenofibrate, a poorly water-soluble drug. Int. J. Nanomed. 2016, 11, 2829–2838. [Google Scholar]
- Junyaprasert, V.B.; Morakul, B. Nanocrystals for enhancement of oral bioavailability of poorly water-soluble drugs. Asian J. Pharm. Sci. 2015, 10, 13–23. [Google Scholar] [CrossRef] [Green Version]
- Sharma, M.; Sharma, R.; Jain, D.K.; Saraf, A. Enhancement of oral bioavailability of poorly water soluble carvedilol by chitosan nanoparticles: Optimization and pharmacokinetic study. Int. J. Biol. Macromol. 2019, 135, 246–260. [Google Scholar] [CrossRef] [PubMed]
- Kalia, A.; Poddar, M. Solid dispersions: An approach towards enhancing dissolution rate. Int. J. Pharm. Pharm. Sci. 2011, 3, 9–19. [Google Scholar]
- Morina, D.; Sessevmez, M.; Sinani, G.; Mülazımoğlu, L.; Cevher, E. Oral tablet formulations containing cyclodextrin complexes of poorly water soluble cefdinir to enhance its bioavailability. J. Drug Deliv. Sci. Technol. 2020, 57, 101742. [Google Scholar] [CrossRef]
- Ditzinger, F.; Price, D.J.; Ilie, A.R.; Köhl, N.J.; Jankovic, S.; Tsakiridou, G.; Aleandri, S.; Kalantzi, L.; Holm, R.; Nair, A.; et al. Lipophilicity and hydrophobicity considerations in bio-enabling oral formulations approaches–a PEARRL review. J. Pharm. Pharmacol. 2019, 71, 464–482. [Google Scholar] [CrossRef] [Green Version]
- Li, H.; Zhao, X.; Ma, Y.; Zhai, G.; Li, L.; Lou, H. Enhancement of gastrointestinal absorption of quercetin by solid lipid nanoparticles. J. Control. Release 2009, 133, 238–244. [Google Scholar] [CrossRef]
- Das, S.; Ng, W.K.; Kanaujia, P.; Kim, S.; Tan, R.B. Formulation design, preparation and physicochemical characterizations of solid lipid nanoparticles containing a hydrophobic drug: Effects of process variables. Colloids Surf. B Biointerfaces 2011, 88, 483–489. [Google Scholar] [CrossRef] [PubMed]
- Budhian, A.; Siegel, S.J.; Winey, K.I. Haloperidol-loaded PLGA nanoparticles: Systematic study of particle size and drug content. Int. J. Pharm. 2007, 336, 367–375. [Google Scholar] [CrossRef] [PubMed]
- Fernandez, S.; Rodier, J.D.; Ritter, N.; Mahler, B.; Demarne, F.; Carrière, F.; Jannin, V. Lipolysis of the semi-solid self-emulsifying excipient Gelucire® 44/14 by digestive lipases. Biochim. Biophys. Acta Mol. Cell Biol. Lipids 2008, 1781, 367–375. [Google Scholar] [CrossRef] [PubMed]
- Sanad, R.A.; Abdel Malak, N.S.; El-Bayoomy, T.S.; Badawi, A.A. Preparation and characterization of oxybenzone-loaded solid lipid nanoparticles (SLNs) with enhanced safety and sunscreening efficacy: SPF and UVA-PF. Drug Discov. Ther. 2010, 4, 472–483. [Google Scholar] [PubMed]
- Urbán-Morlán, Z.; Ganem-Rondero, A.; Melgoza-Contreras, L.M.; Escobar-Chávez, J.J.; Nava-Arzaluz, M.G.; Quintanar-Guerrero, D. Preparation and characterization of solid lipid nanoparticles containing cyclosporine by the emulsification-diffusion method. Int. J. Nanomed. 2010, 5, 611–620. [Google Scholar]
- Sandri, G.; Bonferoni, M.C.; D’Autilia, F.; Rossi, S.; Ferrari, F.; Grisoli, P.; Sorrenti, M.; Catenacci, L.; Del Fante, C.; Perotti, C.; et al. Wound dressings based on silver sulfadiazine solid lipid nanoparticles for tissue repairing. Eur. J. Pharm. Biopharm. 2013, 84, 84–90. [Google Scholar] [CrossRef]
- Estrada-Fernández, A.G.; Román-Guerrero, A.; Jiménez-Alvarado, R.; Lobato-Calleros, C.; Alvarez-Ramirez, J.; Vernon-Carter, E.J. Stabilization of oil-in-water-in-oil (O1/W/O2) Pickering double emulsions by soluble and insoluble whey protein concentrate-gum Arabic complexes used as inner and outer interfaces. J. Food Eng. 2018, 221, 35–44. [Google Scholar] [CrossRef]
- Date, A.A.; Vador, N.; Jagtap, A.; Nagarsenker, M.S. Lipid nanocarriers (GeluPearl) containing amphiphilic lipid Gelucire 50/13 as a novel stabilizer: Fabrication, characterization and evaluation for oral drug delivery. Nanotechnology 2011, 22, 275102. [Google Scholar] [CrossRef]
- Karataş, A.; Bekmezci, S. Evaluation and enhancement of physical stability of semi-solid dispersions containing piroxicam into hard gelatin capsules. Acta Pol. Pharm. 2013, 70, 883–897. [Google Scholar]
- Sütő, B.; Weber, S.; Zimmer, A.; Farkas, G.; Kelemen, A.; Budai-Szűcs, M.; Berkó, S.; Szabó-Révésza, P.; Csányi, E. Optimization and design of an ibuprofen-loaded nanostructured lipid carrier with a 23 full factorial design. Chem. Eng. Res. Des. 2015, 104, 488–496. [Google Scholar] [CrossRef]
- Jipa, I.M.; Stoica, A.; Stroescu, M.; Dobre, L.M.; Dobre, T.; Jinga, S.; Tardei, C. Potassium sorbate release from poly (vinyl alcohol)-bacterial cellulose films. Chem. Pap. 2012, 66, 138–143. [Google Scholar] [CrossRef]
- Coates, J. Interpretation of infrared spectra, a practical approach. In Encyclopedia of Analytical Chemistry: Applications, Theory and Instrumentation; Meyers, R.A., Ed.; John Wiley & Sons Ltd.: Chichester, UK, 2000; pp. 10815–10837. [Google Scholar]
- Leonard, D.; Moloney, M.G.; Thompson, C. Chemical modification of materials by reaction with diaryl diazomethanes. Tetrahedron Lett. 2009, 50, 3499–3502. [Google Scholar] [CrossRef]
- Müller, R.H.; Mader, K.; Gohla, S. Solid lipid nanoparticles (SLN) for controlled drug delivery–A review of the state of the art. Eur. J. Pharm. Biopharm. 2000, 50, 161–177. [Google Scholar] [CrossRef]
- Heurtault, B.; Saulnier, P.; Pech, B.; Proust, J.E.; Benoit, J.P. Physico-chemical stability of colloidal lipid particles. Biomaterials 2003, 24, 4283–4300. [Google Scholar] [CrossRef]
- Ibrahim, W.M.; AlOmrani, A.H.; Yassin, A.E.B. Novel sulpiride-loaded solid lipid nanoparticles with enhanced intestinal permeability. Int. J. Nanomed. 2014, 9, 129–144. [Google Scholar]
- Dabir, P.D.; Purkar, P.Y. Gelucire: A novel tool in formulation of poorly soluble drugs. World J. Pharm. Res. 2018, 7, 471–481. [Google Scholar]
- Deferme, S.; Van Gelder, J.; Ingels, F.; Van den Mooter, G.; De Buck, S.; Balzarini, J.; Naesens, L.; De Clercq, E.; Kinget, R.; Augustijns, P. Intestinal absorption characteristics of the low solubility thiocarboxanilide UC-781. Int. J. Pharm. 2002, 234, 113–119. [Google Scholar] [CrossRef]
- Langasco, R.; Fancello, S.; Rassu, G.; Cossu, M.; Cavalli, R.; Galleri, G.; Giunchedi, P.; Migheli, R.; Gavini, E. Increasing protective activity of genistein by loading into transfersomes: A new potential adjuvant in the oxidative stress-related neurodegenerative diseases? Phytomedicine 2019, 52, 23–31. [Google Scholar] [CrossRef]
- Ehrlich, M.; Boll, W.; Van Oijen, A.; Hariharan, R.; Chandran, K.; Nibert, M.L.; Kirchhausen, T. Endocytosis by random initiation and stabilization of clathrin-coated pits. Cell 2004, 118, 591–605. [Google Scholar] [CrossRef] [Green Version]
- Li, Z.; Zhang, Y.; Zhu, D.; Li, S.; Yu, X.; Zhao, Y.; Ouyang, X.; Xie, Z.; Li, L. Transporting carriers for intracellular targeting delivery via non-endocytic uptake pathways. Drug Deliv. 2017, 24, 45–55. [Google Scholar] [CrossRef]


| Strain Label | SM | INH | RIF | EMB | Res |
|---|---|---|---|---|---|
| H37Rv | S | S | S | S | |
| 952 | S | S | R | S | DR |
| 1097 | R | R | S | R | DR |
| 1670 | S | S | S | S | |
| 512 | S | R | R | R | MDR |
| 600 | R | R | R | R | MDR |
| 368 | S | R | S | R | DR |
| 1762 | S | S | R | R | DR |
| 571 | R | R | R | R | MDR |
| 1120 | R | R | R | R | MDR |
| Strand Label | SM | SM+(SS13) | INH | INH+(SS13) | RIF | RIF+(SS13) | EMB | EMB+(SS13) | CIPR | CIPR+(SS13) | |||||
|---|---|---|---|---|---|---|---|---|---|---|---|---|---|---|---|
| H37Rv | 0.125 | 0.125 | 0.125 | 0.125 | 0.25 | 0.06(128) | C | 1 | 1 | 0.5 | 0.5 | ||||
| 952 | 0.062 | 0.062 | 0.062 | 0.0078(32) | D | 0.5 | 0.062(32) | D | 1 | 0.25(64) | C | 2 | 0.125(16) | E | |
| 1097 | 4 | 0.06(8) | F | 2 | 2 | 0.25 | 0.062(128) | C | 32 | 32 | 0.5 | 0.125(64) | C | ||
| 1670 | 0.125 | 0.06(128) | B | 0.125 | 0.125 | 0.125 | 0.062(128) | B | 1 | 1 | 16 | <0.25(4) | F | ||
| 512 | 0.5 | 0.031(128) | E | 1 | 1 | >2 | >2 | 4 | 1(32) | C | 8 | 4(64) | B | ||
| 600 | >4 | 1(25) | C | >1 | 0.25(25) | C | >2 | 0.5(25) | C | >16 | 16(100) | 4 | 1(50) | C | |
| 368 | 0.5 | 0.06(6.25) | D | <1 | 0.125(3.125) | D | 0.25 | 0.125(25) | B | >16 | 2(3.125) | D | 0.5 | 0.25(25) | B |
| 1762 | 0.125 | 0.015(6) | D | 0.062 | 0.078(6) | A | >2 | >2 | 4 | 0.25(3) | E | 1 | 0.5(25) | C | |
| 571 | 0.25 | 0.25 | >1 | >1 | >2 | >2 | >16 | >16 | 1 | 1 | |||||
| 1120 | 4 | 0.25(12.5) | E | >16 | >16 | 8 | 4(200) | B | >64 | >64 | 0.5 | 0.25(200) | B | ||
| Medium | Solubility (mg/mL) | Parts of Solvent Required for One Part of Solute | Solubility Definition (FU XII) |
|---|---|---|---|
| Bidistilled water | 0.00113 | 888,489 | Practically insoluble |
| Buffer pH 1.2 | 0.00459 | 217,946 | Practically insoluble |
| Buffer pH 6.8 | 0.00128 | 1,119,224 | Practically insoluble |
| Buffer pH 7.4 | 0.00145 | 633,583 | Practically insoluble |
| Time (s) | Mean Diameter (nm) | PDI |
|---|---|---|
| 30 | 620.8 ± 21.1 | 1.261 ± 0.062 |
| 60 | 494.6 ± 16.2 # | 0.967 ± 0.084 § |
| 90 | 247.1 ± 19.7 #* | 0.772 ± 0.051 §+ |
| Formulation | Mean Diameter (nm ± SD) | PDI (±SD) | Zeta Potential (mV ± SD) |
|---|---|---|---|
| SLN-Wb | 425.1 ± 10.3 | 0.071 ± 0.021 | −10.72 ± 1.01 |
| SLN-Gb | 141.8 ± 12.0 * | 0.213 ± 0.020 a | −17.13 ± 2.51 ° |
| SLN-W | 450.6 ± 14.9 + | 0.141 ± 0.030 | −10.52 ± 2.33 |
| SLN-G | 247.1 ± 19.8 §# | 0.772 ± 0.051 bc | −13.82 ± 2.44 |
| Sample | Papp (cm/s) |
|---|---|
| SS13 | 4.57 × 10⁻⁸ |
| SLN-W | 8.61 × 10⁻⁵ |
| SLN-G | 8.23 × 10⁻⁵ |
Publisher’s Note: MDPI stays neutral with regard to jurisdictional claims in published maps and institutional affiliations. |
© 2020 by the authors. Licensee MDPI, Basel, Switzerland. This article is an open access article distributed under the terms and conditions of the Creative Commons Attribution (CC BY) license (http://creativecommons.org/licenses/by/4.0/).
Share and Cite
Obinu, A.; Porcu, E.P.; Piras, S.; Ibba, R.; Carta, A.; Molicotti, P.; Migheli, R.; Dalpiaz, A.; Ferraro, L.; Rassu, G.; et al. Solid Lipid Nanoparticles as Formulative Strategy to Increase Oral Permeation of a Molecule Active in Multidrug-Resistant Tuberculosis Management. Pharmaceutics 2020, 12, 1132. https://doi.org/10.3390/pharmaceutics12121132
Obinu A, Porcu EP, Piras S, Ibba R, Carta A, Molicotti P, Migheli R, Dalpiaz A, Ferraro L, Rassu G, et al. Solid Lipid Nanoparticles as Formulative Strategy to Increase Oral Permeation of a Molecule Active in Multidrug-Resistant Tuberculosis Management. Pharmaceutics. 2020; 12(12):1132. https://doi.org/10.3390/pharmaceutics12121132
Chicago/Turabian StyleObinu, Antonella, Elena Piera Porcu, Sandra Piras, Roberta Ibba, Antonio Carta, Paola Molicotti, Rossana Migheli, Alessandro Dalpiaz, Luca Ferraro, Giovanna Rassu, and et al. 2020. "Solid Lipid Nanoparticles as Formulative Strategy to Increase Oral Permeation of a Molecule Active in Multidrug-Resistant Tuberculosis Management" Pharmaceutics 12, no. 12: 1132. https://doi.org/10.3390/pharmaceutics12121132
APA StyleObinu, A., Porcu, E. P., Piras, S., Ibba, R., Carta, A., Molicotti, P., Migheli, R., Dalpiaz, A., Ferraro, L., Rassu, G., Gavini, E., & Giunchedi, P. (2020). Solid Lipid Nanoparticles as Formulative Strategy to Increase Oral Permeation of a Molecule Active in Multidrug-Resistant Tuberculosis Management. Pharmaceutics, 12(12), 1132. https://doi.org/10.3390/pharmaceutics12121132