Development of Bio-Active Patches Based on Pectin for the Treatment of Ulcers and Wounds Using 3D-Bioprinting Technology


 ,
,  and
and 
Abstract
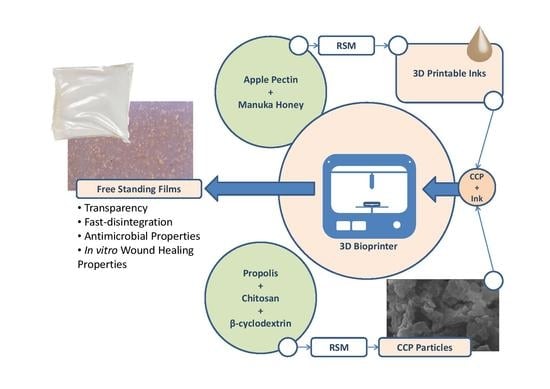
1. Introduction
2. Materials and Methods
2.1. Materials
2.2. Preparation of 3D Printed Patches
2.3. Design of Experiments
2.4. Preparation of Propolis Ethanolic Extract (EEP)
2.5. Preparation of Chitosan and β-Cyclodextrin/Propolis Extract Inclusion Complexes (CCP)
2.6. Determination of Total Polyphenol Content
2.7. Dynamic Light Scattering and ζ-Potential Measurements
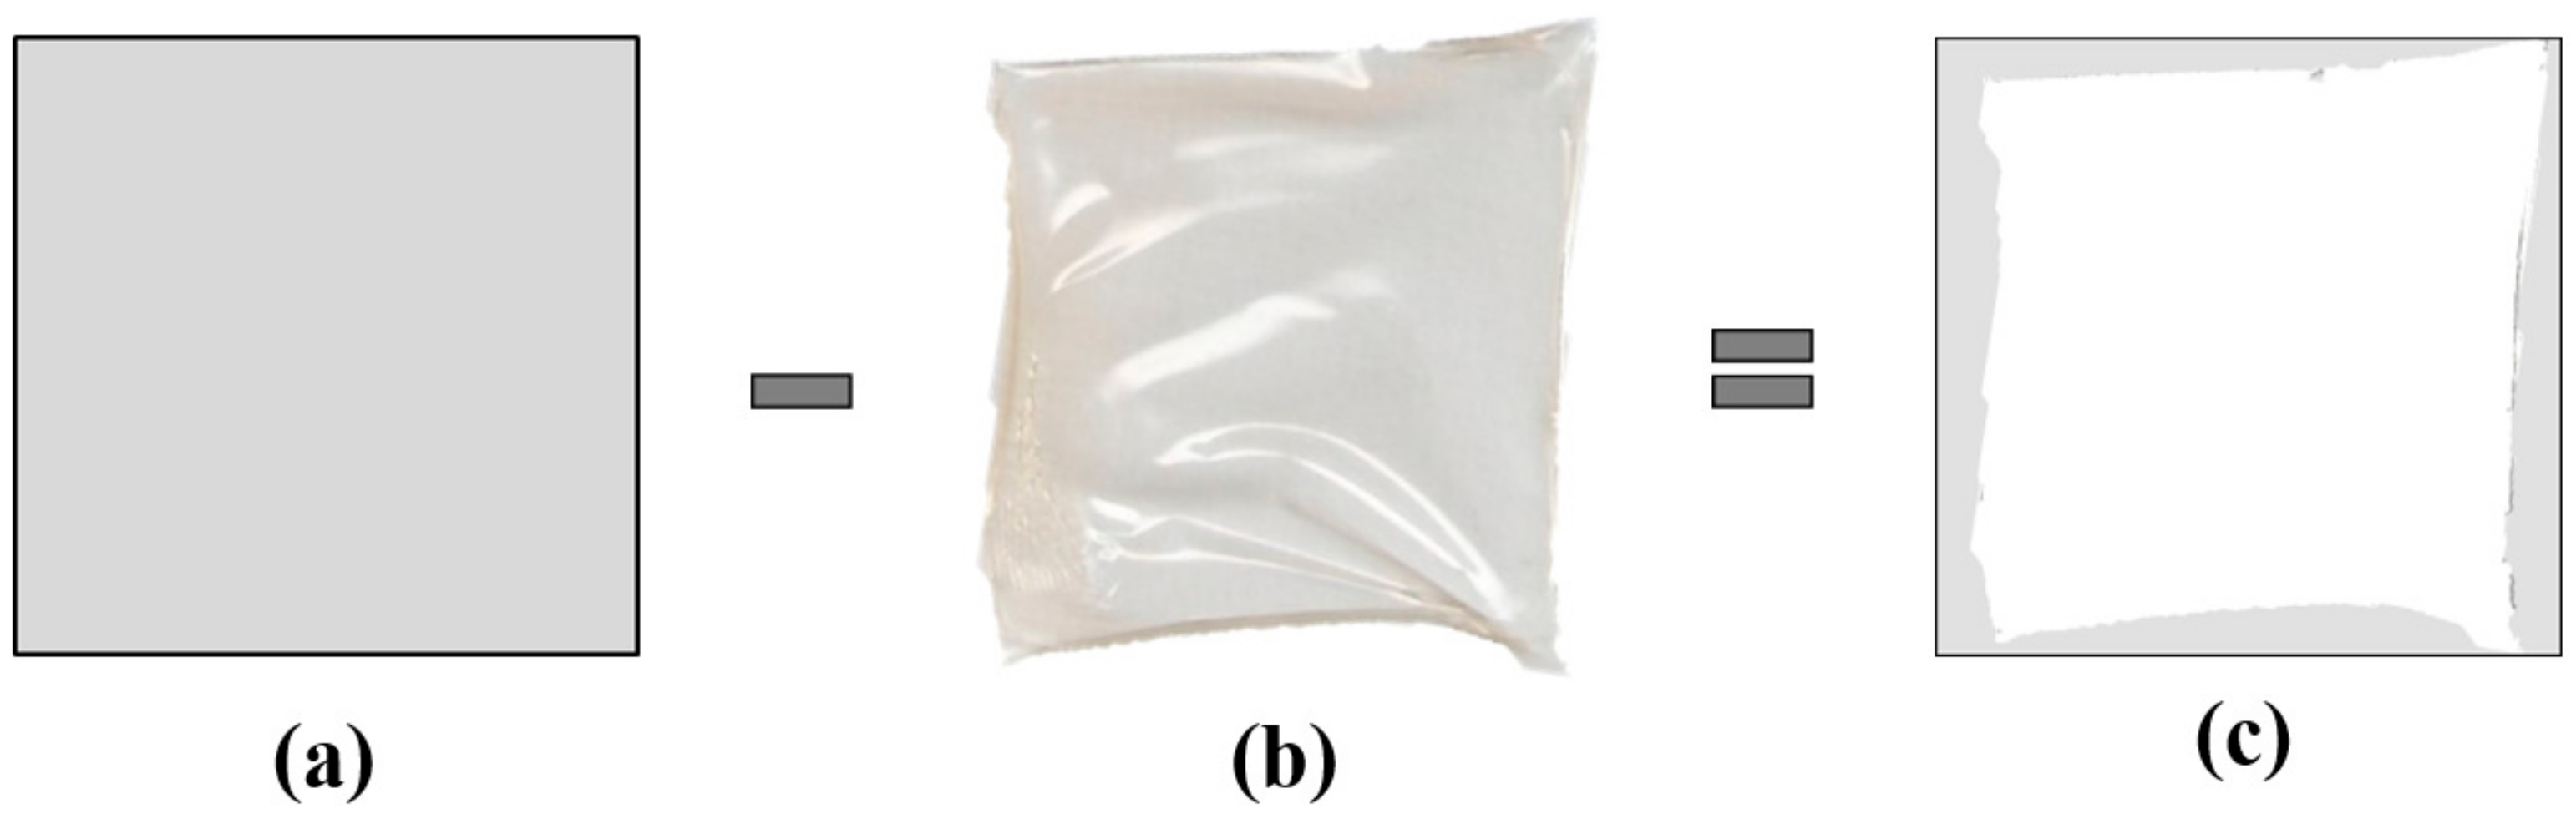
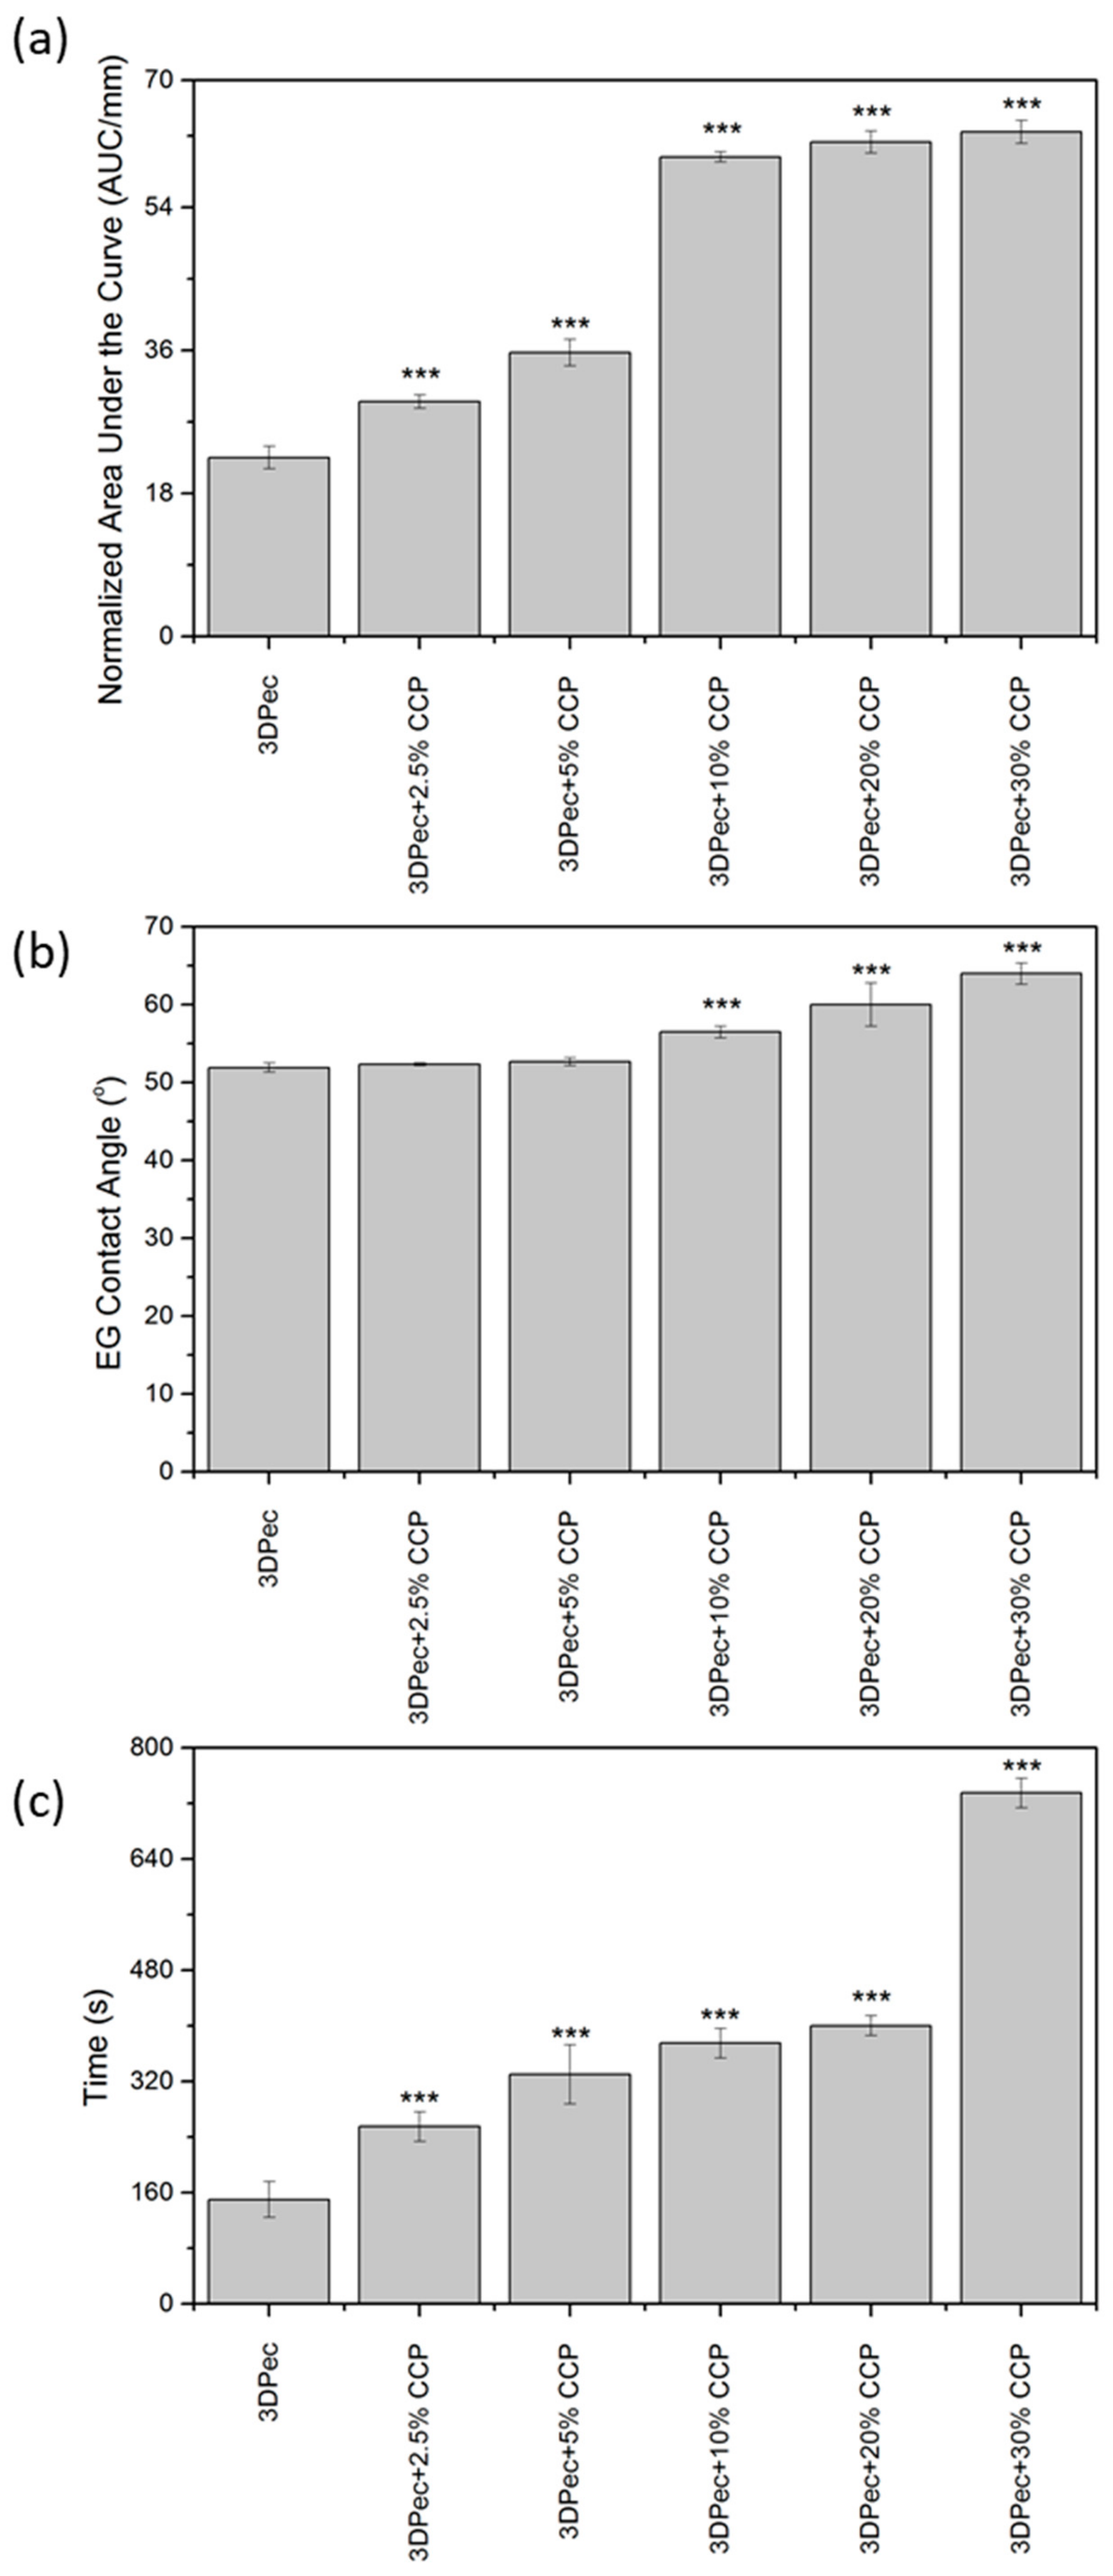
2.8. Film Swelling Studies
2.9. 3D Printing Shape Fidelity Assessment
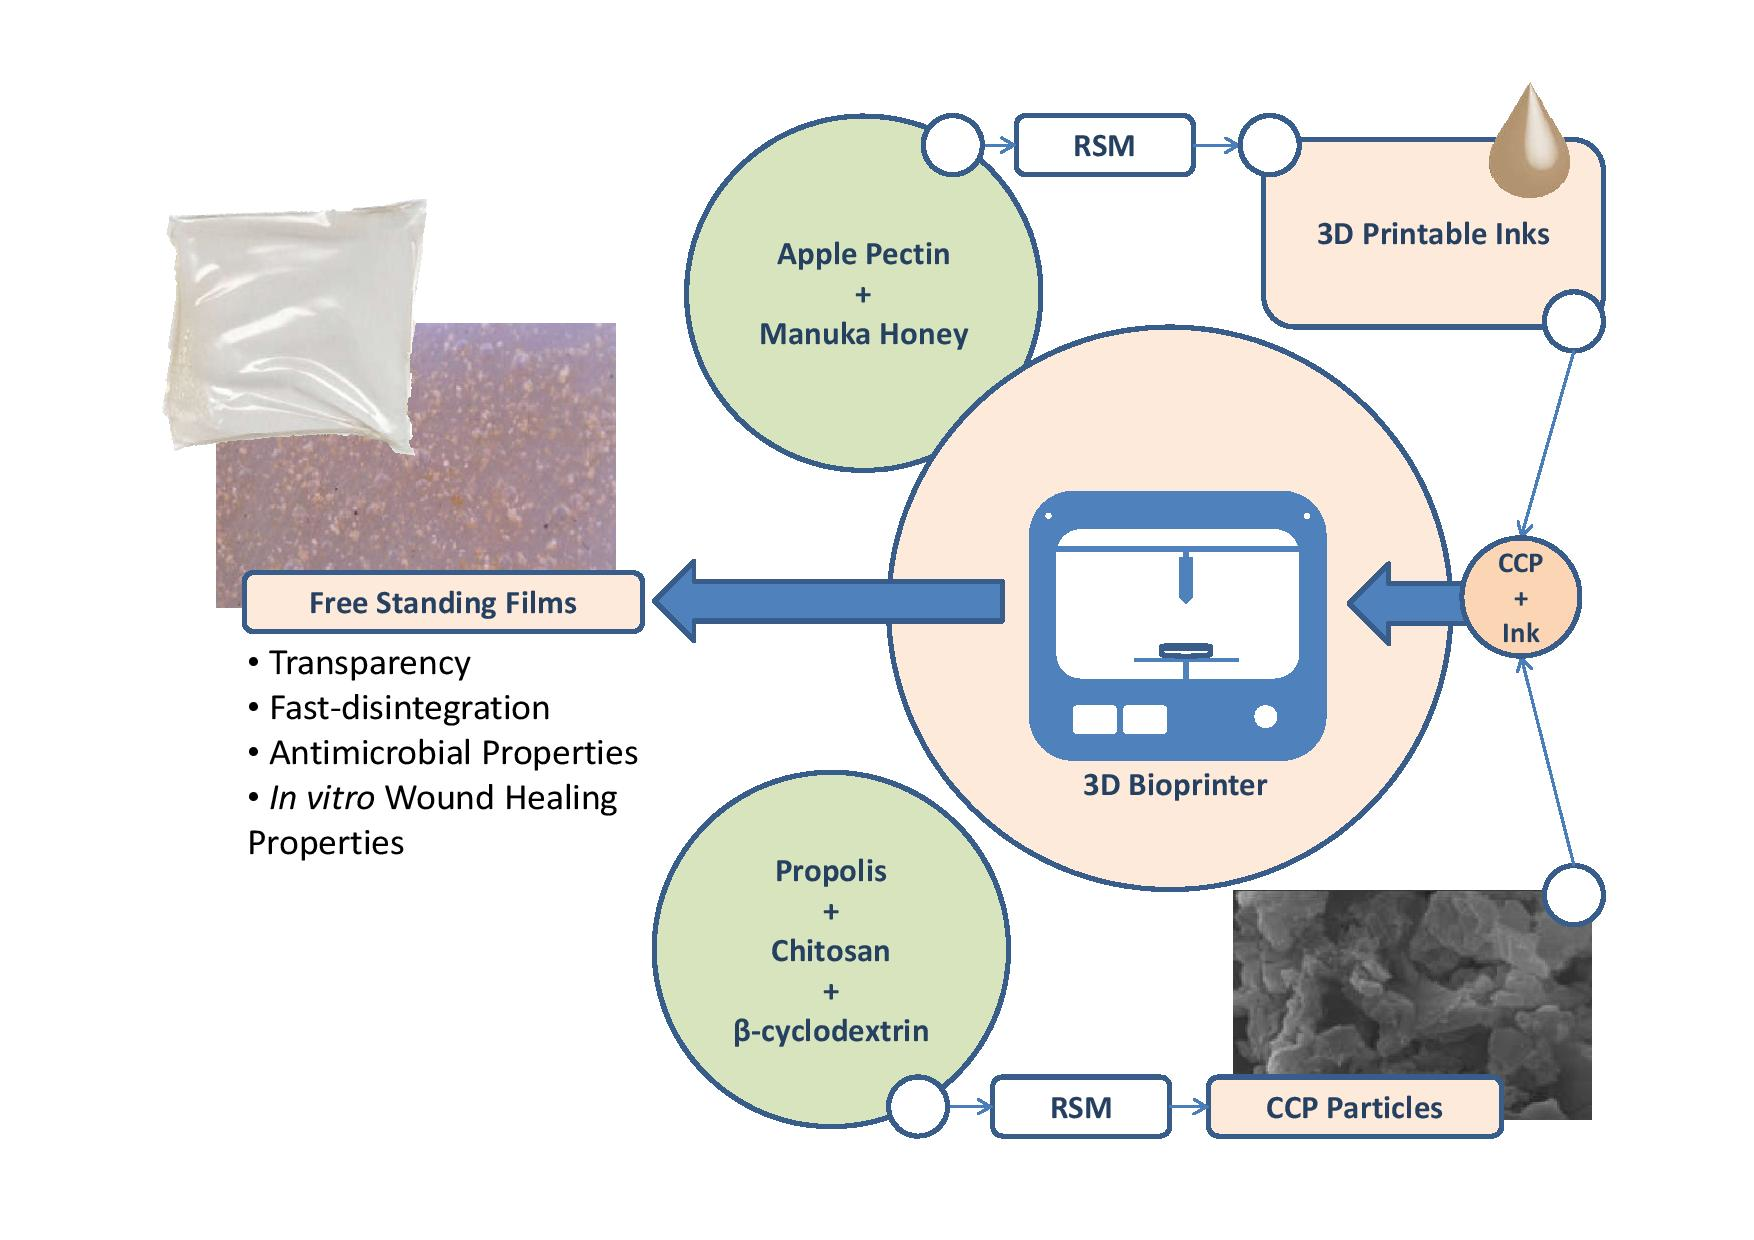
2.10. Determination of Film Opacity
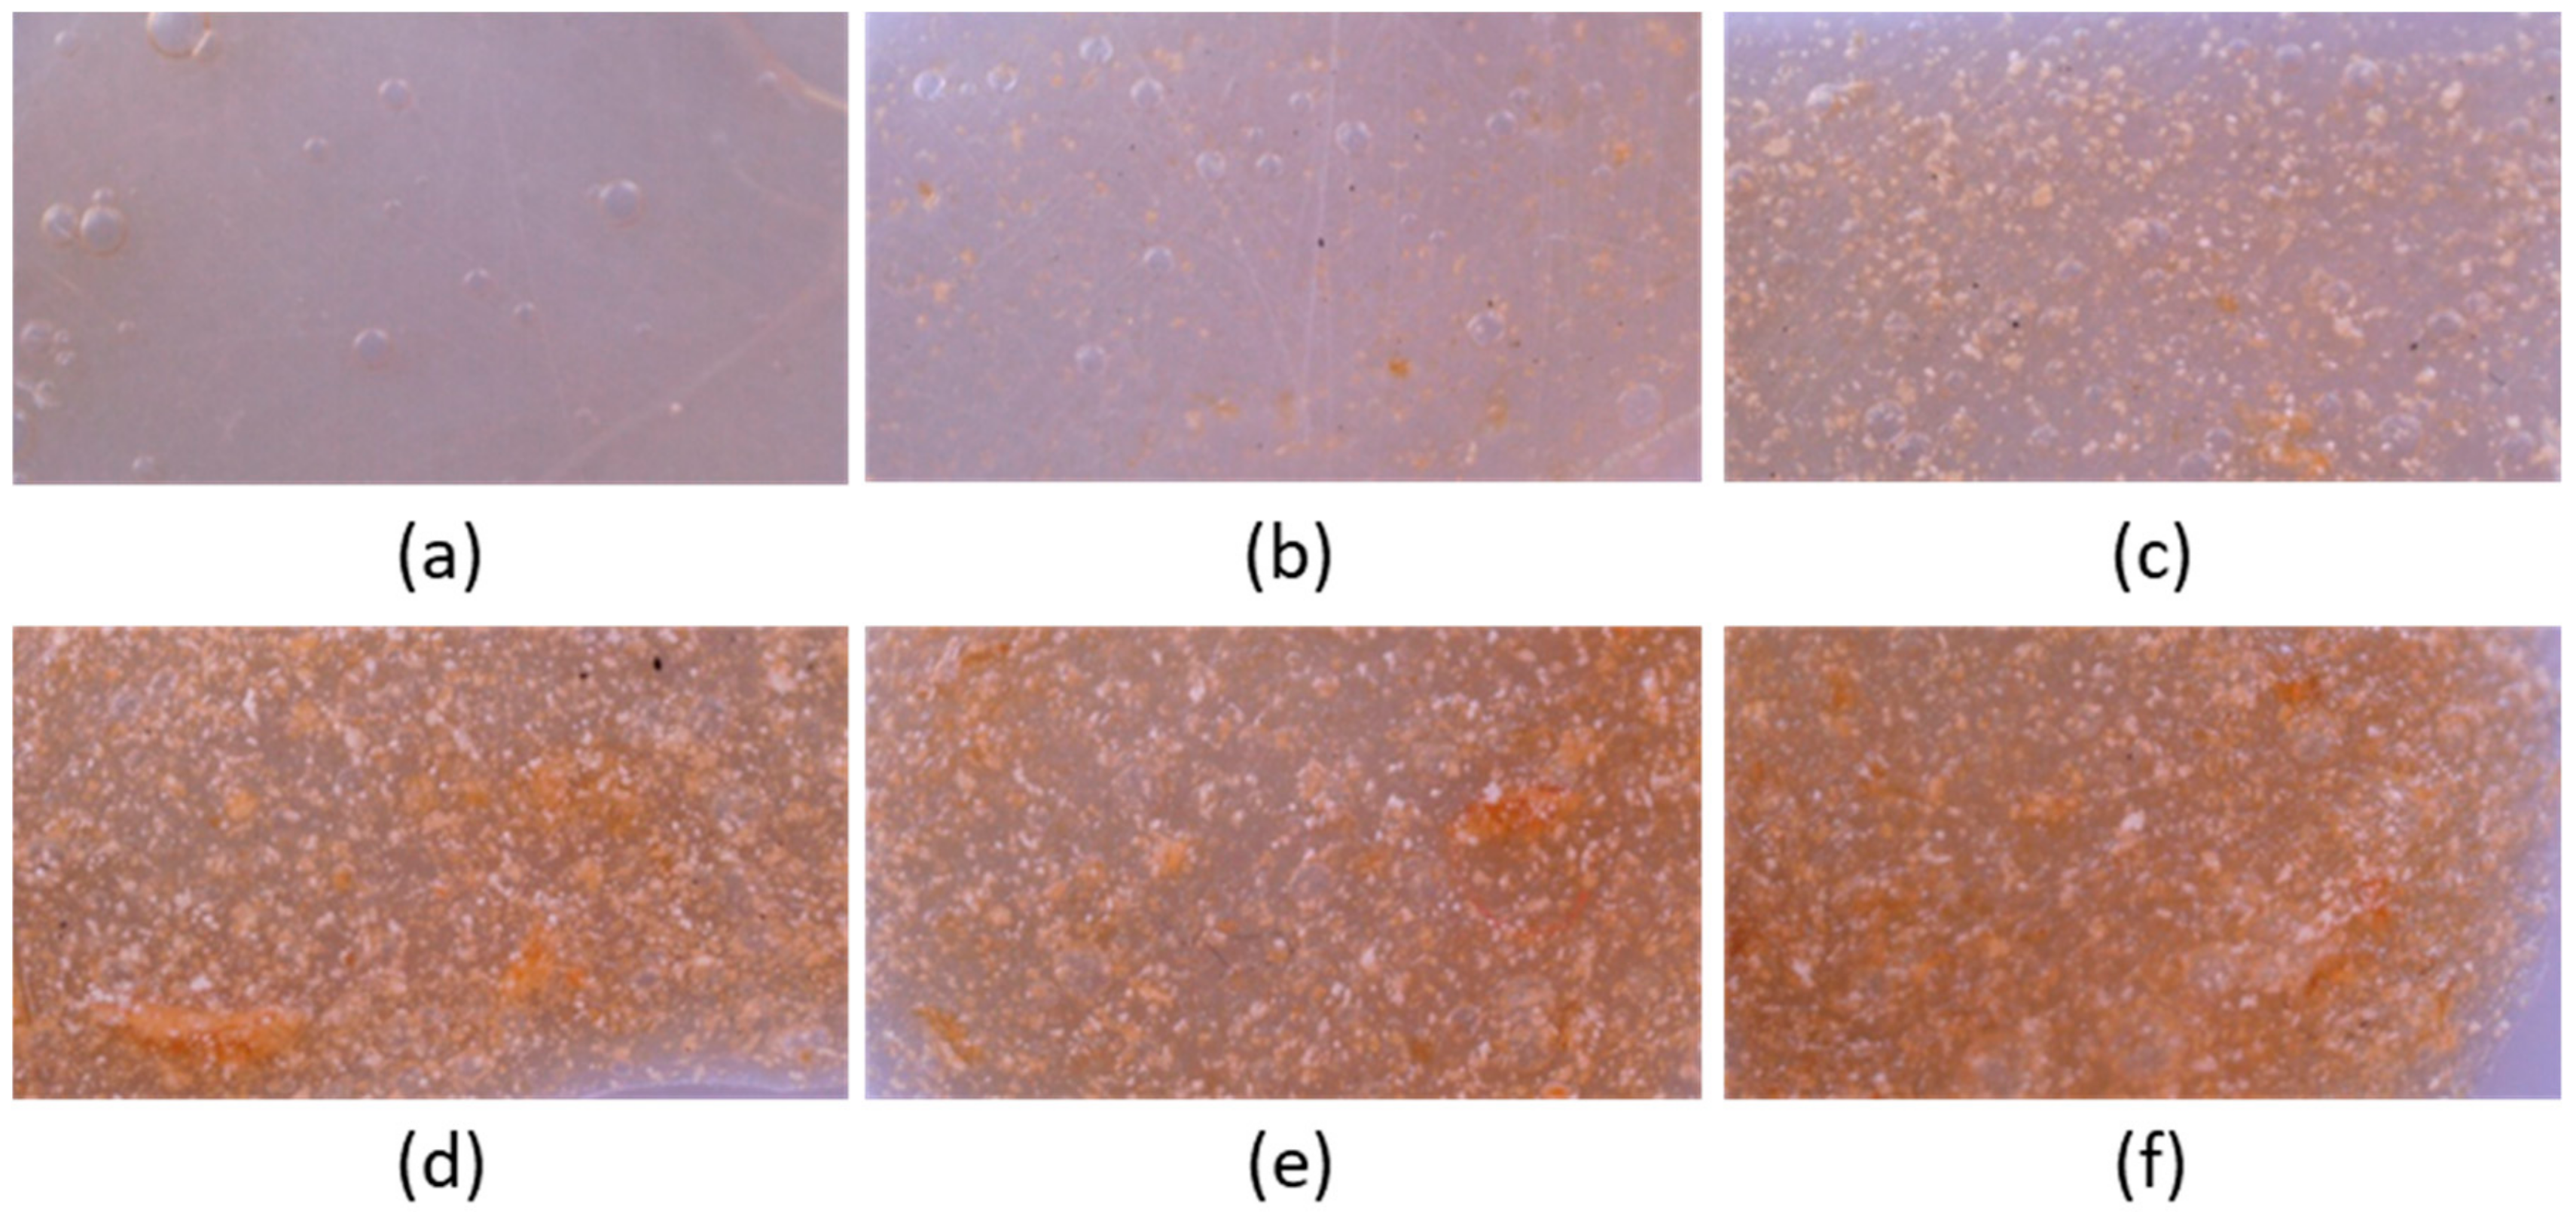
2.11. Optical Microscopy
2.12. Determination of Relative Surface Hydrophobicity
2.13. Mechanical Tests
2.14. Biodhesion Studies
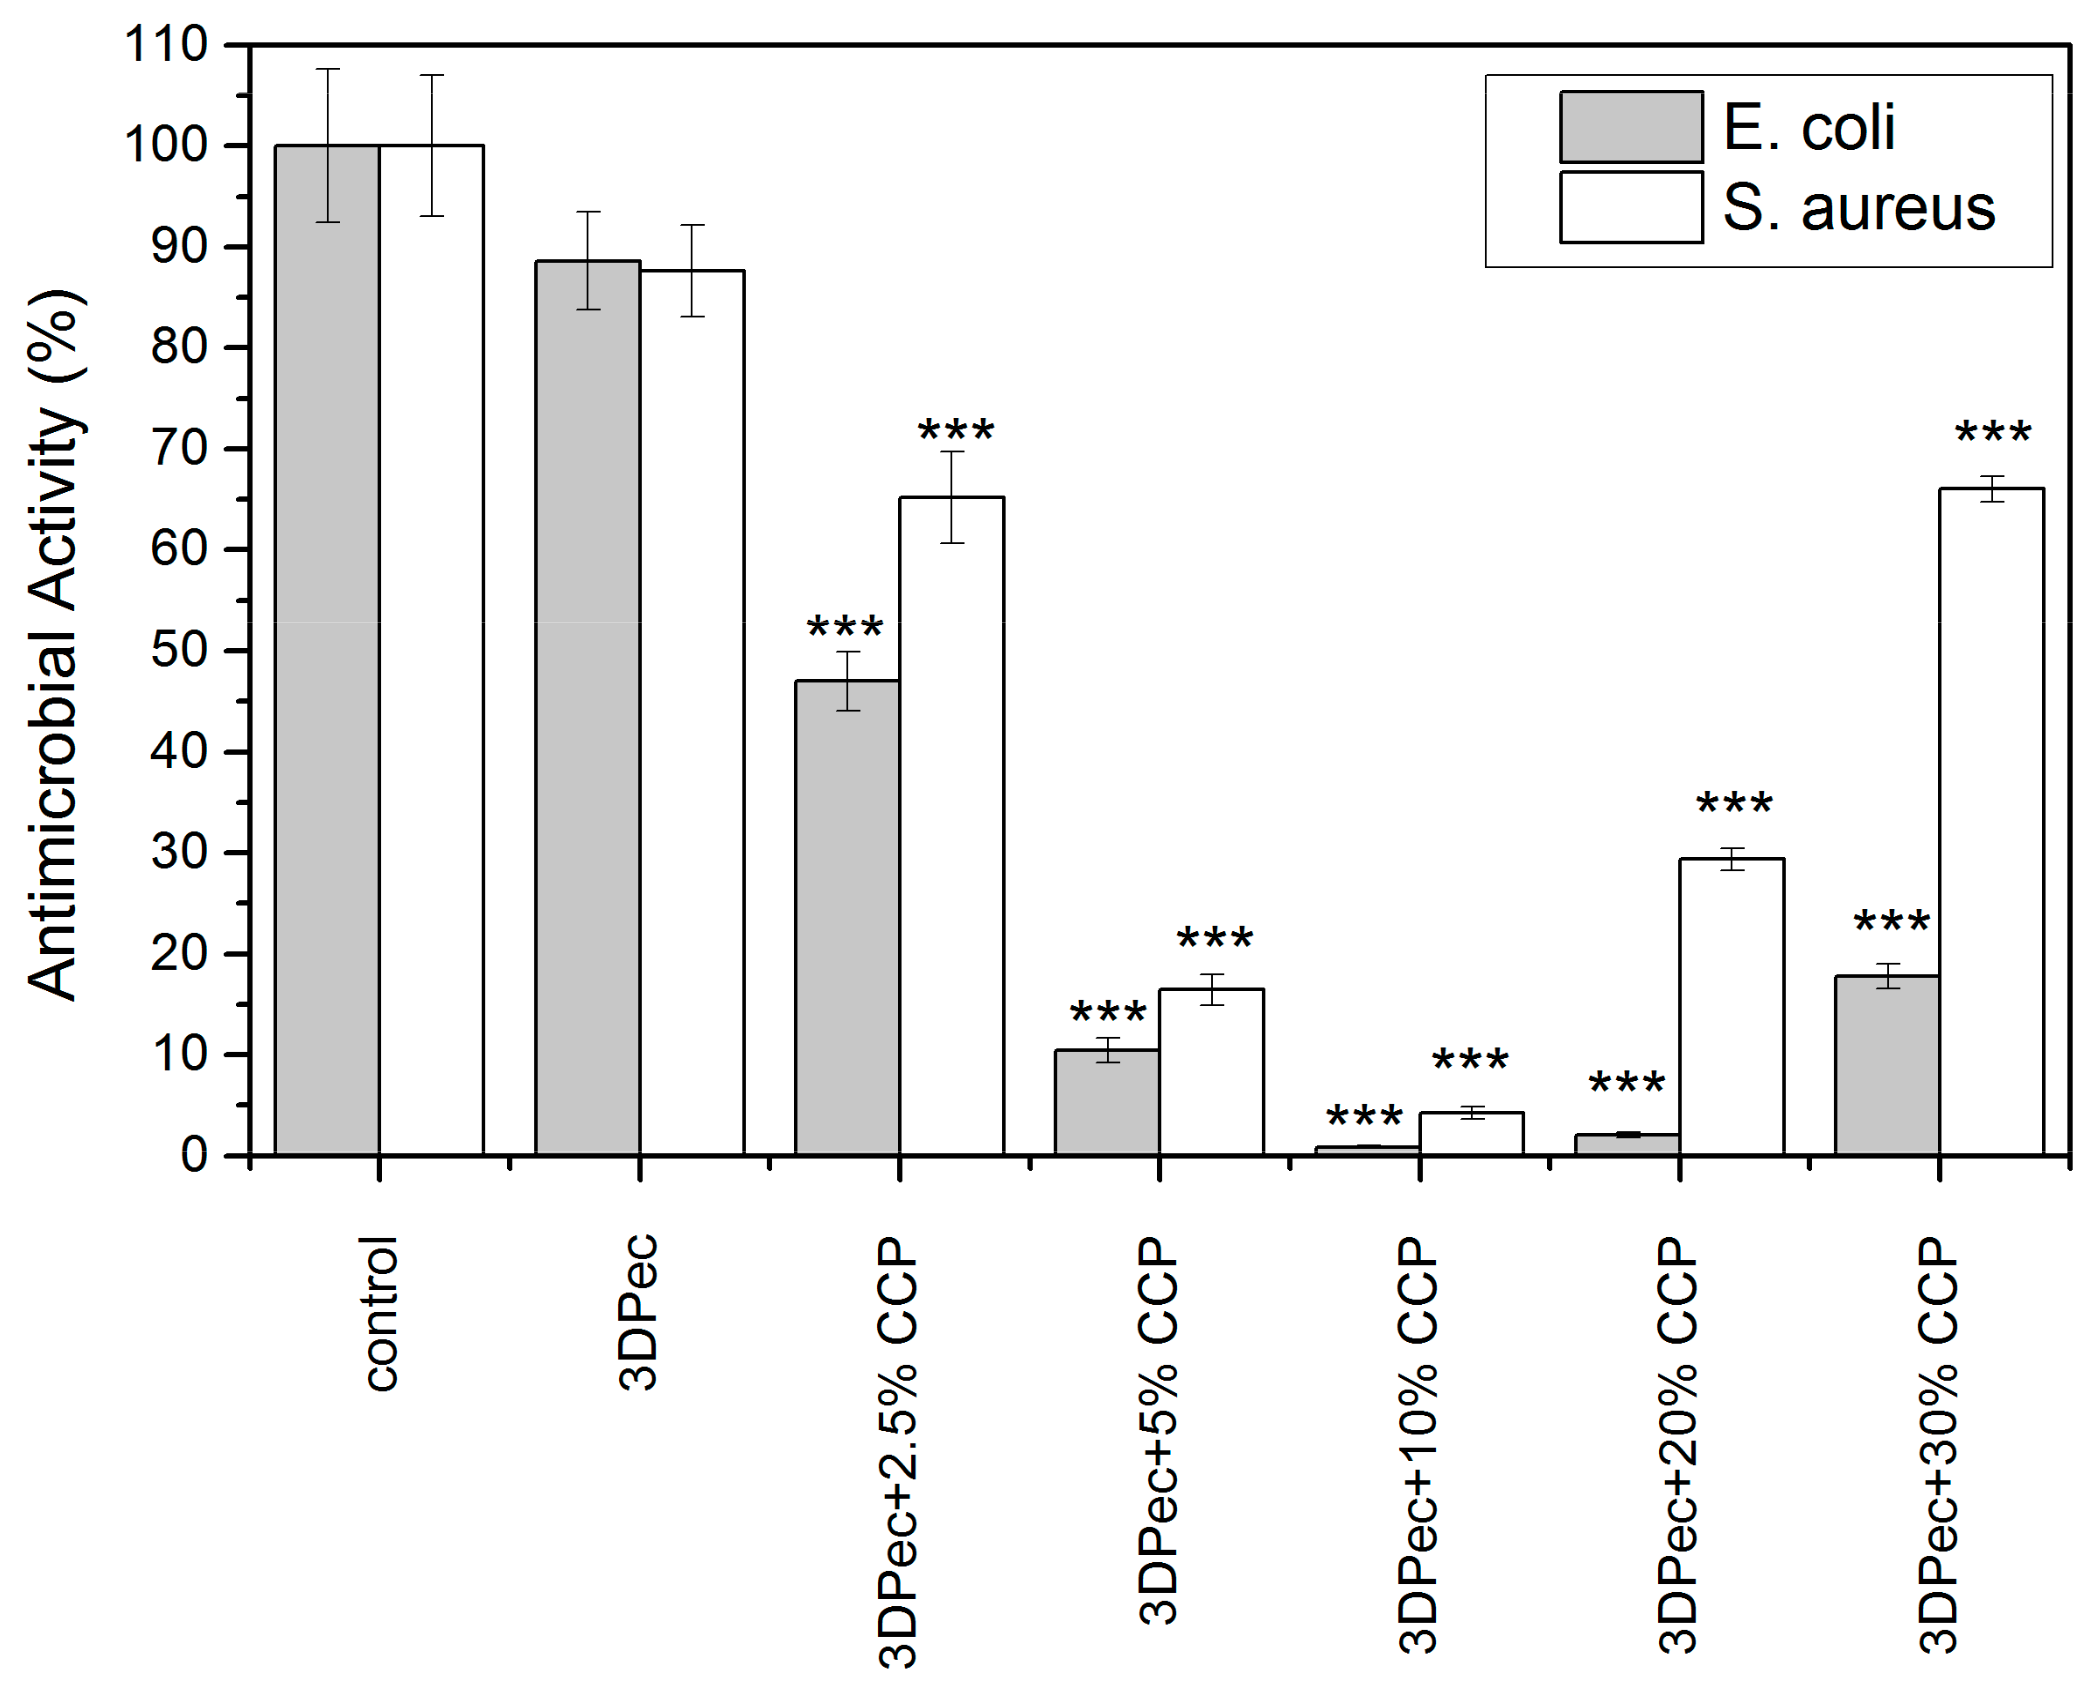
2.15. Determination of Antimicrobial Properties
2.16. Film Disintegration Test
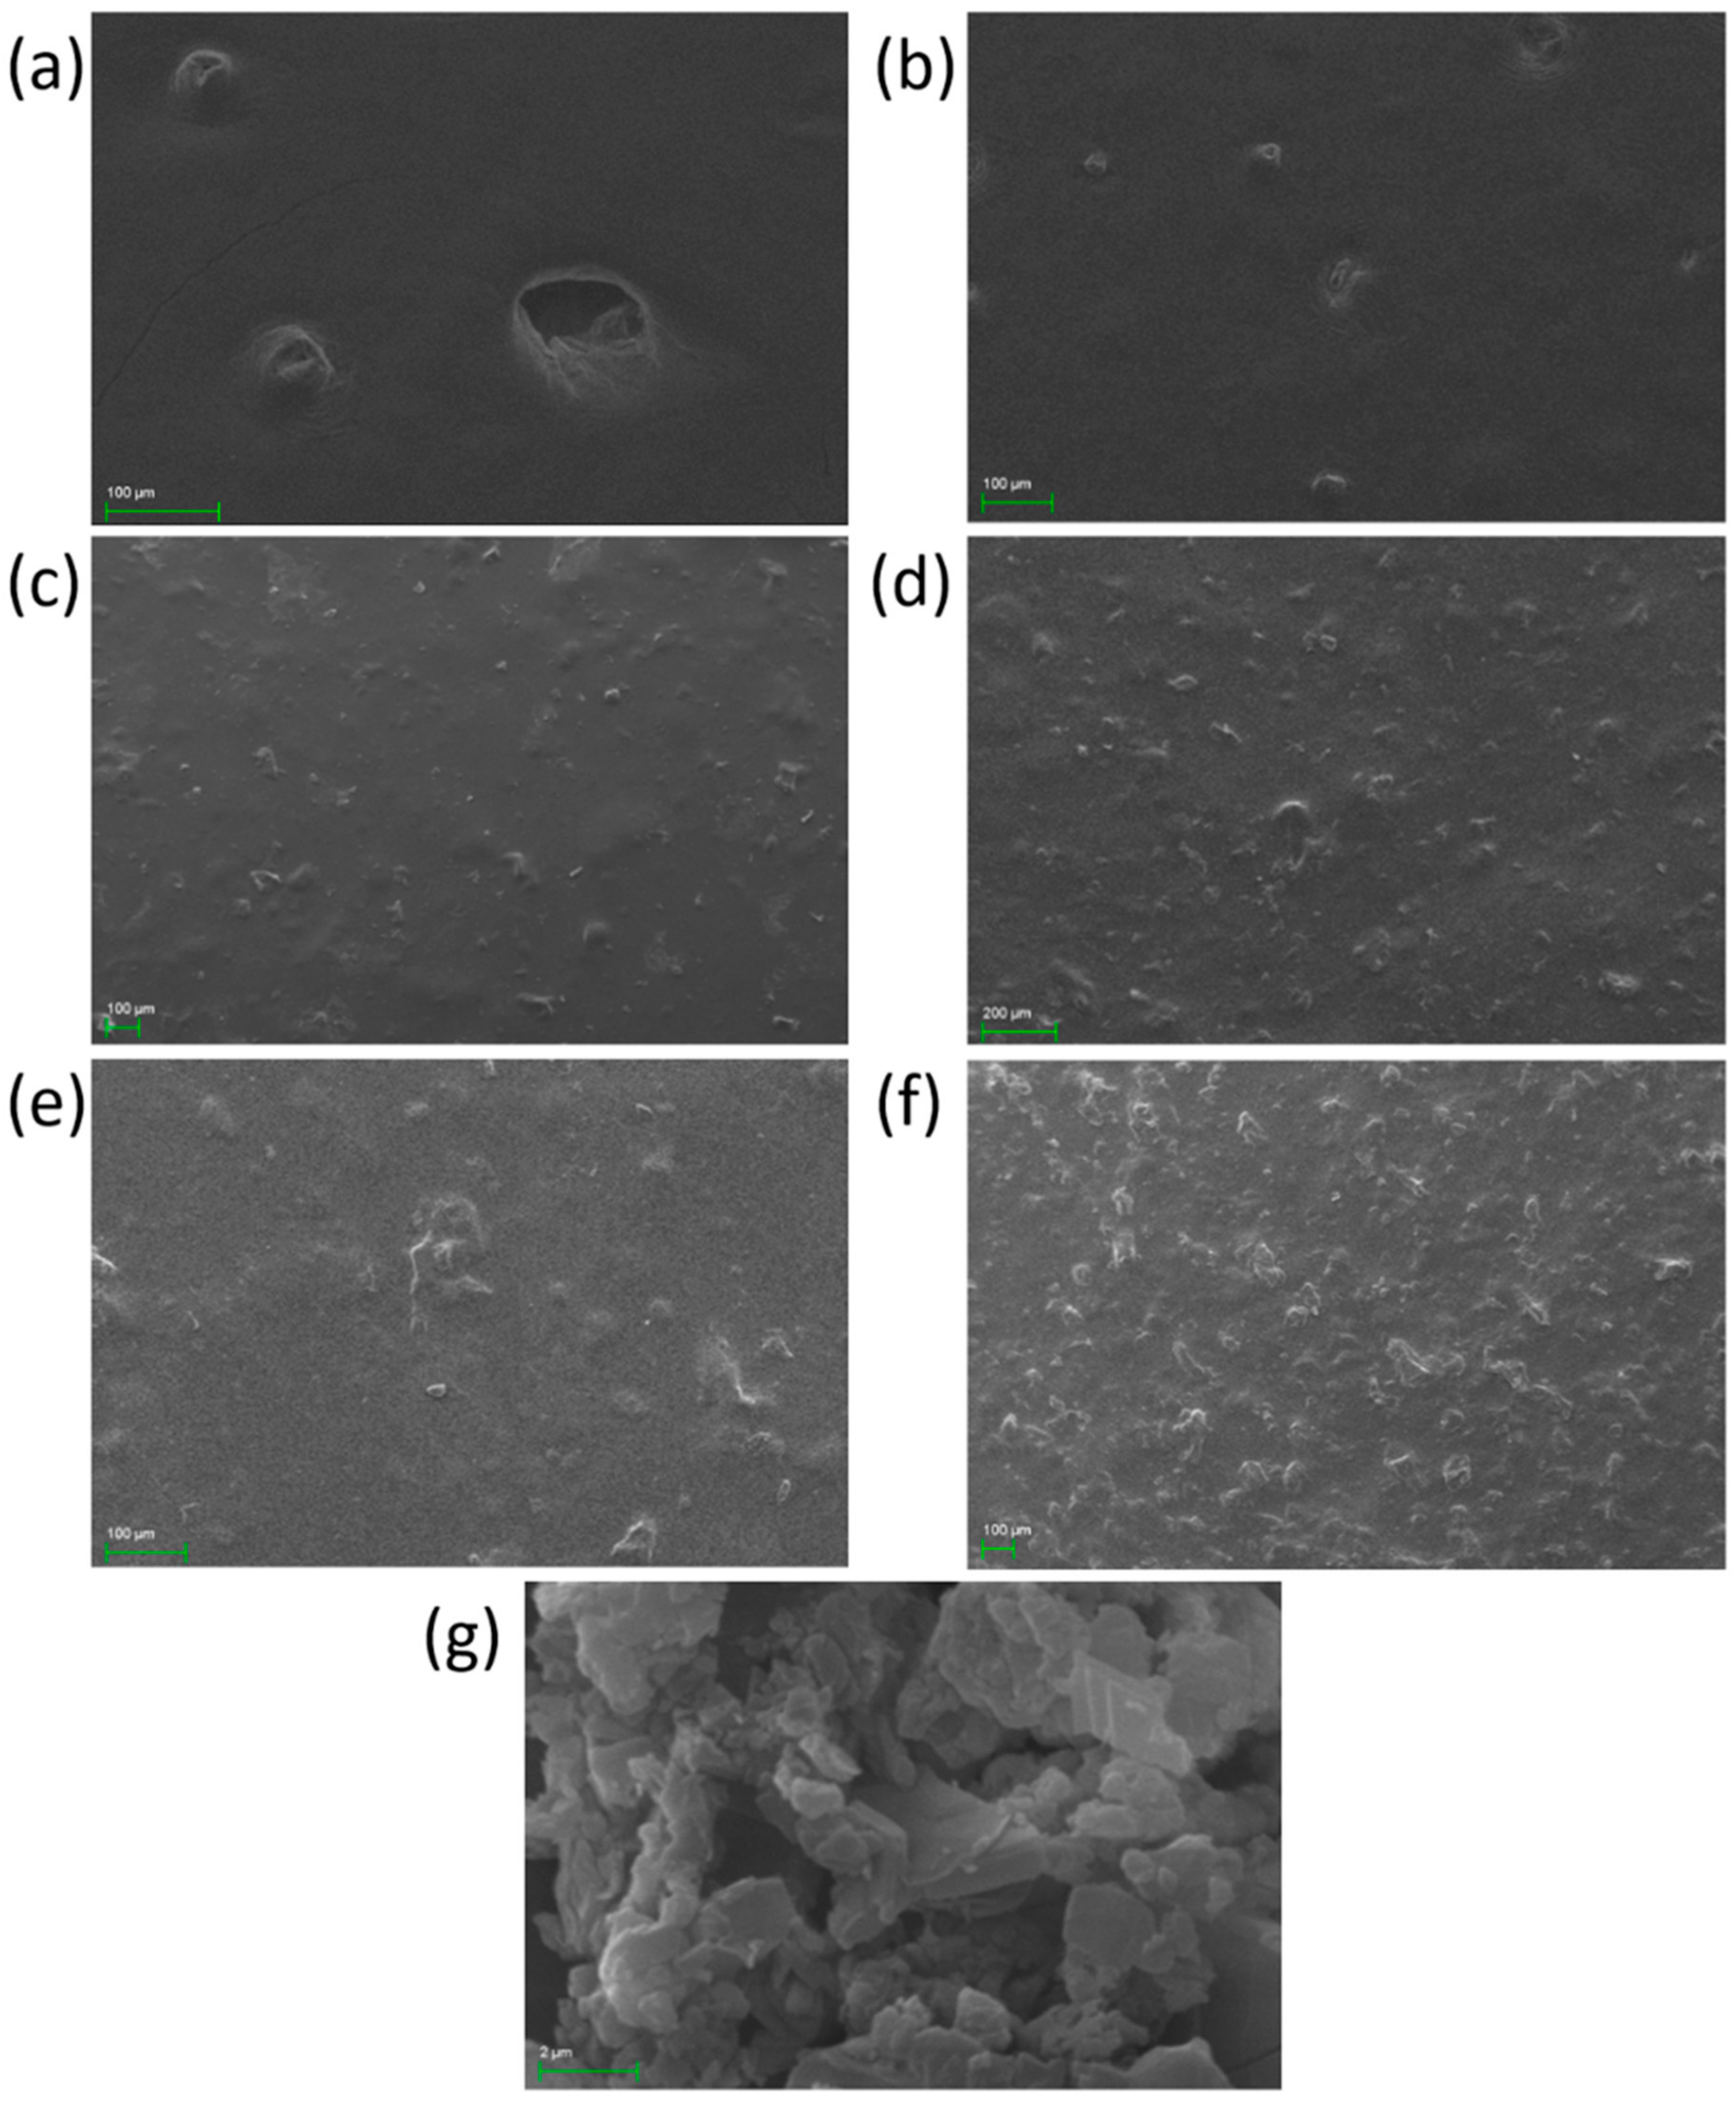
2.17. Scanning Electron Microscopy
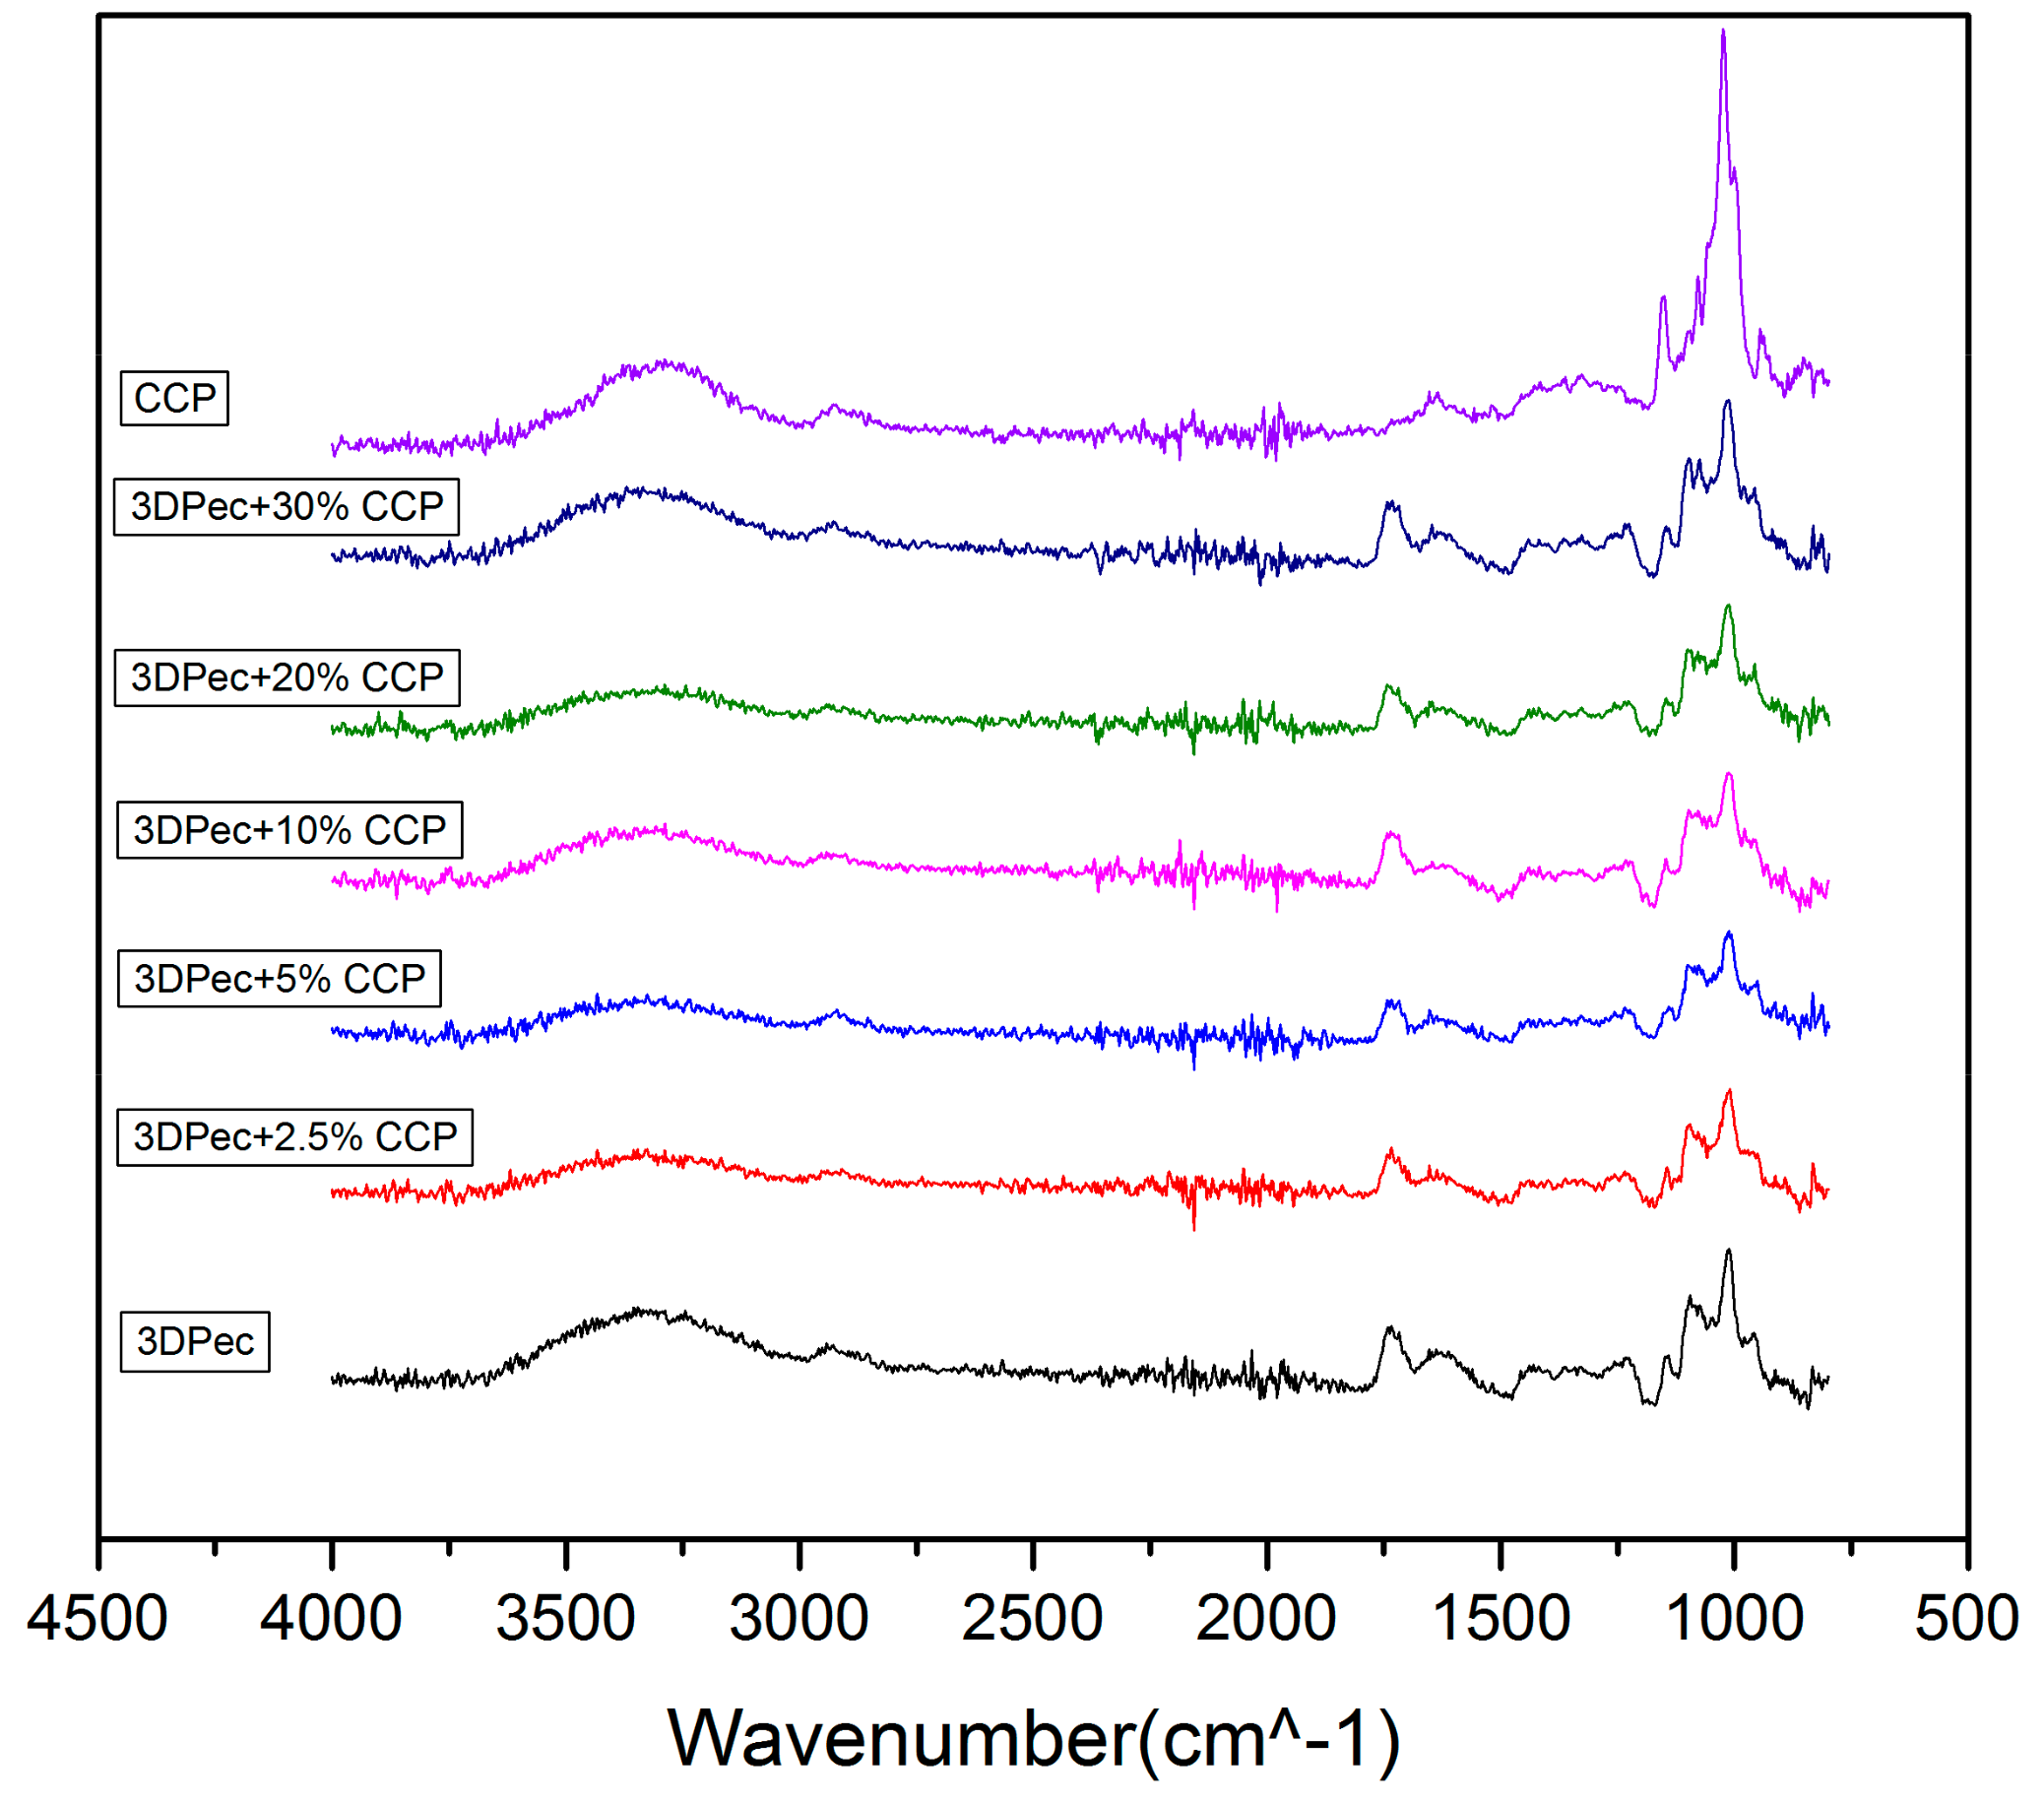
2.18. Fourier-Transform Infra-Red (FTIR).
2.19. Cell Culture
2.20. Cell Viability—MTT Assay
2.21. Cell Scratch Assay (In Vitro Wound Healing)
2.22. Statistical Analysis
3. Results and Discussion
3.1. Process Optimization
3.1.1. Optimization of 3D Printable Pectin Inks
3.1.2. Optimization of Chitosan and Cyclodextrin/Propolis Extract Inclusion Complexes
3.1.3. Confirmation Experiments
3.2. Evaluation of 3DPectin Patches Containing CCP
3.2.1. Film Opacity
3.2.2. Relative Surface Hydrophobicity
3.2.3. Film Disintegration Test
3.2.4. Film Surface Observation
3.2.5. Fourier-Transform Infra-Red (FTIR)
3.2.6. Mechanical Tests
3.2.7. Bioadhesion Studies
3.2.8. Determination of Antimicrobial Properties
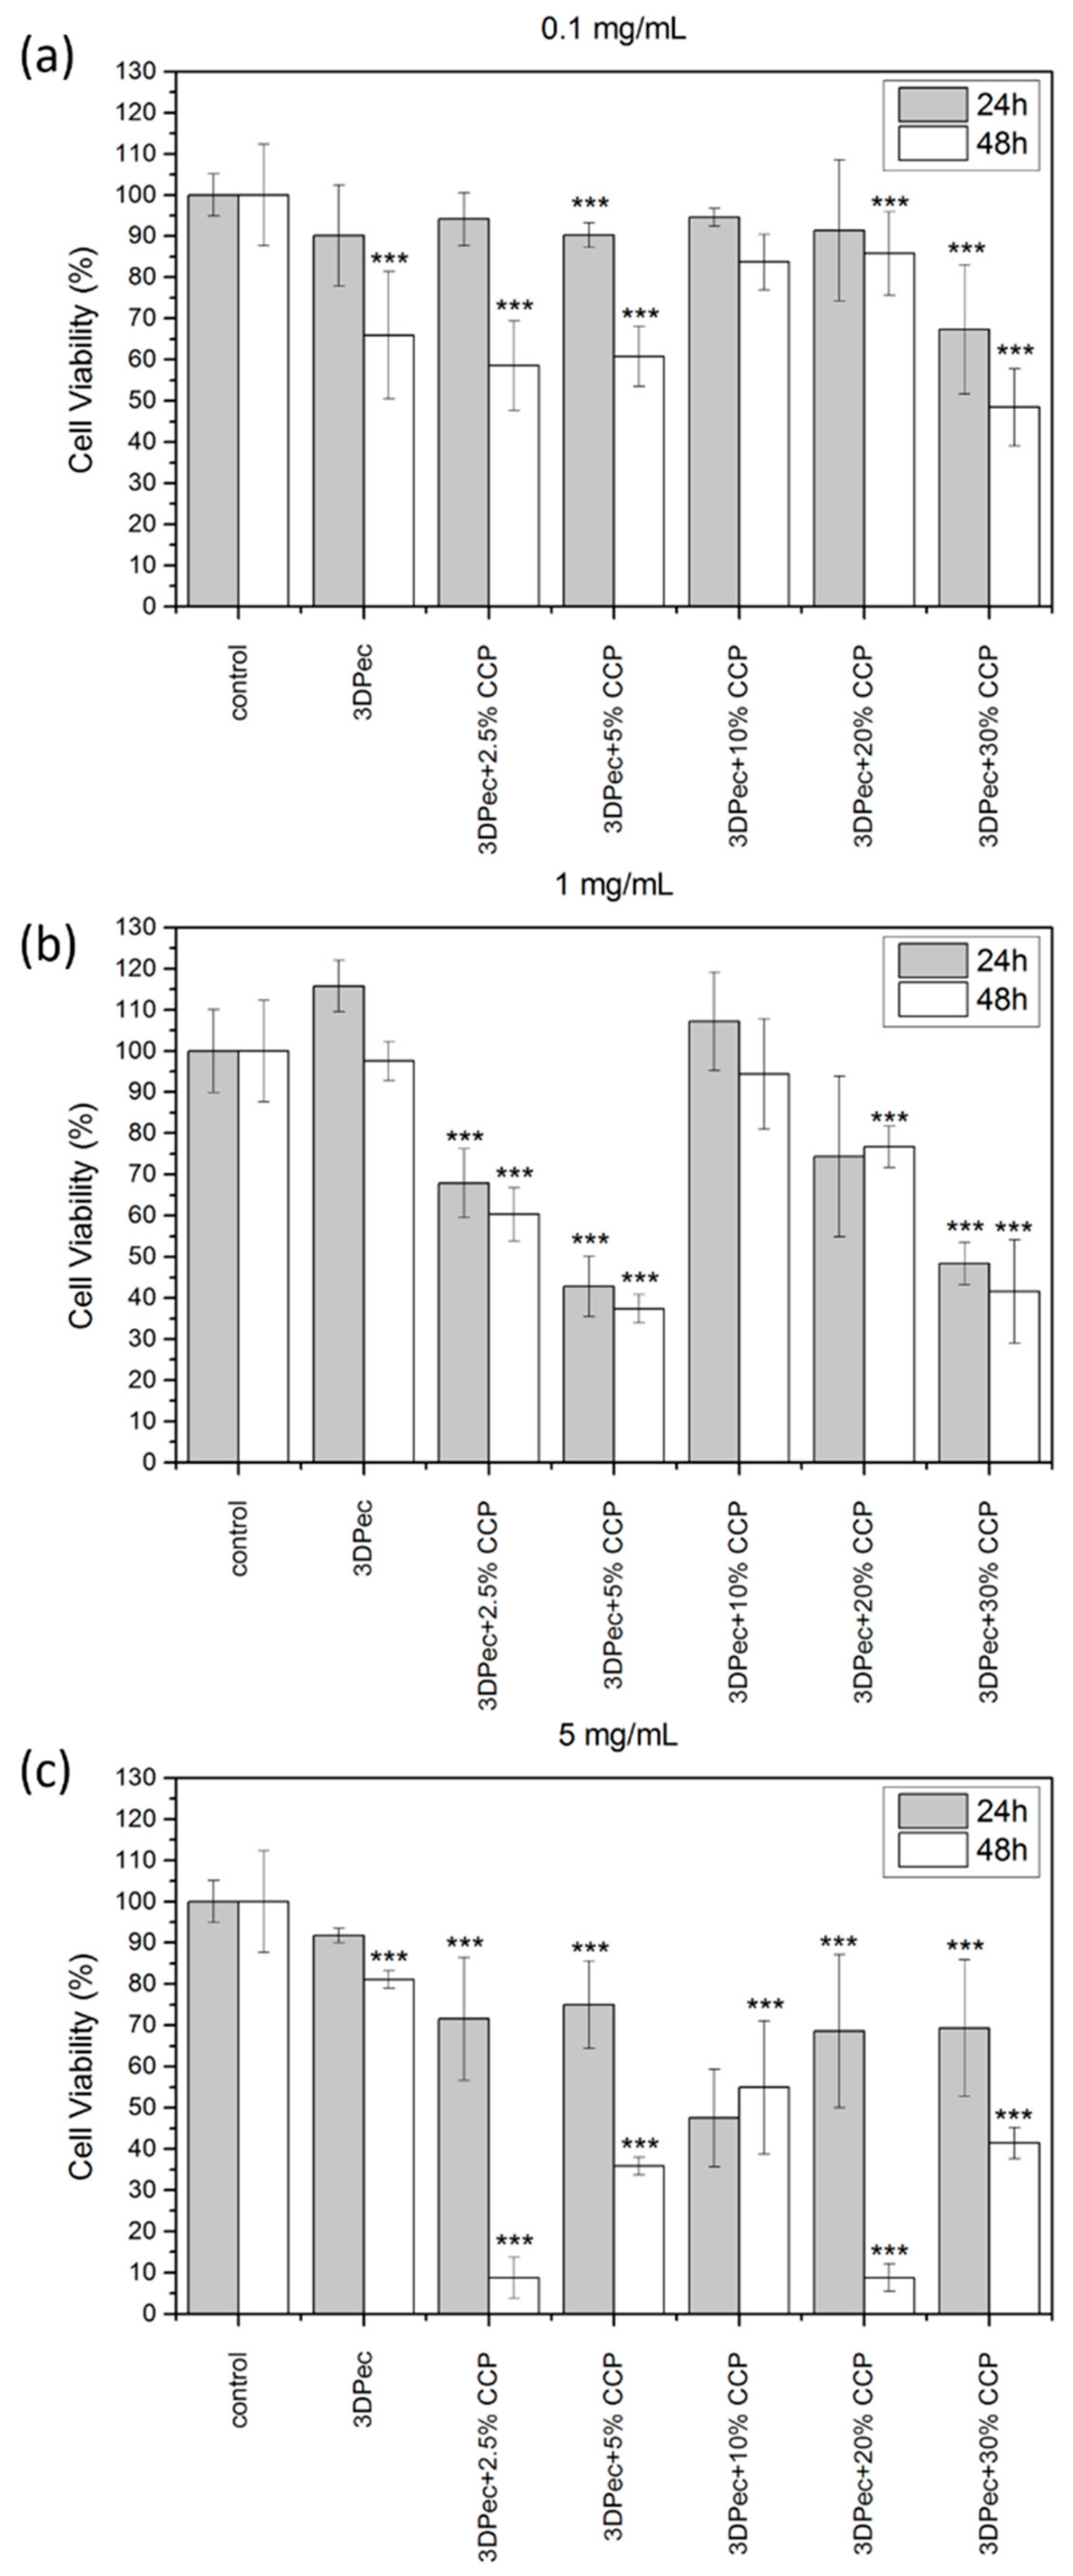
3.2.9. Cell Viability Assay
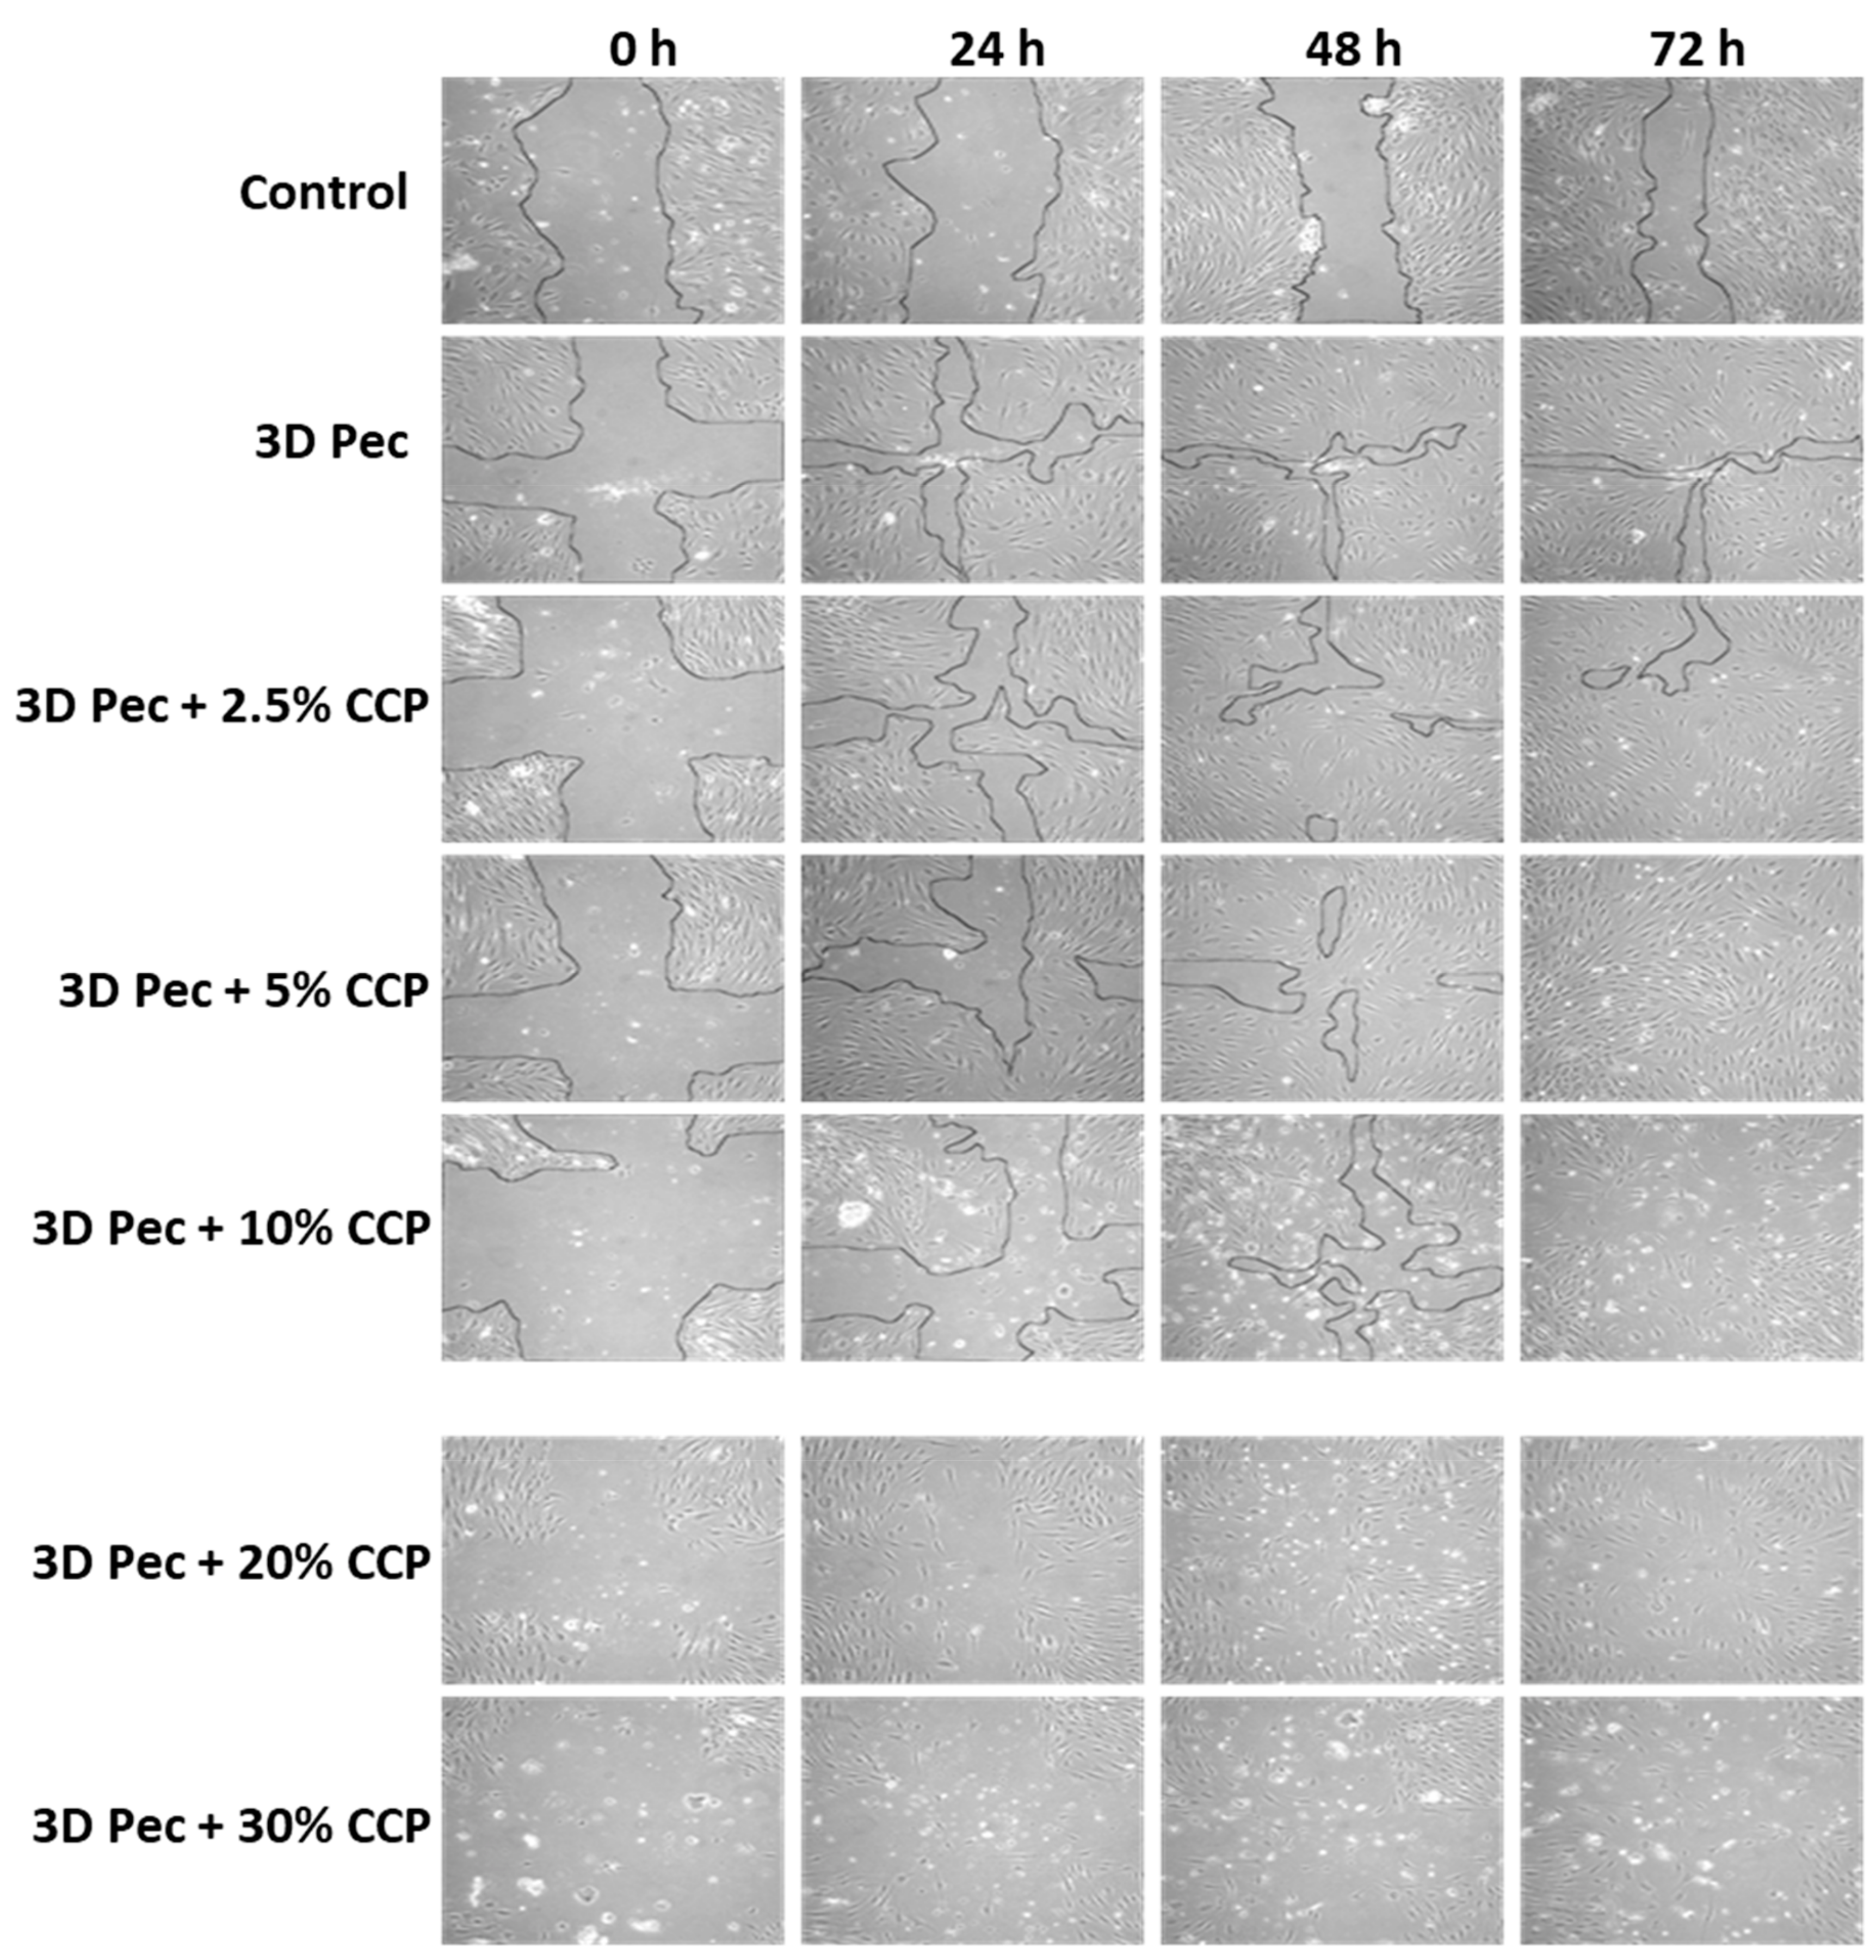
3.2.10. Cell Scratch Assay (In Vitro Wound Healing)
4. Conclusions
Author Contributions
Funding
Acknowledgments
Conflicts of Interest
References
- Jantrawut, P.; Bunrueangtha, J.; Suerthong, J.; Kantrong, N. Fabrication and Characterization of Low Methoxyl Pectin/Gelatin/Carboxymethyl Cellulose Absorbent Hydrogel Film for Wound Dressing Applications. Materials 2019, 12, 1628. [Google Scholar] [CrossRef] [PubMed]
- Paul, W.; Sharma, C.P. Advances in Wound Healing Materials: Science and Skin Engineering; Smithers Rapra Technology Ltd.: Shawbury, UK, 2015; ISBN 978-1-909030-36-7. [Google Scholar]
- Rezvani Ghomi, E.; Khalili, S.; Nouri Khorasani, S.; Esmaeely Neisiany, R.; Ramakrishna, S. Wound dressings: Current advances and future directions. J. Appl. Polym. Sci. 2019, 136, 47738. [Google Scholar] [CrossRef]
- Dhivya, S.; Padma, V.V.; Santhini, E. Wound dressings-a review. BioMed 2015, 5, 22. [Google Scholar] [CrossRef] [PubMed]
- Kannon, G.A.; Garrett, A.B. Moist Wound Healing with Occlusive Dressings: A Clinical Review. Dermatol. Surg. 1995, 21, 583–590. [Google Scholar] [CrossRef]
- Lanel, B.; Barthesbiesel, D.; Regnier, C.; Chauve, T. Swelling of hydrocolloid dressings. Biorheology 1997, 34, 139–153. [Google Scholar] [CrossRef]
- Munarin, F.; Tanzi, M.C.; Petrini, P. Advances in biomedical applications of pectin gels. Int. J. Biol. Macromol. 2012, 51, 681–689. [Google Scholar] [CrossRef]
- Giusto, G.; Vercelli, C.; Comino, F.; Caramello, V.; Tursi, M.; Gandini, M. A new, easy-to-make pectin-honey hydrogel enhances wound healing in rats. BMC Complement. Altern. Med. 2017, 17, 266. [Google Scholar] [CrossRef]
- Minden-Birkenmaier, B.; Bowlin, G. Honey-Based Templates in Wound Healing and Tissue Engineering. Bioengineering 2018, 5, 46. [Google Scholar] [CrossRef]
- Molan, P.; Rhodes, T. Honey: A Biologic Wound Dressing. Wounds 2015, 27, 141–151. [Google Scholar]
- Martinotti, S.; Ranzato, E. Propolis: A new frontier for wound healing? Burn. Trauma 2015, 3, 9. [Google Scholar] [CrossRef]
- Sameni, H.R.; Ramhormozi, P.; Bandegi, A.R.; Taherian, A.A.; Mirmohammadkhani, M.; Safari, M. Effects of ethanol extract of propolis on histopathological changes and anti-oxidant defense of kidney in a rat model for type 1 diabetes mellitus. J. Diabetes Investig. 2016, 7, 506–513. [Google Scholar] [CrossRef] [PubMed]
- Sharaf, S.; El-Naggar, M.E. Wound dressing properties of cationized cotton fabric treated with carrageenan/cyclodextrin hydrogel loaded with honey bee propolis extract. Int. J. Biol. Macromol. 2019, 133, 583–591. [Google Scholar] [CrossRef] [PubMed]
- Khaled, S.A.; Alexander, M.R.; Irvine, D.J.; Wildman, R.D.; Wallace, M.J.; Sharpe, S.; Yoo, J.; Roberts, C.J. Extrusion 3D Printing of Paracetamol Tablets from a Single Formulation with Tunable Release Profiles Through Control of Tablet Geometry. AAPS PharmSciTech 2018, 19, 3403–3413. [Google Scholar] [CrossRef] [PubMed]
- Eleftheriadis, G.K.; Katsiotis, C.S.; Bouropoulos, N.; Koutsopoulos, S.; Fatouros, D.G. FDM printed pH-responsive capsules for the oral delivery of a model macromolecular dye. Pharm. Dev. Technol. 2020, 1–23. [Google Scholar] [CrossRef]
- Coimbra, P.; Ferreira, P.; de Sousa, H.C.; Batista, P.; Rodrigues, M.A.; Correia, I.J.; Gil, M.H. Preparation and chemical and biological characterization of a pectin/chitosan polyelectrolyte complex scaffold for possible bone tissue engineering applications. Int. J. Biol. Macromol. 2011, 48, 112–118. [Google Scholar] [CrossRef] [PubMed]
- Katsube, T.; Tabata, H.; Ohta, Y.; Yamasaki, Y.; Anuurad, E.; Shiwaku, K.; Yamane, Y. Screening for Antioxidant Activity in Edible Plant Products: Comparison of Low-Density Lipoprotein Oxidation Assay, DPPH Radical Scavenging Assay, and Folin-Ciocalteu Assay. J. Agric. Food Chem. 2004, 52, 2391–2396. [Google Scholar] [CrossRef]
- Matsakidou, A.; Biliaderis, C.G.; Kiosseoglou, V. Preparation and characterization of composite sodium caseinate edible films incorporating naturally emulsified oil bodies. Food Hydrocoll. 2013, 30, 232–240. [Google Scholar] [CrossRef]
- Choi, W.S.; Han, J.H. Film-forming Mechanism and Heat Denaturation Effects on the Physical and Chemical Properties of Pea-Protein-Isolate Edible Films. J. Food Sci. 2002, 67, 1399–1406. [Google Scholar] [CrossRef]
- Sezer, A.D.; Hatipoglu, F.; Cevher, E.; Oğurtan, Z.; Bas, A.L.; Akbuğa, J. Chitosan film containing fucoidan as a wound dressing for dermal burn healing: Preparation and in vitro/in vivo evaluation. AAPS PharmSciTech 2007, 8, E94–E101. [Google Scholar] [CrossRef]
- Liu, L.; Kuffel, K.; Scott, D.K.; Constantinescu, G.; Chung, H.-J.; Rieger, J. Silicone-based adhesives for long-term skin application: Cleaning protocols and their effect on peel strength. Biomed. Phys. Eng. Express 2017, 4, 015004. [Google Scholar] [CrossRef]
- Boateng, J.S.; Pawar, H.V.; Tetteh, J. Polyox and carrageenan based composite film dressing containing anti-microbial and anti-inflammatory drugs for effective wound healing. Int. J. Pharm. 2013, 441, 181–191. [Google Scholar] [CrossRef] [PubMed]
- Zhang, Z.; Zhang, S.; Su, R.; Xiong, D.; Feng, W.; Chen, J. Controlled Release Mechanism and Antibacterial Effect of Layer-By-Layer Self-Assembly Thyme Oil Microcapsule. J. Food Sci. 2019, 84, 1427–1438. [Google Scholar] [CrossRef] [PubMed]
- Zhang, C.; Li, Y.; Hu, Y.; Peng, Y.; Ahmad, Z.; Li, J.-S.; Chang, M.-W. Porous Yolk-Shell Particle Engineering via Nonsolvent-Assisted Trineedle Coaxial Electrospraying for Burn-Related Wound Healing. ACS Appl. Mater. Interfaces 2019, 11, 7823–7835. [Google Scholar] [CrossRef] [PubMed]
- Mosmann, T. Rapid colorimetric assay for cellular growth and survival: Application to proliferation and cytotoxicity assays. J. Immunol. Methods 1983, 65, 55–63. [Google Scholar] [CrossRef]
- Spanakis, M.; Bouropoulos, N.; Theodoropoulos, D.; Sygellou, L.; Ewart, S.; Moschovi, A.M.; Siokou, A.; Niopas, I.; Kachrimanis, K.; Nikolakis, V.; et al. Controlled release of 5-fluorouracil from microporous zeolites. Nanomed. Nanotechnol. Biol. Med. 2014, 10, 197–205. [Google Scholar] [CrossRef]
- Boateng, J.S.; Matthews, K.H.; Stevens, H.N.E.; Eccleston, G.M. Wound Healing Dressings and Drug Delivery Systems: A Review. J. Pharm. Sci. 2008, 97, 2892–2923. [Google Scholar] [CrossRef]
- Mohamad, N.; Mohd Amin, M.C.I.; Pandey, M.; Ahmad, N.; Rajab, N.F. Bacterial cellulose/acrylic acid hydrogel synthesized via electron beam irradiation: Accelerated burn wound healing in an animal model. Carbohydr. Polym. 2014, 114, 312–320. [Google Scholar] [CrossRef]
- Prateepchanachai, S.; Thakhiew, W.; Devahastin, S.; Soponronnarit, S. Mechanical properties improvement of chitosan films via the use of plasticizer, charge modifying agent and film solution homogenization. Carbohydr. Polym. 2017, 174, 253–261. [Google Scholar] [CrossRef]
- Mengoni, T.; Adrian, M.; Pereira, S.; Santos-Carballal, B.; Kaiser, M.; Goycoolea, F. A Chitosan—Based Liposome Formulation Enhances the In Vitro Wound Healing Efficacy of Substance P Neuropeptide. Pharmaceutics 2017, 9, 56. [Google Scholar] [CrossRef]
- Eleftheriadis, G.K.; Ritzoulis, C.; Bouropoulos, N.; Tzetzis, D.; Andreadis, D.A.; Boetker, J.; Rantanen, J.; Fatouros, D.G. Unidirectional drug release from 3D printed mucoadhesive buccal films using FDM technology: In vitro and ex vivo evaluation. Eur. J. Pharm. Biopharm. 2019, 144, 180–192. [Google Scholar] [CrossRef]


| Run | Variables in Uncoded Unit | P (kPa) | F (%) | S (%) | D (%) | |
|---|---|---|---|---|---|---|
| Manuka honey/pectin (w/v) | Pectin (w/v) | |||||
| 1 | 0.05 | 0.10 | 32 | 5.8 | 230 | 4.0 |
| 2 | 0.00 | 0.15 | 40 | 21.2 | 180 | 8.8 |
| 3 | 0.05 | 0.10 | 33 | 19.1 | 200 | 11.3 |
| 4 | 0.00 | 0.05 | 10 | 28.3 | 600 | 31.8 |
| 5 | 0.10 | 0.15 | 73 | 16.4 | 180 | 4.4 |
| 6 | 0.10 | 0.05 | 9 | 37.1 | 250 | 25.6 |
| 7 | 0.05 | 0.10 | 32 | 15.4 | 240 | 9.1 |
| 8 | 0.12 | 0.10 | 20 | 25.1 | 170 | 11.4 |
| 9 | 0.05 | 0.03 | 10 | 23.9 | 120 | 65.1 |
| 10 | 0.05 | 0.10 | 30 | 28.8 | 240 | 13.0 |
| 11 | 0.00 | 0.10 | 25 | 23.3 | 200 | 7.6 |
| 12 | 0.05 | 0.18 | 134 | 14.5 | 340 | 10.4 |
| 13 | 0.05 | 0.10 | 20 | 16.9 | 190 | 4.4 |
| 14 | 0.05 | 0.10 | 60 | 17.5 | 180 | 6.5 |
| Run | Variables in Uncoded Unit | d (nm) | ζ (mV) | PDI | GAE (μg/mg) | |
|---|---|---|---|---|---|---|
| EEP (%) | Chitosan (%) | |||||
| 1 | 1 | 0 | 760 | −26.8 | 0.35 | 2.57 |
| 2 | 2.5 | 0.5 | 1080 | 61.1 | 0.29 | 3.82 |
| 3 | 0.4 | 0.5 | 1140 | 59.8 | 0.41 | 0.23 |
| 4 | 4.5 | 0.5 | 720 | 60 | 0.42 | 5.07 |
| 5 | 2.5 | 0.5 | 780 | 59.5 | 0.42 | 5.00 |
| 6 | 4 | 1 | 1080 | 55.4 | 0.26 | 2.67 |
| 7 | 2.5 | 0 | 1130 | 44.1 | 0.62 | 4.41 |
| 8 | 4 | 0 | 510 | 32.7 | 0.44 | 7.77 |
| 9 | 2.5 | 0.5 | 850 | 55.6 | 0.37 | 3.35 |
| 10 | 1 | 1 | 1250 | 54.6 | 0.38 | 0.52 |
| 11 | 2.5 | 1 | 1360 | 55.2 | 0.41 | 1.51 |
| 12 | 2.5 | 0.5 | 650 | 59.6 | 0.25 | 5.09 |
| 13 | 2.5 | 0.5 | 750 | 61.2 | 0.31 | 8.8 |
| 14 | 1 | 0 | 760 | −26.8 | 0.35 | 2.57 |
| EEP (%) | Chitosan (%) | Parameter | d (nm) | ζ (mV) | PDI | GAE (μg/mg) |
|---|---|---|---|---|---|---|
| 4.5 | 0.6 | Target Limit | 650–800 | >60 | 0.30–0.35 | 5-10 |
| Theoretical Value | 715 | 65 | 0.33 | 7.9 | ||
| Experimental Value | 715 ± 8 | 62 ± 1.8 | 0.4 ± 0.11 | 5.1 ± 0.2 |
| Manuka Honey/Pectin | Pectin | Parameter | P (kPa) | F (%) | S (%) | D (%) |
|---|---|---|---|---|---|---|
| 0.08 | 0.13 | Target Limit | 30–60 | 15–21 | 160–240 | 0–12 |
| Theoretical Value | 62 | 17 | 204 | 7 | ||
| Experimental Value | 35 ± 4 | 14 ± 5 | 220 ± 16 | 12 ± 8 |
| Formulation | Tensile Strength (N × mm−2) | Elongation (%) | Young Modulus (N × mm−2) |
|---|---|---|---|
| 3DPec | 29.68 ± 3.05 | 1.91 ± 0.08 | 7.76 ± 0.47 |
| 3DPec + 2.5% CCP | 49.62 ± 1.71 | 2.72 ± 0.22 | 9.14 ± 0.43 |
| 3DPec + 5% CCP | 43.65 ± 2.23 | 2.35 ± 0.03 | 9.28 ± 0.36 |
| 3DPec + 10% CCP | 36.96 ± 2.79 | 1.91 ± 0.06 | 9.67 ± 0.43 |
| 3DPec + 20% CCP | 35.62 ± 1.62 | 1.63 ± 0.13 | 10.95 ± 0.38 |
| 3DPec + 30% CCP | 36.31 ± 3.22 | 1.59 ± 0.11 | 11.41 ± 0.22 |
| Formulation | Conditions | Fmax (N) | Wad × 10 (N × mm) |
|---|---|---|---|
| 3DPec | Dry | 0.05 ± 0.03 | 0.07 ± 0.04 |
| Wet | 0.48 ± 0.10 | 0.68 ± 0.13 | |
| Ink | 1.29 ± 0.11 | 3.44 ± 0.21 | |
| 3DPec + 2.5% CCP | Dry | 0.06 ± 0.02 | 0.13 ± 0.03 |
| Wet | 0.85 ± 0.15 | 1.48 ± 0.34 | |
| Ink | 1.39 ± 0.08 | 5.38 ± 0.42 | |
| 3DPec + 5% CCP | Dry | 0.14 ± 0.07 | 0.52 ± 0.11 |
| Wet | 1.59 ± 0.11 | 5.67 ± 0.37 | |
| Ink | |||
| 3DPec + 10% CCP | Dry | 0.17 ± 0.04 | 0.64 ± 0.14 |
| Wet | 1.04 ± 0.09 | 2.28 ± 0.24 | |
| Ink | 1.47 ± 0.09 | 5.27 ± 0.32 | |
| 3DPec + 20% CCP | Dry | 0.26 ± 0.03 | 0.99 ± 0.16 |
| Wet | 2.88 ± 0.14 | 6.43 ± 0.28 | |
| Ink | 3.66 ± 0.15 | 8.79 ± 0.35 | |
| 3DPec + 30% CCP | Dry | 0.17 ± 0.12 | 0.32 ± 0.19 |
| Wet | 1.38 ± 0.25 | 2.76 ± 0.54 | |
| Ink | 2.04 ± 0.33 | 6.16 ± 0.98 |
© 2020 by the authors. Licensee MDPI, Basel, Switzerland. This article is an open access article distributed under the terms and conditions of the Creative Commons Attribution (CC BY) license (http://creativecommons.org/licenses/by/4.0/).
Share and Cite
Andriotis, E.G.; Eleftheriadis, G.K.; Karavasili, C.; Fatouros, D.G. Development of Bio-Active Patches Based on Pectin for the Treatment of Ulcers and Wounds Using 3D-Bioprinting Technology. Pharmaceutics 2020, 12, 56. https://doi.org/10.3390/pharmaceutics12010056
Andriotis EG, Eleftheriadis GK, Karavasili C, Fatouros DG. Development of Bio-Active Patches Based on Pectin for the Treatment of Ulcers and Wounds Using 3D-Bioprinting Technology. Pharmaceutics. 2020; 12(1):56. https://doi.org/10.3390/pharmaceutics12010056
Chicago/Turabian StyleAndriotis, Eleftherios G., Georgios K. Eleftheriadis, Christina Karavasili, and Dimitrios G. Fatouros. 2020. "Development of Bio-Active Patches Based on Pectin for the Treatment of Ulcers and Wounds Using 3D-Bioprinting Technology" Pharmaceutics 12, no. 1: 56. https://doi.org/10.3390/pharmaceutics12010056
APA StyleAndriotis, E. G., Eleftheriadis, G. K., Karavasili, C., & Fatouros, D. G. (2020). Development of Bio-Active Patches Based on Pectin for the Treatment of Ulcers and Wounds Using 3D-Bioprinting Technology. Pharmaceutics, 12(1), 56. https://doi.org/10.3390/pharmaceutics12010056