Franz Diffusion Cell Approach for Pre-Formulation Characterisation of Ketoprofen Semi-Solid Dosage Forms

 , ,
, ,
Abstract
:
1. Introduction
2. Material and Methods
2.1. Materials
2.2. Preparation of Buffer Solutions
2.3. Preparation of Ketoprofen (KTP) Semi-Solid Formulations
2.4. Methods
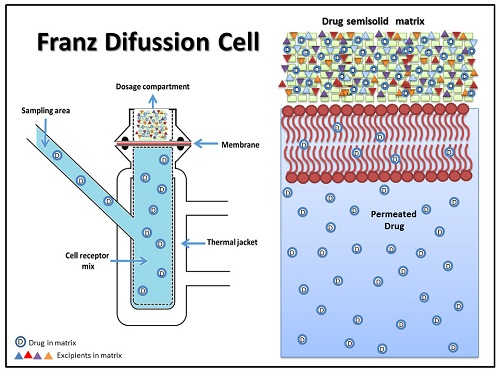
2.4.1. Determination of KTP Permeation
2.4.2. Quantification of KTP
2.4.3. Kinetic Study of the KTP Permeation
- (i)
- The zero-order model: This model is widely used for pharmaceutical dosage systems that do not disintegrate and have a very slow drug release. Furthermore, this model assumes that the area of the tablet does not change significantly and material balance conditions are not formed. This model is expressed by the equation:where Qt is the amount of dissolved drug at time t, Q0 is the initial amount of drug in the solution (most of cases Q0 = 0) and k0 corresponds to the constant of zero-order release [23].
- (ii)
- The first-order model: This model is commonly used to describe the absorption and release of water soluble drugs from porous matrices. This model can be expressed by the equation:where Qt is the amount of dissolved drug at time t, Q0 is the initial amount of drug in the solution and k1 corresponds to the constant of first-order release [24].
- (iii)
- The Higuchi model: This model is widely used to describe the release of soluble and sparingly soluble drugs in aqueous media, from various semi-solid and/or solid matrices according to the equation:where kH is the Higuchi dissolution constant, whereas Qt and t correspond to the parameters described previously [25,26].
- (iv)
- The Korsmeyer-Peppas model: This is a generalised model of the Higuchi equation that allows one to explain drug delivery mechanisms where erosion and/or dissolution of the matrix occurs. This model has been widely used to describe the drug release from polymer systems. The related equation is:where Mt/M∞ corresponds to the fraction of drug released at time t; kr is the release constant which is characteristic for the polymer–drug interactions, whereas n is the diffusion exponent that is characteristic for the release mechanism. When n equals 0.5, the equation becomes equal to the Higuchi model, indicating that the release mechanism is of a Fickian type (case I), whereas values of n between 0.5 and 1.0 suggest that the release mechanism corresponds to an anomalous (non-Fickian) transport. Values of 1.0 indicate that the release mechanism is similar to a zero-order release, whereas values of n greater than 1.0 (Super Case II transport) suggest a drug release process dependent on the relaxation of the polymer chains in the matrix, passing from a vitreous state (lower kinetic movement and increased potential energy) to a relaxed state rubber type (high kinetic movement and lower potential energy) [22,27].
2.5. Data Processing and Analysis
3. Results and Discussion
3.1. Quantification of KTP
3.2. Characterisation of KTP Matrix
3.3. Determination of KTP Permeation
3.4. Kinetic Study of the KTP Permeation
4. Conclusions
Author Contributions
Funding
Acknowledgments
Conflicts of Interest
References
- Bharate, S.S.; Vishwakarma, R.A. Impact of preformulation on drug development. Expert Opin. Drug Deliv. 2013, 10, 1239–1257. [Google Scholar] [CrossRef] [PubMed]
- Robinson, K.; Mock, C.; Liang, D. Pre-formulation studies of resveratrol. Drug Dev. Ind. Pharm. 2015, 41, 1464–1469. [Google Scholar] [CrossRef] [PubMed]
- Khengar, R.H.; Jones, S.A.; Turner, R.B.; Forbes, B.; Brown, M.B. Nail swelling as a pre-formulation screen for the selection and optimisation of ungual penetration enhancers. Pharm. Res. 2007, 24, 2207–2212. [Google Scholar] [CrossRef] [PubMed]
- Dahan, A.; Miller, J.M. The Solubility–Permeability Interplay and Its Implications in Formulation Design and Development for Poorly Soluble Drugs. AAPS J. 2012, 14, 244–251. [Google Scholar] [CrossRef] [PubMed] [Green Version]
- Simon, A.; Amaro, M.I.; Healy, A.M.; Cabral, L.M.; de Sousa, V.P. Comparative evaluation of rivastigmine permeation from a transdermal system in the Franz cell using synthetic membranes and pig ear skin with in vivo-in vitro correlation. Int. J. Pharm. 2016, 512, 234–241. [Google Scholar] [CrossRef] [PubMed] [Green Version]
- Kulkarni, K.N.; Datta-Gupta, A. Estimating Relative Permeability From Production Data: A Streamline Approach. SPE J. 2000, 5, 402–411. [Google Scholar] [CrossRef]
- Papich, M.G. Pharmacologic considerations for opiate analgesic and nonsteroidal anti-inflammatory drugs. Vet. Clin. N. Am. Small Anim. Pract. 2000, 30, 815–837. [Google Scholar] [CrossRef]
- Moses, V.S.; Bertone, A.L. Nonsteroidal anti-inflammatory drugs. Vet. Clin. N. Am. Equine Pract. 2002, 18, 21–37. [Google Scholar] [CrossRef]
- Dugowson, E.C.; Gnanashanmugam, P. Nonsteroidal Anti-Inflammatory Drugs. Phys. Med. Rehabil. 2006, 17, 347–354. [Google Scholar] [CrossRef] [PubMed]
- Ejaz, P.; Bhojani, K.; Joshi, V.R. NSAIDs and kidney. J. Assoc. Physicians India 2004, 52, 632–640. [Google Scholar] [PubMed]
- Pattanittum, P.; Turner, T.; Green, S.; Buchbinder, R. Non-steroidal anti-inflammatory drugs (NSAIDs) for treating lateral elbow pain in adults. Cochrane Database Syst. Rev. 2013. [Google Scholar] [CrossRef] [PubMed] [Green Version]
- Crofford, L.J. Use of NSAIDs in treating patients with arthritis. Arthritis Res. Ther. 2013, 15 (Suppl. 3), S2. [Google Scholar] [CrossRef] [PubMed]
- Blikslager, A.; Jones, S. NSAIDs. J. Equine Vet. Sci. 2005, 25, 98–102. [Google Scholar] [CrossRef]
- Massey, T.; Derry, S.; Moore, R.A.; Wiffen, P.J.; McQuay, H.J.; Moore, M. Topical NSAIDs for acute pain in adults. Cochrane Database Syst. Rev. 2008. [Google Scholar] [CrossRef]
- Heyneman, C.A.; Lawless-Liday, C.; Wall, G.C. Oral versus Topical NSAIDs in Rheumatic Diseases. Drugs 2000, 60, 555–574. [Google Scholar] [CrossRef] [PubMed]
- Sawynok, J. Topical Analgesics. In Clinical Pain Management: A Practical Guide; Lynch, M.E., Ed.; Wiley-Blackwell: Toronto, ON, Canada, 2010; pp. 135–141. ISBN 9781444330694. [Google Scholar]
- Cirri, M.; Bragagni, M.; Mennini, N.; Mura, P. Development of a new delivery system consisting in “drug—In cyclodextrin—In nanostructured lipid carriers” for ketoprofen topical delivery. Eur. J. Pharm. Biopharm. 2012, 80, 46–53. [Google Scholar] [CrossRef] [PubMed]
- Hachem, J.P.; Crumrine, D.; Fluhr, J.; Brown, B.E.; Feingold, K.R.; Elias, P.M. pH directly regulates epidermal permeability barrier homeostasis, and stratum corneum integrity/cohesion. J. Investig. Dermatol. 2003, 121, 345–353. [Google Scholar] [CrossRef] [PubMed]
- Gad, S.C. United States Pharmacopoeia (USP). In Encyclopedia of Toxicology, 3rd ed.; Wexler, P., Ed.; Academic Press: Oxford, UK, 2014; pp. 881–882. ISBN 978-0-12-386455-0. [Google Scholar]
- Uchida, T.; Kadhum, W.; Kanai, S.; Oshizaka, T.; Todo, H.; Sugibayashi, K. Prediction of skin permeation by chemical compounds using the artificial membrane, Strat-MTM. Eur. J. Pharm. Sci. 2015, 67, 113–118. [Google Scholar] [CrossRef] [PubMed] [Green Version]
- Costa, P.; Sousa Lobo, J.M. Modeling and comparison of dissolution profiles. Eur. J. Pharm. Sci. 2001, 13, 123–133. [Google Scholar] [CrossRef]
- Yarce, C.; Pineda, D.; Correa, C.; Salamanca, C. Relationship between Surface Properties and In Vitro Drug Release from a Compressed Matrix Containing an Amphiphilic Polymer Material. Pharmaceuticals 2016, 9, 34. [Google Scholar] [CrossRef] [PubMed]
- Varelas, C.G.; Dixon, D.G.; Steiner, C.A. Zero-order release from biphasic polymer hydrogels. J. Control. Release 1995, 34, 185–192. [Google Scholar] [CrossRef]
- Bruschi, M.L. Mathematical models of drug release. Strategies to Modify the Drug Release from Pharmaceutical Systems; Woodhead Publishing: Cambridge, UK, 2015; pp. 63–86. [Google Scholar] [CrossRef]
- Siepmann, J.; Peppas, N.A. Higuchi equation: Derivation, applications, use and misuse. Int. J. Pharm. 2011, 418, 6–12. [Google Scholar] [CrossRef] [PubMed]
- Cruz, L.; Soares, L.U.; Costa, T.D.; Mezzalira, G.; Da Silveira, N.P.; Guterres, S.S.; Pohlmann, A.R. Diffusion and mathematical modeling of release profiles from nanocarriers. Int. J. Pharm. 2006, 313, 198–205. [Google Scholar] [CrossRef] [PubMed]
- Korsmeyer, R.W.; Gurny, R.; Doelker, E.; Buri, P.; Peppas, N.A. Mechanisms of solute release from porous hydrophilic polymers. Int. J. Pharm. 1983, 15, 25–35. [Google Scholar] [CrossRef]
- Liebenberg, W.; Engelbrecht, E.; Wessels, A.; Devarakonda, B.; Yang, W.; De Villiers, M.M. A comparative study of the release of active ingredients from semisolid cosmeceuticals measured with Franz, enhancer or flow-through cell diffusion apparatus. J. Food Drug Anal. 2004, 12, 19–28. [Google Scholar]
- Jung, Y.J.; Yoon, J.H.; Kang, N.G.; Park, S.G.; Jeong, S.H. Diffusion properties of different compounds across various synthetic membranes using Franz-type diffusion cells. J. Pharm. Investig. 2012, 42, 271–277. [Google Scholar] [CrossRef]
- Baert, B.; Boonen, J.; Burvenich, C.; Roche, N.; Stillaert, F.; Blondeel, P.; van Bocxlaer, J.; de Spiegeleer, B. A new discriminative criterion for the development of franz diffusion tests for transdermal pharmaceuticals. J. Pharm. Pharm. Sci. 2010, 13, 218–230. [Google Scholar] [CrossRef] [PubMed]
- Vlachou, M.D.; Rekkas, D.M.; Dallas, P.P.; Choulis, N.H. Development and in vitro evaluation of griseofulvin gels using Franz diffusion cells. Int. J. Pharm. 1992, 82, 47–52. [Google Scholar] [CrossRef]
- Akhgari, A.; Abbaspour, M.R.; Rezaee, S.; Kuchak, A. Evaluation of the swelling, erosion and drug release from polysaccharide matrix tablets based on pectin and inulin. Jundishapur J. Nat. Pharm. Prod. 2011, 6, 51–58. [Google Scholar]
- Sriamornsak, P.; Thirawong, N.; Korkerd, K. Swelling, erosion and release behavior of alginate-based matrix tablets. Eur. J. Pharm. Biopharm. 2007, 66, 435–450. [Google Scholar] [CrossRef] [PubMed]
- Pandey, H.; Parashar, V.; Parashar, R.; Prakash, R.; Ramteke, P.W.; Pandey, A.C. Controlled drug release characteristics and enhanced antibacterial effect of graphene nanosheets containing gentamicin sulfate. Nanoscale 2011, 3, 4104–4108. [Google Scholar] [CrossRef] [PubMed]
 = Cell C. pH: 7.4.
= Cell C. pH: 7.4.
= Cell C. pH: 7.4.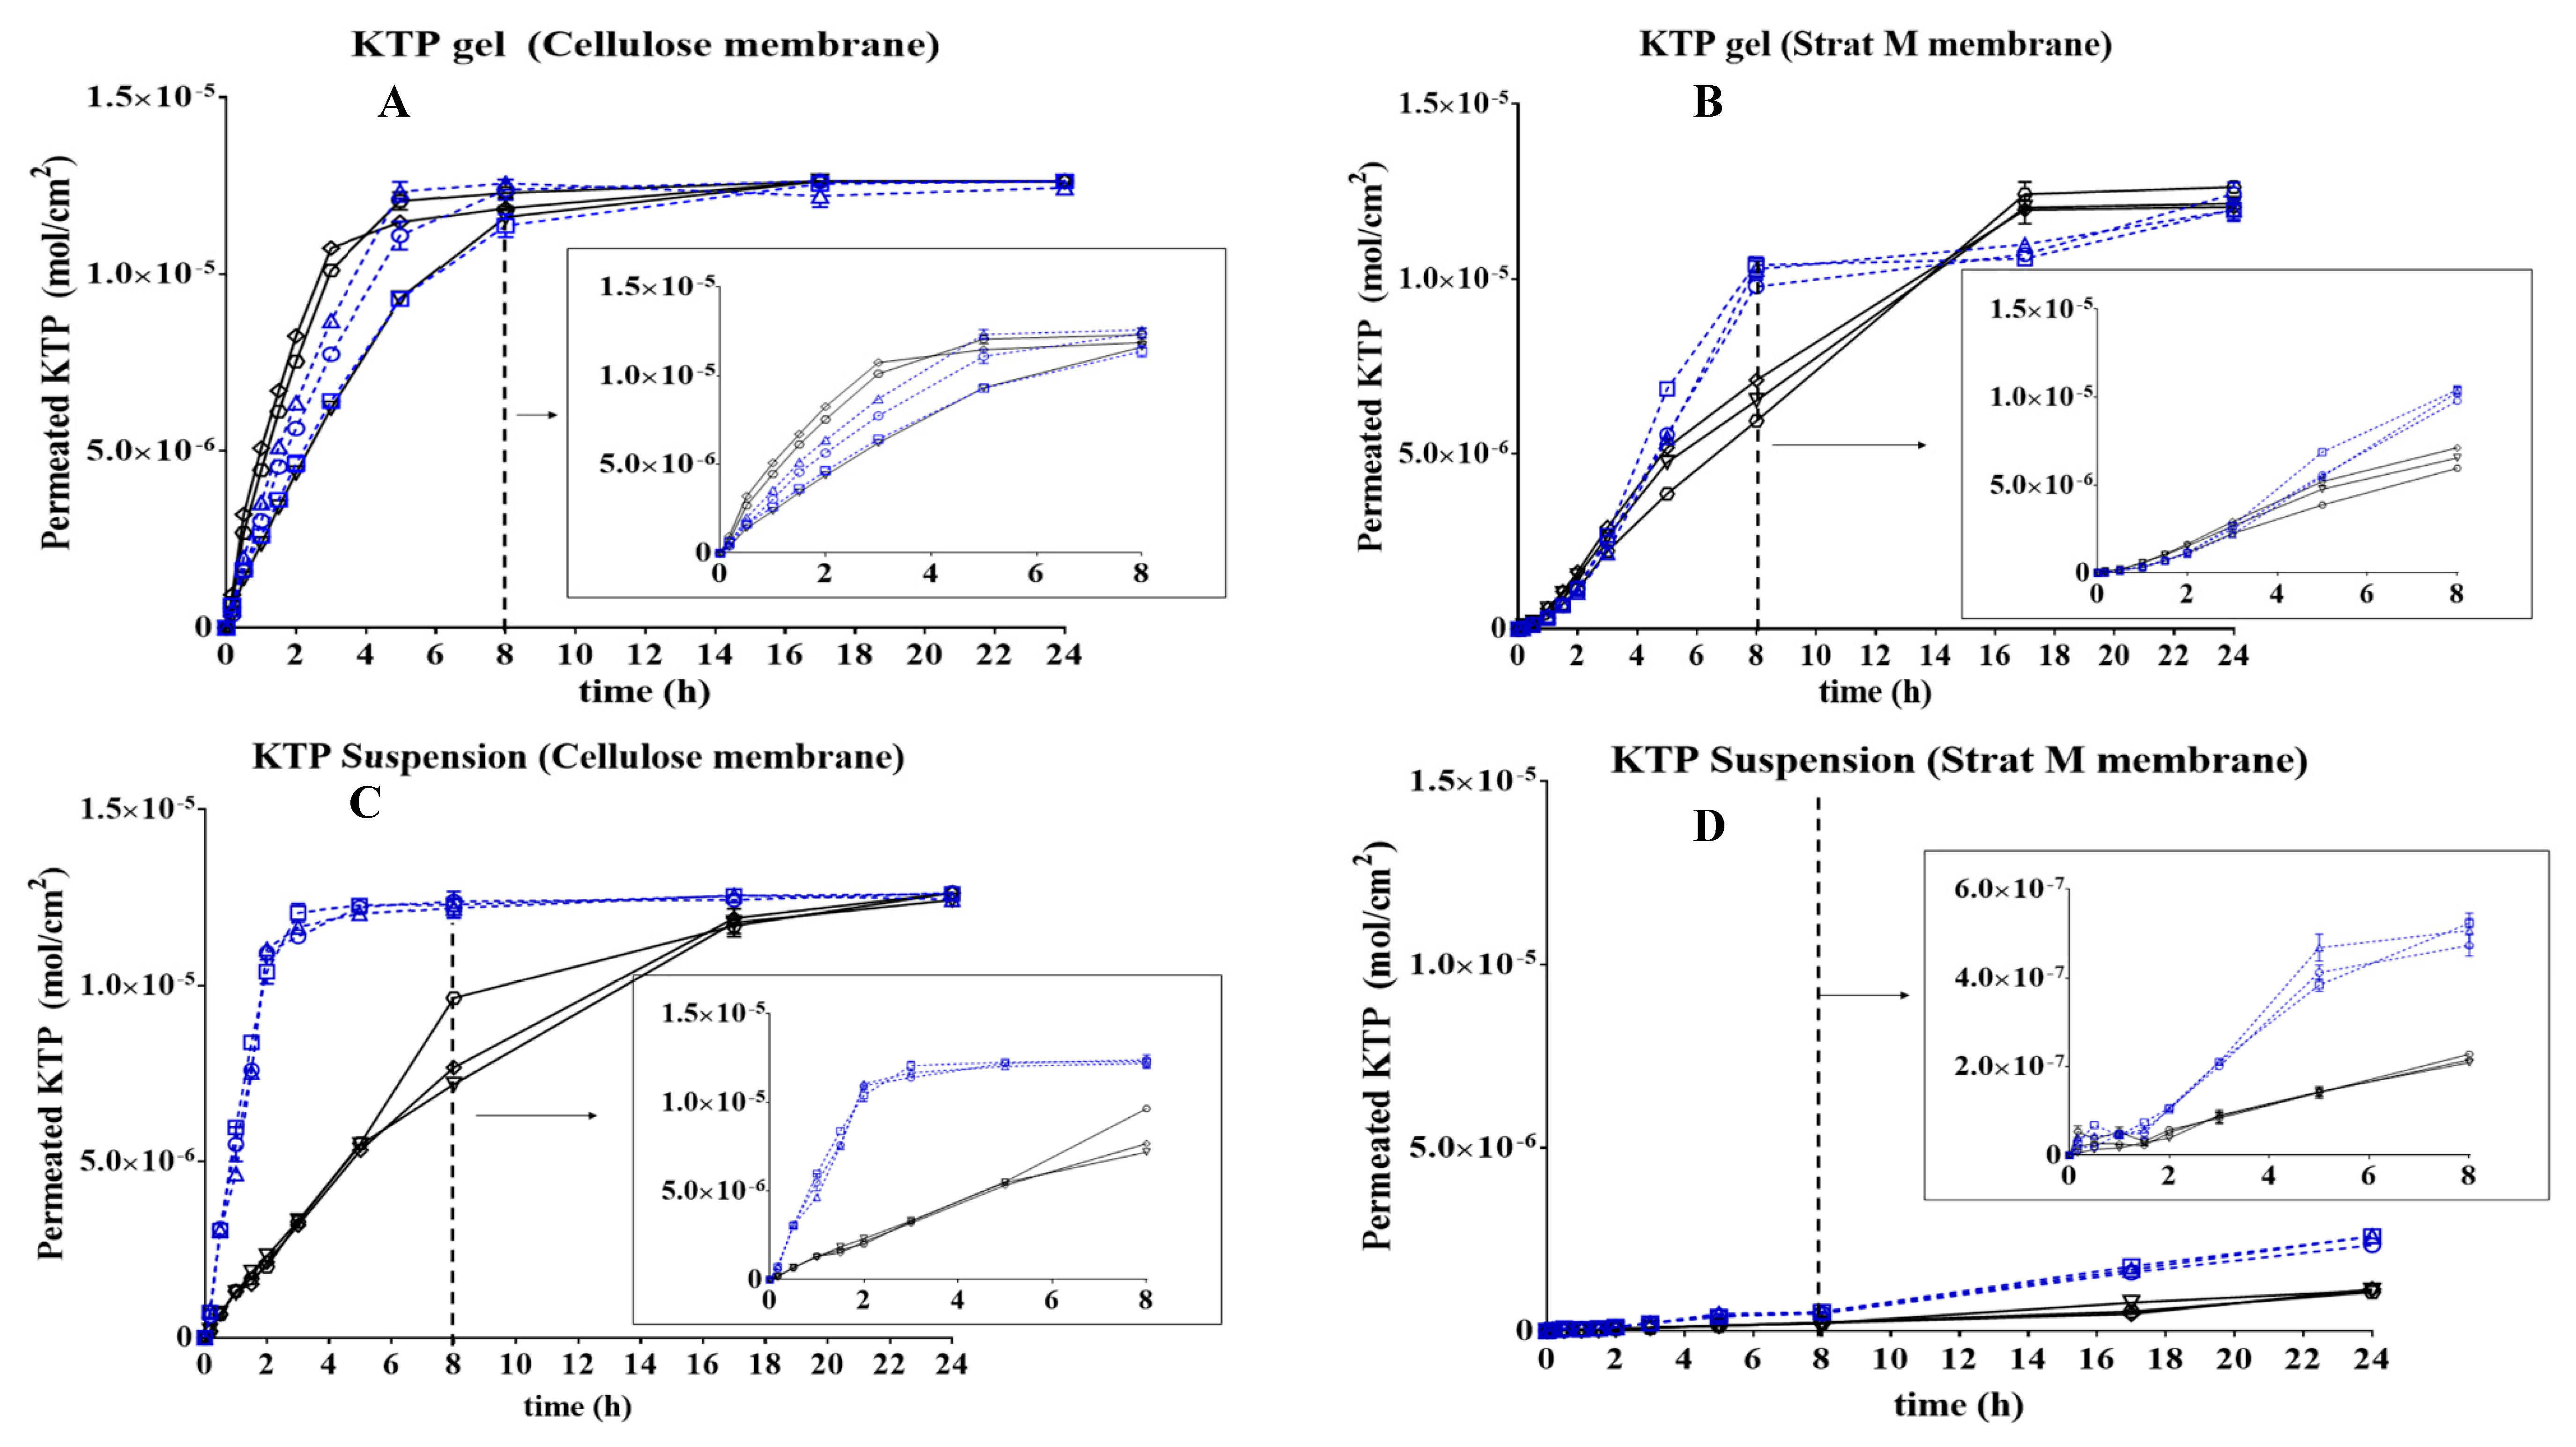

| Medium | Linearity | |
|---|---|---|
| Linear Equations | R2 | |
| Buffer pH 7.4 | y = 0.0623x − 0.0016 | R2 = 0.9999 |
| Buffer pH 5.6 | y = 0.0635x + 0.0038 | R2 = 0.9999 |
| Matrix of KTP | Zeta Potential (mV) | Conductivity (µS/cm) | pH | Viscosity (Cp) |
|---|---|---|---|---|
| Gel | −33.4 | 962.6 | 6.8 | 35033 |
| Simple Suspensión | −20.2 | 465.6 | 6.8 | 36.4 |
| Matrix of KTP | Permeation Parameters | Conditions | |||||
|---|---|---|---|---|---|---|---|
| Media pH: 5.6 | Media pH: 7.4 | ||||||
| Cell A | Cell B | Cell C | Cell A | Cell B | Cell C | ||
| Gel | Cellulose membrane | ||||||
| Flux (mol/cm2 h) × 104 | 2.68 ± 0.08 | 2.53 ± 00.9 | 2.71 ± 0.01 | 2.54 ± 0.03 | 2.75 ± 0.08 | 2.77 ± 0.01 | |
| Lag-time (h) | 0.04 | 0.013 | 0.007 | 0.12 | 0.107 | 0.119 | |
| Strat-M membrane | |||||||
| Flux (mol/cm2 h) × 104 | 2.07 ± 0.08 | 2.12 ± 0.08 | 2.10 ± 0.08 | 1.96 ± 0.03 | 2.00 ± 0.09 | 1.94 ± 0.01 | |
| Lag-time (h) | 0.012 | 0.056 | 0.055 | 0.433 | 0.457 | 0.179 | |
| Simple suspension | Cellulose membrane | ||||||
| Flux (mol/cm2 h) × 104 | 2.82 ± 0.04 | 2.83 ± 0.10 | 2.81 ± 0.07 | 2.03 ± 0.12 | 2.07 ± 0.05 | 2.18 ± 0.07 | |
| Lag-time (h) | 0.108 | 0.101 | 0.109 | 0.126 | 0.130 | 0.142 | |
| Strat-M membrane | |||||||
| Flux (mol/cm2 h) × 104 | 0.25 ± 0.03 | 0.27 ± 0.01 | 0.27 ± 0.01 | 0.18 ± 0.01 | 0.10 ± 0.02 | 0.10 ± 0.03 | |
| Lag-time (h) | 0.298 | 0.221 | 0.225 | 0.324 | 0.329 | 0.382 | |
| Formulation | pH of the Medium | Membrane | Zero Order | First Order | Higuchi | Korsmeyer-Peppas | |||||
|---|---|---|---|---|---|---|---|---|---|---|---|
| k0 | R2 | k1 | R2 | kH | R2 | kr | N | R2 | |||
| Gel | 5.6 | Celullose | 7.55 × 10⁻⁹ | 0.648 | 7.55 × 10⁻¹¹ | 0.647 | 4.01 × 10⁻⁷ | 0.886 | 2.02 × 10⁻⁷ | 0.640 | 0.894 |
| Strat-M | 9.13 × 10⁻⁹ | 0.799 | 9.13 × 10⁻¹¹ | 0.835 | 4.08 × 10⁻⁷ | 0.897 | 1.24 × 10⁻⁹ | 1.380 | 0.945 | ||
| 7.4 | Celullose | 9.40 × 10⁻⁹ | 0.607 | 9.40 × 10⁻¹¹ | 0.607 | 4.01 × 10⁻⁷ | 0.784 | 3.40 × 10⁻⁷ | 0.565 | 0.864 | |
| Strat-M | 9.47 × 10⁻⁹ | 0.929 | 9.47 × 10⁻¹¹ | 0.929 | 4.09 × 10⁻⁷ | 0.971 | 5.86 × 10⁻⁹ | 1.110 | 0.976 | ||
| Suspension | 5.6 | Celullose | 5.51 × 10⁻⁹ | 0.450 | 5.50 × 10⁻¹¹ | 0.450 | 4.05 × 10⁻⁷ | 0.748 | 5.11 × 10⁻⁷ | 0.52 | 0.745 |
| Strat-M | 1.75 × 10⁻⁹ | 0.993 | 1.74 × 10⁻¹¹ | 0.991 | 7.06 × 10⁻⁸ | 0.910 | 1.39 × 10⁻⁹ | 0.981 | 0.928 | ||
| 7.4 | Celullose | 9.73 × 10⁻⁹ | 0.908 | 9.73 × 10⁻¹¹ | 0.907 | 3.56 × 10⁻⁷ | 0.973 | 3.48 × 10⁻⁸ | 0.857 | 0.978 | |
| Strat-M | 7.17 × 10⁻¹⁰ | 0.971 | 7.17 × 10⁻¹² | 0.972 | 2.86 × 10⁻⁸ | 0.866 | 1.57 × 10⁻⁹ | 0.814 | 0.854 | ||
© 2018 by the authors. Licensee MDPI, Basel, Switzerland. This article is an open access article distributed under the terms and conditions of the Creative Commons Attribution (CC BY) license (http://creativecommons.org/licenses/by/4.0/).
Share and Cite
Salamanca, C.H.; Barrera-Ocampo, A.; Lasso, J.C.; Camacho, N.; Yarce, C.J. Franz Diffusion Cell Approach for Pre-Formulation Characterisation of Ketoprofen Semi-Solid Dosage Forms. Pharmaceutics 2018, 10, 148. https://doi.org/10.3390/pharmaceutics10030148
Salamanca CH, Barrera-Ocampo A, Lasso JC, Camacho N, Yarce CJ. Franz Diffusion Cell Approach for Pre-Formulation Characterisation of Ketoprofen Semi-Solid Dosage Forms. Pharmaceutics. 2018; 10(3):148. https://doi.org/10.3390/pharmaceutics10030148
Chicago/Turabian StyleSalamanca, Constain H., Alvaro Barrera-Ocampo, Juan C. Lasso, Nathalia Camacho, and Cristhian J. Yarce. 2018. "Franz Diffusion Cell Approach for Pre-Formulation Characterisation of Ketoprofen Semi-Solid Dosage Forms" Pharmaceutics 10, no. 3: 148. https://doi.org/10.3390/pharmaceutics10030148
APA StyleSalamanca, C. H., Barrera-Ocampo, A., Lasso, J. C., Camacho, N., & Yarce, C. J. (2018). Franz Diffusion Cell Approach for Pre-Formulation Characterisation of Ketoprofen Semi-Solid Dosage Forms. Pharmaceutics, 10(3), 148. https://doi.org/10.3390/pharmaceutics10030148