Results and Discussion
Ibuprofen exists as a colourless crystalline solid with no reported polymorphs: it is a weakly acidic, implying low aqueous solubility in acidic pH media (water solubility: 0.05 mg/mL at 25°C) [
22]. For the present research it was formulated with isomalt, an artificial sugar substitute, formed by an equimolecular mixture of 1-O-alpha -D- glucopyranosyl-D-mannitol di-hydrate (GPM) and 6-O-alpha -D- glucopyranosyl-D-sorbitol (GPS). This excipient is stable to heating and melts at a temperature between 145 and 150°C. Tablets of the ibuprofen/isomalt systems were prepared under traditional as well as ultrasound-assisted compaction to explore the differences obtained with these processes. Tablets were examined as particulate after crushing and
in toto by a variety of analytical techniques, such DSC, TGA, micro-FT-IR and Raman, and SEM to evidence the effect of ultrasound compaction.
Thermal analysis –A preliminary thermal analysis of the ibuprofen/hydrate isomalt revealed that both endotherms of ibuprofen melting and isomalt dehydration partially overlap, thus preventing reliable measurements of thermal parameters of the systems. As a consequence isomalt was previously dehydrated, by heating in oven, and only the results for the systems containing de-hydrated isomalt were reported.
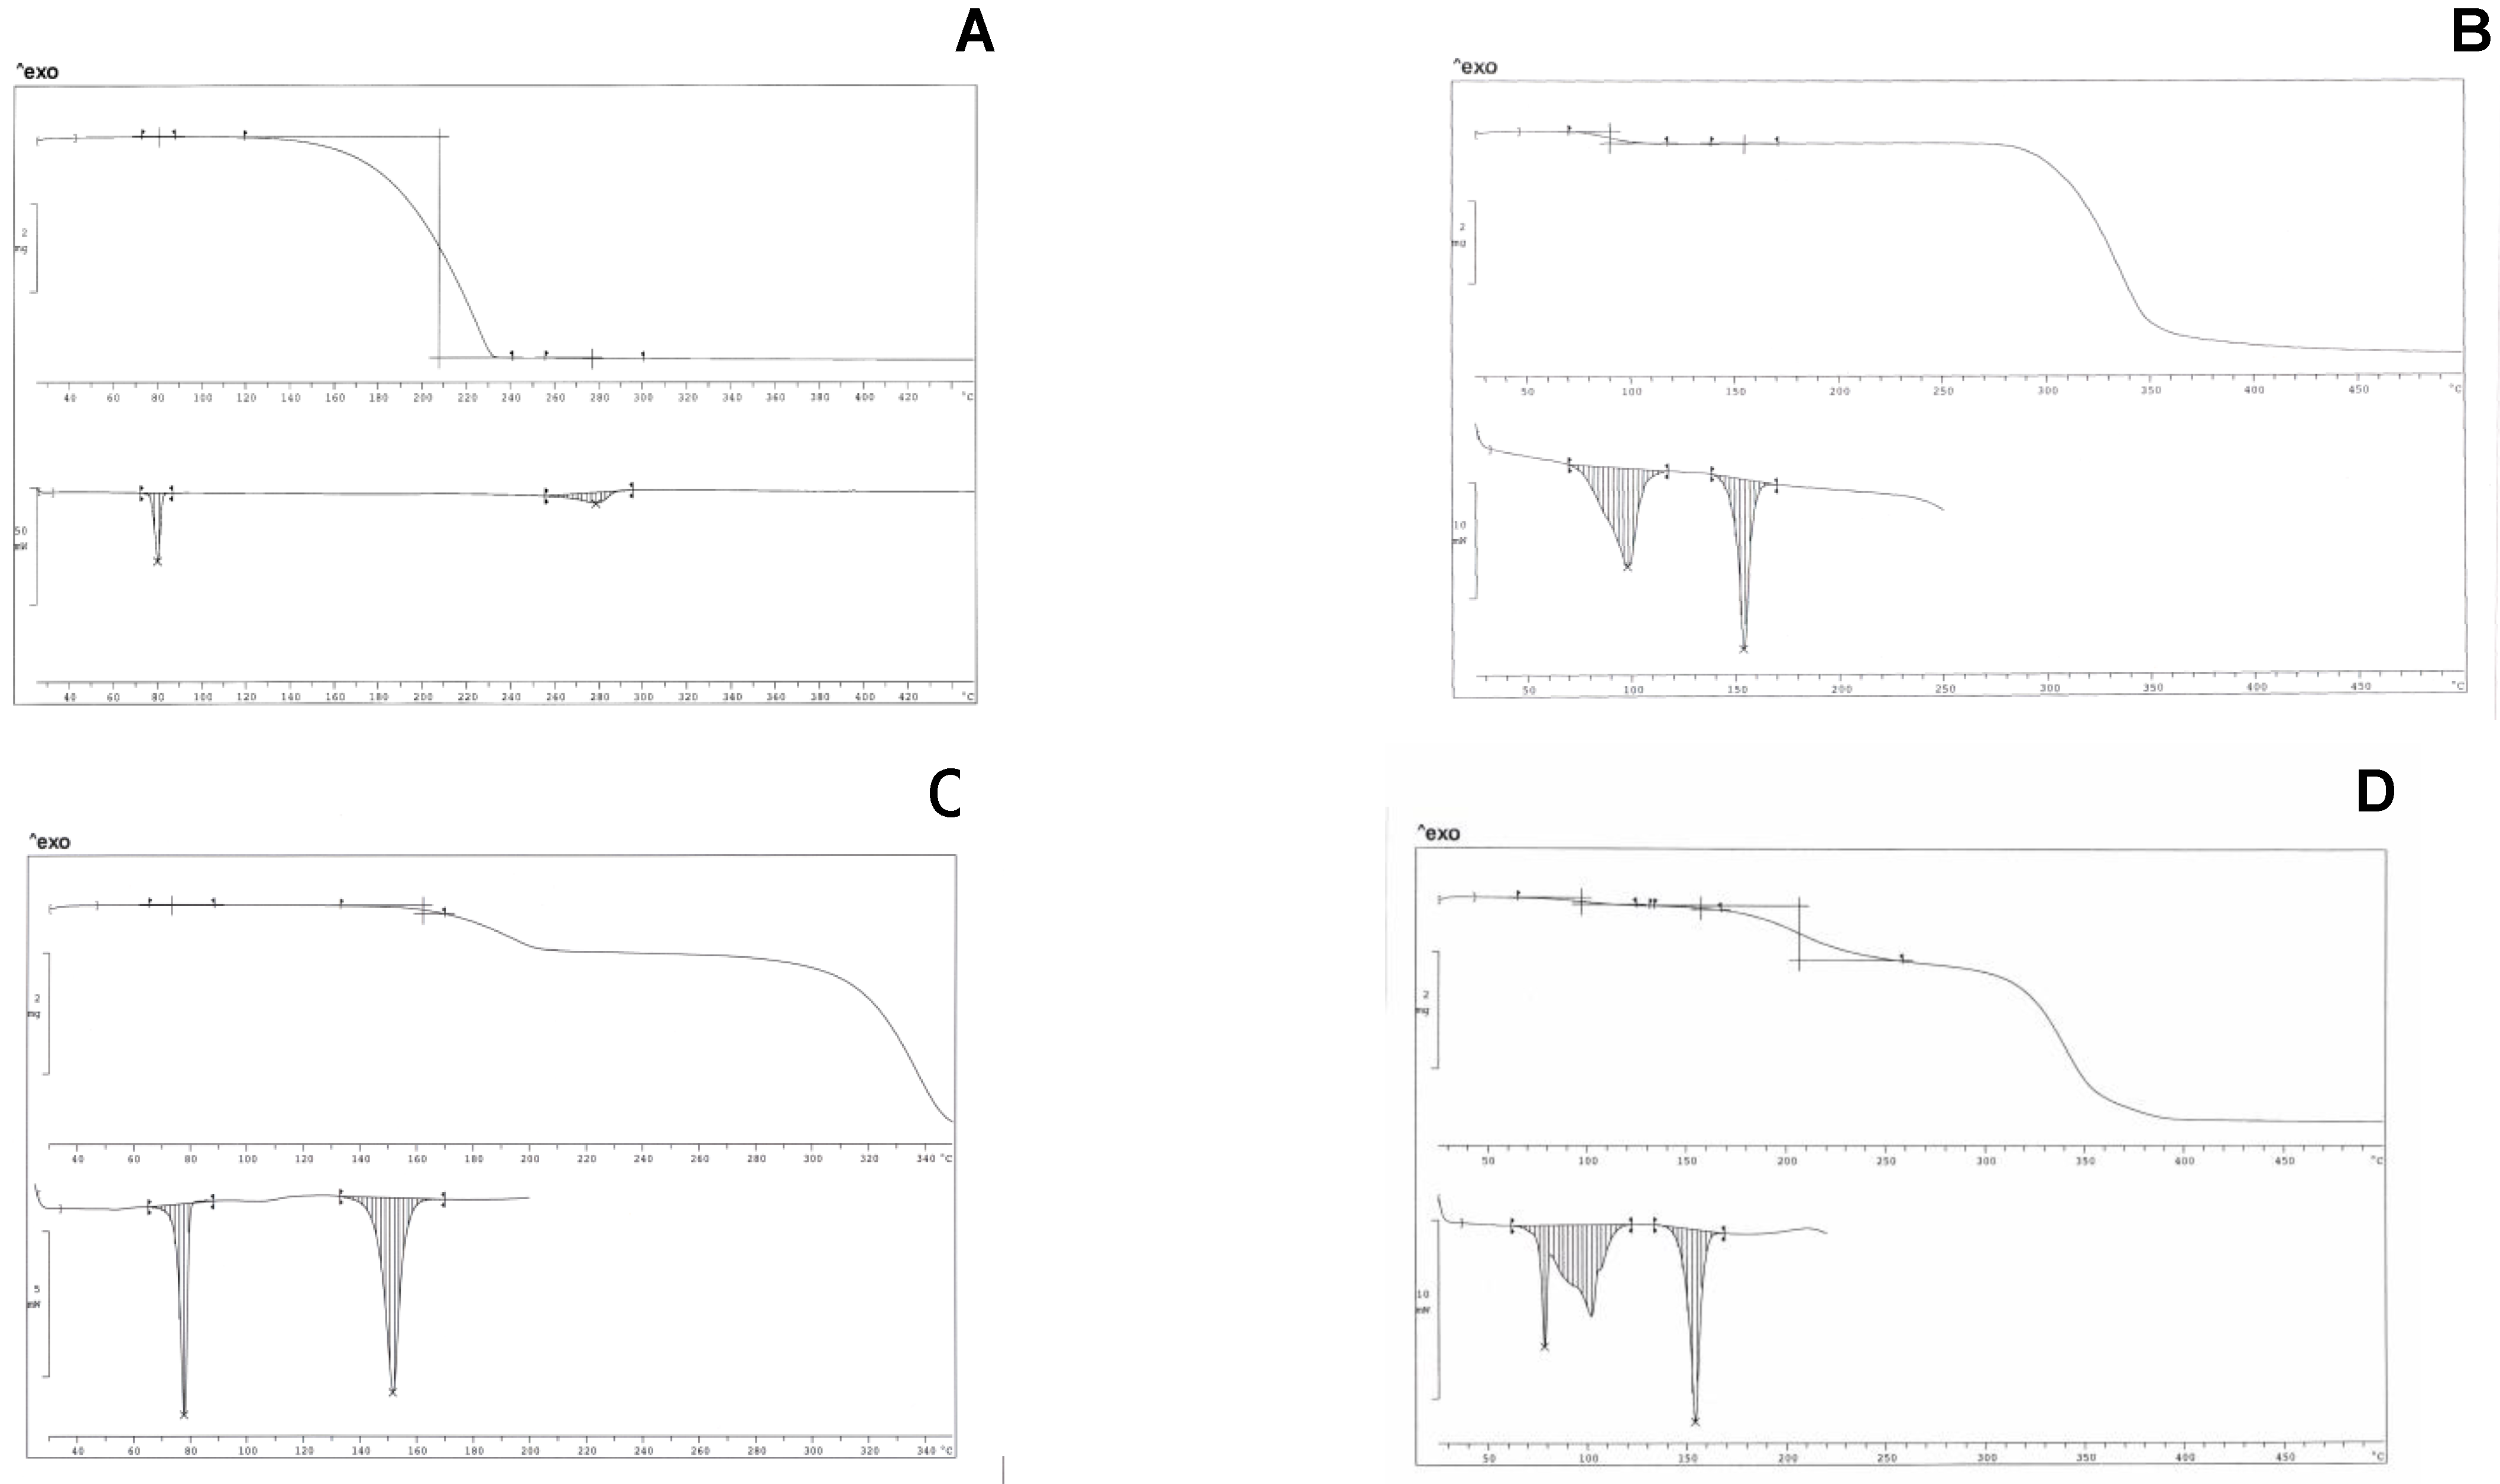
Figure 1 A-D show TGA and DSC thermogram profiles for the pure components and for two mixtures containing ibuprofen with hydrate and de-hydrated isomalt.
Ibuprofen is a pure crystalline material: the DSC trace of pure ibuprofen exhibits a symmetric melting endotherm at 78°C (ΔH = 125±5 Jg-1).
Figure 1.
TGA profiles (above) and DSC thermograms (below). A – ibuprofen; B – hydrate isomalt; C – ibuprofen (10% w/w) and de-hydrated isomalt mixture; D - ibuprofen (10% w/w) and hydrate isomalt mixture.
Figure 1.
TGA profiles (above) and DSC thermograms (below). A – ibuprofen; B – hydrate isomalt; C – ibuprofen (10% w/w) and de-hydrated isomalt mixture; D - ibuprofen (10% w/w) and hydrate isomalt mixture.
TGA does not indicate loss of weight in the melting temperature range, suggesting that the drug is not hydrated or solvated. Above the melting temperature, starting from 110°C up to about 230°C, a massive loss of weight (>98%) can be observed in TGA profile, probably related to its evaporation, not associated however to any (endo/exo) thermal peak in thermogram in the same temperature range; only an asymmetric endothermic peak (ΔH = 94±10 Jg
-1) is present in the thermogram in the range 260-80°C (
Figure 1 A).
Isomalt actually is an equimolar mixture of two stereoisomers (glucopyranosyl mannitol – bi-hydrate: GPM.2H2O and glucopyranosyl sorbitol, GPS) [
23,
24]. Thermogram of pure isomalt shows two endotherms (
Figure 1 B). The first one at 97.5°C (peak temperature), associated to a loss of weight (4.93% in the temperature range 70-130°C, that is one water molecule for one isomalt molecule) is broad and asymmetric and can be attributed to GPM dehydration: the high ΔH = 160±10 Jg
-1 associated to dehydration suggests the existence of strong interactions between the water crystallization molecules and the high number of hydroxy groups present in the excipient molecules: this endotherm decreases its area under the peak after heating in oven at 70°C and shifts to lower temperature its peak, disappearing after a two-day heating at this temperature. The second endotherm, more symmetric and narrow, is related to the melting of the sugar drug (153°C, ΔH = 127±10 Jg
-1). This endotherm decreases its area under the peak of about 10% when measured for the hydrate sample, suggesting that dehydration leaves the solid mass partially amorphous. Dehydration at slow rate (heating in oven at 70°C) allows complete recover of crystallinity. On heating, isomalt is stable up to about 250°C; after dehydration isomalt tends to absorb humidity from air, in the absence of any protection.
When the ibuprofen/isomalt physical mixtures at different compositions are considered, it is possible to appreciate in the thermogram (30-450°C) the presence of only two endotherms, whose identification was attributed by comparison with thermograms of pure compounds. The first endotherm (centred at 78°C) has an area under the peak increasing at increasing ibuprofen concentration that can be attributed to the melting of the drug; the second one is related to melting (centred at 153°C) of de-hydrated isomalt. A third endotherm, irregular and broad (~280°C), related to the evaporation of ibuprofen, is usually present in thermograms: since for further tests temperature scanning was limited to the range 30-200°C, this last endotherm was not shown (
Figure 1 C).
Figure 1 D shows the interference between the endotherm of melting of ibuprofen and that of the dehydration of the hydrate isomalt: this fact suggested the previous dehydration in oven of the excipient. Similar thermograms were obtained for the same samples after traditional compaction into tablets. Calculation carried out on both systems let us to draw the conclusion that thermal parameters of ibuprofen and isomalt do not change when they are in a physical mixture or in traditionally compacted tablets, suggesting the absence of any interaction, maintaining both compounds the starting crystallinity.
On the contrary, in thermograms of the samples containing de-hydrated isomalt and obtained under ultrasound compaction, the area under the peak of the ibuprofen melting endotherm was markedly reduced. This fact can be attributed to thermal events associated to ultrasound compaction. Ibuprofen demonstrated a particular behaviour during thermal treatments. During a thermal cycle, a sample of ibuprofen, previously melted, does not recover its crystallinity on cooling and the sample soon after this treatment did not show any melting peak. Powders of pure ibuprofen compacted under ultrasound transformed into a soft paste that solidified and crystallized only after several days. It can be hypothesized that these phenomena could occur also when ibuprofen is in the presence of excipients.
As a consequence the decrease of the area under the peak of ibuprofen melting endotherm, when in mixture with de-hydrated isomalt and compacted under ultrasound, can be attributed to its amorphization following the melting under ultrasound discharge. Moreover thermogravimetric analysis of tablets allowed to ensure that ibuprofen does not decompose under ultrasound: in each case the loss of weight associated to the evaporation of ibuprofen in the thermogravimetric profiles agreed better than 98% with the nominal value of the concentration at all the compositions examined.
An estimation of crystalline ibuprofen content was obtained by DSC data, comparing the area under the peak of ibuprofen melting endotherm measured in the presence of both types of compaction and for the untreated drug in the absence of the excipient and calculated by:
where
ΔHt and
ΔHp are enthalpies of fusion of ibuprofen when in tablets or when pure, respectively, and
C is the experimental weight fraction of the drug in the mixture. The equation assumes that the pure drug was 100% crystalline. Since the literature does not describe different polymorphic forms for ibuprofen, reduced area under the peak can be originated from decreasing drug crystallinity and not from altered polymorphic forms of ibuprofen.
Table 1 shows the results of DSC analysis of the tablets compacted under ultrasound and reveals that calculated crystallinity of ibuprofen is reduced (to an extent ranging from 40/50%, for 10% ibuprofen content, to 25/30% for higher concentration) with respect to the starting value and appears to increase as ibuprofen content increases inside the tablet.
This can be due to the fact that at low concentration ibuprofen is dispersed inside a large mass of the excipient, while at higher concentration it is easier for ibuprofen to re-build its crystalline lattice after the melting under ultrasound discharge. However, since the DSC approach essentially shows this parameter only at the temperature of determination (i.e. at the melting point of ibuprofen), it cannot be excluded an (at least partial) recover of crystallinity during temperature scanning up to 78°C.
Table 1.
Composition of the ibuprofen/(de-hydrated) isomalt systems compacted under ultrasound and analyzed by DSC. Pure Ibuprofen: ΔH = 125.7 Jg-1.
Table 1.
Composition of the ibuprofen/(de-hydrated) isomalt systems compacted under ultrasound and analyzed by DSC. Pure Ibuprofen: ΔH = 125.7 Jg-1.
| Sample* | Energy released/Pressure (J/bar) | ΔHmelting (Jg-1) | % crystallinity |
|---|
| | | | |
| 10% Ibuprofen | | | |
| 1 | 500/5 | 7.0 | 55 |
| 2 | 550/5 | 4.6 | 37 |
| 3 | 600/5 | 5.1 | 40 |
| | | | |
| 4 | 500/6 | 7.0 | 55 |
| 5 | 550/6 | 8.1 | 64 |
| 6 | 600/6 | 6.7 | 53 |
| | | | |
| 20% Ibuprofen | | | |
| 1 | 400/5 | 17.2 | 68 |
| 2 | 450/5 | 16.6 | 66 |
| 3 | 500/5 | 19.0 | 76 |
| | | | |
| 4 | 400/6 | 19.5 | 78 |
| 5 | 450/6 | 20.0 | 79 |
| 6 | 500/6 | 18.2 | 72 |
| | | | |
| 30% Iuprofen | | | |
| 1 | 300/5 | 31.0 | 82 |
| 2 | 360/5 | 29.6 | 78 |
| 3 | 400/5 | 28.2 | 75 |
| | | | |
| 4 | 250/6 | 27.6 | 73 |
| 5 | 285/6 | 30.0 | 79 |
| 6 | 329/6 | 30.2 | 80 |
SEM images – Qualitative inspection of the tablets by means of electron microscopy was carried to evaluate the effects of ultrasound on the microstructure of the tablet components after ultrasound-assisted compaction. These results were obtained using the particles obtained by milling tablets, prepared under ultrasound, and the whole tablet.
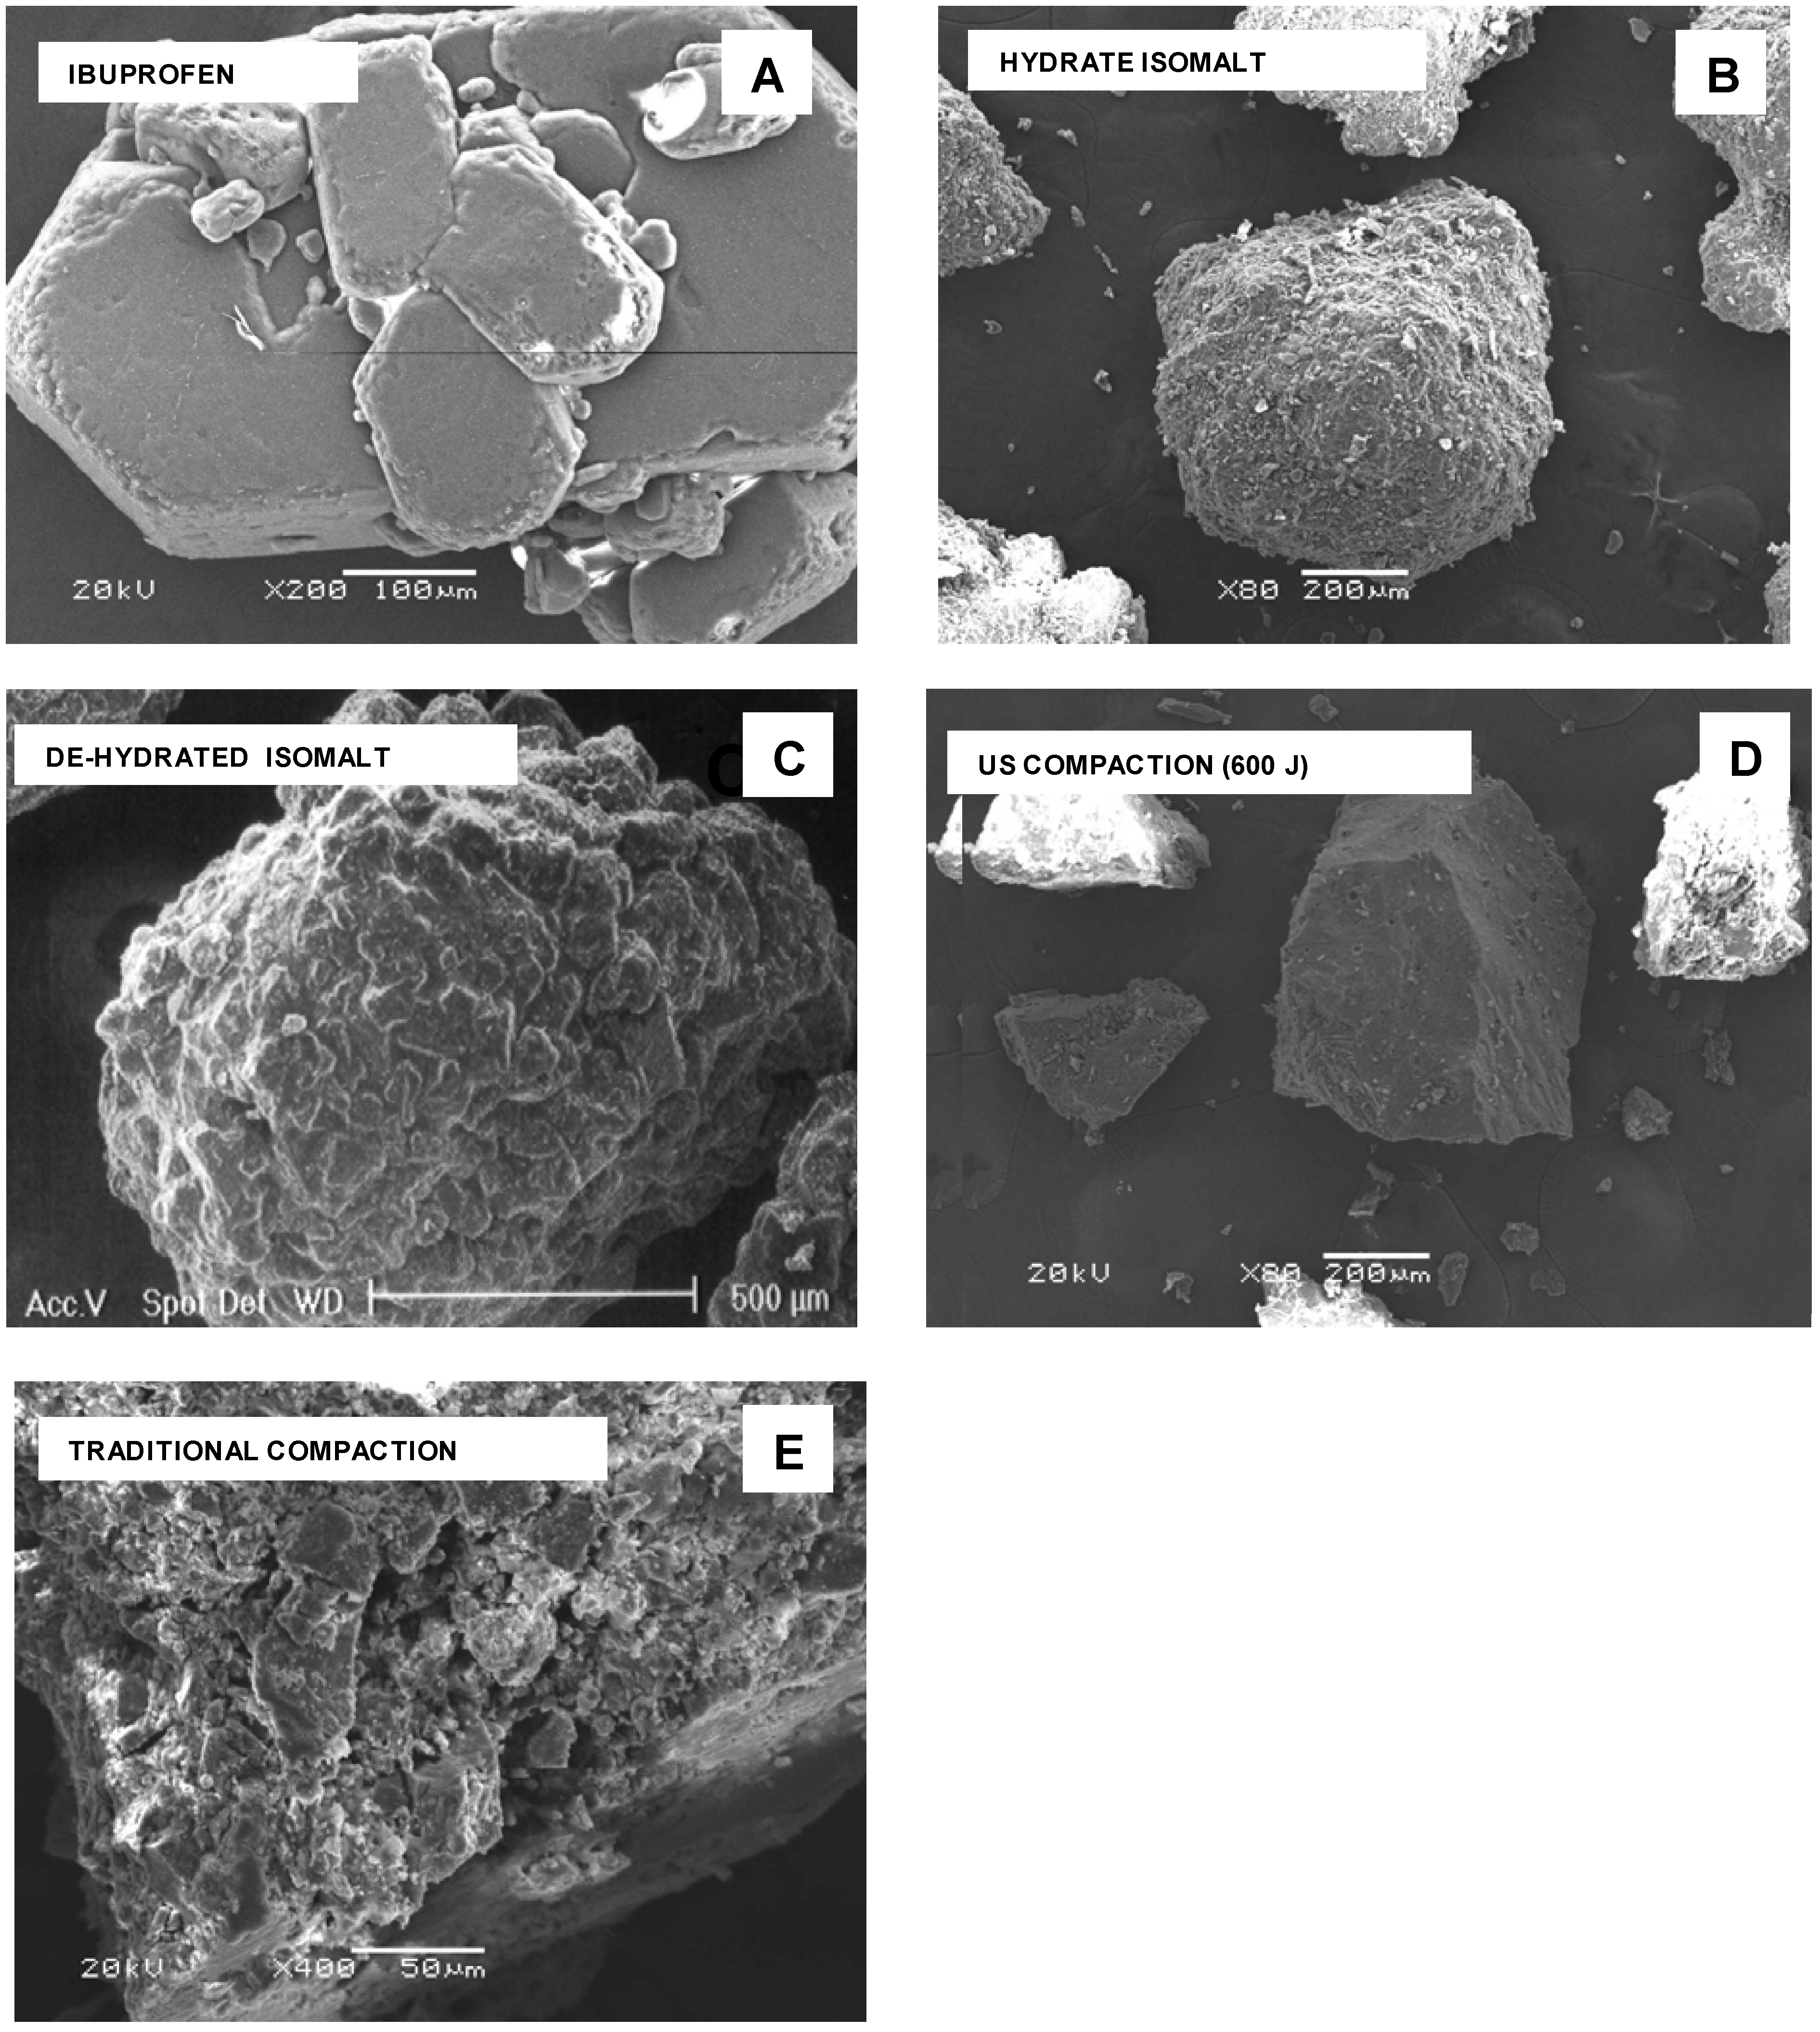
At SEM examination, particles of pure compounds appear with morphology very different from each other (
Figure 2 A-D). Ibuprofen particles have a crystalline habit with agglomerates formed by hexagonal plates stacked together (
Figure 2 A), while isomalt shows agglomerated spherical particles with rounded margins and irregular and rough surface (
Figure 2 B): this morphology was practically retained after dehydration (
Figure 2 C). After milling of a tablet compacted under ultrasound, particles show sharp edges, compact texture and fairly smooth surface (
Figure 2 D): in fragments of a tablet traditionally compacted, single component regions appear assembled together with deformed edges and also reduced size, following the pressure of the die (
Figure 2 E).
Figure 2.
SEM photos. A – ibuprofen; B - hydrate isomalt; C – de-hydrated isomalt; D – tablet fragment from ultrasound-assisted compaction; E - tablet fragments from traditional compaction.
Figure 2.
SEM photos. A – ibuprofen; B - hydrate isomalt; C – de-hydrated isomalt; D – tablet fragment from ultrasound-assisted compaction; E - tablet fragments from traditional compaction.
As a consequence the fractal dimension of the particle contour was found lower for powder obtained under ultrasound compacted tablets (1.10) than for conventionally compacted ones (1.25). This fact agrees with what reported [
16] that tablets prepared under ultrasound have smoother surface in comparison to the surface of the conventionally prepared tablets. Fusion of particles at surface asperities, under ultrasound discharge, that increases interparticulate bonding reducing void spaces is thought responsible of these new characteristics, acquired by the particulate under ultrasound. Even though rises in bulk temperature up to 36°C were recorded during ultrasound compaction of ibuprofen [
16], this does not eliminate the possibility of local temperature rises at the contact and friction points of the powder particles above the melting temperature of ibuprofen (78°C). As a result the melting, the area of contact between the powder particles increases; the molten material solidifies to form solid bridges and acts as a binder inside the tablet: this produces smoothing of the contact surface at the interfaces tablet/die, but also at the fracture surface when tablets are crushed. Ultrasound compaction operates also in reducing particle size inside the tablet: the surface of a tablet appears heterogeneous only at very high magnification (particle size ≈ 1 μm); otherwise it appears continuous and compact (
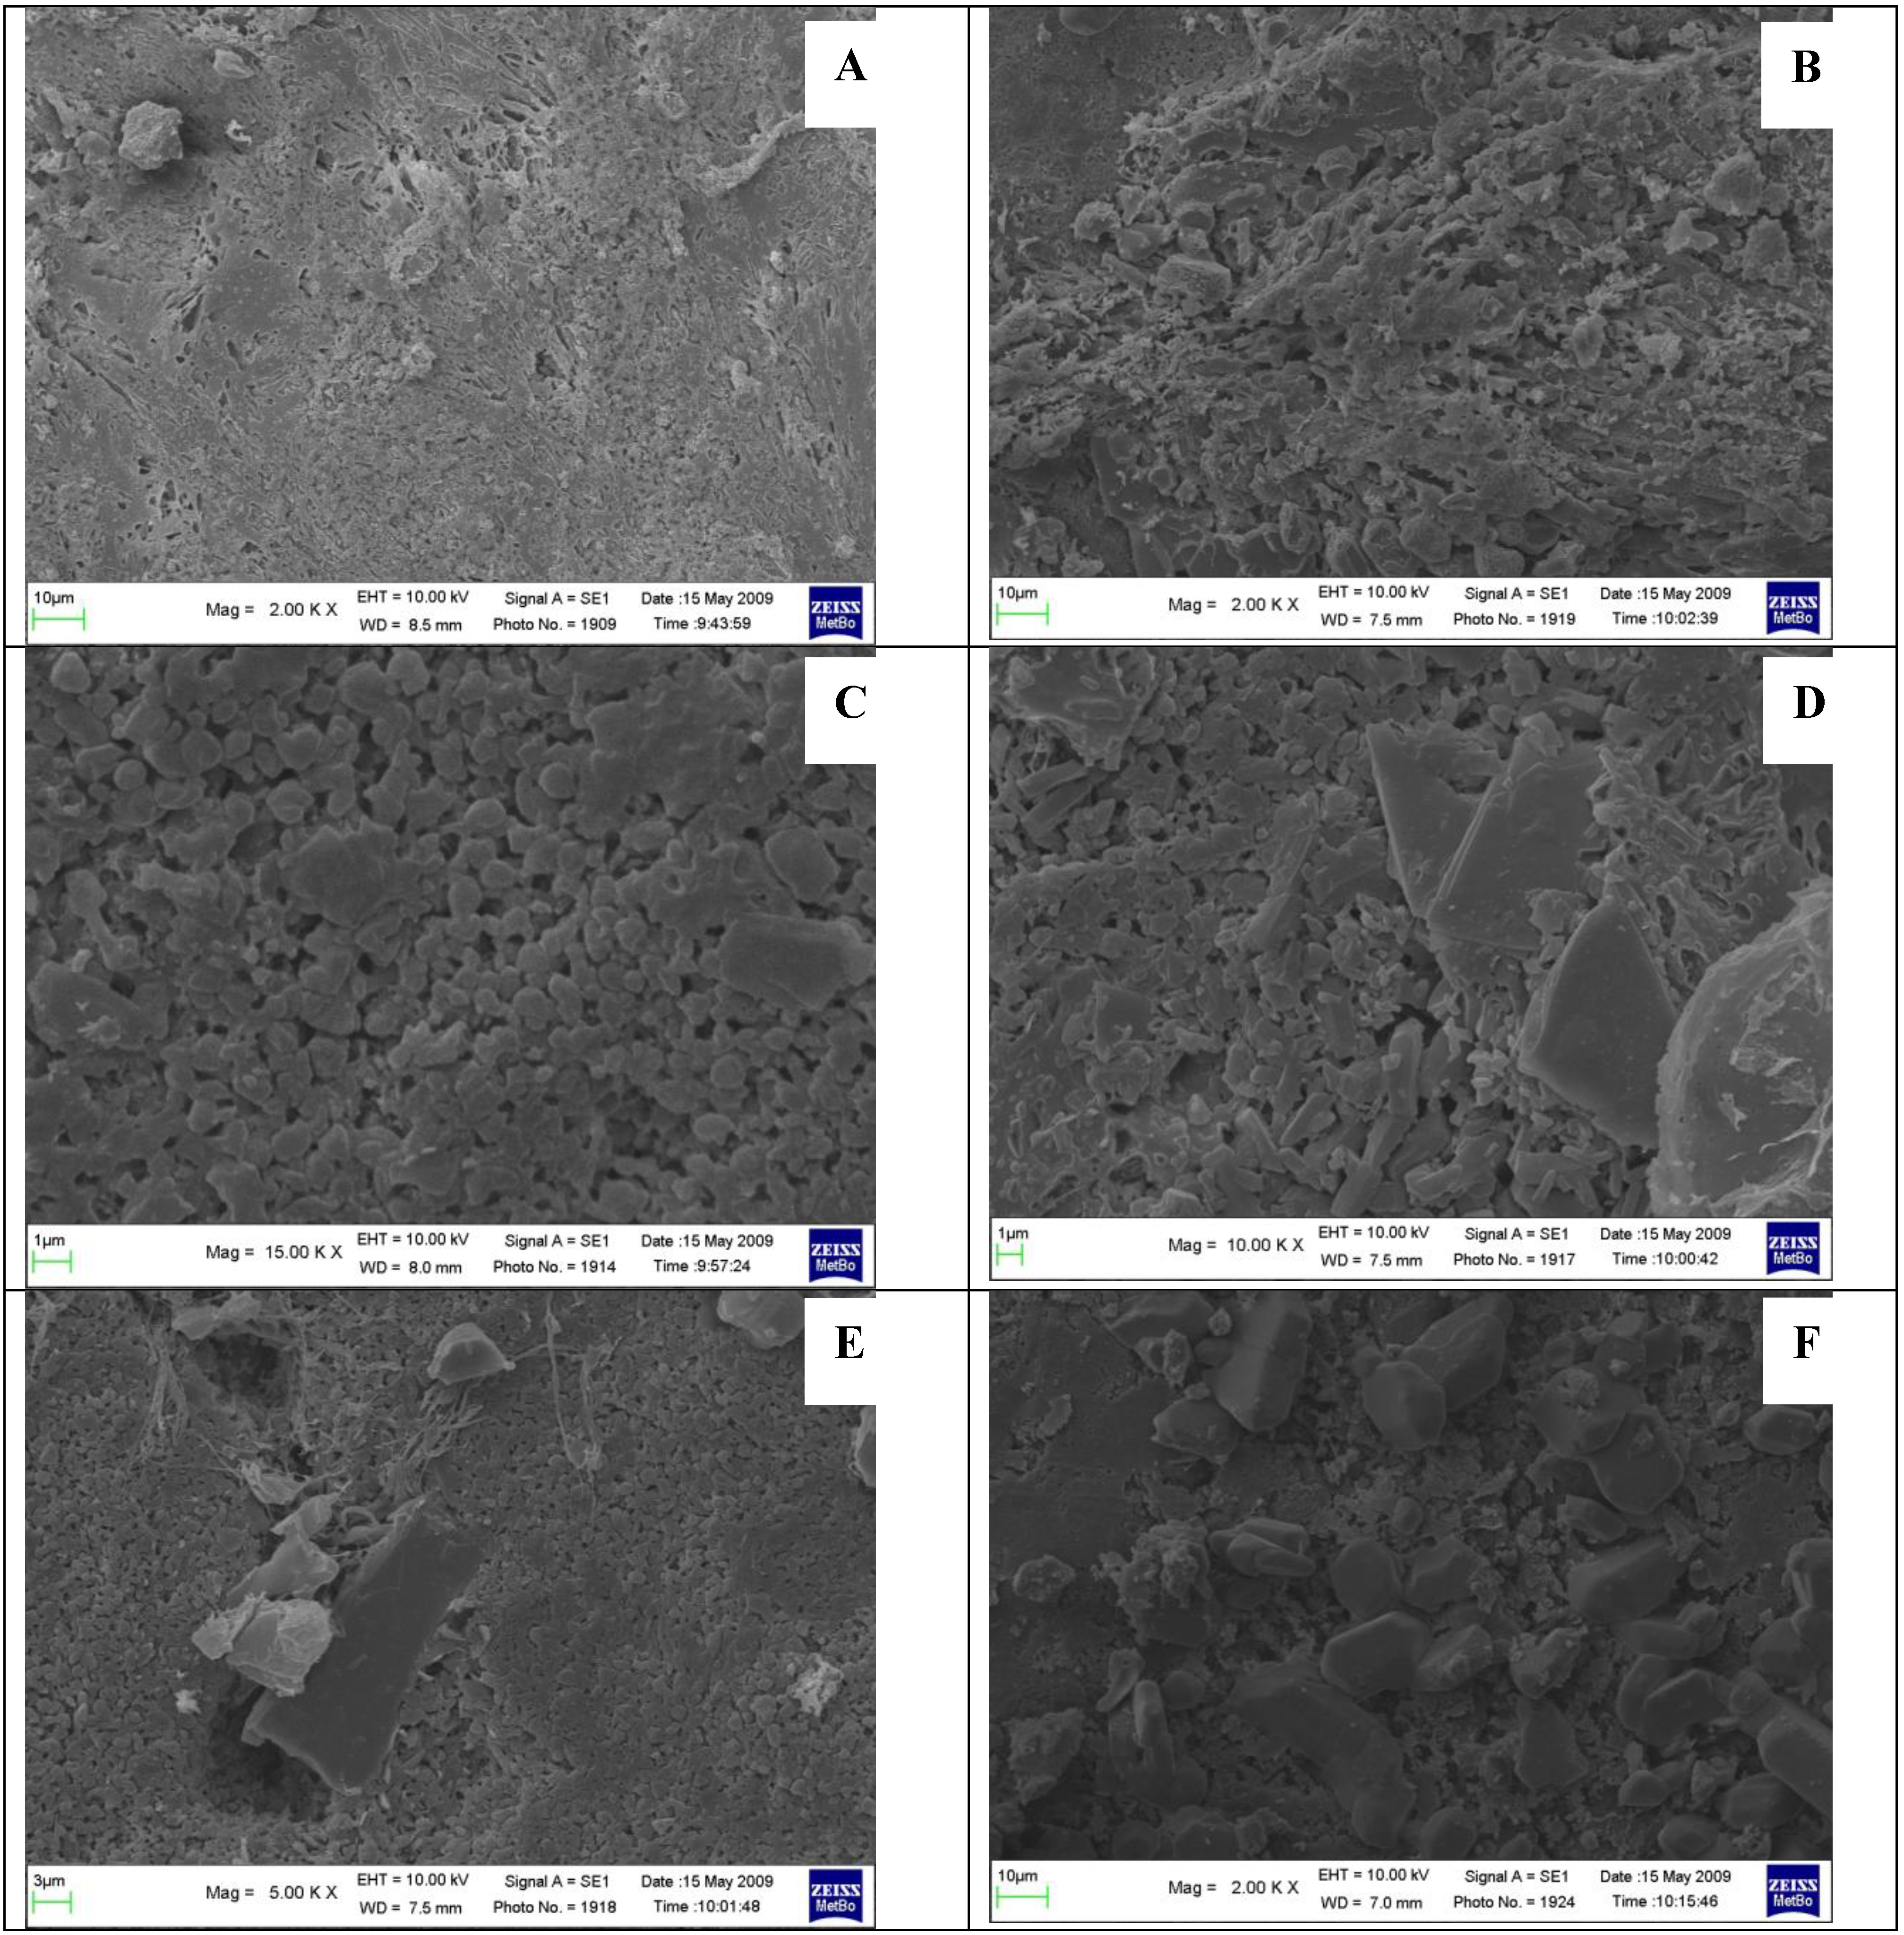
Figure 3 A).: At accurate SEM examination the two faces of the tablet appear different, being the surface of the inferior face more irregular than the superior one (
Figure 3 B): this was expected due to mode of ultrasound-assisted compaction, where ultrasound operate only on the top of the tablet. In the inferior face it is frequent to encounter presence of plates of almost regular shape (visible at high magnification). The shape of these micro-plates recalls that of ibuprofen crystals, shown in
Figure 2 A that could suggest an asymmetric distribution of the drug. To test this hypothesis we employed micro-spectroscopy Raman and FT-IR (see below).
Figure 3.
SEM photos. A – top face (2kx); B – inferior face (2kx); C – top face (15kx); D – re-crystallization (inferior face: 10kx); E – re-crystallization (inferior face: 5kx); F – re-crystallization (inferior face: 2kx).
Figure 3.
SEM photos. A – top face (2kx); B – inferior face (2kx); C – top face (15kx); D – re-crystallization (inferior face: 10kx); E – re-crystallization (inferior face: 5kx); F – re-crystallization (inferior face: 2kx).
It can be hypothesized that these plates have been formed after some event occurred following the ultrasound compaction, since their shape allows identifying them as clearly different from the circumferencing areas and can be attributed to ibuprofen crystals formed after the melting under ultrasound discharge. Moreover these areas are less frequent in the top surface, where the background appears more regular (
Figure 3 A and
Figure 3 B), differently from the opposite surface, more irregular (
Figure 3 C) and where the formation of crystals (
Figure 3 D), whose shape closely recalls that of ibuprofen hexagonal plates shown in the
Figure 2 A.
Figure 3 E and
Figure 3 F again show the differences between the two surfaces when the electron beam modifies the surfaces by some thermal effect.
Raman and IR spectra – Tablets obtained by means of the two different methods were examined by Raman and IR micro-spectroscopy: since these techniques allow a direct observation of the sample, without any special preparation procedures that could alter their characteristics [
25].
Raman spectra of pure components were first registered as a reference; then spectra were also collected for the tablets the in the spectral range 100-3500 cm
-1. Spectra of compounds (
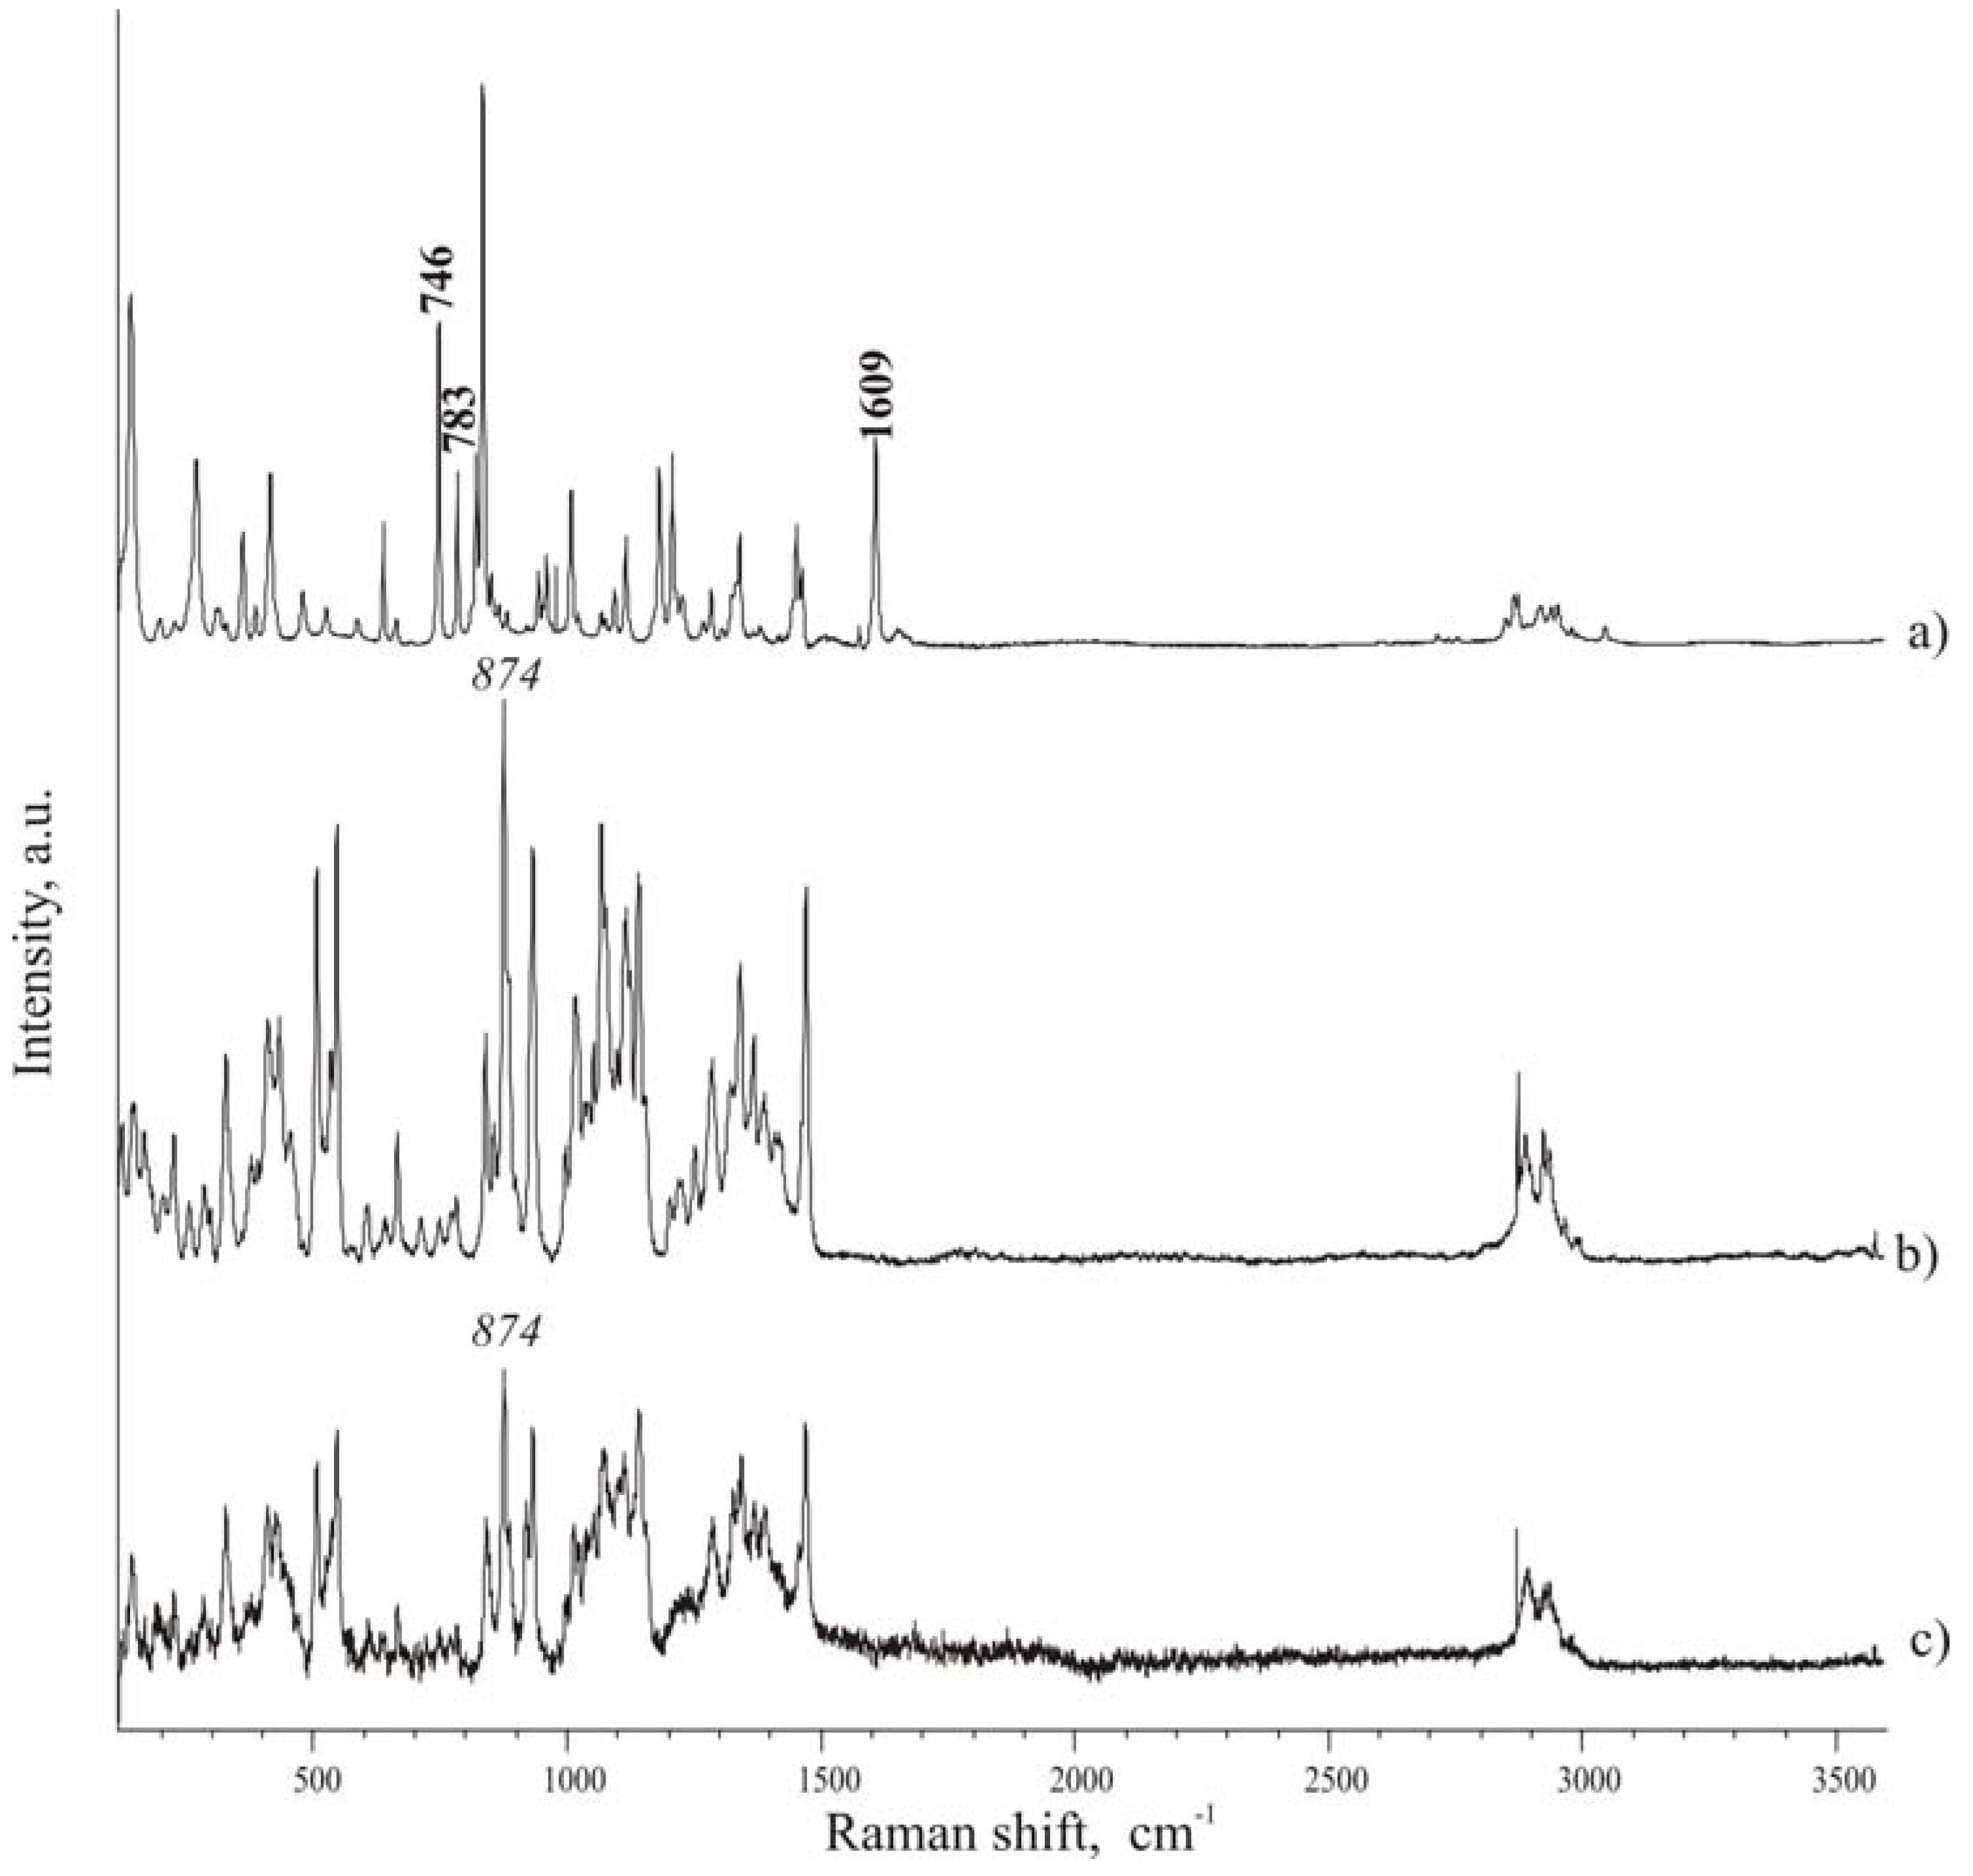
Figure 4) are rich of narrow and well defined peaks, whose wave number position in the considered spectral range can be employed to identify each compound, when in mixture. Recent papers [
26,
27] report a precise attribution of the bands in the Raman spectrum of ibuprofen: in the present paper however we are not interested in the intrinsic assignment of the bands, rather in the use of distinctive bands to evidence the presence of ibuprofen inside the formulation. By comparison of the spectra of the two components (
Figure 4 A and
Figure 4 C), it was possible to consider the following peaks to check the presence of ibuprofen in the mixtures: 746, 783, 1609 cm
-1, which can be found in spectral regions where isomalt peaks do not overlap and interfere. Particularly interesting are the band at 746 cm
-1, associated to out-of-plane deformation of C-H group of an aromatic ring, and the band at 1609 cm
-1, attributed to the stretching of aromatic C–C bonds (in-plane ring deformation and C–C ring stretching). Since few pharmaceutical excipients contain aromatic groups, thus the spectral regions characteristic of aromatic C−C and C−H stretching usually have peaks arising only from the active substance (in addition to functional groups present in the drug and not commonly encountered in excipients).
The same band was chosen by other authors to evidence the physical state of ibuprofen in solid dispersion with PVP (1613 cm
-1) [
28].
The band at 874 cm-1 of isomalt spectrum was chosen as reference peak for the excipient.
Figure 4.
Micro-Raman spectra. A – ibuprofen; B – hydrate isomalt; C – de-hydrated isomalt.
Figure 4.
Micro-Raman spectra. A – ibuprofen; B – hydrate isomalt; C – de-hydrated isomalt.
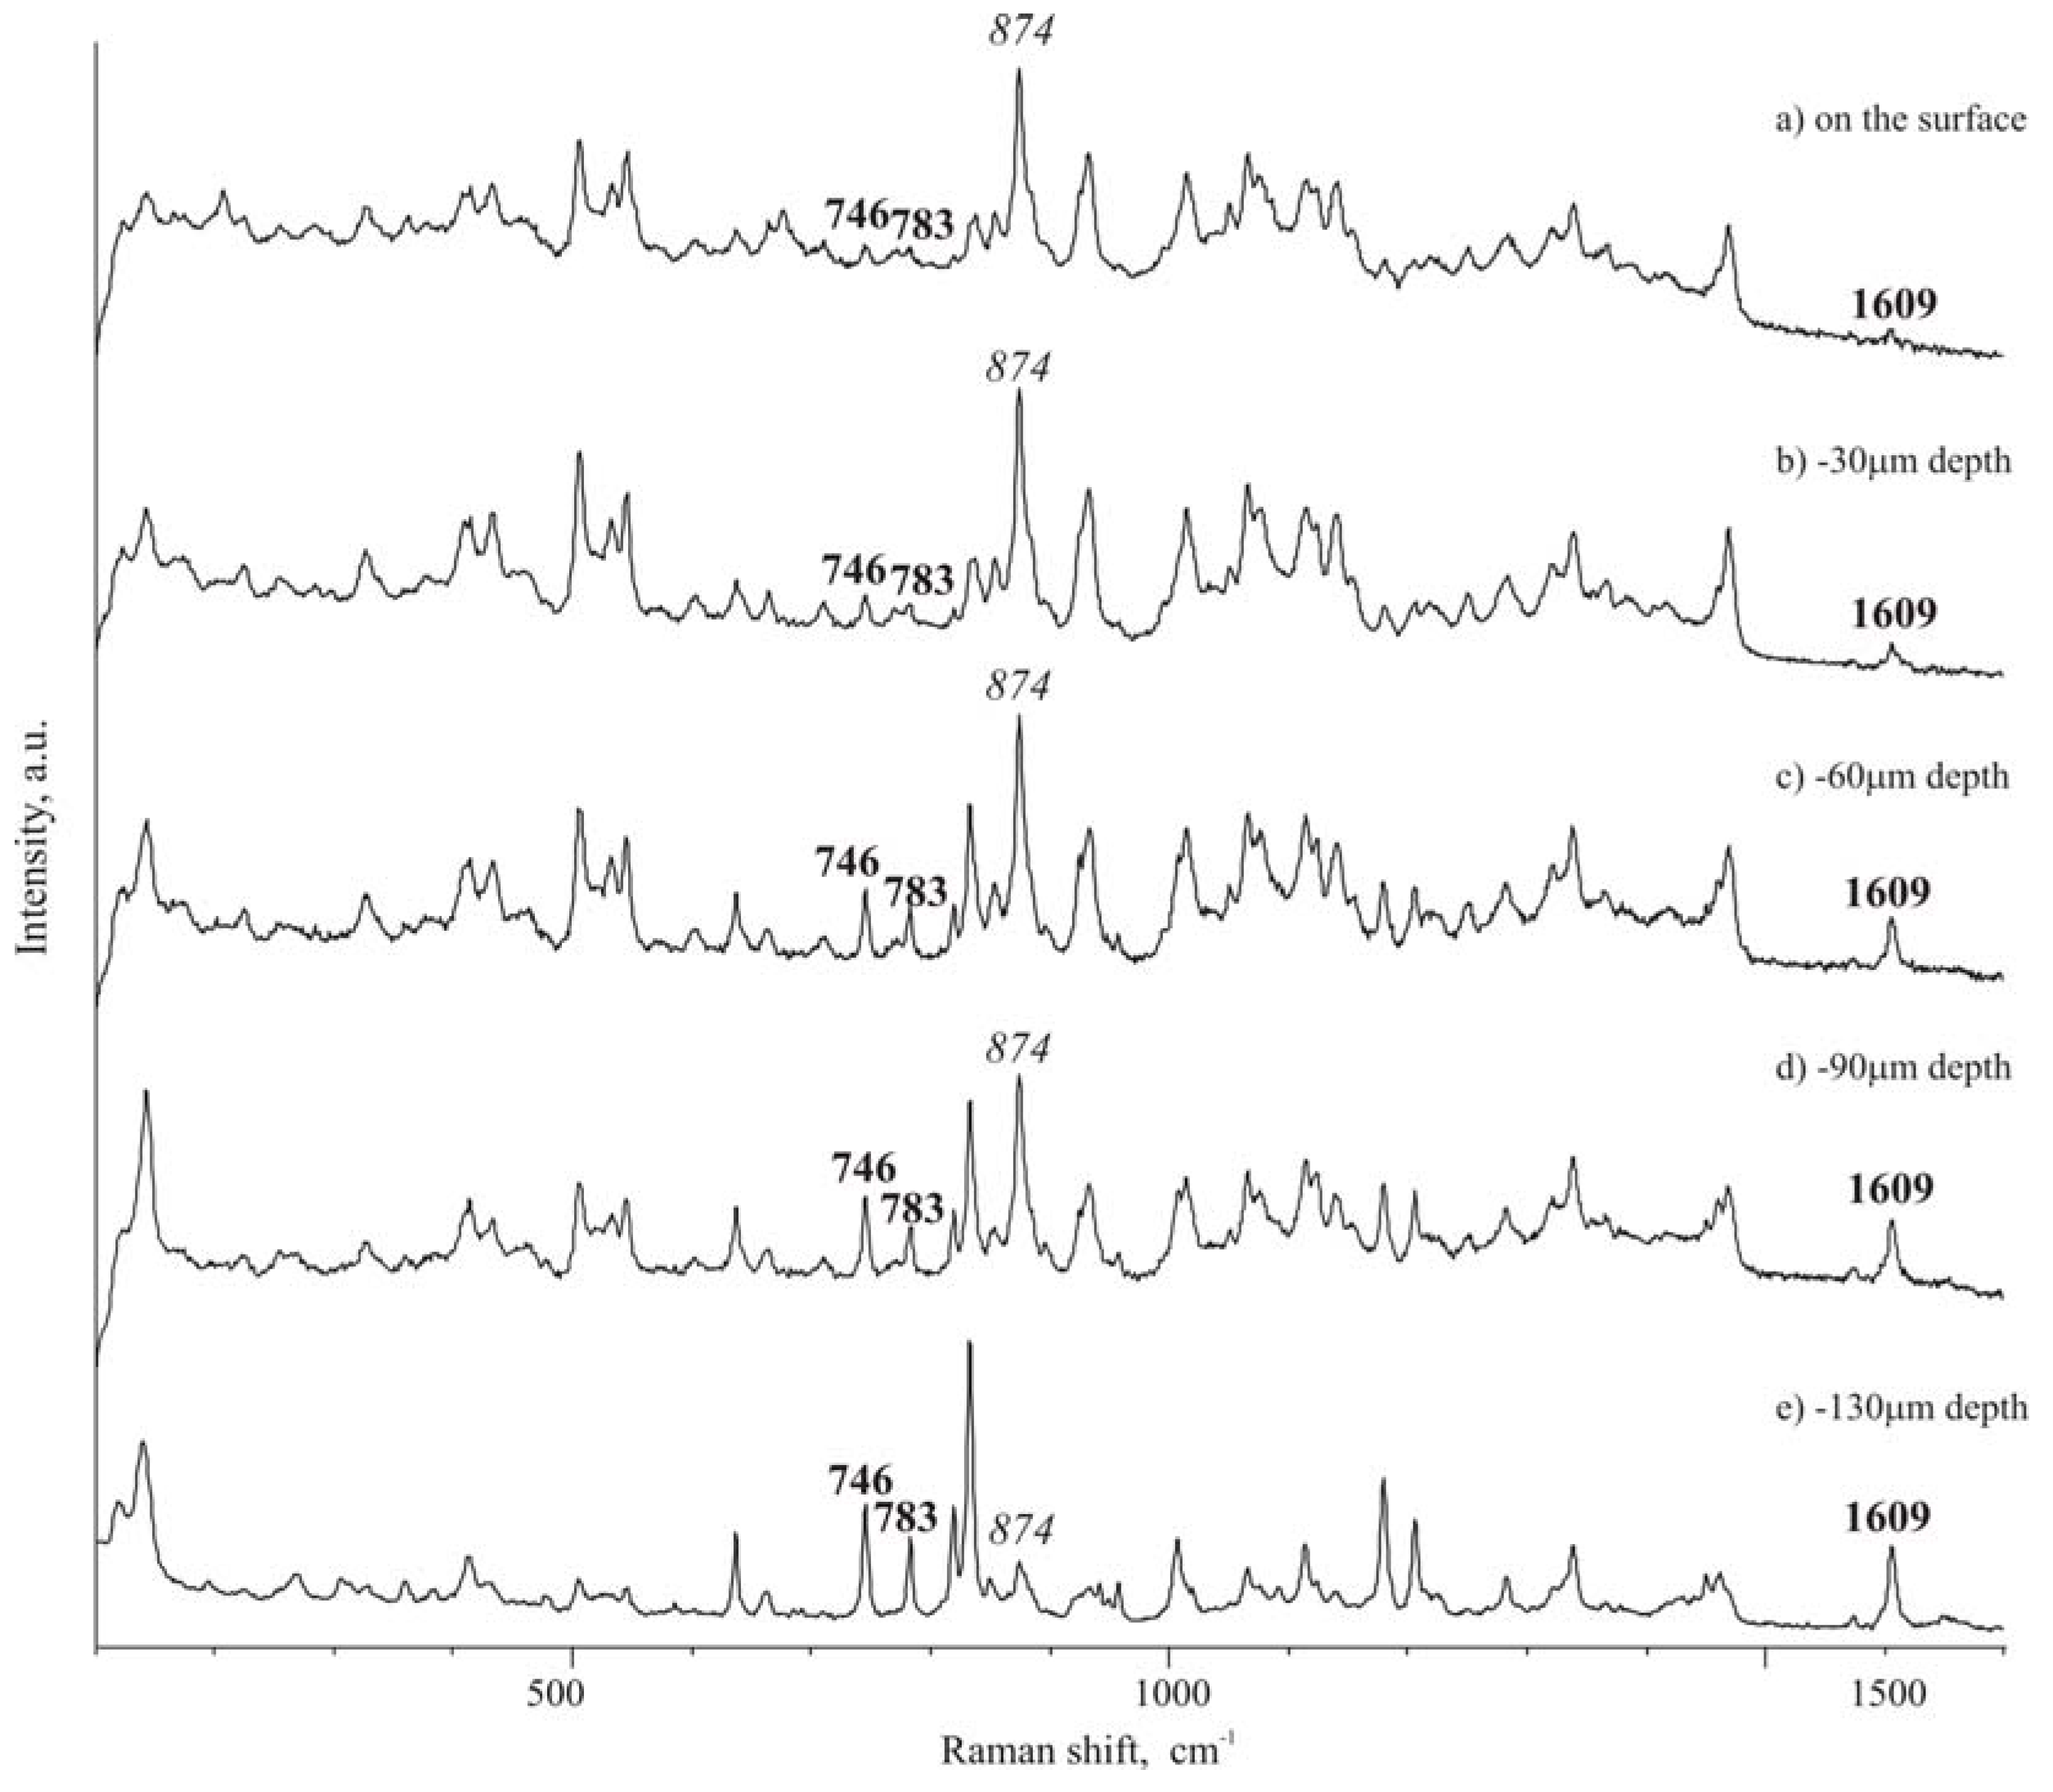
To evaluate possible asymmetry of ibuprofen distribution, from the top to the opposite face of a tablet, Raman spectra were carried out in different points of the cross-section of a tablet. Traditional tablets show a discrete distribution of the drug and excipient along the section of the tablet, as that observed for the surface of the tablet. On the contrary, in ultrasound-compacted tablets it was found that ibuprofen peak at 1609 cm
-1 increases its intensity from the top surface of the tablet towards the bulk of the tablet: passing from the top surface, as level 0, where practically only isomalt could be detected by the high intensity peak at 874 cm
-1 (
Figure 5 A), to lower levels it appears that the ibuprofen peak at 1609 cm
-1 starts to be appreciable at 30 μm below the top surface and, at 130 μm level, ibuprofen peak appears dominant over that of isomalt (comparing intensity of the two reference peaks) (
Figure 5 B-D). This phenomenon is less accentuated when ultrasound energy of compaction was lower.
On the contrary on the surface of the opposite side it can be appreciated an increase of the ibuprofen concentration, as documented by an increase of the frequency, with which the reference peak of ibuprofen is encountered.
Spectra of the
Figure 5 is reported as an example of those registered along a line starting from the level 0 (top surface) toward the inner regions of the tablet. Other tests gave statistically similar results indicating a progressive increase of the intensity of the ibuprofen reference peak.
Figure 5.
Micro-Raman spectra along the section of a tablet: A – top surface (level 0);B – -30 μm; C – -60 μm; D – -90 μm; E – -160 μm.
Figure 5.
Micro-Raman spectra along the section of a tablet: A – top surface (level 0);B – -30 μm; C – -60 μm; D – -90 μm; E – -160 μm.
The same results were obtained using IR spectra. In this case the band of the carboxyl at 1710 cm
-1 (C=O stretching) was chosen as reference peak in the IR spectrum of ibuprofen, both since it is the most intense peak of the spectrum and since isomalt does not present any peak in this spectral region. This band was absent in the Raman spectrum [
29].
When the tablets surface was examined, a similar behaviour occurred as that previously noticed with Raman microscopy. On the traditional tablet it is possible to observe (not shown here) distinctly separated both pure compounds. In FT-IR spectra, collected on a number of portions of the ultrasound-compacted tablet top surface, the presence of ibuprofen was attested through its reference band at 1710 cm-1 only in very few points of the tablet surface. While FT-IR more frequently could detect the presence of isomalt. In tablets compacted under higher ultrasound energy, reference peak of ibuprofen, when detected, was found shifted to 1722 cm-1. This could indicate a modified carboxyl environment related to the disruption of the dimeric entities dominant in the condensed phase.
Figure 6.
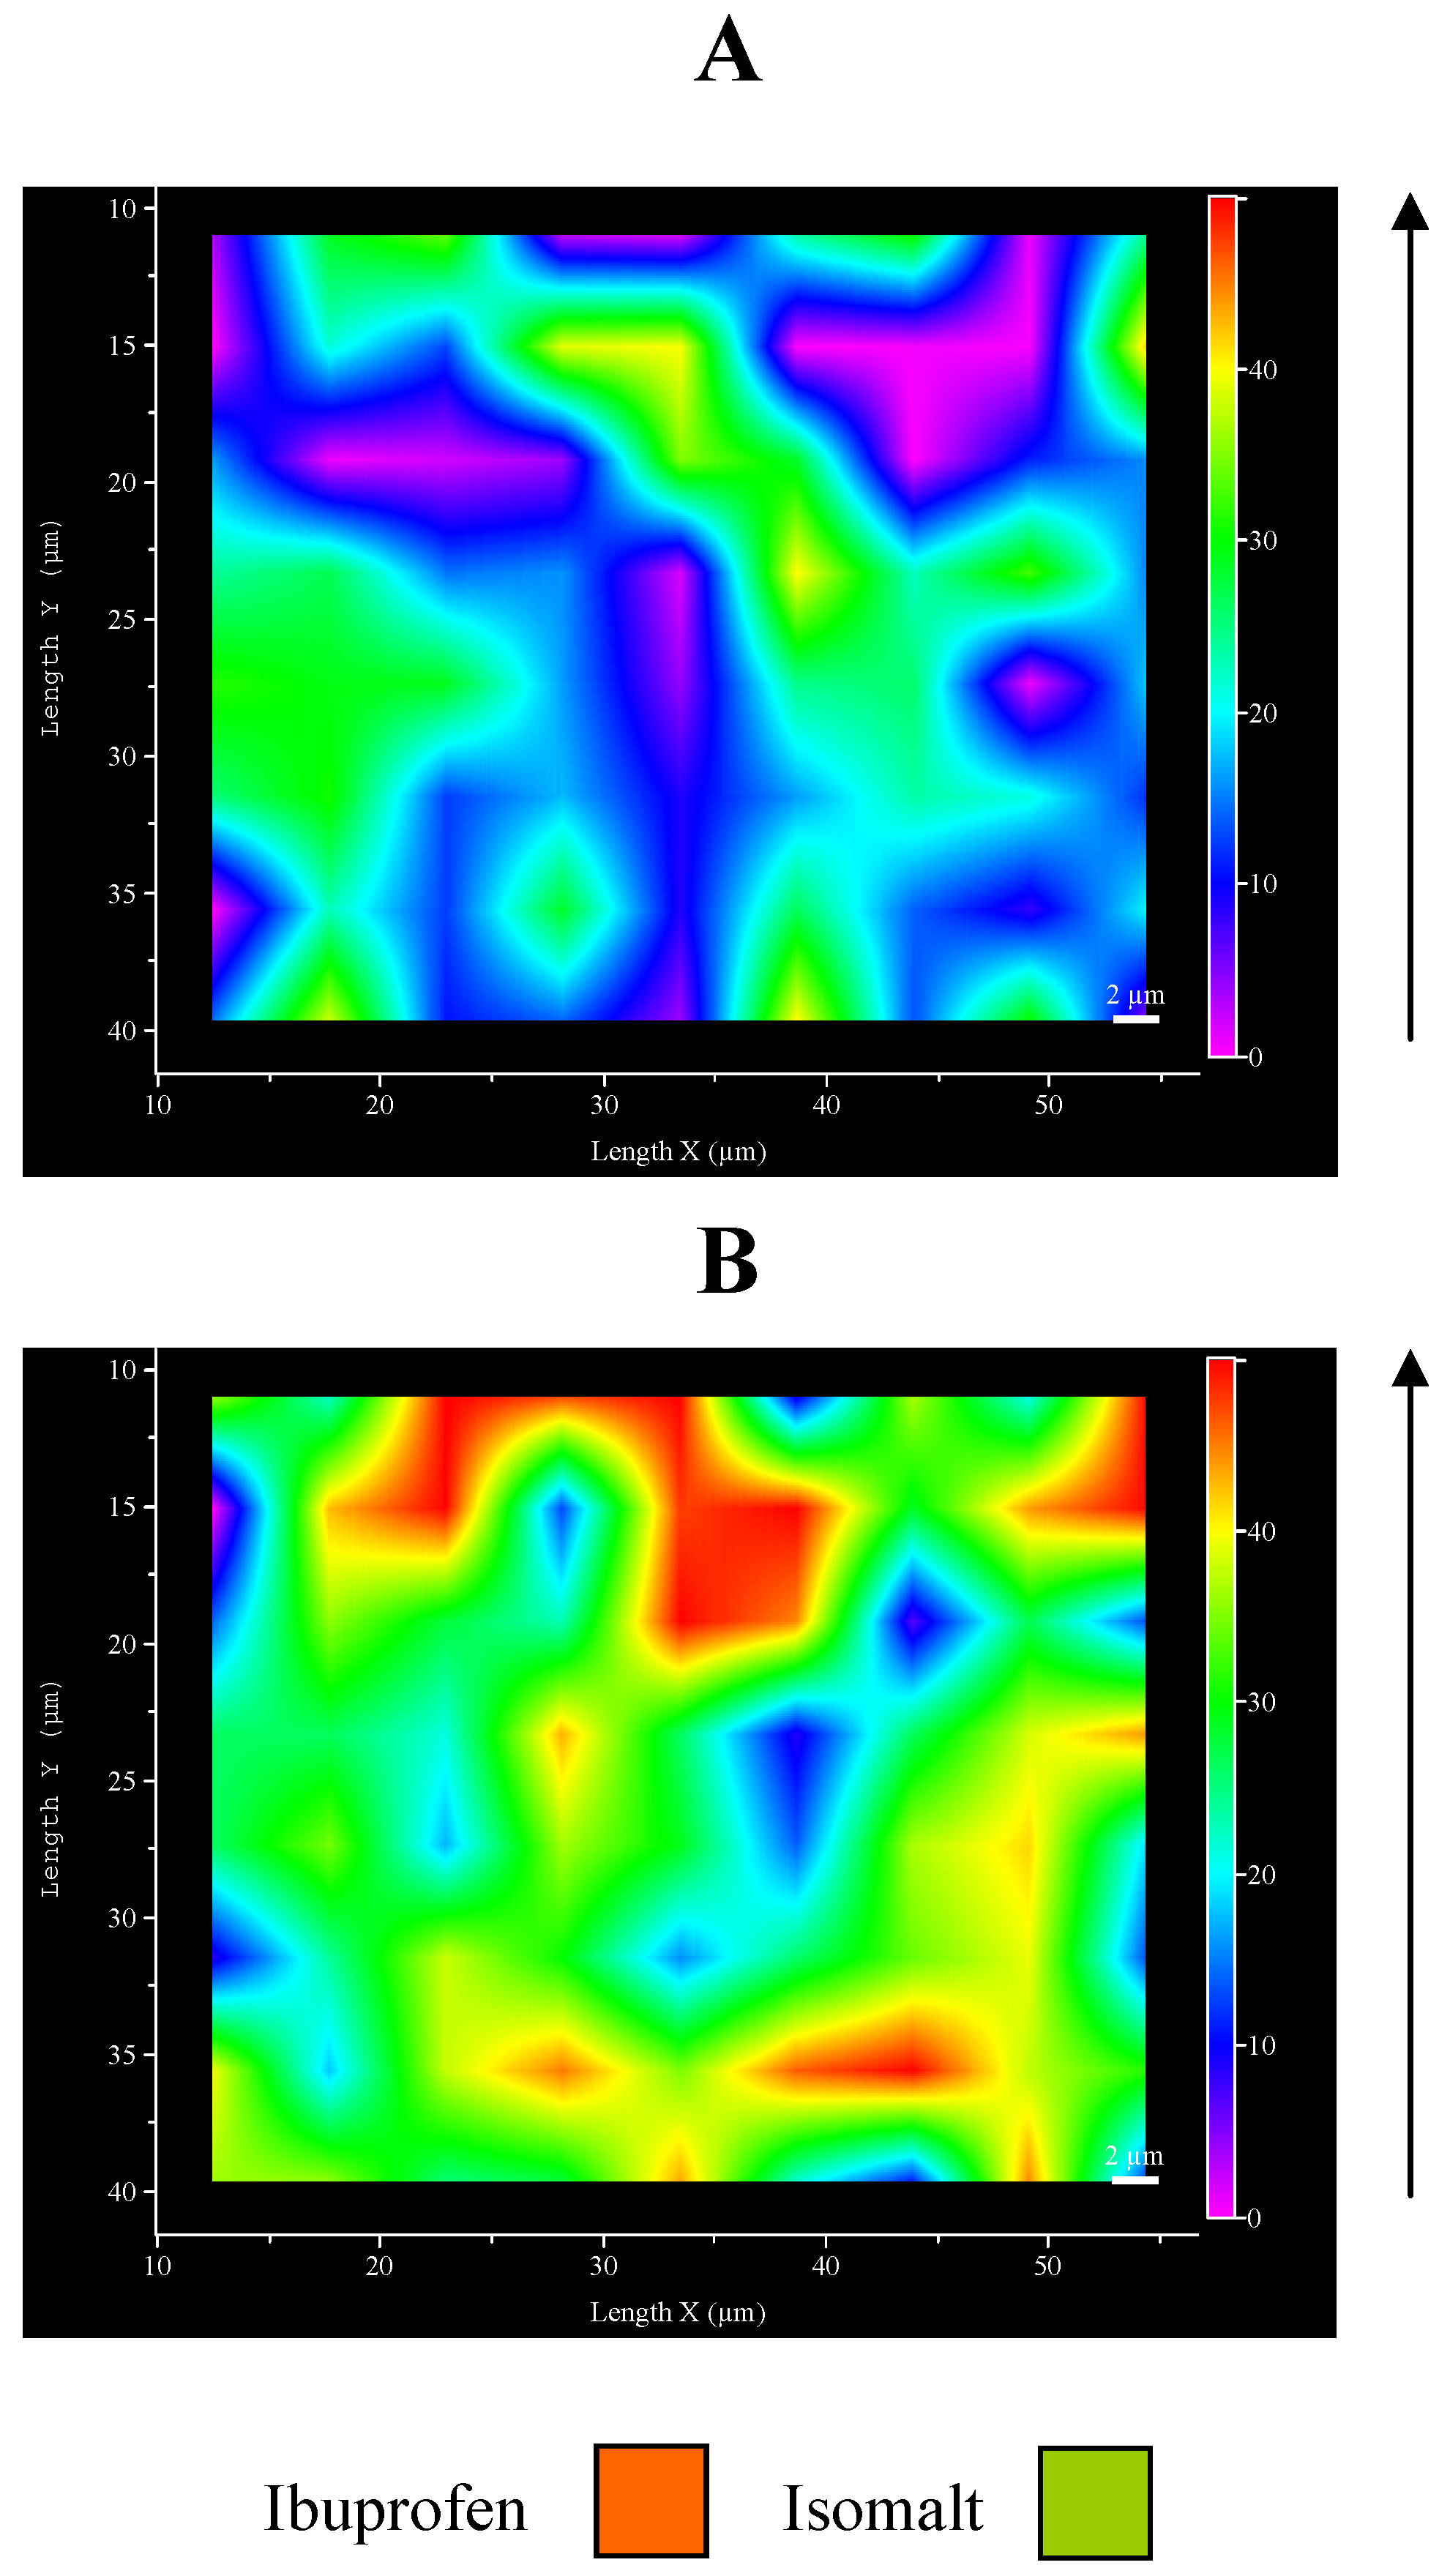
Micro-Raman maps of intensity at 1609 cm-1: A – top surface; B – inferior face.
Figure 6.
Micro-Raman maps of intensity at 1609 cm-1: A – top surface; B – inferior face.
This unexpected aspect of ultrasound compaction suggested preparing a map of the ibuprofen distribution on the tablet surfaces.
Figure 6 represents an example of Raman map of surface portions: the different distribution of drug and excipient is evidenced by different colours: examination of different points of the surfaces produced comparable maps. This result allows to confirm previous hypothesis, since it can be clearly appreciated the major presence of ibuprofen in the inferior face with respect to the top one.
These preliminary results suggest an asymmetric distribution of ibuprofen inside the tablet, observed as a consequence of ultrasound compaction, that starts from the upper surface in direct contact with sonotrode down to internal layers situated immediately below, causing a partial disappearance of ibuprofen from the top surface of the tablet and its concentration on the opposite face of the tablet. This fact can be explained, likewise the amorphization discussed before, with the melting of the drug under ultrasound: once molten, the liquid drug tends to flow downwards through the isomalt particle and is removed from the top surface, in this assisted also by the intense movement of the sonotrode that vibrates at ultrasound frequency. Additionally it must be also outlined that ibuprofen and isomalt possess very different solubility parameters [
30] that prevent their mutual solubility and thus the possibility of molten ibuprofen to dissolve isomalt and slowing down or blocking the flow: this can be a key to overcome this unexpected aspect of ultrasound compaction. The use of excipients interacting somehow with the drug could prevent this flow, when a low melting drug is used under ultrasound compaction.
Further researches will be related to observe asymmetric distribution as a function of the parameters of the ultrasound compaction (energy, pressure, frequency) also to evaluate the possibility of ibuprofen loss by evaporation (that however appears to occur at higher temperature than that developed during ultrasound compaction); and also the nature of the drug will be evaluated to determine a critical melting point of the drug as well as to select new drug/excipient pairs suitable to make the drug indifferent to this aspect of the ultrasound compaction.

