
A Pelagic Microbiome (Viruses to Protists) from a Small Cup of Seawater


Abstract
:1. Introduction
2. Materials and Methods
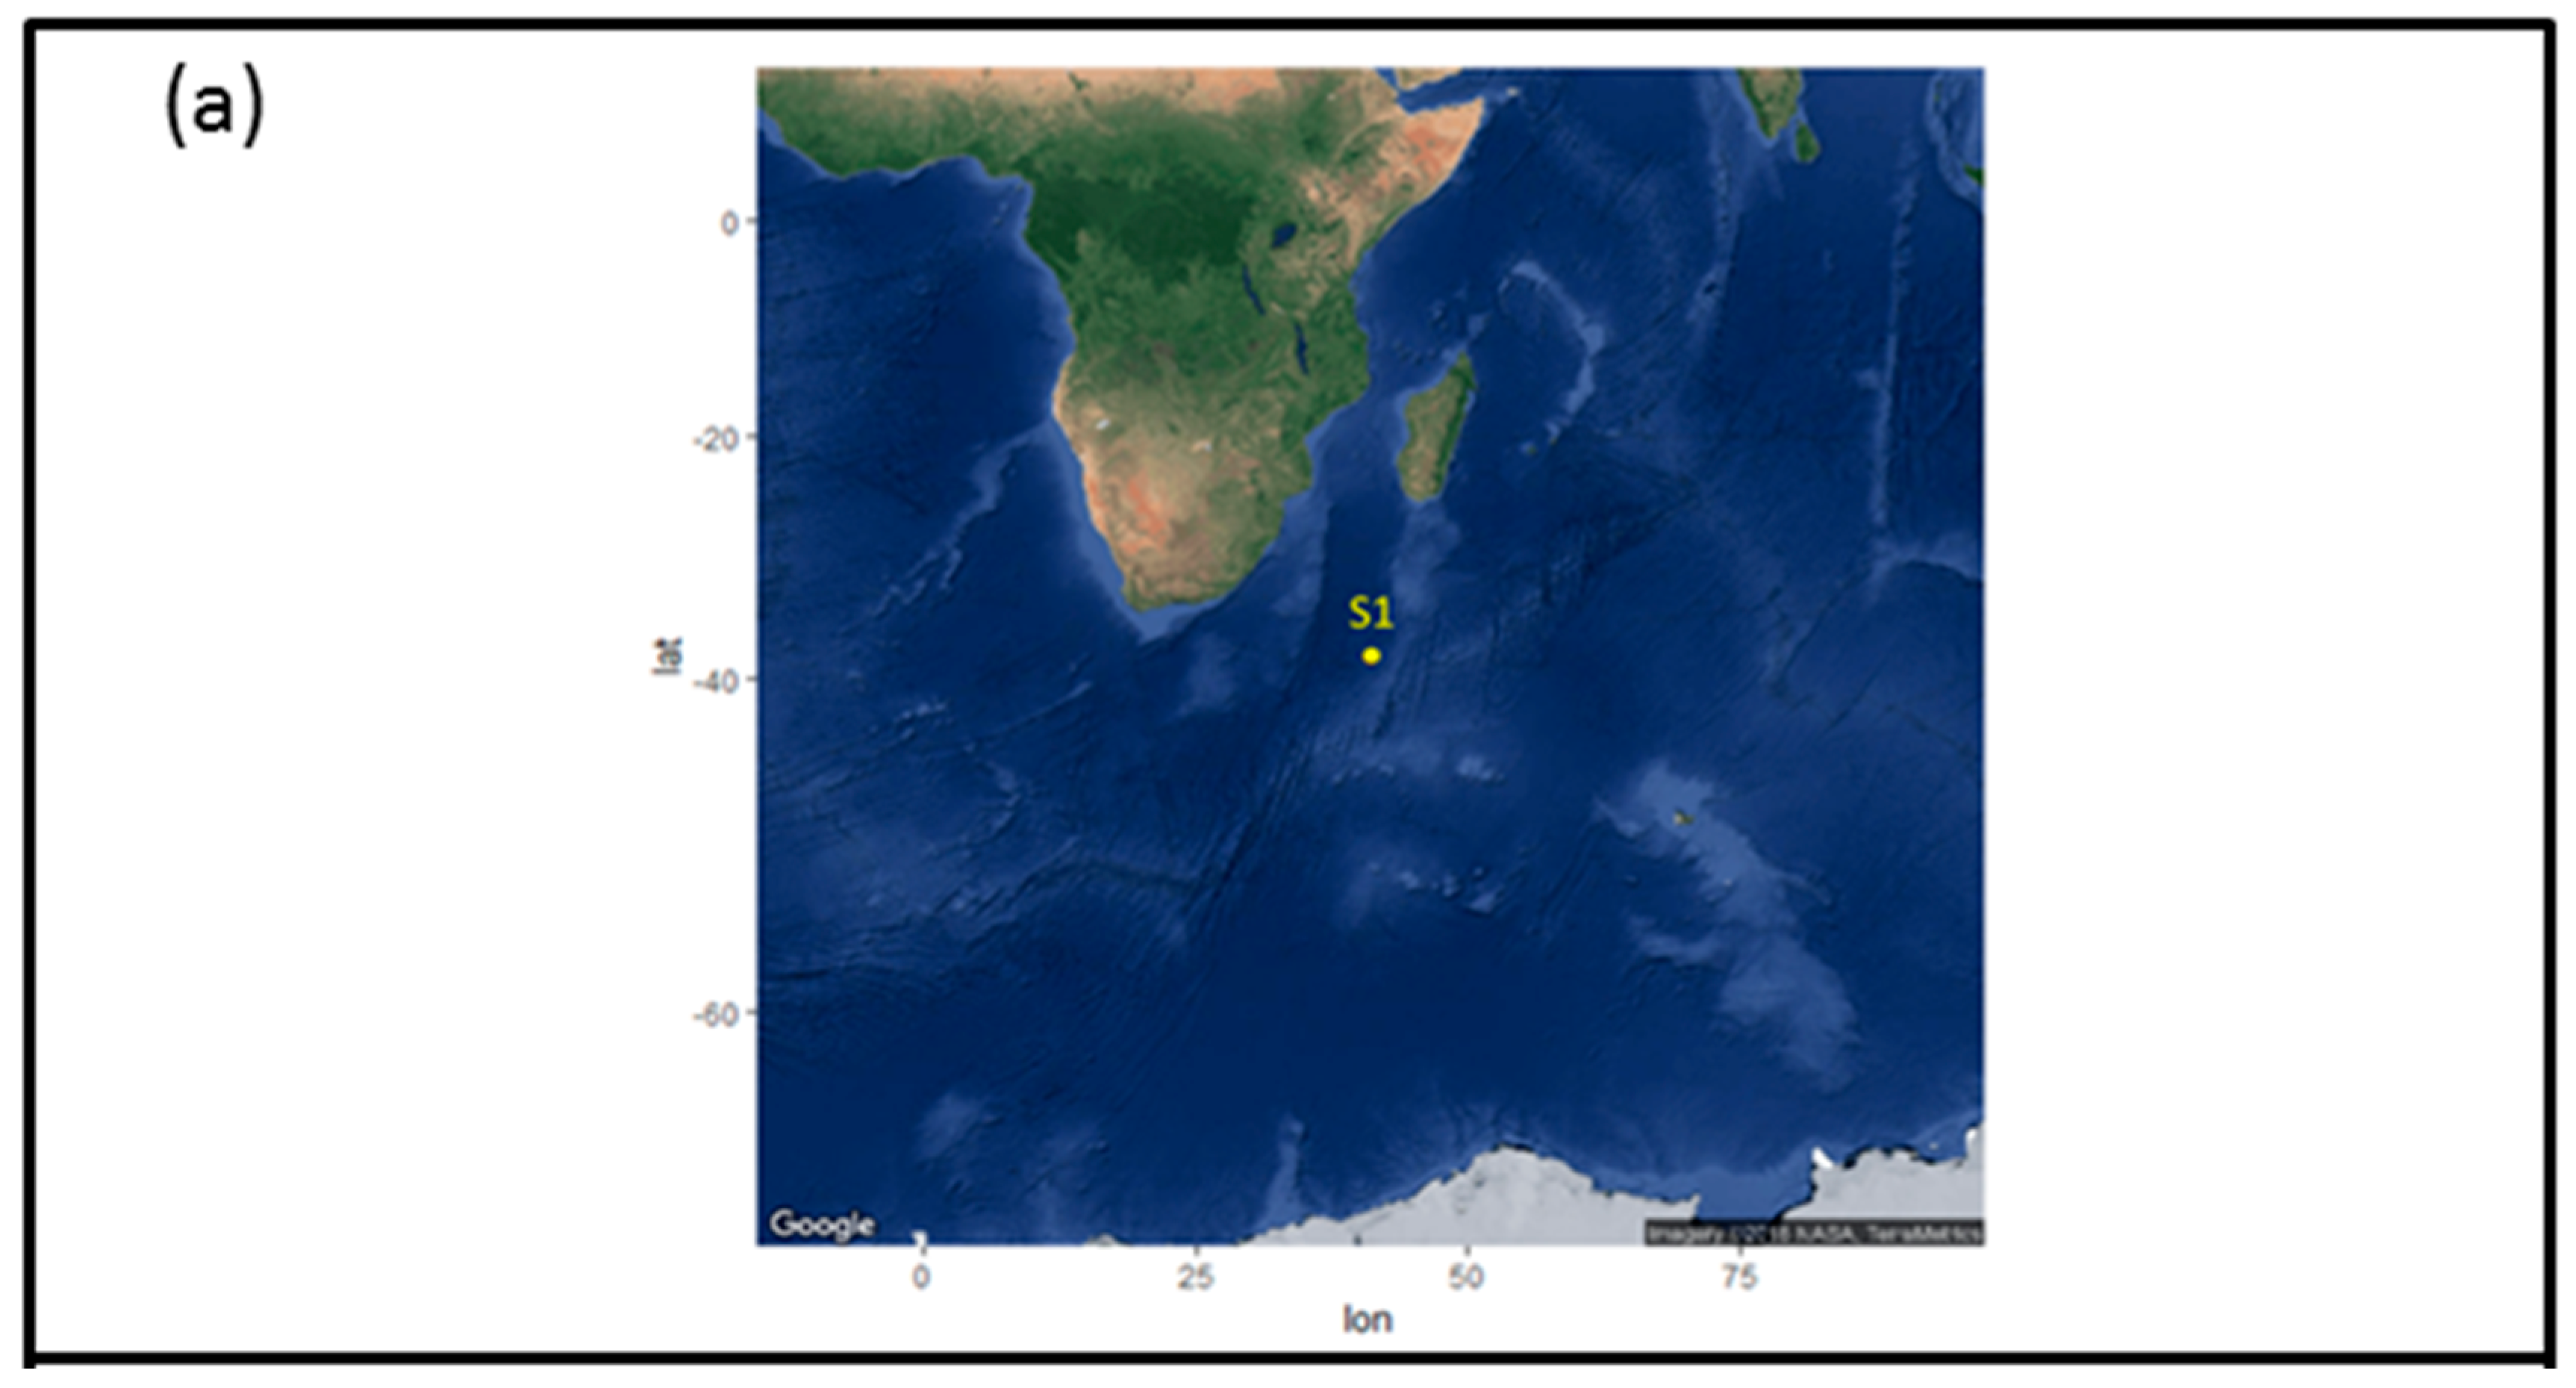
2.1. Sample Collection
2.2. DNA Extraction, Preparation and Sequencing of the >0.45 µm Fraction
2.3. DNA Extraction, Preparation and Sequencing of the <0.45 µm Fraction
2.4. Bioinformatics Pipeline for the Prokaryotic (16S) and Eukaryotic (18S) Amplicon
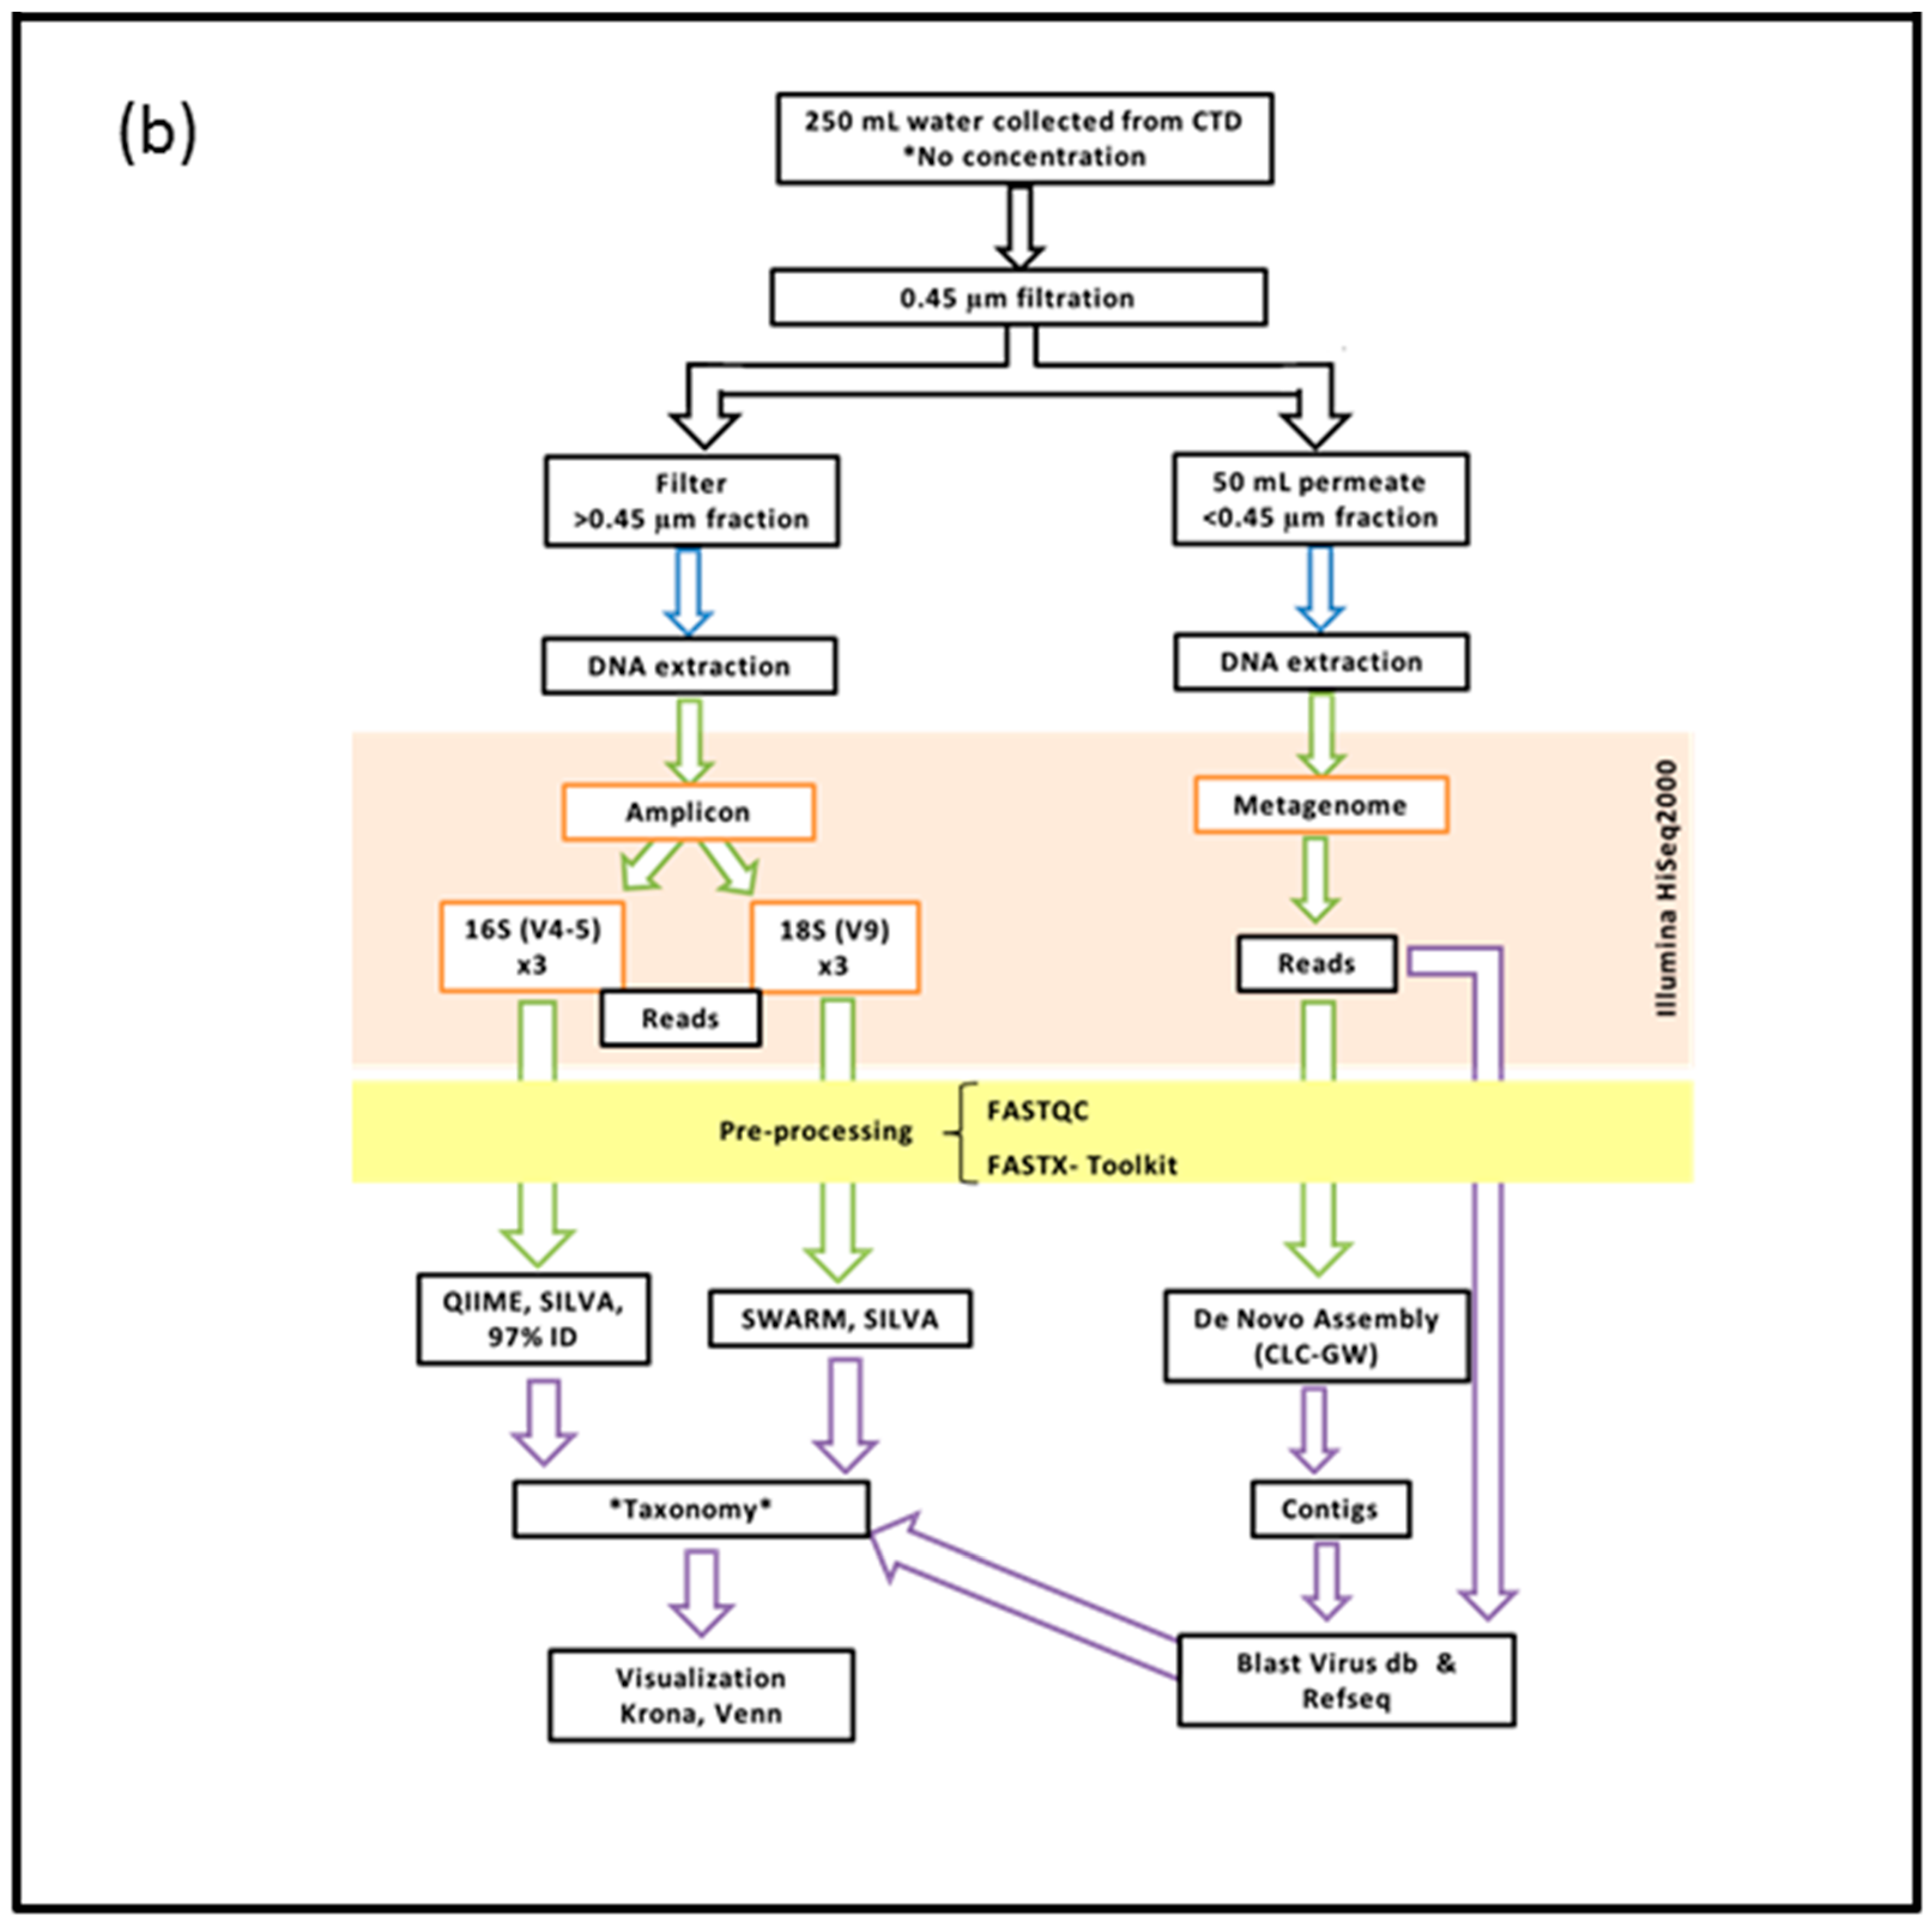
2.5. Bioinformatics Pipeline of the <0.45 µm Fraction (Metagenome)
2.6. Visualization of Community Diversity
2.7. Filters Applied to Annotated Datasets
3. Results
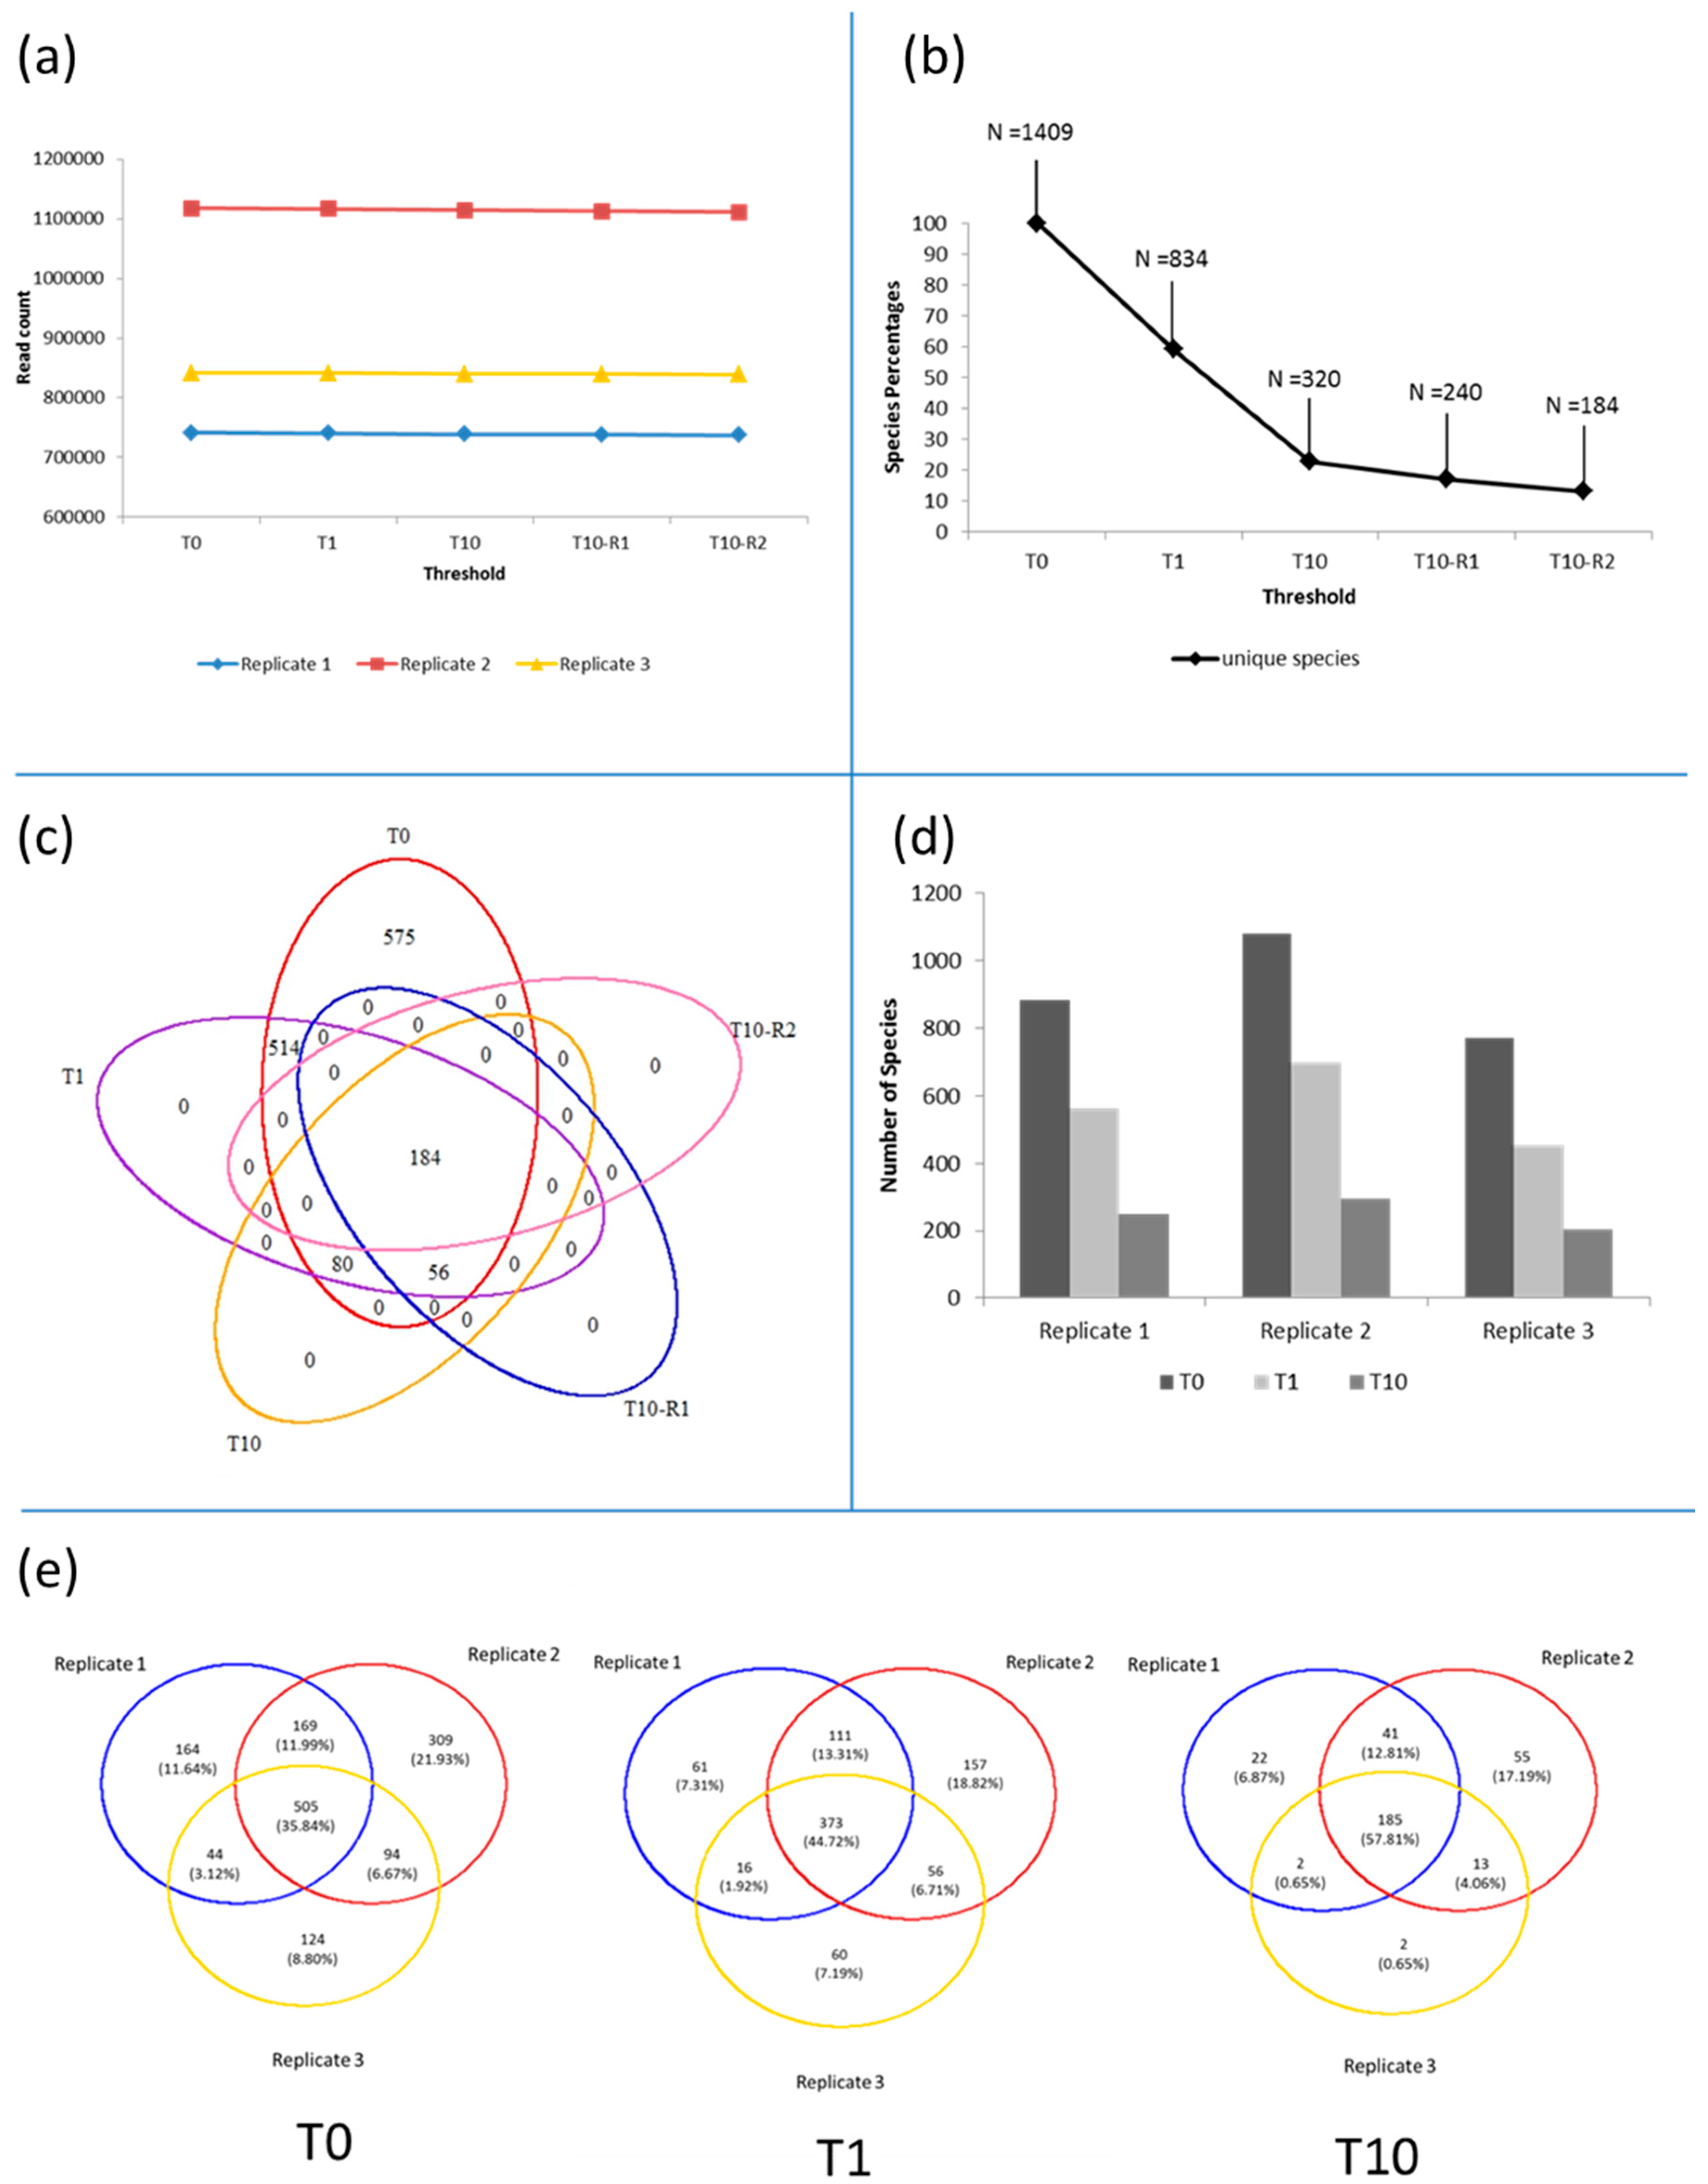
3.1. Microbiota in the >0.45 µm Fraction
3.2. Diversity and Community Structure of the >0.45 µm Fraction
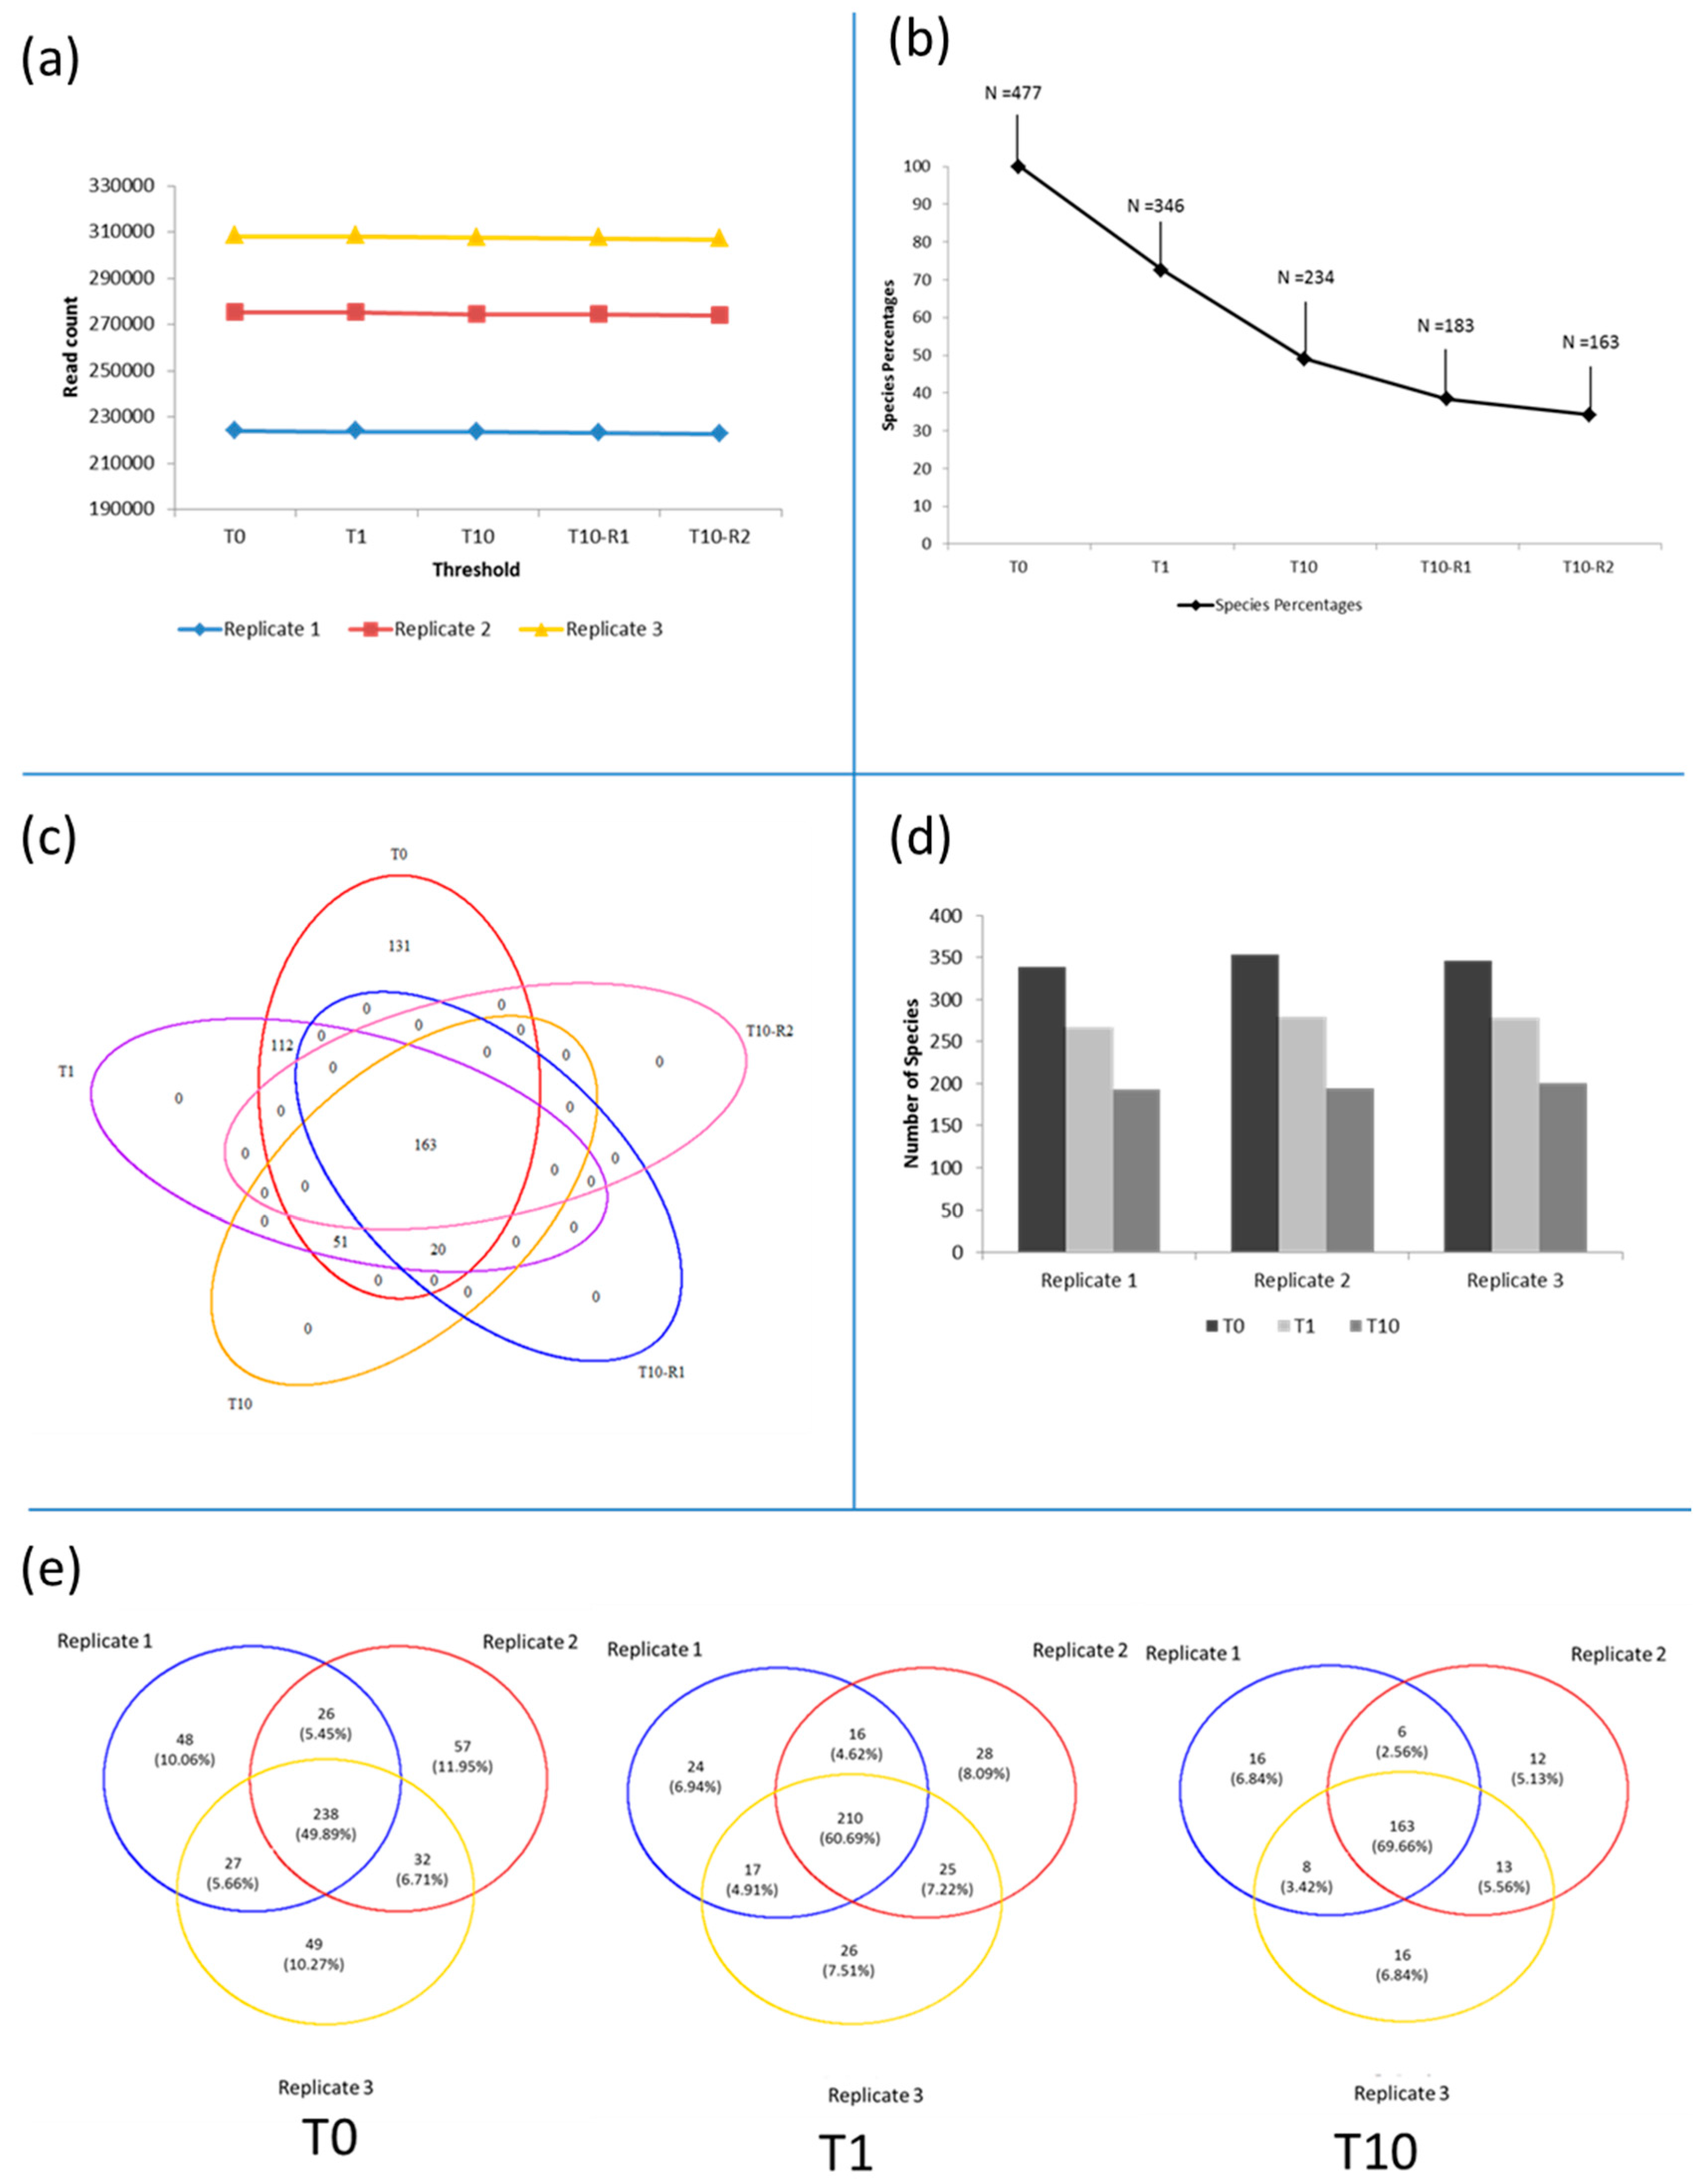
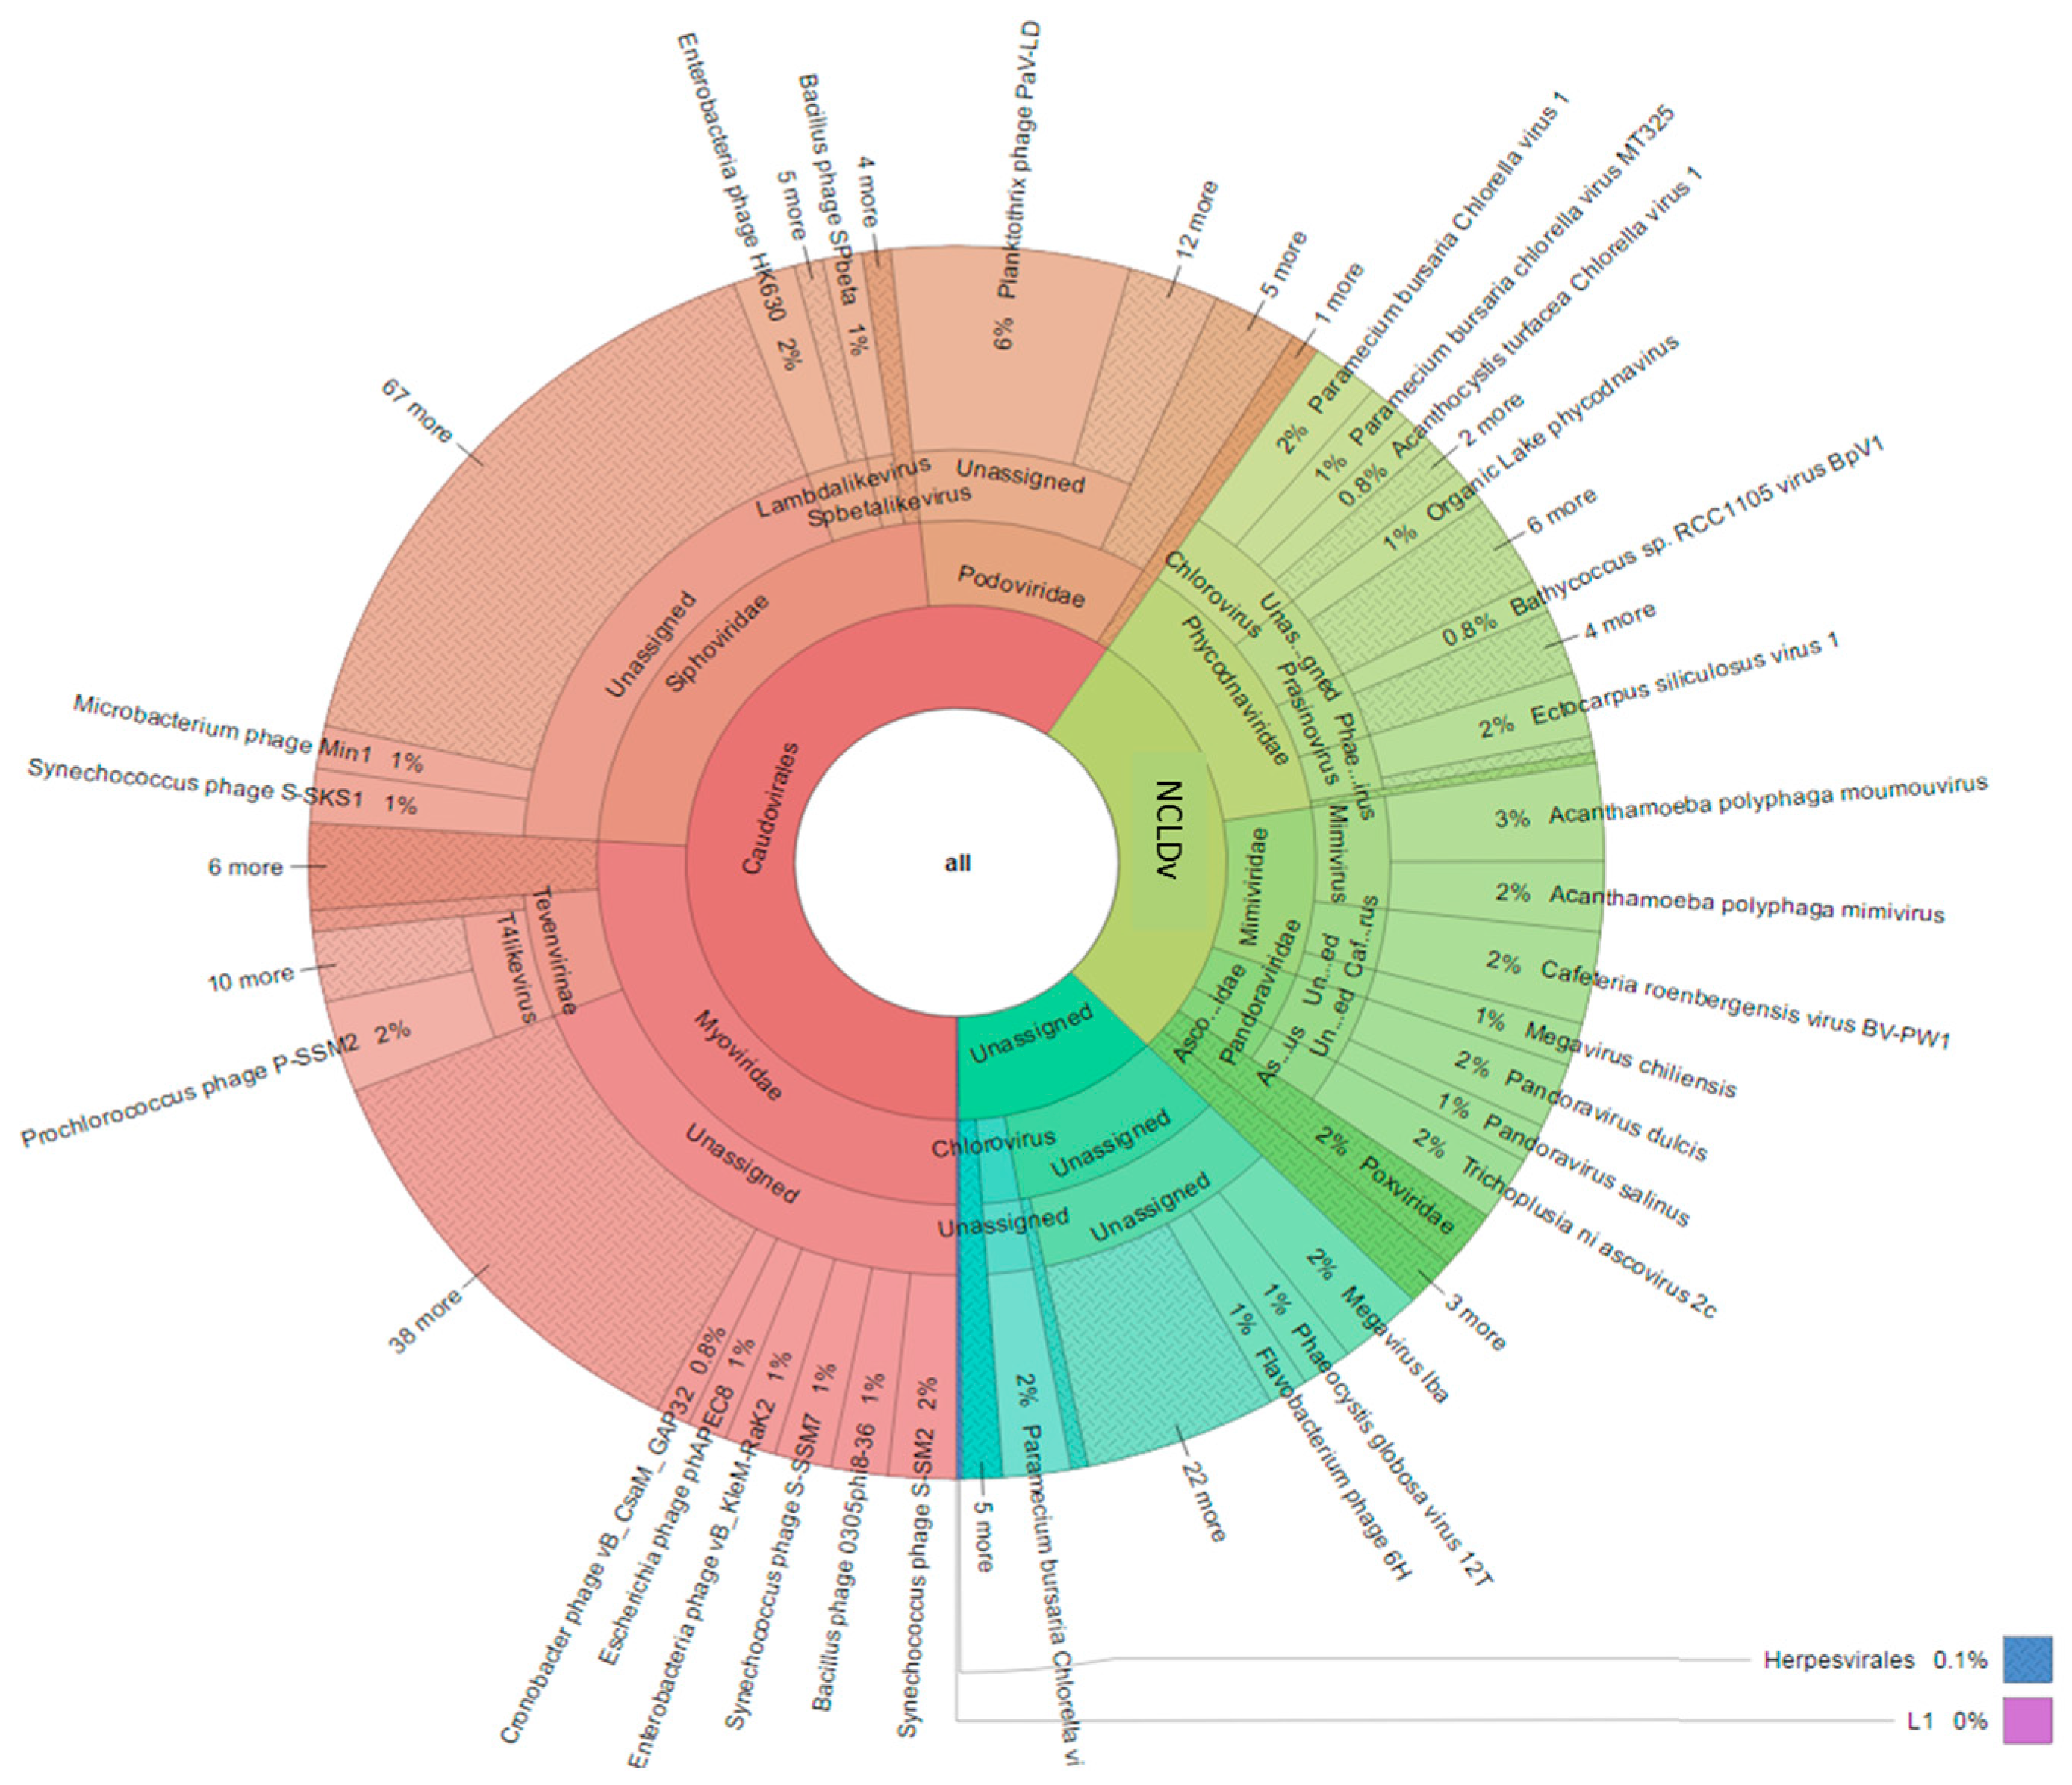
3.3. Diversity of the <0.45 µm Fraction
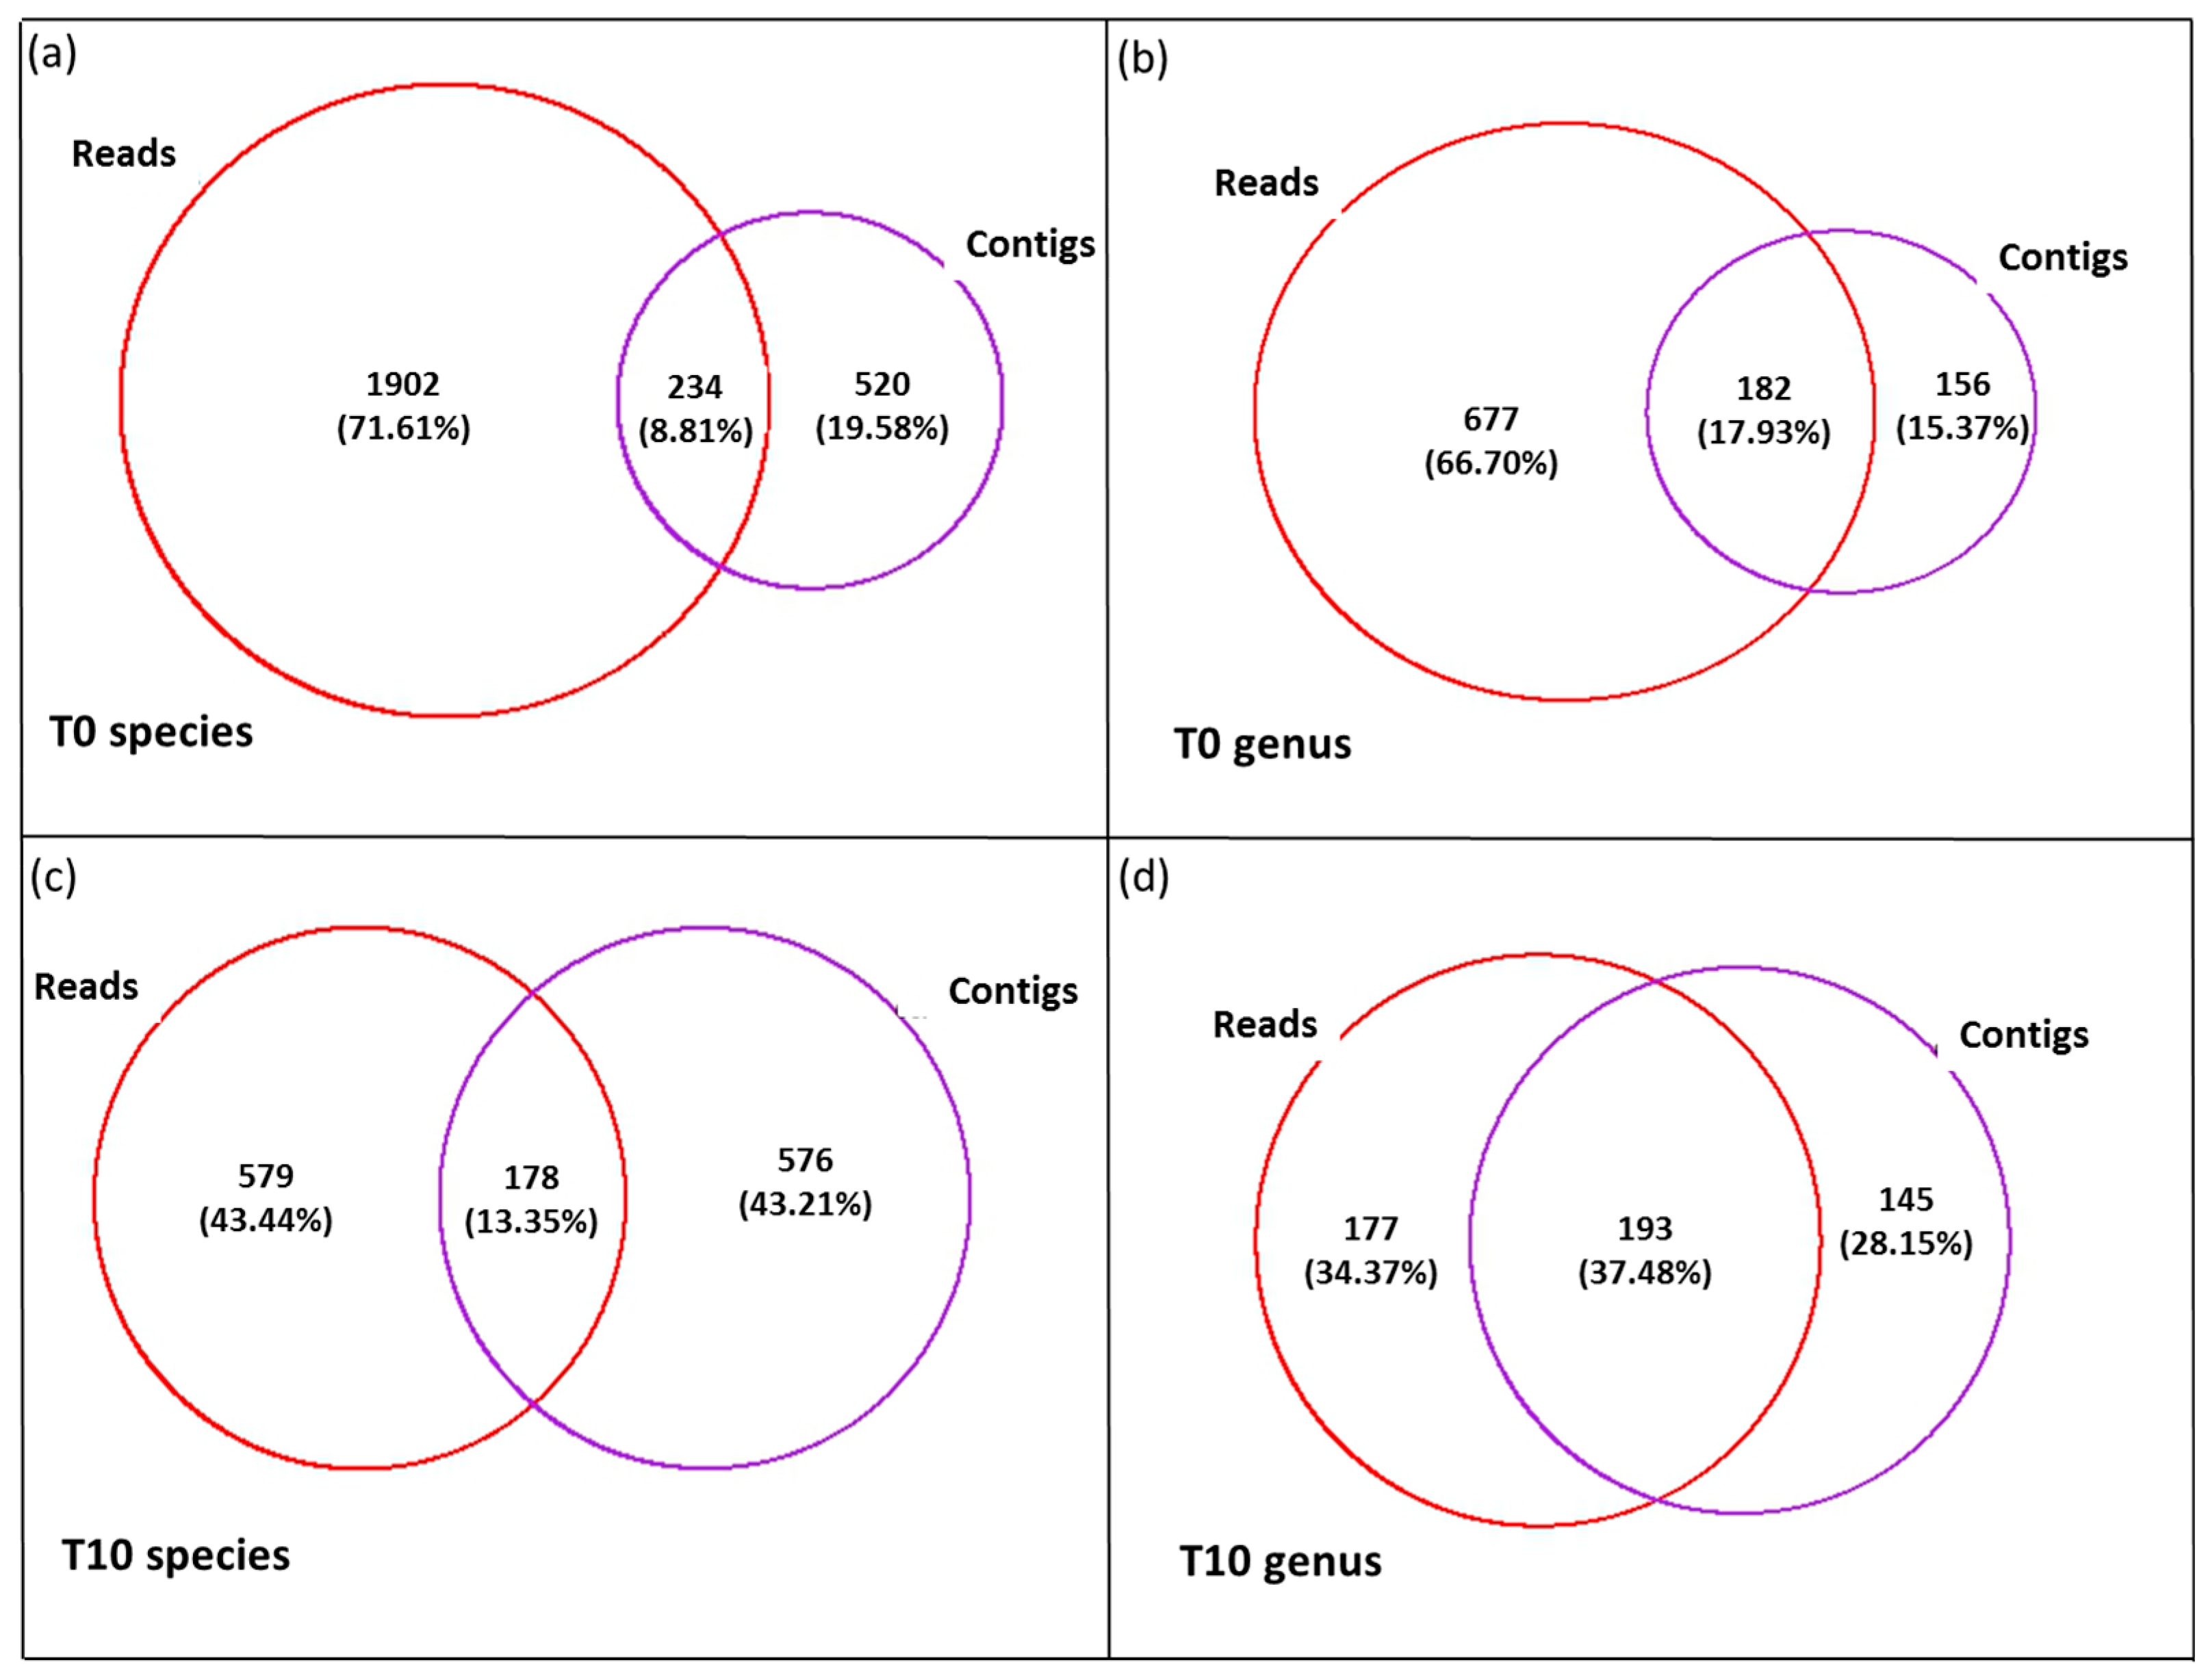
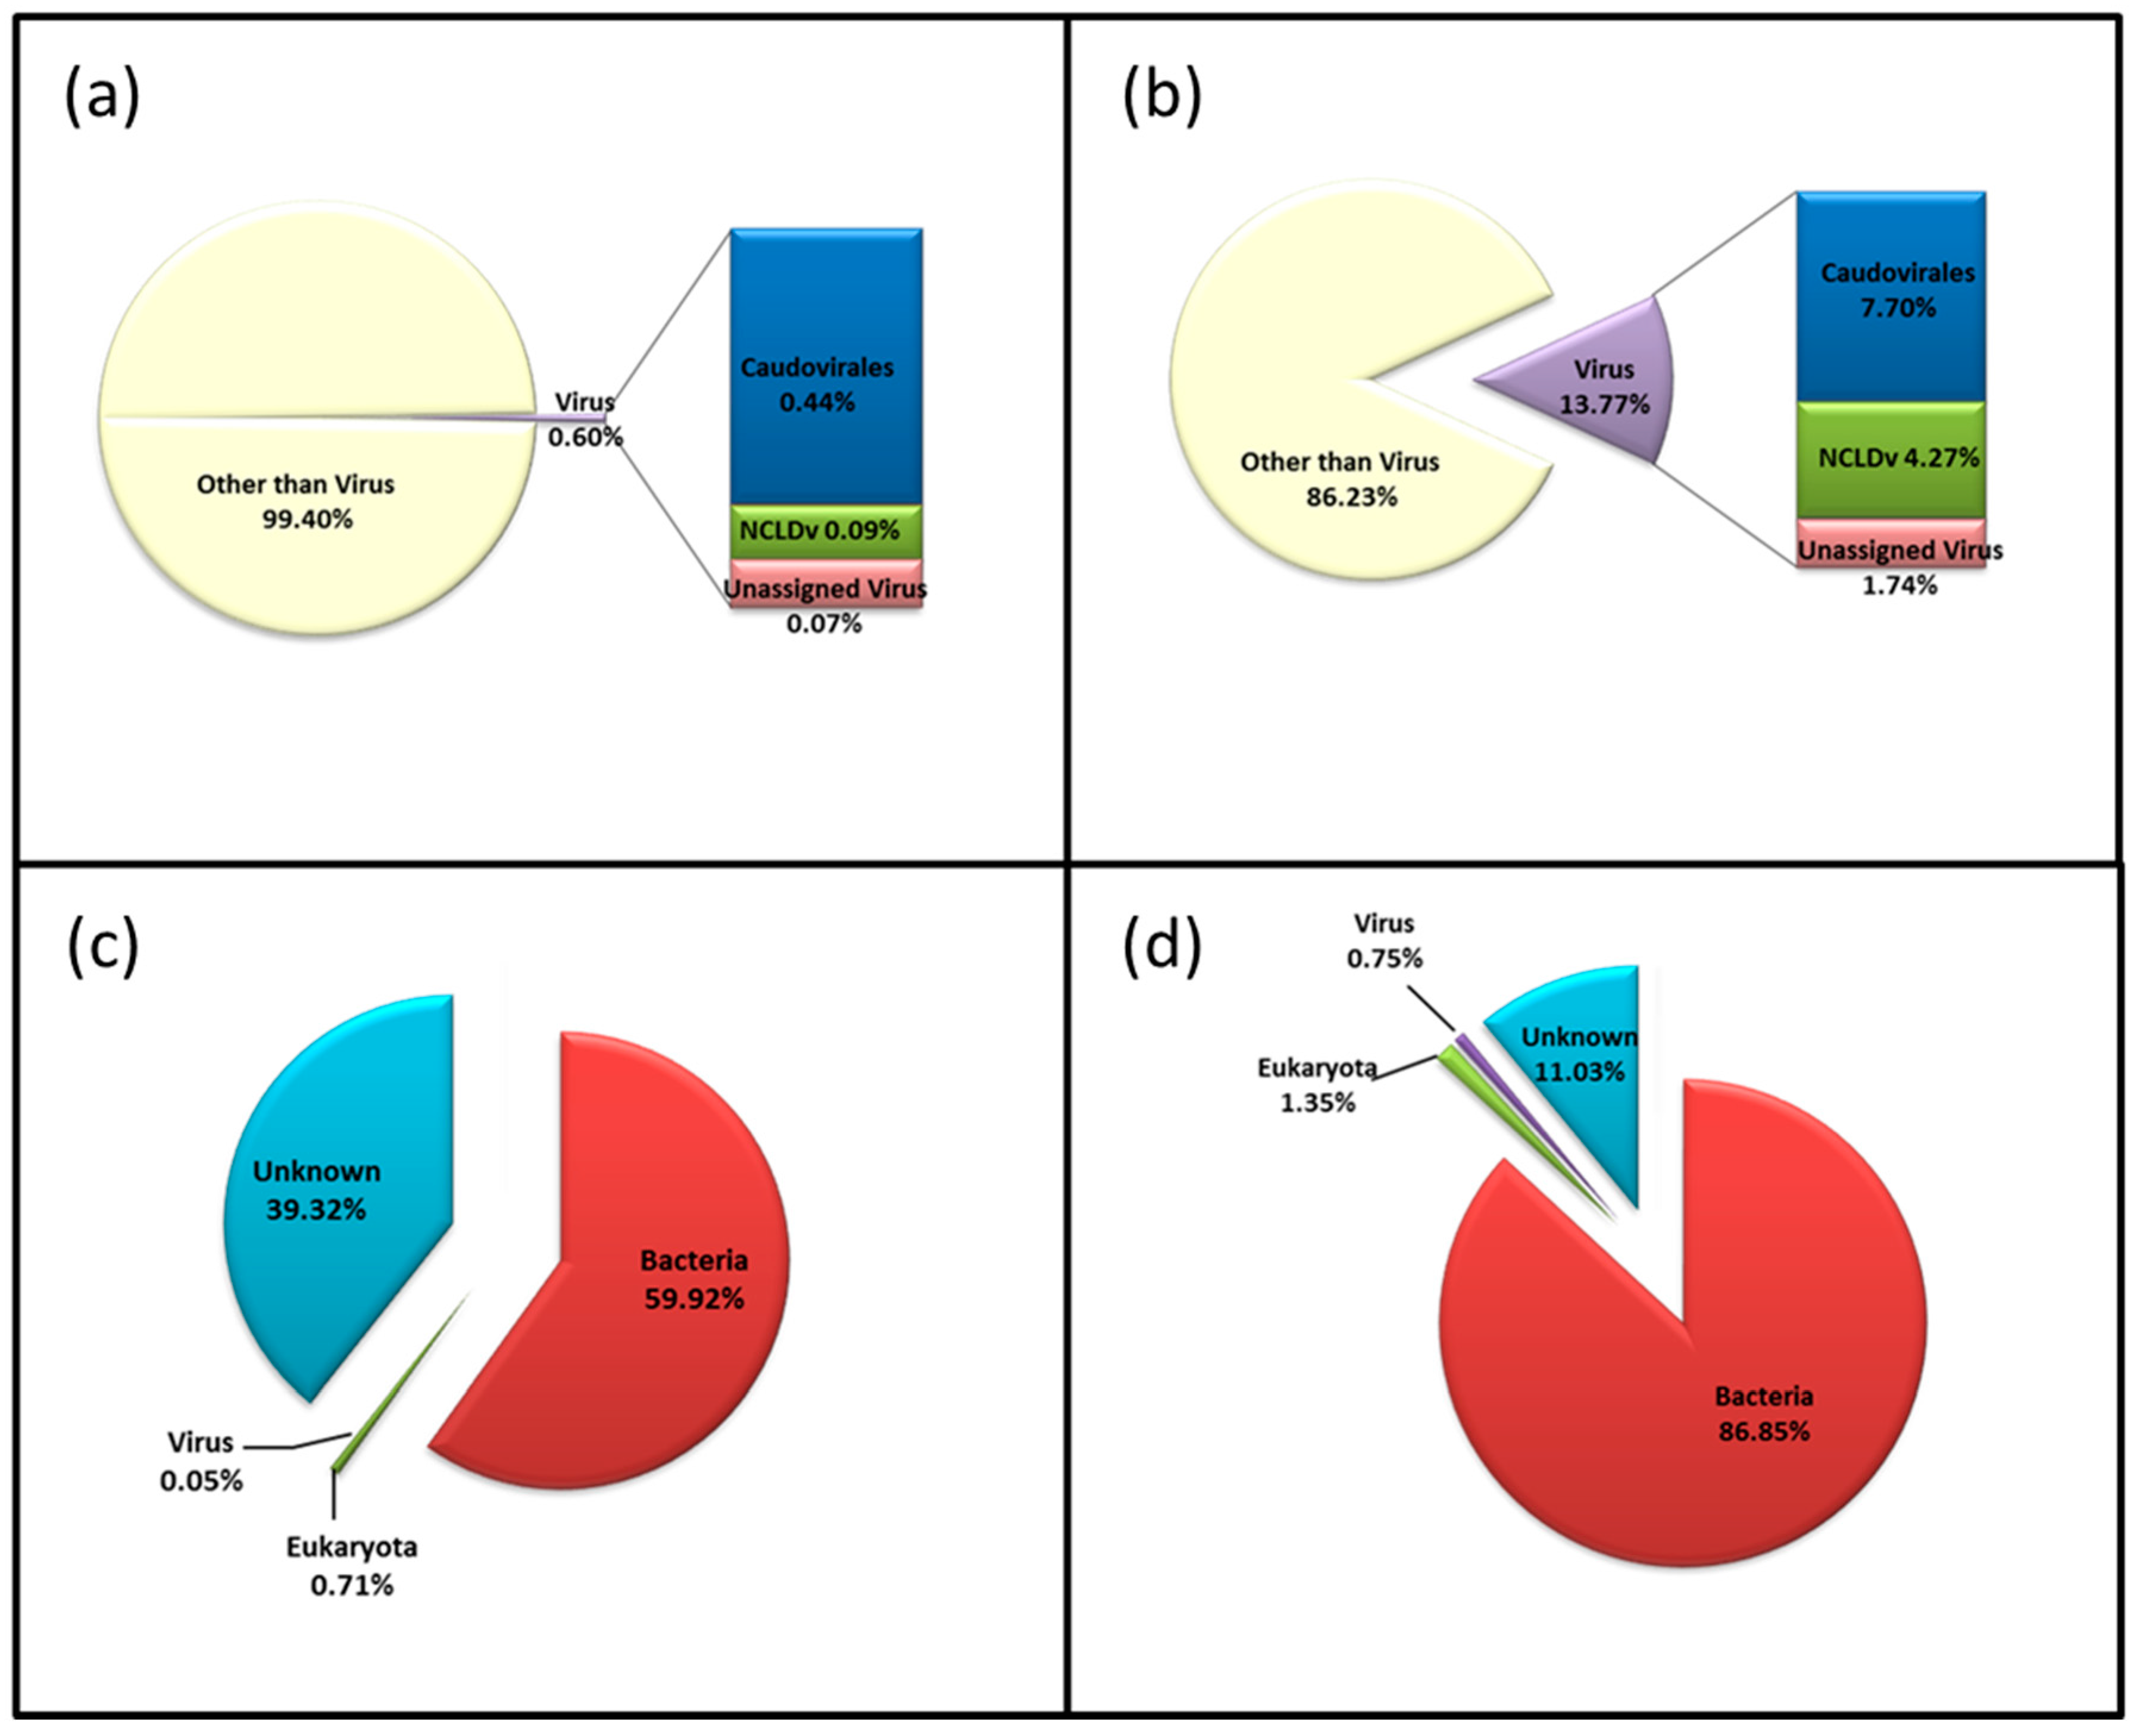
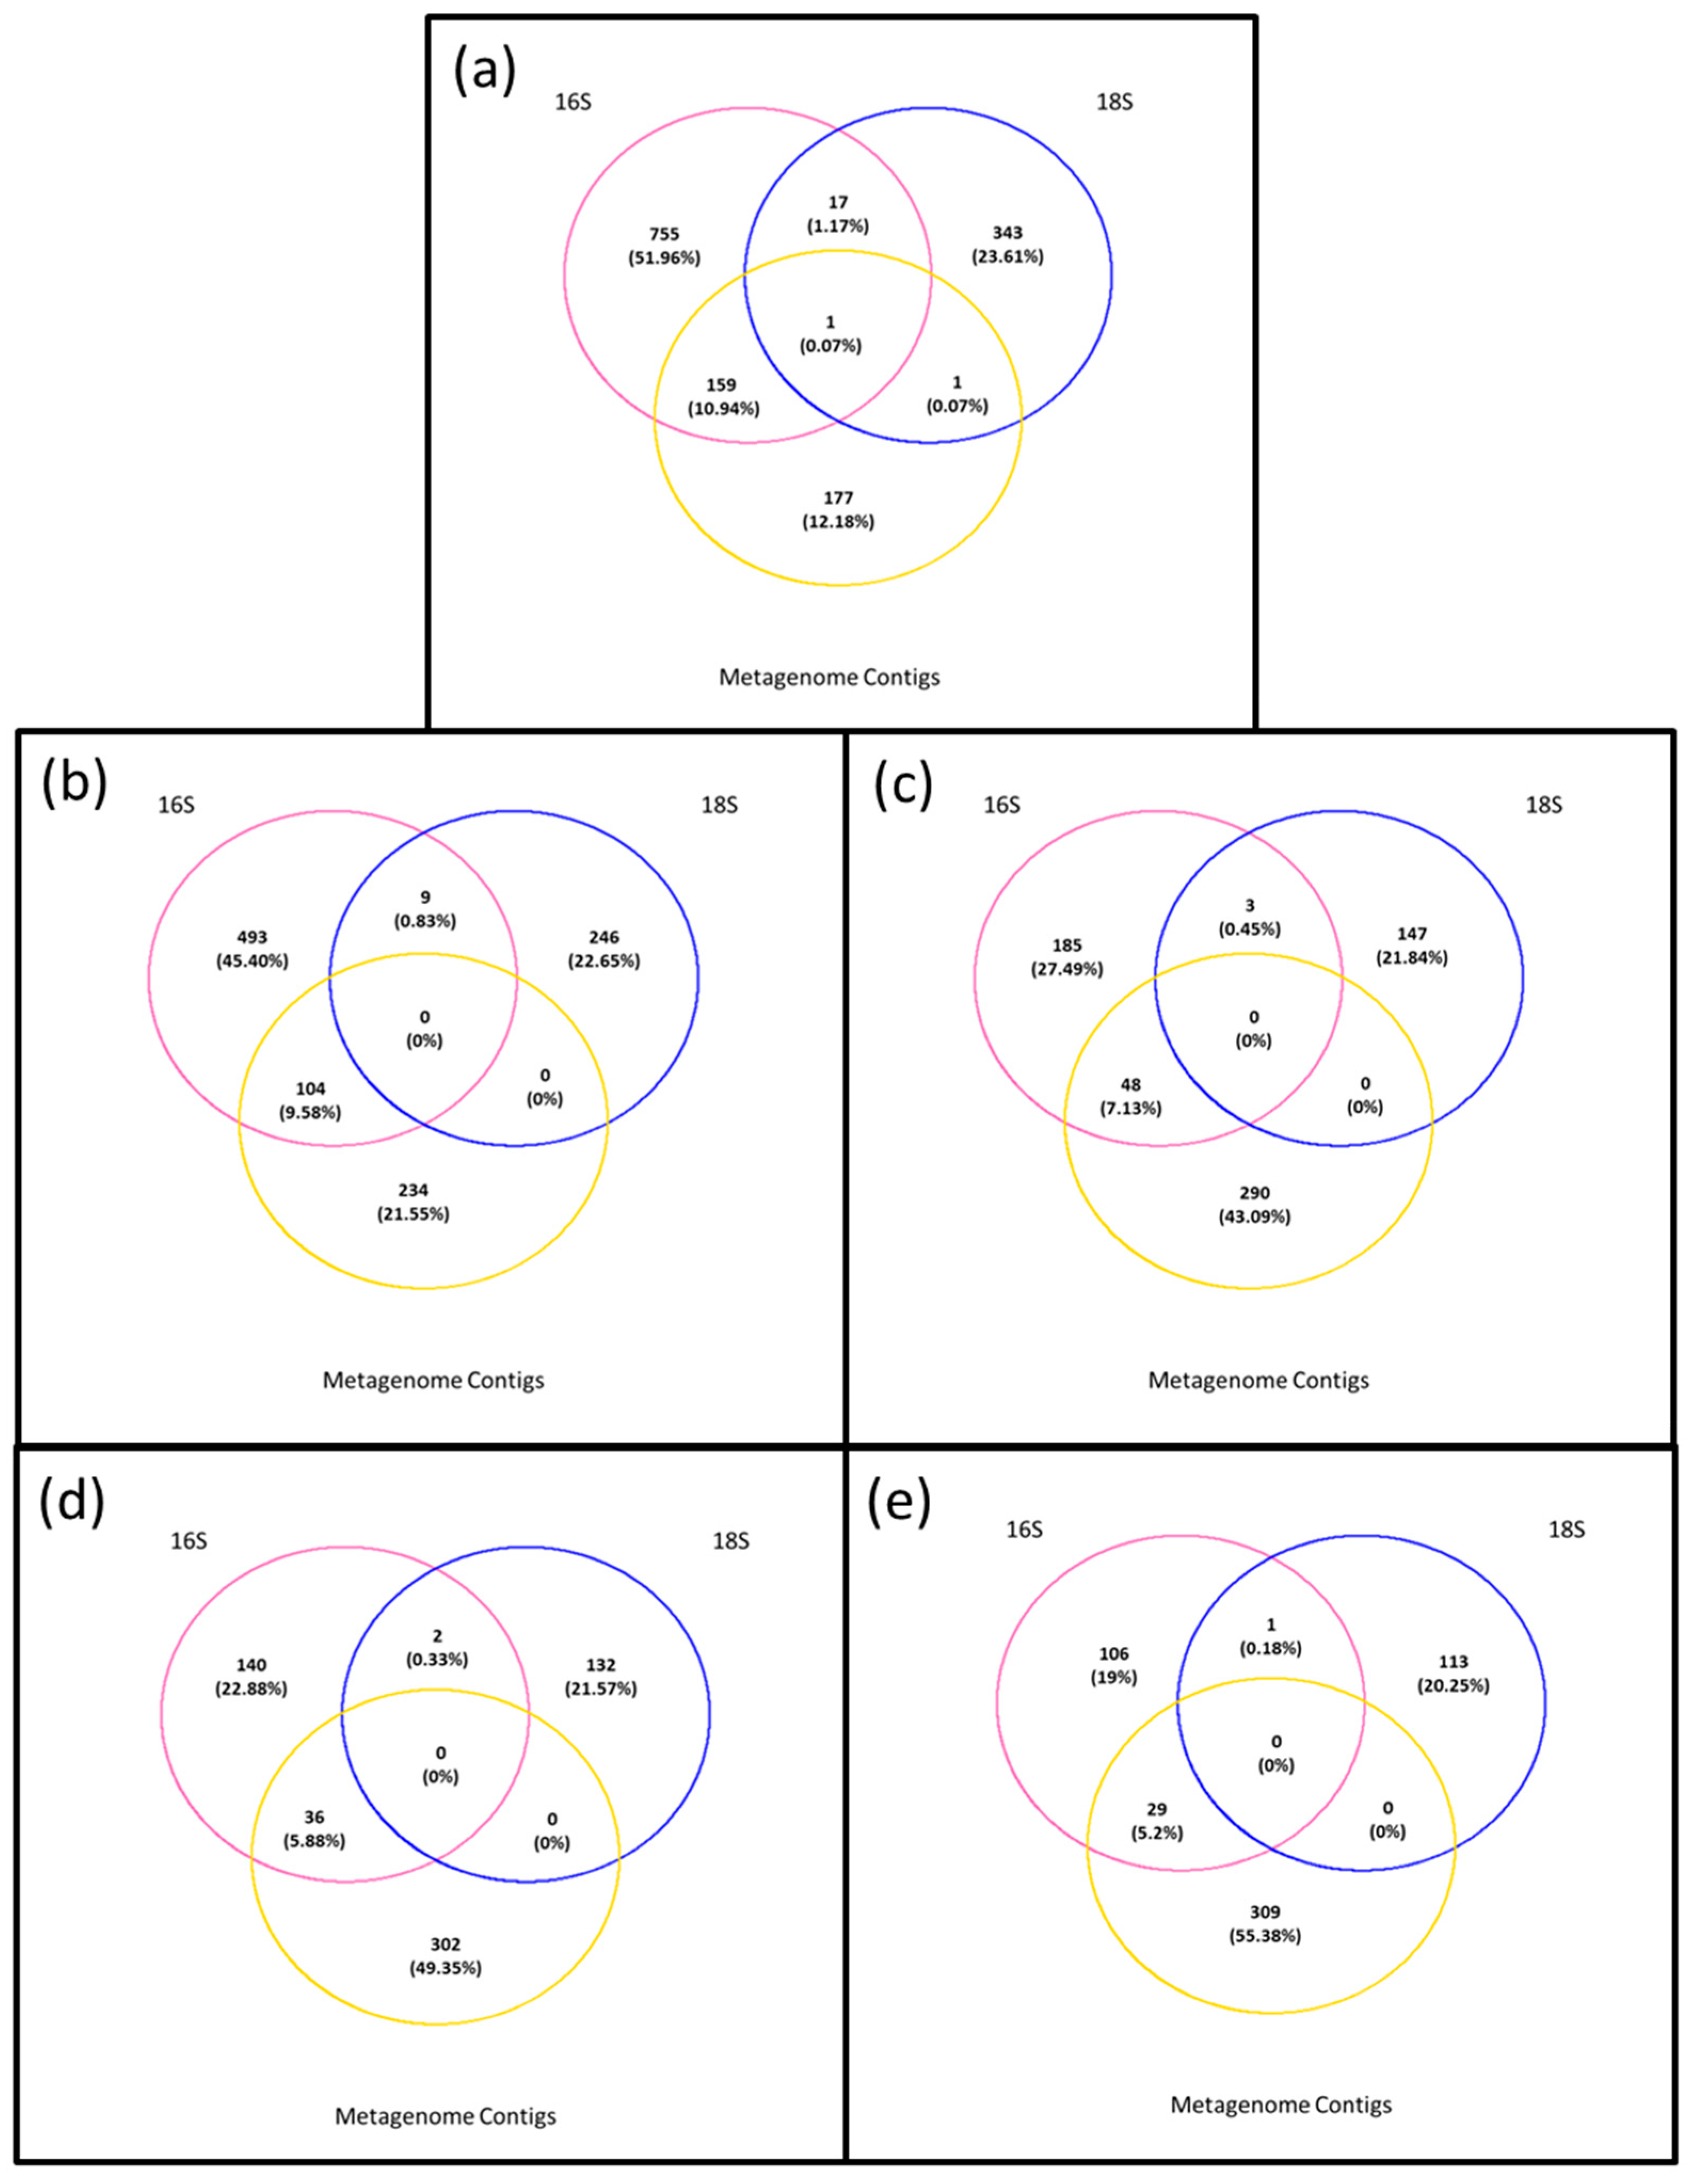
3.4. Composition of Biota of the <0.45 µm versus the >0.45 µm Fraction
4. Discussion
5. Conclusions
Supplementary Materials
Acknowledgments
Author Contributions
Conflicts of Interest
References
- De Wit, R.; Bouvier, T. ‘Everything is everywhere, but, the environment selects’; what did baas becking and beijerinck really say? Environ. Microbiol. 2006, 8, 755–758. [Google Scholar] [CrossRef] [PubMed]
- Angly, F.E.; Felts, B.; Breitbart, M.; Salamon, P.; Edwards, R.A.; Carlson, C.; Chan, A.M.; Haynes, M.; Kelley, S.; Liu, H.; et al. The marine viromes of four oceanic regions. PLoS Biol. 2006, 4, e368. [Google Scholar] [CrossRef] [PubMed]
- Breitbart, M.; Rohwer, F. Here a virus, there a virus, everywhere the same virus? Trends Microbiol. 2005, 13, 278–284. [Google Scholar] [CrossRef] [PubMed]
- Williamson, S.J.; Allen, L.Z.; Lorenzi, H.A.; Fadrosh, D.W.; Brami, D.; Thiagarajan, M.; McCrow, J.P.; Tovchigrechko, A.; Yooseph, S.; Venter, J.C. Metagenomic exploration of viruses throughout the indian ocean. PLos ONE 2012, 7, e42047. [Google Scholar] [CrossRef] [PubMed]
- Williamson, S.J.; Rusch, D.B.; Yooseph, S.; Halpern, A.L.; Heidelberg, K.B.; Glass, J.I.; Andrews-Pfannkoch, C.; Fadrosh, D.; Miller, C.S.; Sutton, G.; et al. The sorcerer ii global ocean sampling expedition: Metagenomic characterization of viruses within aquatic microbial samples. PLos ONE 2008, 3, e1456. [Google Scholar] [CrossRef] [PubMed]
- Ackermann, H.W. Bacteriophage observations and evolution. Res. Microbiol. 2003, 154, 245–251. [Google Scholar] [CrossRef]
- de Vargas, C.; Audic, S.; Henry, N.; Decelle, J.; Mahé, F.; Logares, R.; Lara, E.; Berney, C.; Le Bescot, N.; Probert, I.; et al. Eukaryotic plankton diversity in the sunlit ocean. Science 2015, 348. [Google Scholar] [CrossRef]
- Sunagawa, S.; Coelho, L.P.; Chaffron, S.; Kultima, J.R.; Labadie, K.; Salazar, G.; Djahanschiri, B.; Zeller, G.; Mende, D.R.; Alberti, A.; et al. Structure and function of the global ocean microbiome. Science 2015, 348. [Google Scholar] [CrossRef] [PubMed]
- Brum, J.R.; Hurwitz, B.L.; Schofield, O.; Ducklow, H.W.; Sullivan, M.B. Seasonal time bombs: Dominant temperate viruses affect southern ocean microbial dynamics. ISME J. 2016, 10, 437–449. [Google Scholar] [CrossRef] [PubMed]
- Brum, J.R.; Ignacio-Espinoza, J.C.; Roux, S.; Doulcier, G.; Acinas, S.G.; Alberti, A.; Chaffron, S.; Cruaud, C.; de Vargas, C.; Gasol, J.M.; et al. Patterns and ecological drivers of ocean viral communities. Science 2015, 348. [Google Scholar] [CrossRef] [PubMed]
- Mihara, T.; Nishimura, Y.; Shimizu, Y.; Nishiyama, H.; Yoshikawa, G.; Uehara, H.; Hingamp, P.; Goto, S.; Ogata, H. Linking virus genomes with host taxonomy. Viruses 2016, 8, 66. [Google Scholar] [CrossRef] [PubMed]
- Horiguchi, T. Diversity and phylogeny of marine parasitic dinoflagellates. In Marine Protists: Diversity and Dynamics; Ohtsuka, S., Suzaki, T., Horiguchi, T., Suzuki, N., Not, F., Eds.; Springer: Japan, Tokyo, 2015; pp. 397–419. [Google Scholar]
- Hurwitz, B.L.; Sullivan, M.B. The pacific ocean virome (pov): A marine viral metagenomic dataset and associated protein clusters for quantitative viral ecology. PLos ONE 2013, 8, e57355. [Google Scholar]
- Lima-Mendez, G.; Faust, K.; Henry, N.; Decelle, J.; Colin, S.; Carcillo, F.; Chaffron, S.; Ignacio-Espinosa, J.C.; Roux, S.; Vincent, F.; et al. Determinants of community structure in the global plankton interactome. Science 2015, 348. [Google Scholar] [CrossRef] [PubMed]
- Hoeijmakers, W.A.M.; Bartfai, R.; Francoijs, K.-J.; Stunnenberg, H.G. Linear amplification for deep sequencing. Nat. Protocols 2011, 6, 1026–1036. [Google Scholar] [CrossRef] [PubMed]
- John, S.G.; Mendez, C.B.; Deng, L.; Poulos, B.; Kauffman, A.K.M.; Kern, S.; Brum, J.; Polz, M.F.; Boyle, E.A.; Sullivan, M.B. A simple and efficient method for concentration of ocean viruses by chemical flocculation. Environ. Microbiol. Rep. 2011, 3, 195–202. [Google Scholar] [CrossRef] [PubMed]
- Claverie, J.-M.; Ogata, H.; Audic, S.; Abergel, C.; Suhre, K.; Fournier, P.-E. Mimivirus and the emerging concept of “giant” virus. Virus Res. 2006, 117, 133–144. [Google Scholar] [CrossRef] [PubMed]
- Martínez, J.M.; Swan, B.K.; Wilson, W.H. Marine viruses, a genetic reservoir revealed by targeted viromics. ISME J. 2014, 8, 1079–1088. [Google Scholar] [CrossRef] [PubMed]
- Legendre, M.; Bartoli, J.; Shmakova, L.; Jeudy, S.; Labadie, K.; Adrait, A.; Lescot, M.; Poirot, O.; Bertaux, L.; Bruley, C.; et al. Thirty-thousand-year-old distant relative of giant icosahedral DNA viruses with a pandoravirus morphology. Proc. Natl. Acad. Sci. USA 2014, 111, 4274–4279. [Google Scholar] [CrossRef] [PubMed]
- Jiang, S.C.; Paul, J.H. Viral contribution to dissolved DNA in the marine environment as determined by differential centrifugation and kingdom probing. Appl. Environ. Microbiol. 1995, 61, 317–325. [Google Scholar] [PubMed]
- Creer, S.; Deiner, K.; Frey, S.; Porazinska, D.; Taberlet, P.; Thomas, W.K.; Potter, C.; Bik, H.M. The ecologist’s field guide to sequence-based identification of biodiversity. Methods Ecol. Evol. 2016, 7, 1008–1018. [Google Scholar] [CrossRef]
- Dejean, T.; Valentini, A.; Miquel, C.; Taberlet, P.; Bellemain, E.; Miaud, C. Improved detection of an alien invasive species through environmental DNA barcoding: The example of the american bullfrog lithobates catesbeianus. J. Appl. Ecol. 2012, 49, 953–959. [Google Scholar] [CrossRef]
- Ikeda, K.; Doi, H.; Tanaka, K.; Kawai, T.; Negishi, J.N. Using environmental DNA to detect an endangered crayfish cambaroides japonicus in streams. Conserv. Genet. Resour. 2016, 8, 231–234. [Google Scholar] [CrossRef]
- The great southern coccolithophore belt. Available online: http://www.Bco-dmo.Org/project/473206 (accessed on 13 March 2017).
- Loecher, M.; Ropkins, K. Rgooglemaps and loa: Unleashing r graphics power on map tiles. J. Stat. Softw. 2015, 63, 1–18. [Google Scholar] [CrossRef]
- Caporaso, J.G.; Paszkiewicz, K.; Field, D.; Knight, R.; Gilbert, J.A. The western english channel contains a persistent microbial seed bank. ISME J. 2012, 6, 1089–1093. [Google Scholar] [CrossRef] [PubMed]
- Stoeck, T.; Bass, D.; Nebel, M.; Christen, R.; Jones, M.D.M.; Breiner, H.-W.; Richards, T.A. Multiple marker parallel tag environmental DNA sequencing reveals a highly complex eukaryotic community in marine anoxic water. Mol. Ecol. 2010, 19, 21–31. [Google Scholar] [CrossRef] [PubMed]
- A quality control tool for high throughput sequence data. Available online: http://www.Bioinformatics.Babraham.Ac.Uk/projects/fastqc/ (accessed on 13 March 2017).
- Fastx-toolkit. Available online: http://hannonlab.Cshl.Edu/fastx_toolkit/ (accessed on 13 March 2017).
- Qiime-Quantitative Insights Into Microbial Ecology. Available online: http://qiime.Org (accessed on 13 March 2017).
- Mahé, F.; Rognes, T.; Quince, C.; de Vargas, C.; Dunthorn, M. Swarm: Robust and fast clustering method for amplicon-based studies. PeerJ 2014, 2, e593. [Google Scholar] [CrossRef] [PubMed]
- Silva rrna database project. Available online: https://www.Arb-silva.De (accessed on 13 March 2017).
- Altschul, S.F.; Gish, W.; Miller, W.; Myers, E.W.; Lipman, D.J. Basic local alignment search tool. J. Mol. Biol. 1990, 215, 403–410. [Google Scholar] [CrossRef]
- Tatusova, T.; Ciufo, S.; Fedorov, B.; O’Neill, K.; Tolstoy, I. Refseq microbial genomes database: New representation and annotation strategy. Nucleic Acids Res. 2014, 42, D553–D559. [Google Scholar] [CrossRef] [PubMed]
- Ondov, B.D.; Bergman, N.H.; Phillippy, A.M. Interactive metagenomic visualization in a web browser. BMC Bioinform. 2011, 12, 385. [Google Scholar] [CrossRef] [PubMed]
- Quast, C.; Pruesse, E.; Yilmaz, P.; Gerken, J.; Schweer, T.; Yarza, P.; Peplies, J.; Glöckner, F.O. The silva ribosomal rna gene database project: Improved data processing and web-based tools. Nucleic Acids Res. 2013, 41, D590–D596. [Google Scholar] [CrossRef] [PubMed]
- Fuhrman, J.A. Microbial community structure and its functional implications. Nature 2009, 459, 193–199. [Google Scholar] [CrossRef] [PubMed]
- Zinger, L.; Gobet, A.; Pommier, T. Two decades of describing the unseen majority of aquatic microbial diversity. Mol. Ecol. 2012, 21, 1878–1896. [Google Scholar] [CrossRef] [PubMed]
- Marine ecology: Ocean survey finds huge diversity. Nature 2015, 521, 396.
- Dorigo, U.; Fontvieille, D.; Humbert, J.-F. Spatial variability in the abundance and composition of the free-living bacterioplankton community in the pelagic zone of lake bourget (france). FEMS Microbiol. Ecol. 2006, 58, 109–119. [Google Scholar] [CrossRef] [PubMed]
- Ghiglione, J.-F.; Larcher, M.; Lebaron, P. Spatial and temporal scales of variation in bacterioplankton community structure in the nw mediterranean sea. Aquat. Microb. Ecol. 2005, 40, 229–240. [Google Scholar] [CrossRef]
- Brum, J.R.; Culley, A.I.; Steward, G.F. Assembly of a marine viral metagenome after physical fractionation. PLos ONE 2013, 8, e60604. [Google Scholar] [CrossRef] [PubMed]
- Breitbart, M.; Salamon, P.; Andresen, B.; Mahaffy, J.M.; Segall, A.M.; Mead, D.; Azam, F.; Rohwer, F. Genomic analysis of uncultured marine viral communities. Proc. Natl. Acad. Sci. USA 2002, 99, 14250–14255. [Google Scholar] [CrossRef] [PubMed]
- Nagasaki, K. Dinoflagellates, diatoms, and their viruses. J. Microbiol. 2008, 46, 235–243. [Google Scholar] [CrossRef] [PubMed]
- Correa, A.M.S.; Welsh, R.M.; Vega Thurber, R.L. Unique nucleocytoplasmic dsdna and +ssrna viruses are associated with the dinoflagellate endosymbionts of corals. ISME J. 2013, 7, 13–27. [Google Scholar] [CrossRef] [PubMed]
- Tabor, P.S.; Ohwada, K.; Colwell, R.R. Filterable marine bacteria found in the deep sea: Distribution, taxonomy, and response to starvation. Microb. Ecol. 1981, 7, 67–83. [Google Scholar] [CrossRef] [PubMed]
- Chicote, E.; García, A.M.; Moreno, D.A.; Sarró, M.I.; Lorenzo, P.I.; Montero, F. Isolation and identification of bacteria from spent nuclear fuel pools. J. Ind. Microbiol. Biotechnol. 2005, 32, 155–162. [Google Scholar] [CrossRef] [PubMed]
- Iizuka, T.; Yamanaka, S.; Nishiyama, T.; Hiraishi, A. Isolation and phylogenetic analysis of aerobic copiotrophic ultramicrobacteria from urban soil. J. Gen. Appl. Microbiol. 1998, 44, 75–84. [Google Scholar] [CrossRef] [PubMed]


| Fraction | Reads/Contigs | Sequence Length | OTUs and Phylotypes after Applying Filter | |||||||
|---|---|---|---|---|---|---|---|---|---|---|
| T0 | T1 | |||||||||
| OTUs | Phylotypes | OTU | Phylotypes | |||||||
| Prokaryote | 741,033 | 125 | 20,381 | 45,826 1 | 882 | 1409 1 | 11,341 | 23,081 1 | 561 | 834 1 |
| 1,117,576 | 125 | 30,642 | 1077 | 16,593 | 697 | |||||
| 841,639 | 125 | 24,756 | 767 | 13,416 | 505 | |||||
| Eukaryote | 223,814 | 125 | 2972 | 6836 1 | 339 | 477 1 | 1714 | 2930 1 | 267 | 346 1 |
| 275,201 | 125 | 3271 | 353 | 1780 | 279 | |||||
| 308,208 | 125 | 3470 | 346 | 1836 | 278 | |||||
| Metagenome | 4,962 | Average 78.9 min: 240 max: 74,442 : 1045 | 254 virus | |||||||
© 2017 by the authors. Licensee MDPI, Basel, Switzerland. This article is an open access article distributed under the terms and conditions of the Creative Commons Attribution (CC BY) license ( http://creativecommons.org/licenses/by/4.0/).
Share and Cite
Flaviani, F.; Schroeder, D.C.; Balestreri, C.; Schroeder, J.L.; Moore, K.; Paszkiewicz, K.; Pfaff, M.C.; Rybicki, E.P. A Pelagic Microbiome (Viruses to Protists) from a Small Cup of Seawater. Viruses 2017, 9, 47. https://doi.org/10.3390/v9030047
Flaviani F, Schroeder DC, Balestreri C, Schroeder JL, Moore K, Paszkiewicz K, Pfaff MC, Rybicki EP. A Pelagic Microbiome (Viruses to Protists) from a Small Cup of Seawater. Viruses. 2017; 9(3):47. https://doi.org/10.3390/v9030047
Chicago/Turabian StyleFlaviani, Flavia, Declan C. Schroeder, Cecilia Balestreri, Joanna L. Schroeder, Karen Moore, Konrad Paszkiewicz, Maya C. Pfaff, and Edward P. Rybicki. 2017. "A Pelagic Microbiome (Viruses to Protists) from a Small Cup of Seawater" Viruses 9, no. 3: 47. https://doi.org/10.3390/v9030047
APA StyleFlaviani, F., Schroeder, D. C., Balestreri, C., Schroeder, J. L., Moore, K., Paszkiewicz, K., Pfaff, M. C., & Rybicki, E. P. (2017). A Pelagic Microbiome (Viruses to Protists) from a Small Cup of Seawater. Viruses, 9(3), 47. https://doi.org/10.3390/v9030047