
Feline Panleucopenia Virus NS2 Suppresses the Host IFN-β Induction by Disrupting the Interaction between TBK1 and STING

 ,
, 
Abstract
:1. Introduction
2. Materials and Methods
2.1. Viruses and Cells
2.2. Plasmids
2.3. Transfections and Luciferase Reporter Assays
2.4. Western Blotting
2.5. Co-Immunoprecipitation (Co-IP) Analysis
2.6. Separation of Cytoplasmic and Nuclear Extracts
2.7. Subcellular Localization
2.8. Statistical Analysis
3. Results
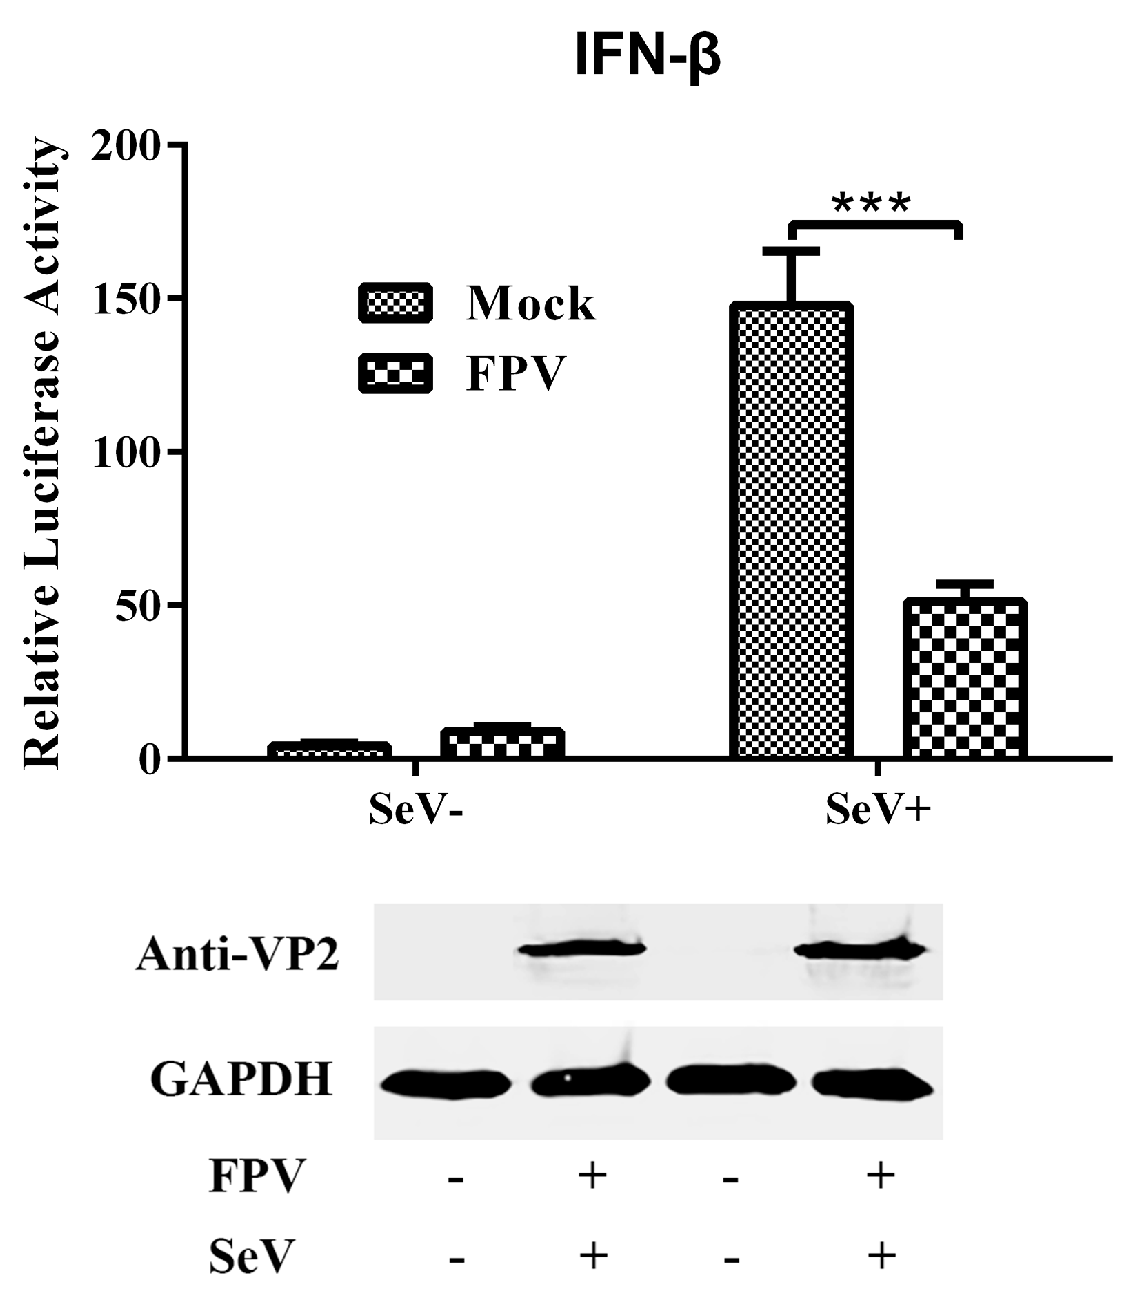
3.1. FPV Infection Fails to Activate IFN-β and Interrupts SeV-Mediated IFN-β Induction
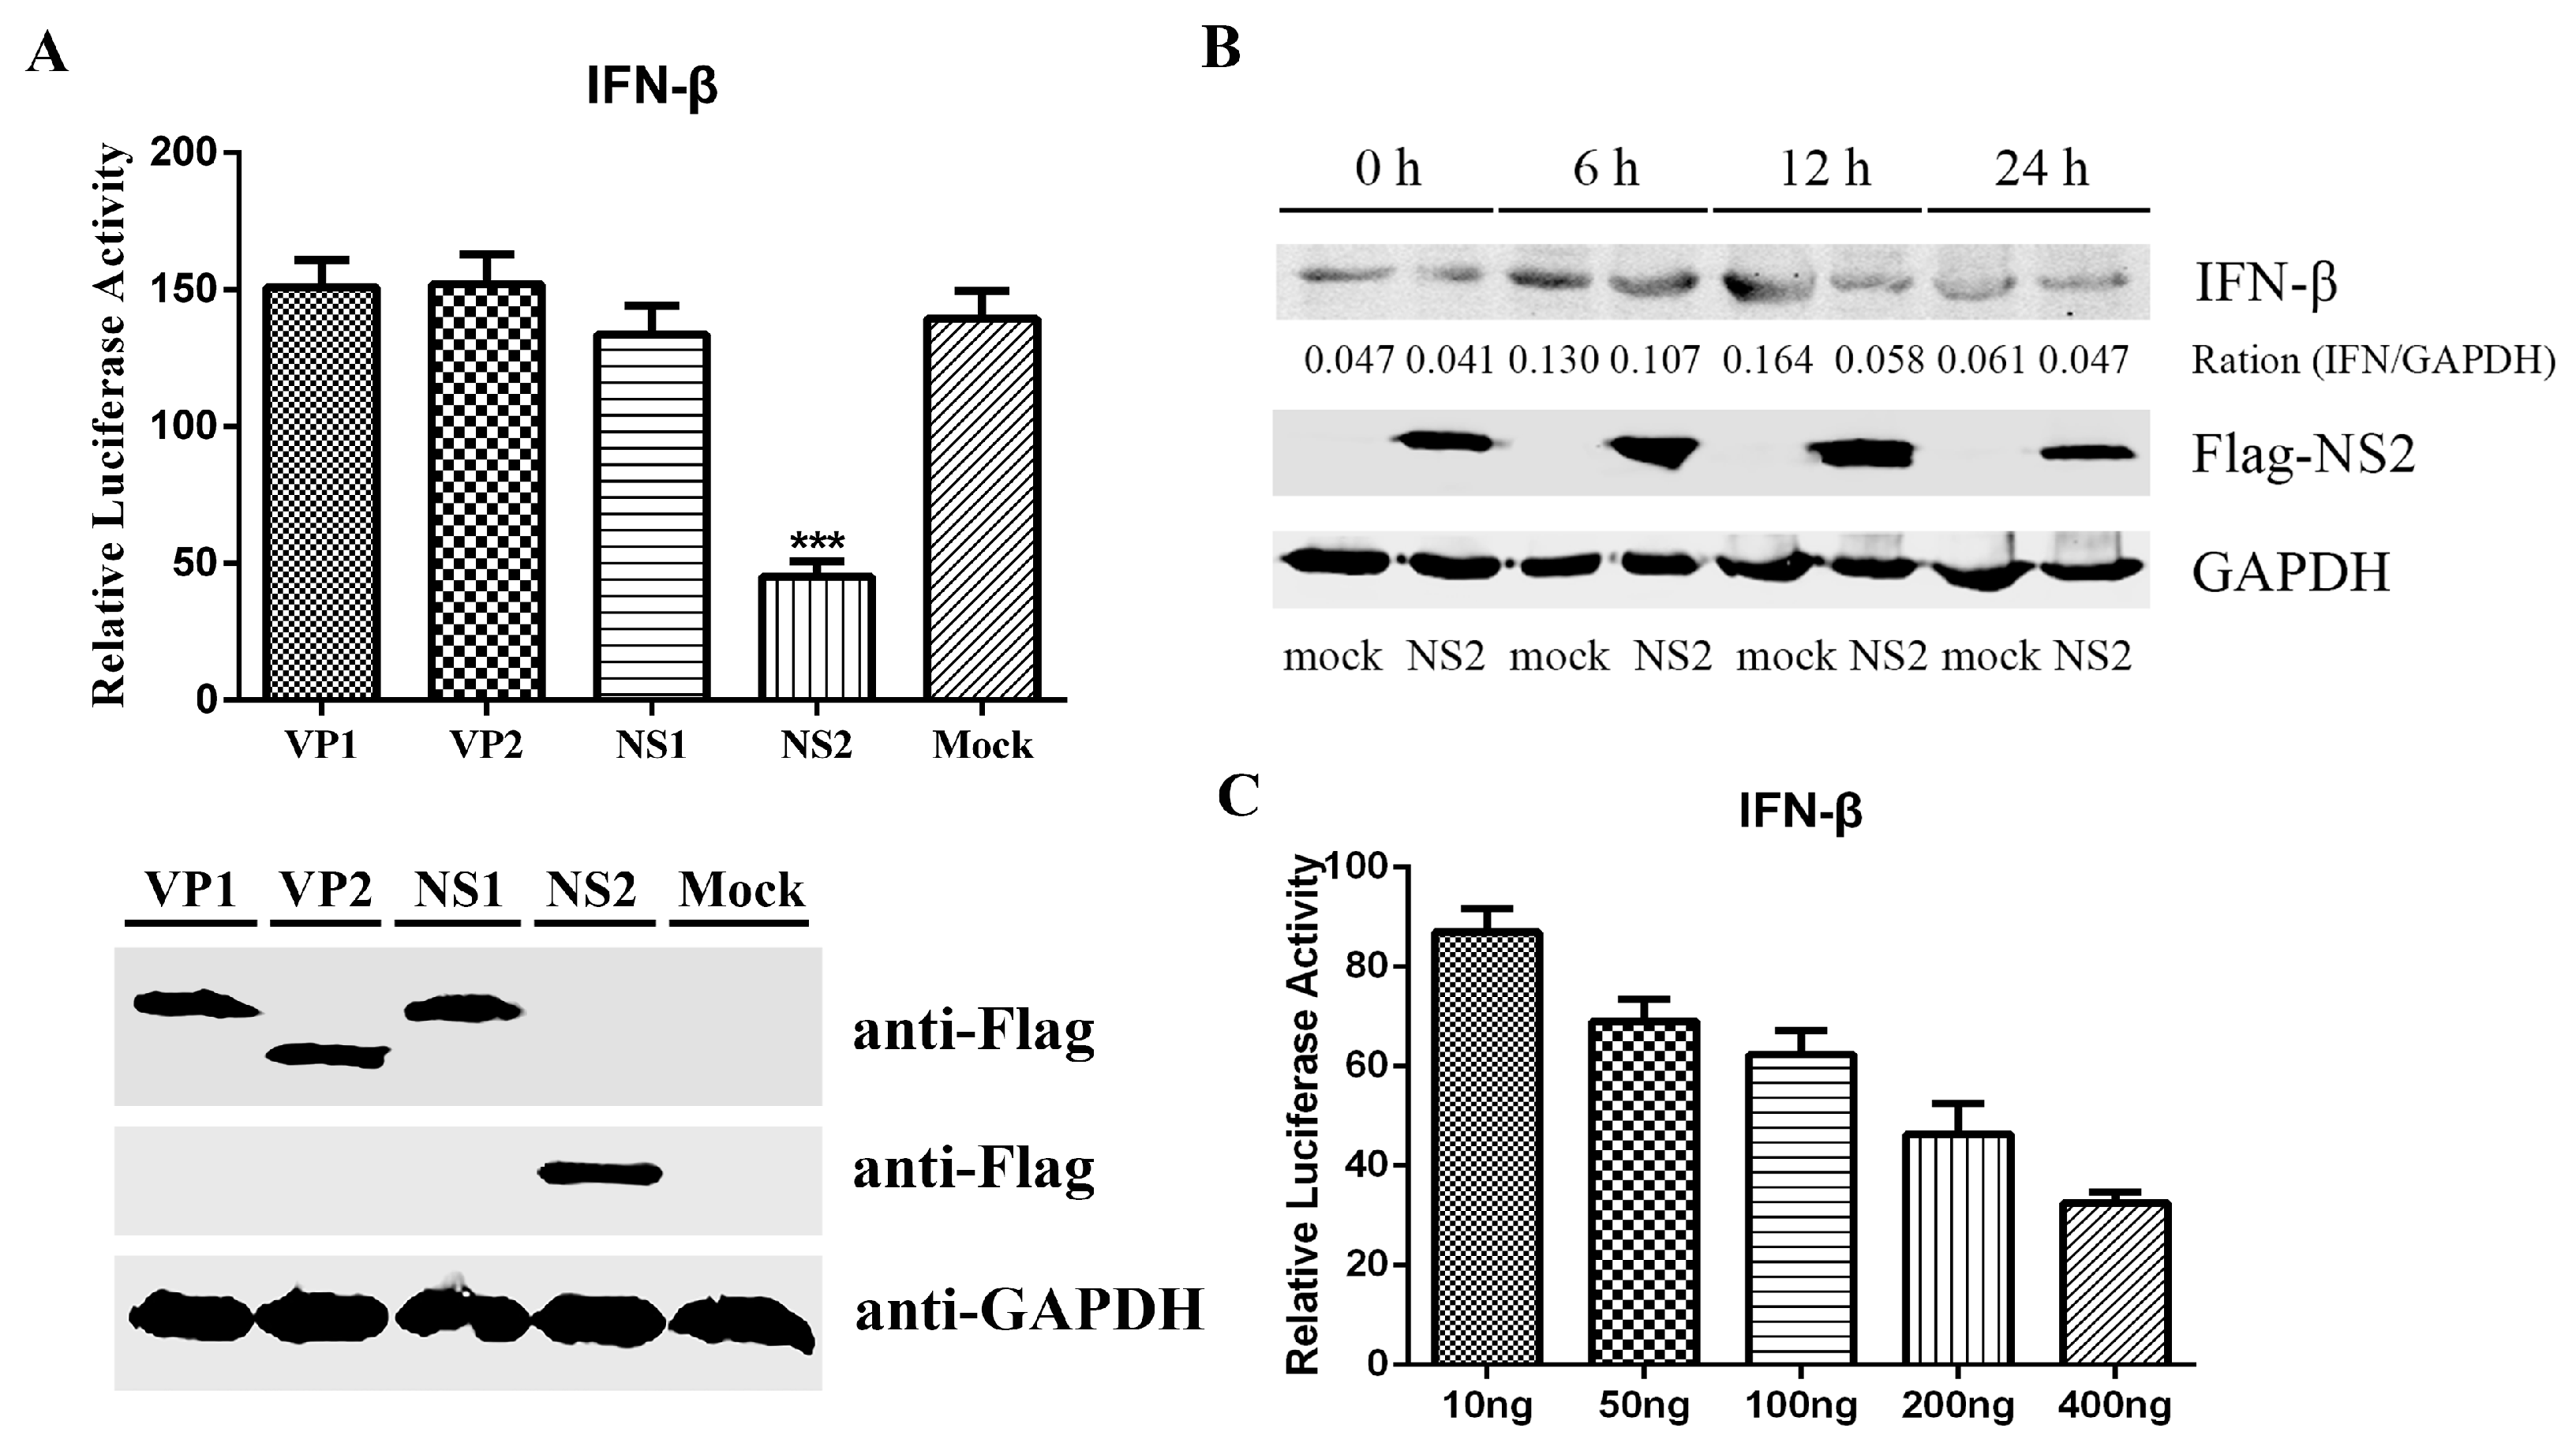
3.2. FPV NS2 as a Negative Regulator Impedes SeV-Mediated IFN-β Induction
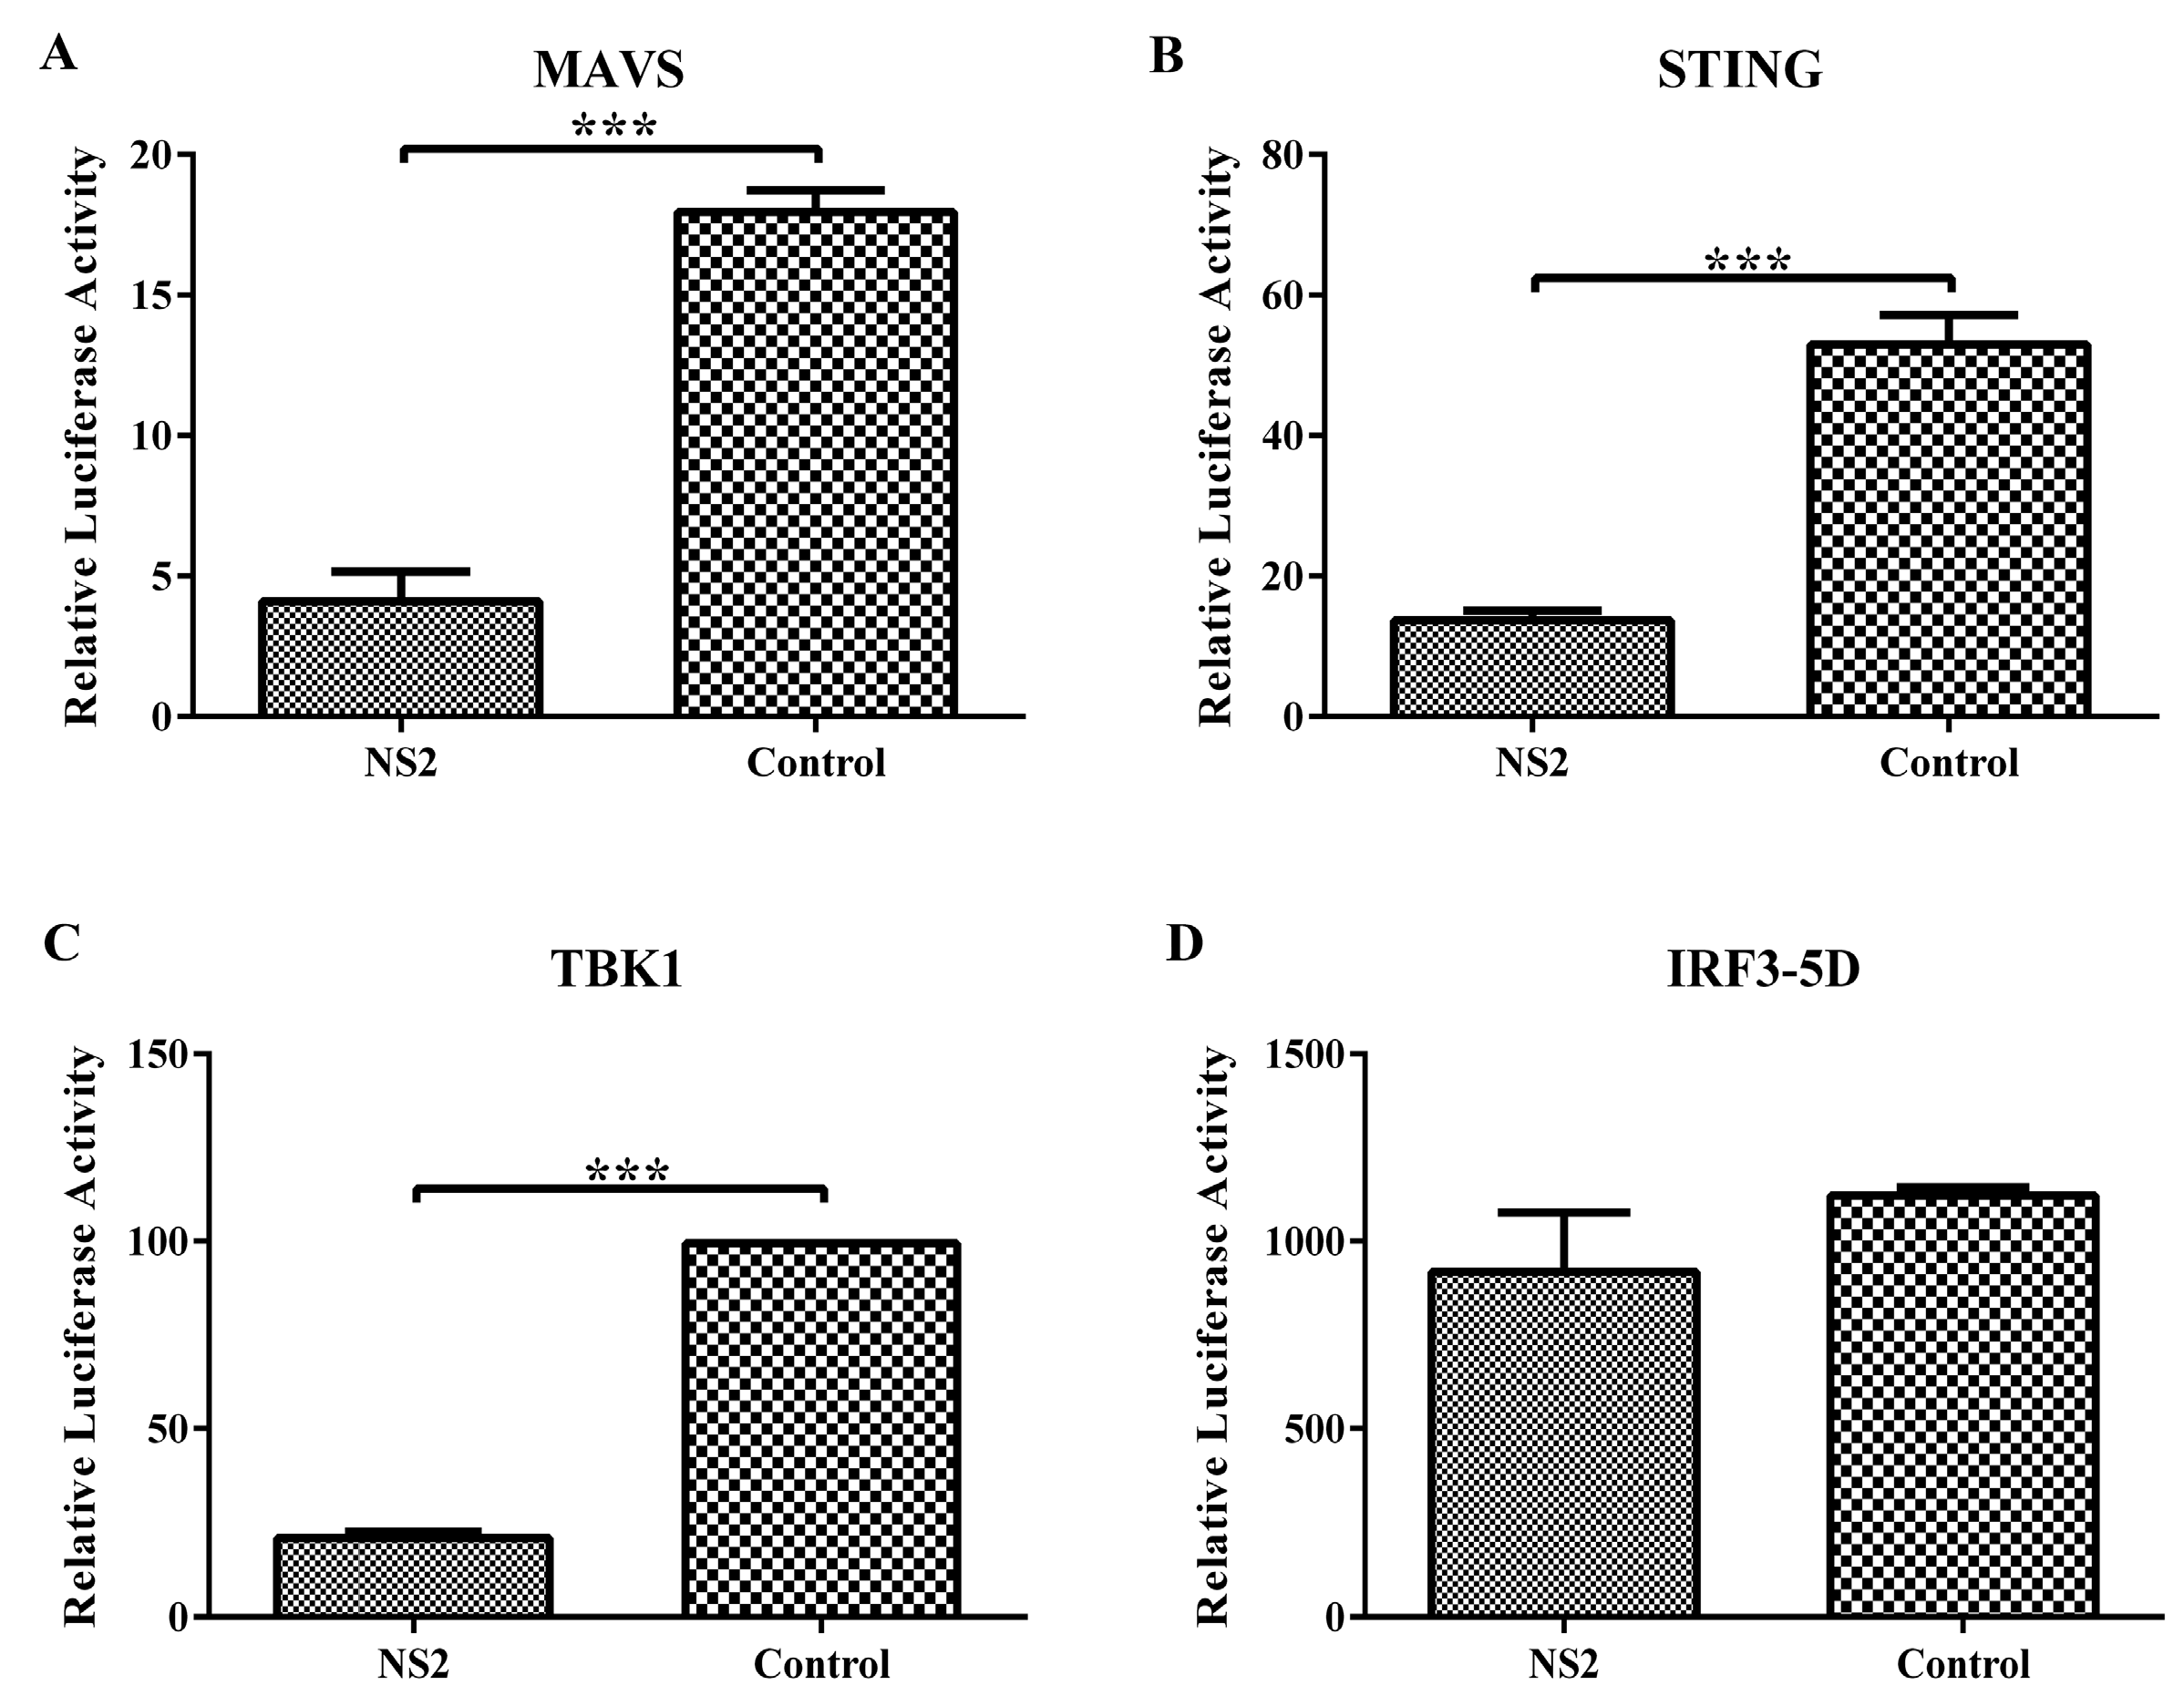
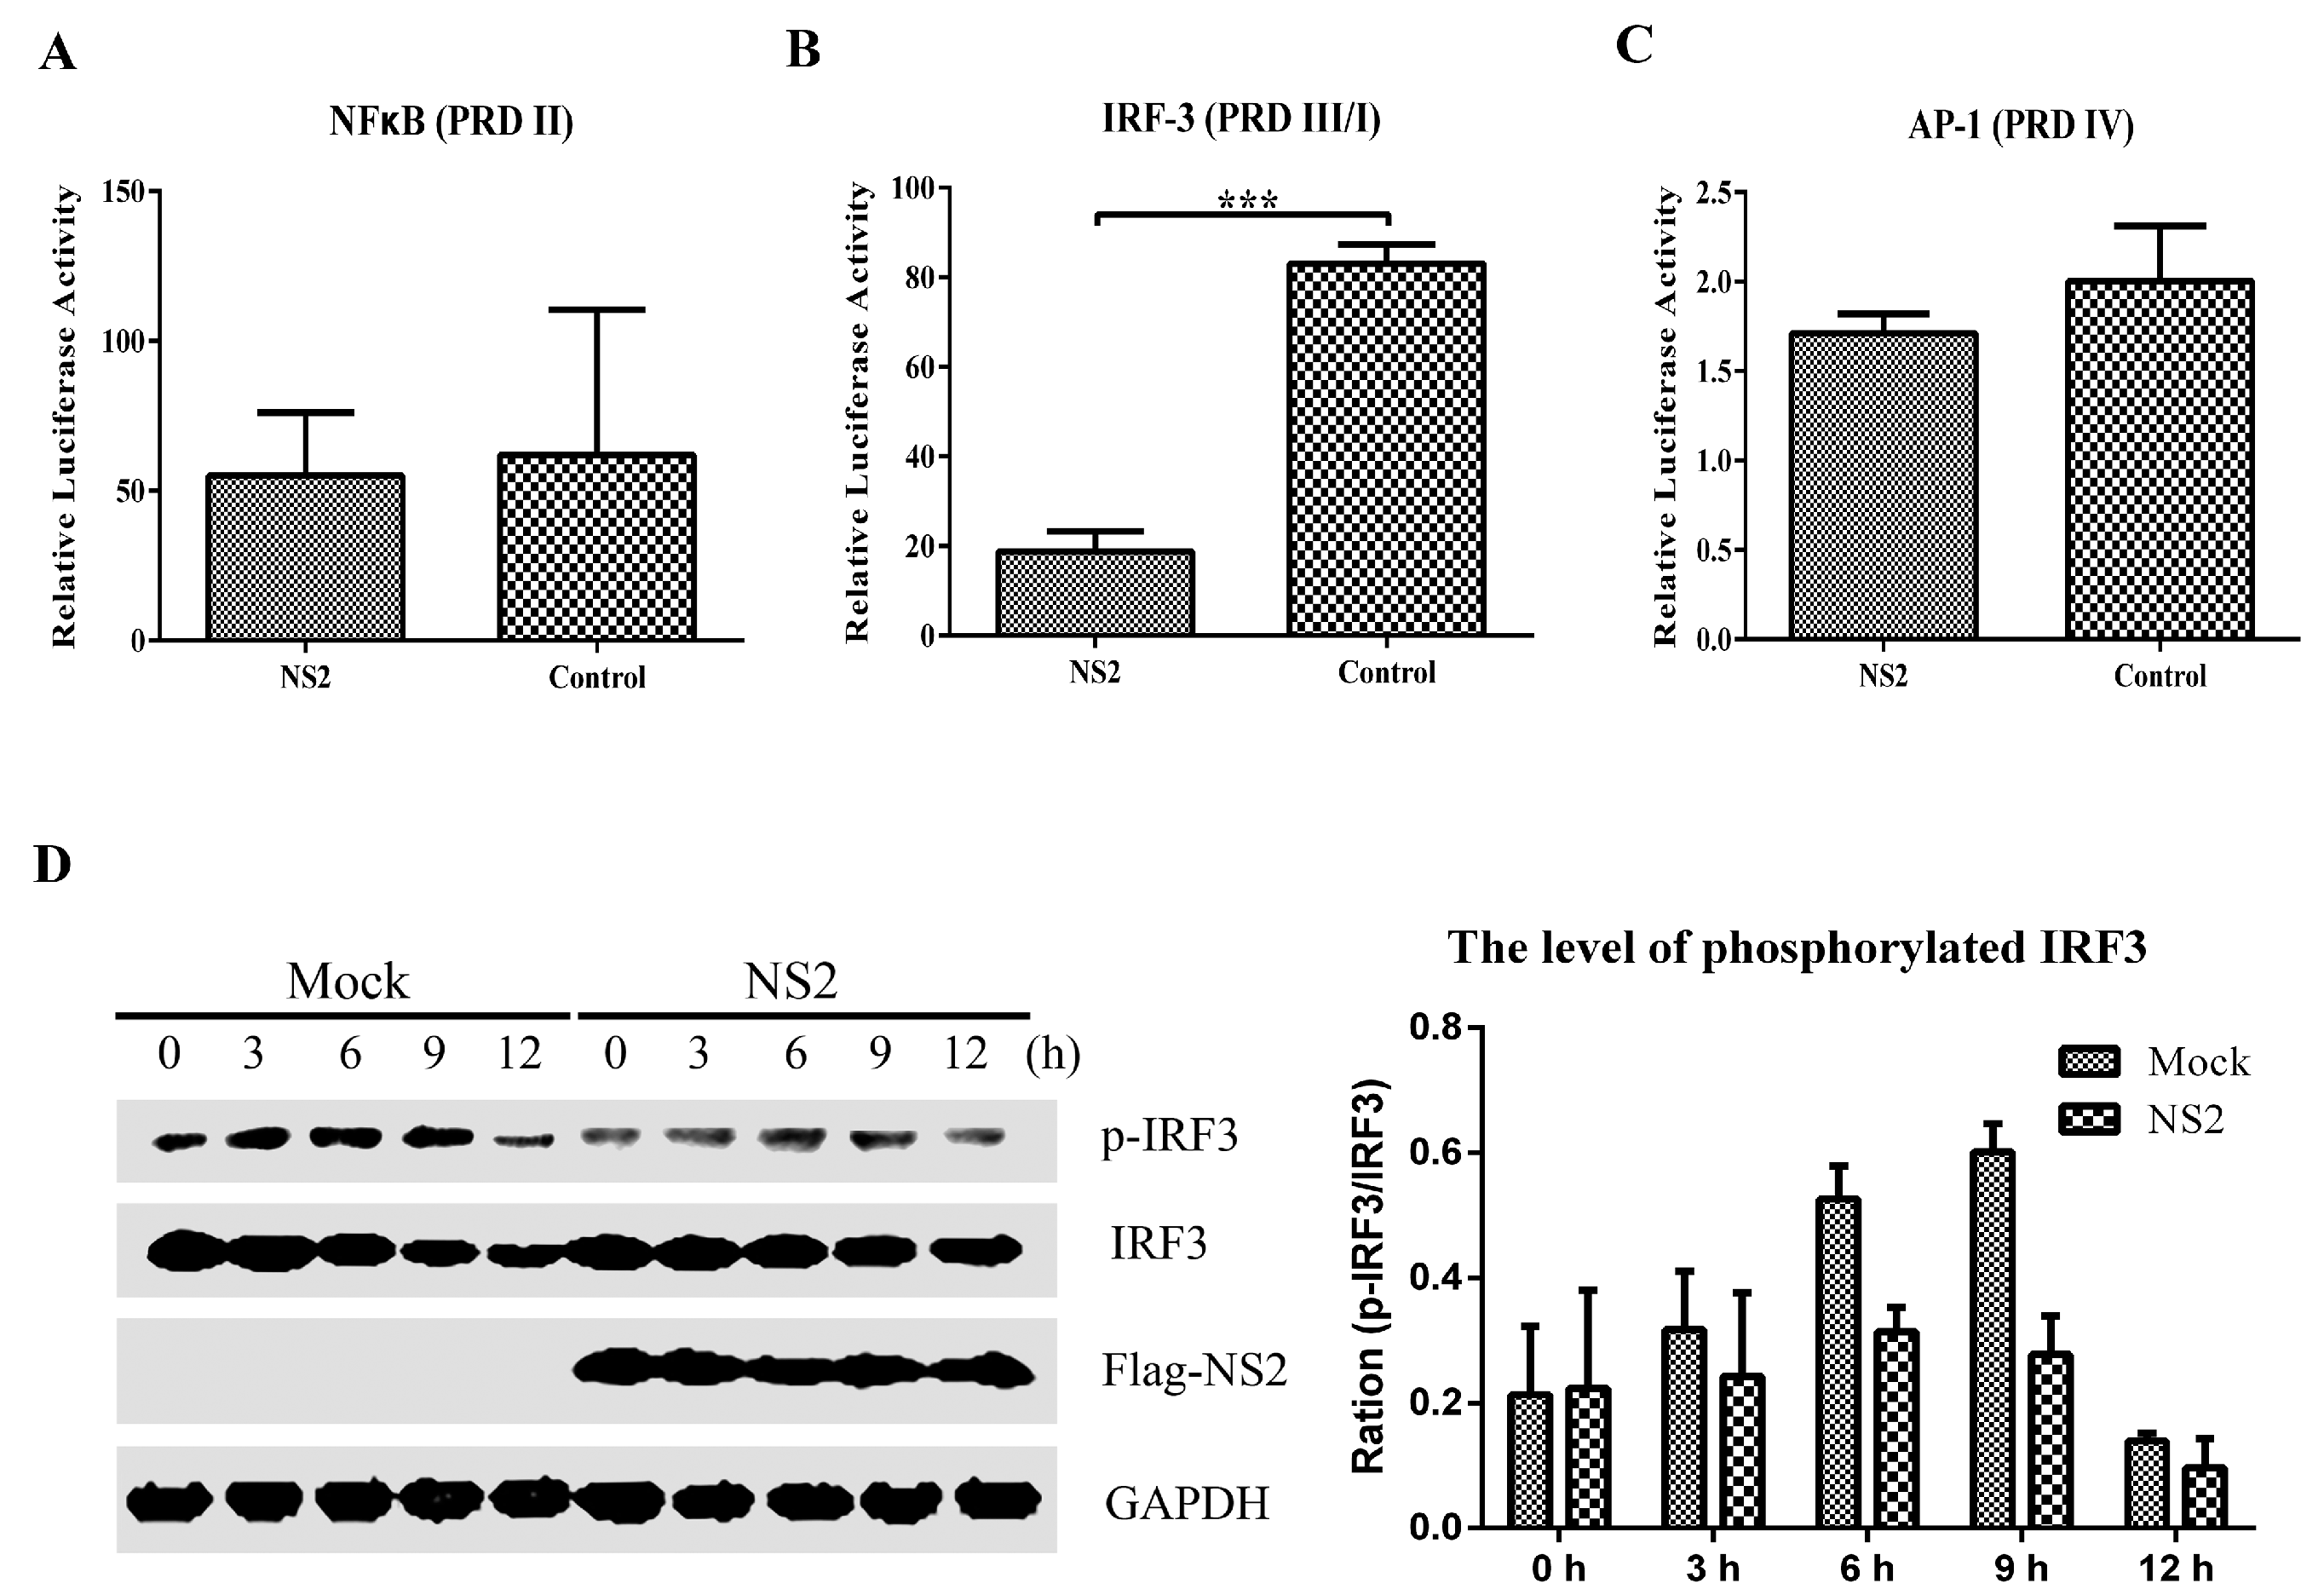
3.3. NS2 Interrupts the SeV-Mediated Activation of IFN-β by Blocking the IRF3 Pathway
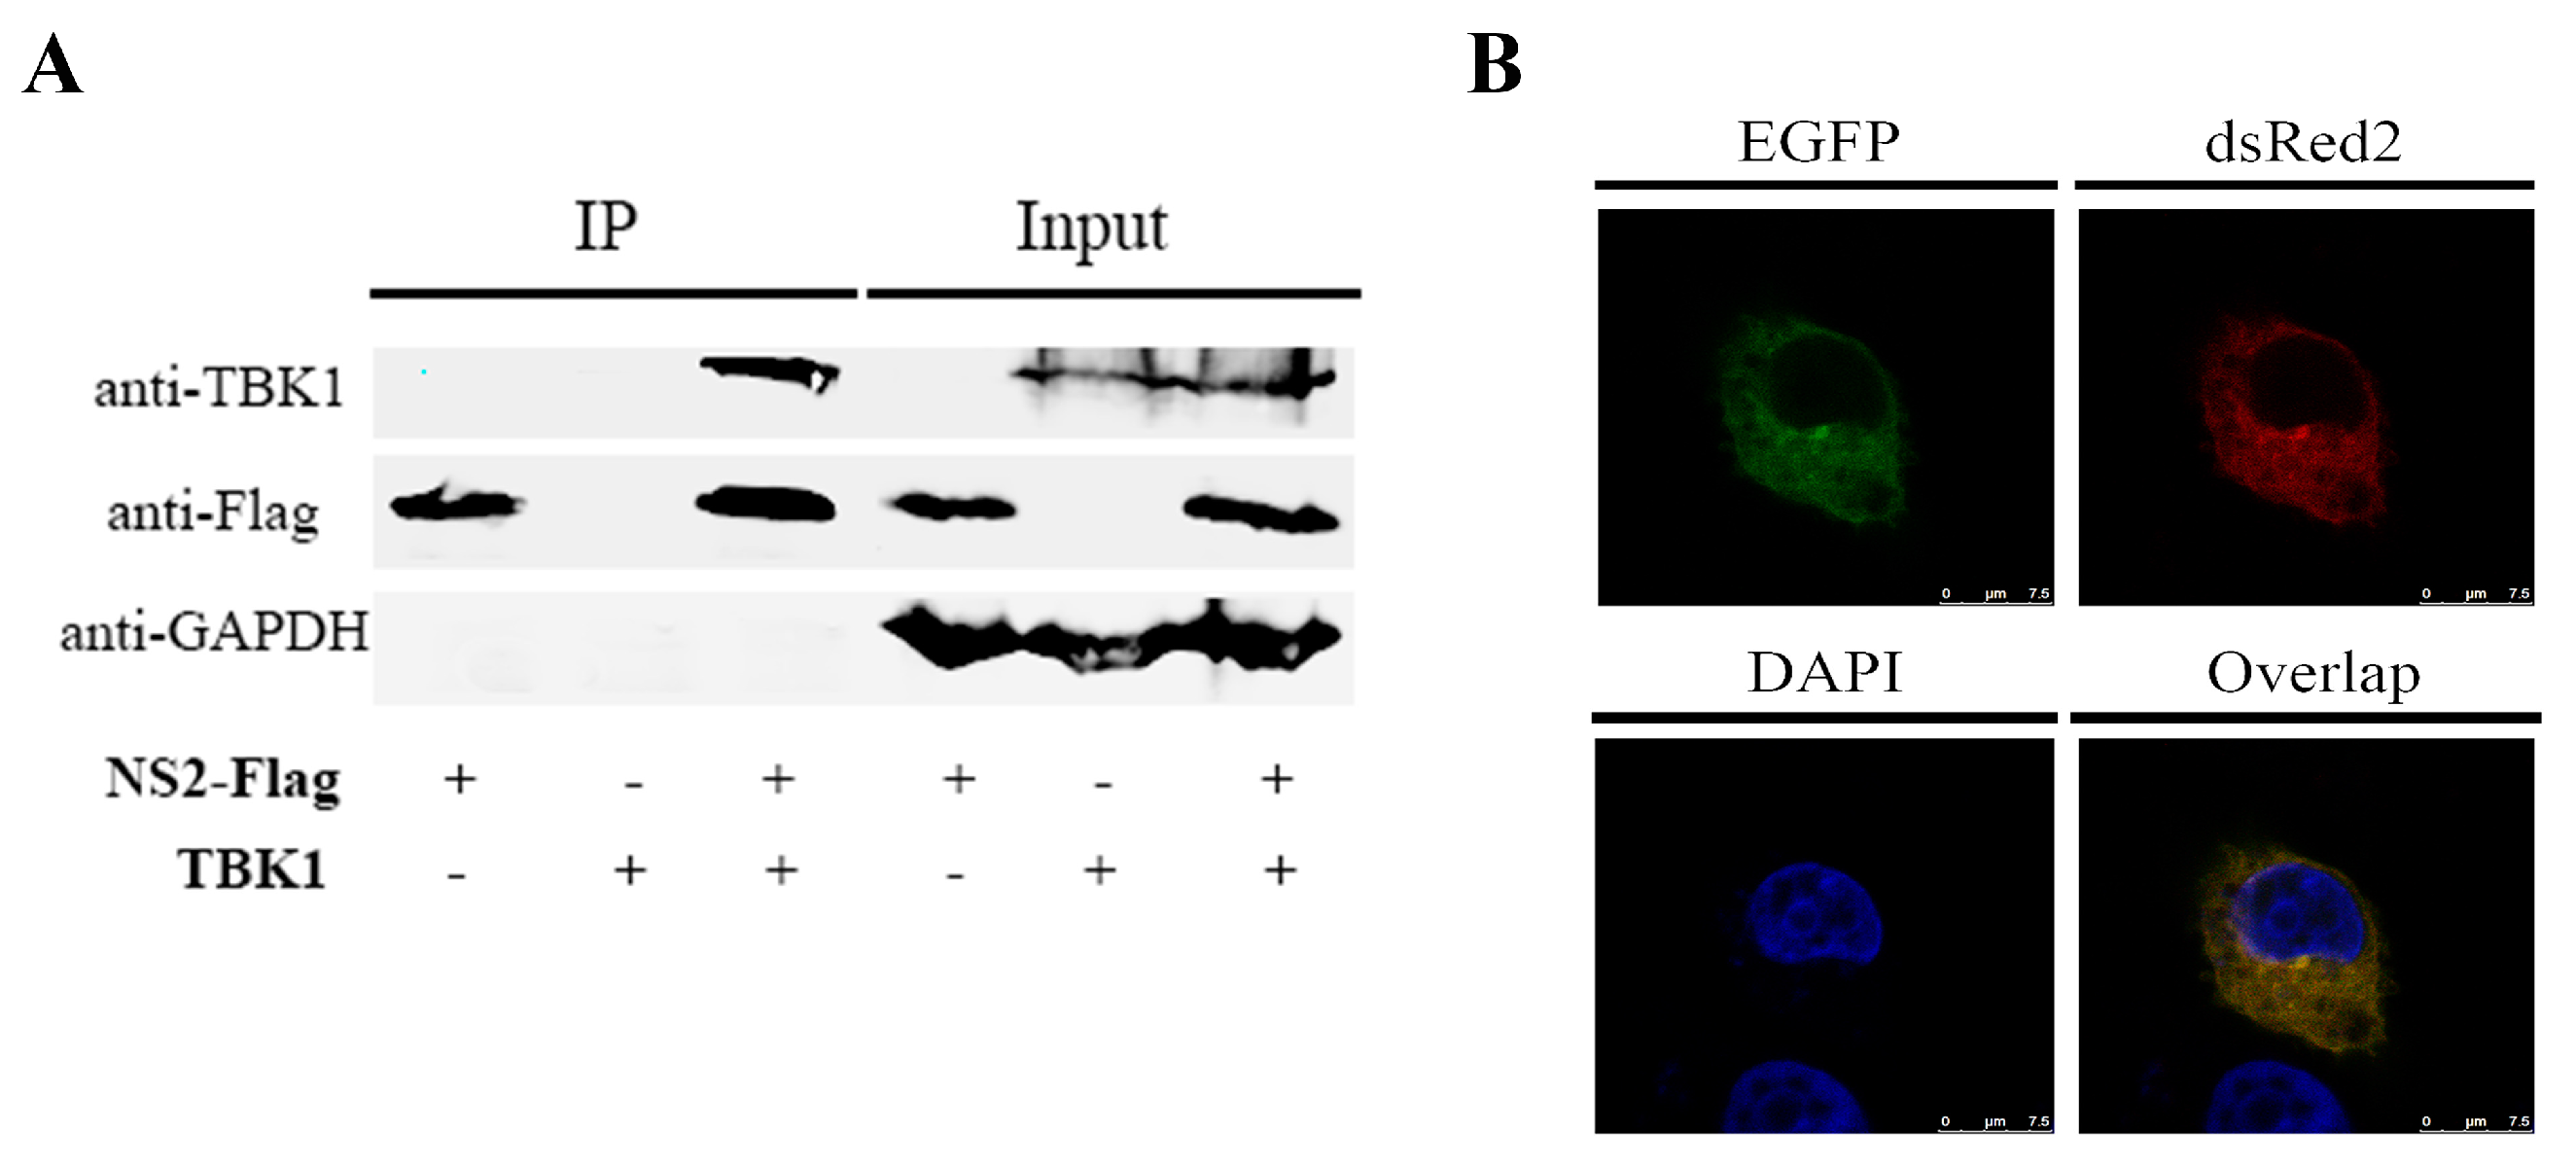
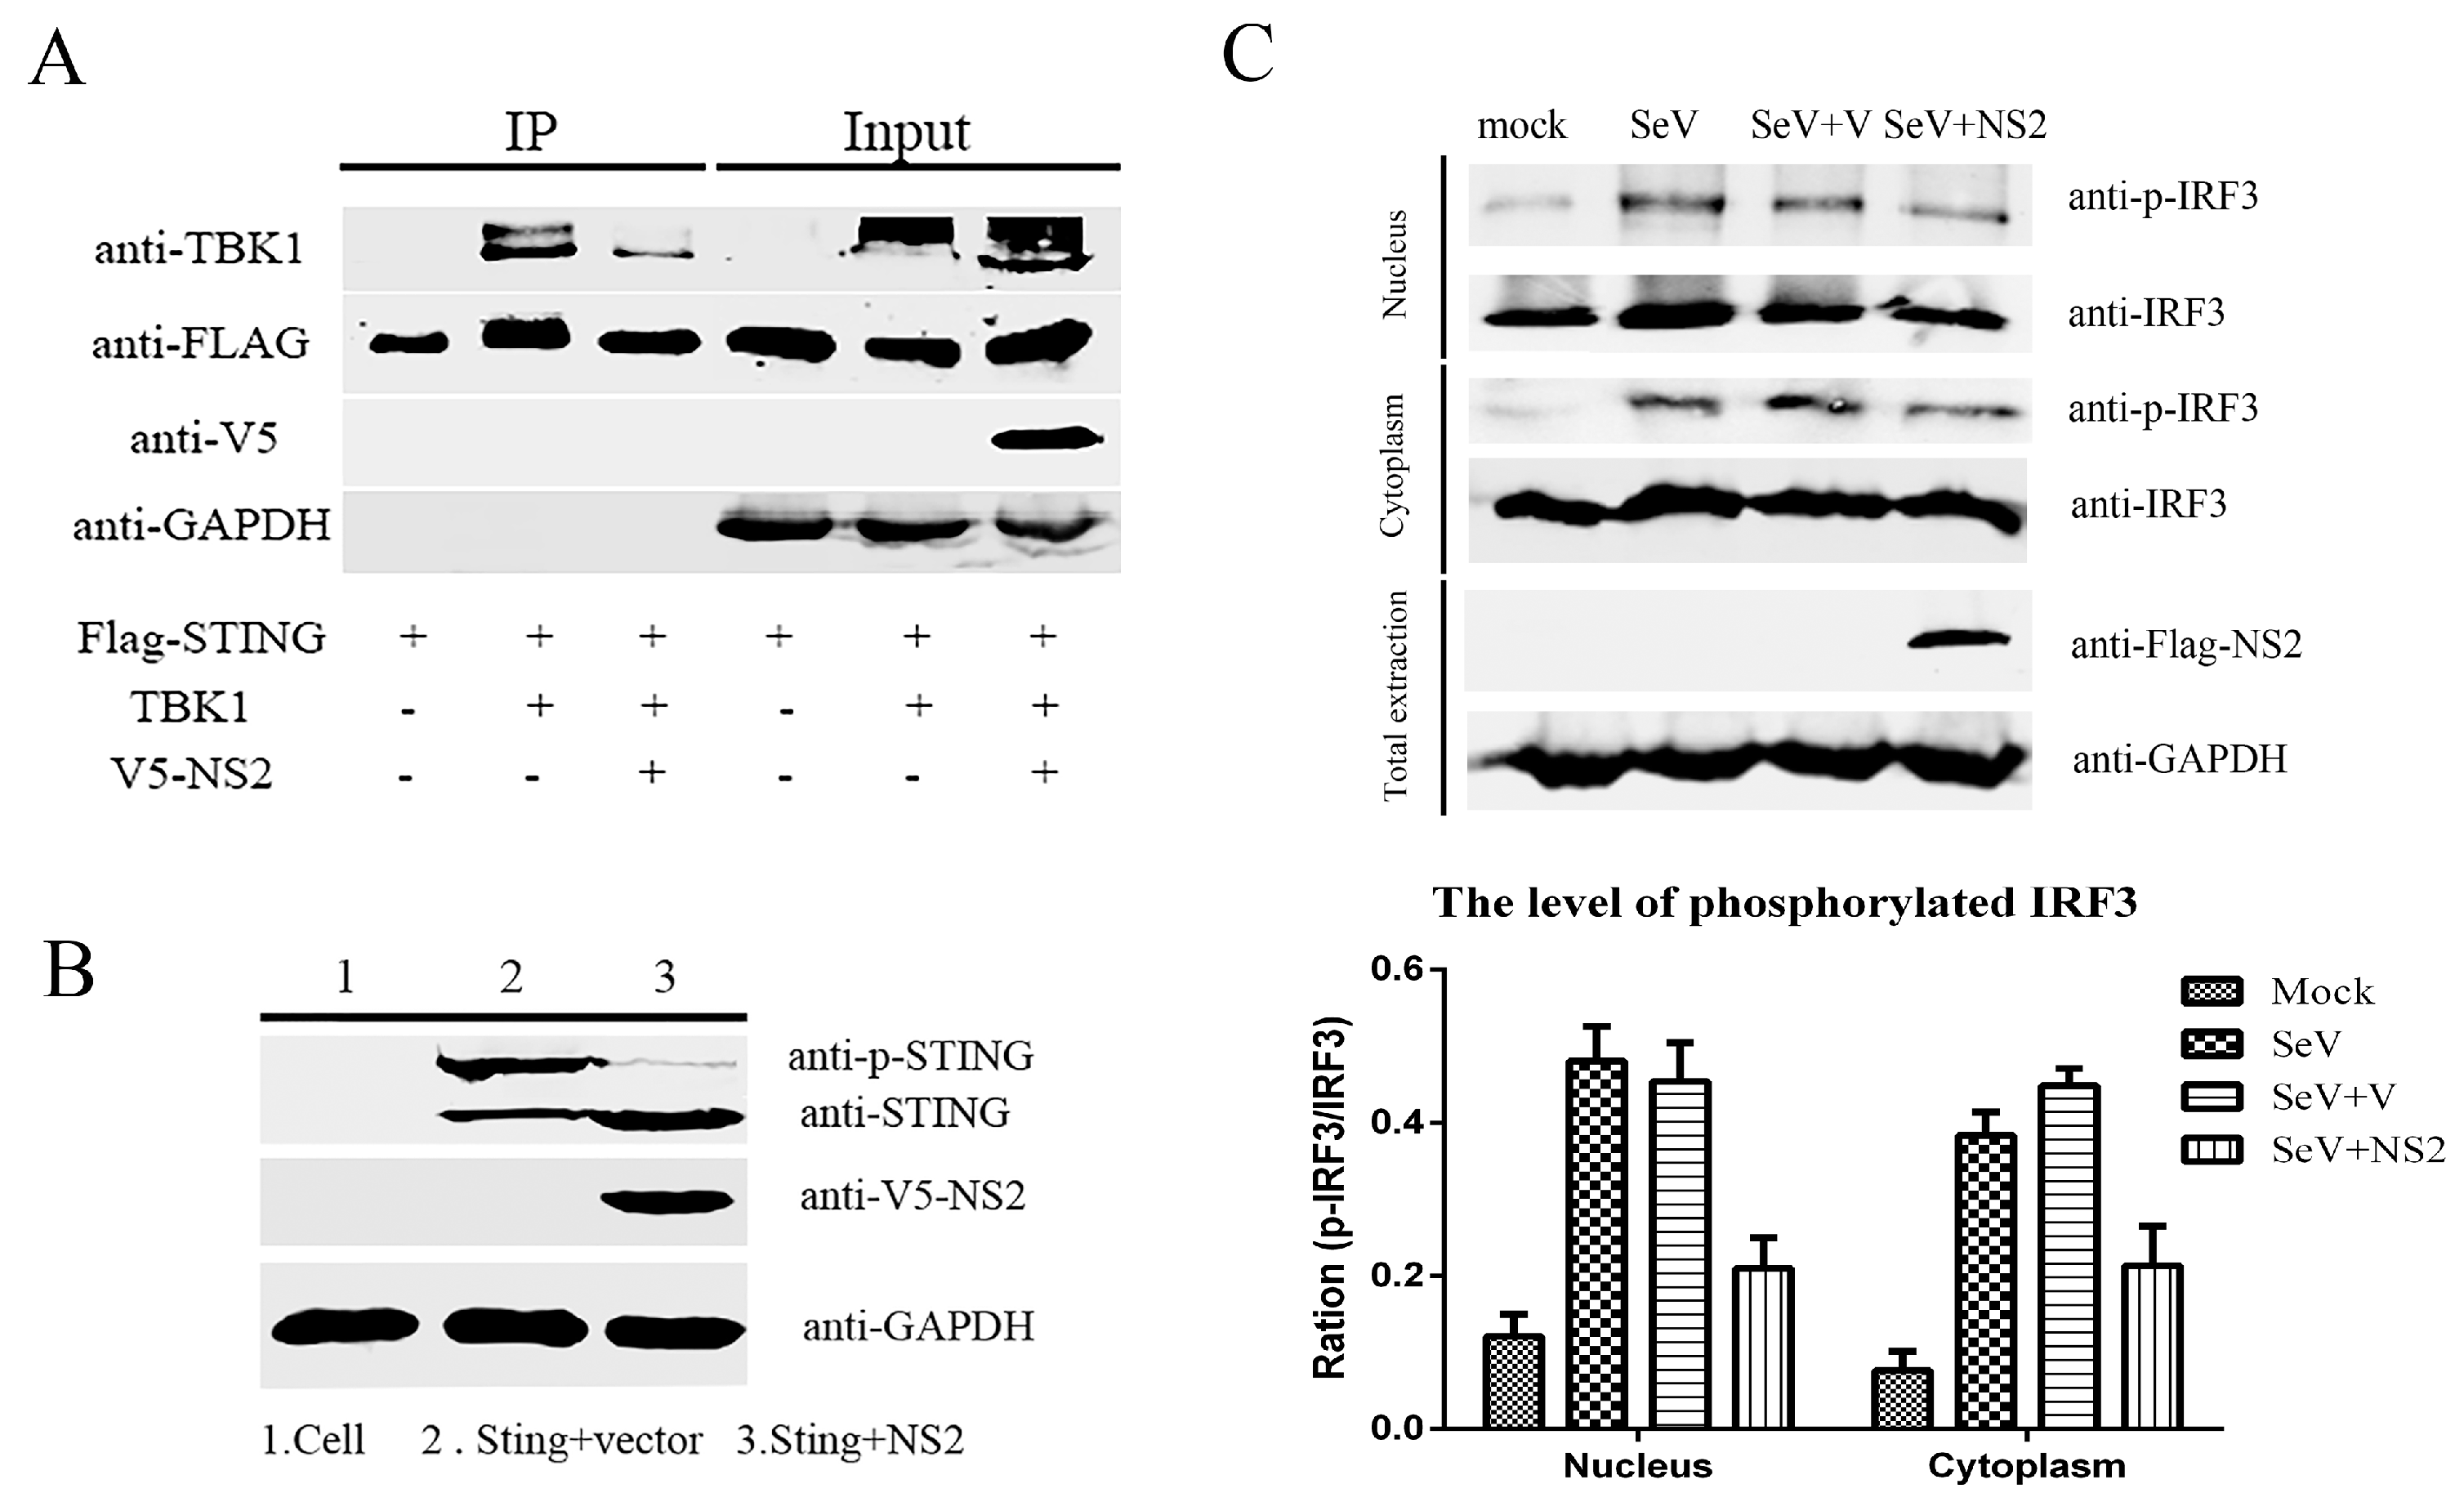
3.4. NS2 Can Interact Directly with TBK1 and Disrupt the TBK1–STING Interaction
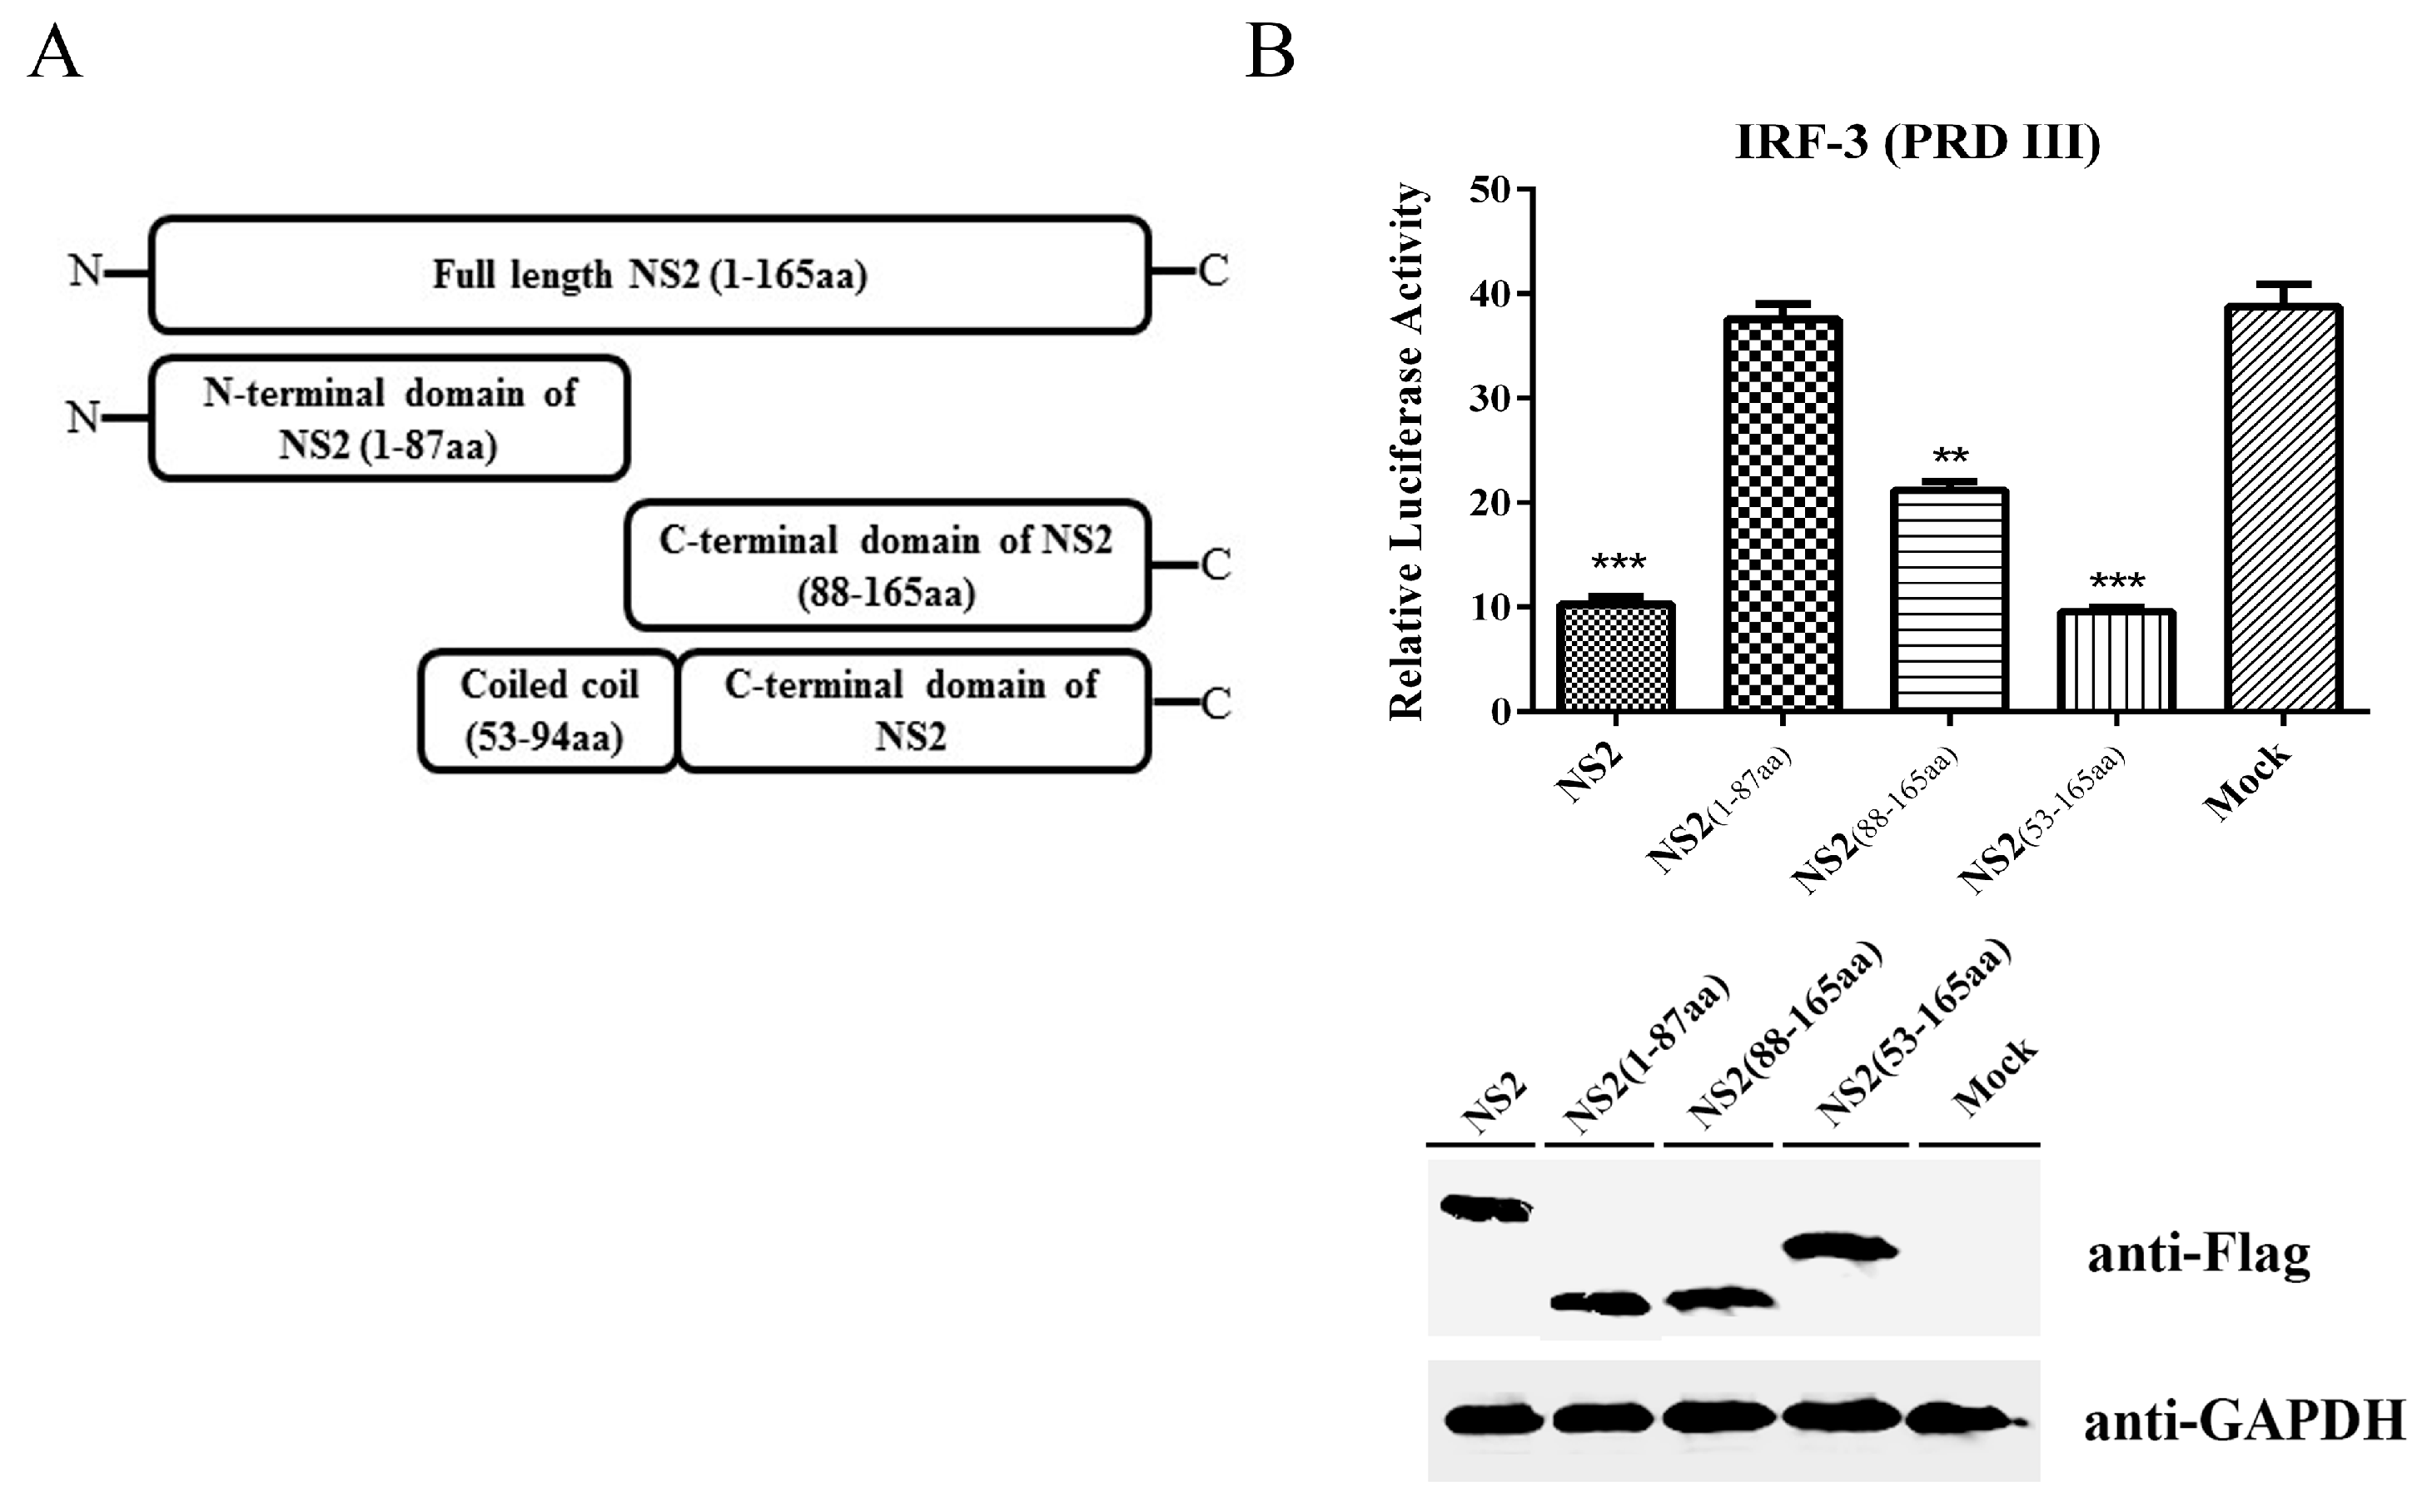
3.5. The C-terminus Plus the Coiled Coil Domain of NS2 can Inhibit the IRF3 Signaling Pathway to the Same Extent as Full-Length NS2
4. Discussion
Supplementary Materials
Acknowledgments
Author Contributions
Conflicts of Interest
References
- Truyen, U.; Parrish, C.R. Feline panleukopenia virus: Its interesting evolution and current problems in immunoprophylaxis against a serious pathogen. Vet. Microbiol. 2013, 165, 29–32. [Google Scholar] [CrossRef] [PubMed]
- Poncelet, L.; Garigliany, M.; Ando, K.; Franssen, M.; Desmecht, D.; Brion, J.P. Cell cycle S phase markers are expressed in cerebral neuron nuclei of cats infected by the feline panleukopenia virus. Cell Cycle 2016, 15, 3482–3489. [Google Scholar] [CrossRef] [PubMed]
- Bowie, A.G.; Unterholzner, L. Viral evasion and subversion of pattern-recognition receptor signalling. Nat. Rev. Immunol. 2008, 8, 911–922. [Google Scholar] [CrossRef] [PubMed]
- Stetson, D.B.; Medzhitov, R. Type I Interferons in host defense. Immunity 2006, 25, 373–381. [Google Scholar] [CrossRef] [PubMed]
- Kawai, T.; Akira, S. Innate immune recognition of viral infection. Nat. Immunol. 2006, 7, 131–137. [Google Scholar] [CrossRef] [PubMed]
- Kawai, T.; Akira, S. Antiviral signaling through pattern recognition receptors. J. Biochem. 2007, 141, 137–145. [Google Scholar] [CrossRef] [PubMed]
- Dempsey, A.; Bowie, A.G. Innate immune recognition of DNA: A recent history. Virology 2015, 479–480, 146–152. [Google Scholar] [CrossRef] [PubMed]
- Yoneyama, M.; Onomoto, K.; Jogi, M.; Akaboshi, T.; Fujita, T. Viral RNA detection by RIG-I-like receptors. Curr. Opin. Immunol. 2015, 32, 48–53. [Google Scholar] [CrossRef] [PubMed]
- Tian, J.; Zhang, X.; Wu, H.; Liu, C.; Liu, J.; Hu, X.; Qu, L. Assessment of the IFN-β response to four feline caliciviruses: Infection in CRFK cells. Infect. Genet. Evol. 2015, 34, 352–360. [Google Scholar] [CrossRef] [PubMed]
- Wu, H.; Zhang, X.; Liu, C.; Liu, D.; Liu, J.; Wang, G.; Tian, J.; Qu, L. Molecular cloning and functional characterization of feline MAVS. Immunol. Res. 2016, 64, 82–92. [Google Scholar] [CrossRef] [PubMed]
- Zhang, X.; Wu, H.; Liu, C.; Sun, X.; Zu, S.; Tian, J.; Qu, L.; Li, S. The function of feline stimulator of interferon gene (STING) is evolutionarily conserved. Vet. Immunol. Immunopathol. 2016, 169, 54–62. [Google Scholar] [CrossRef] [PubMed]
- Lin, W.; Qiu, Z.; Liu, Q.; Cui, S. Interferon induction and suppression in swine testicle cells by porcine parvovirus and its proteins. Vet. Microbiol. 2013, 163, 157–161. [Google Scholar] [CrossRef] [PubMed]
- Mattei, L.M.; Cotmore, S.F.; Tattersall, P.; Iwasaki, A. Parvovirus evades interferon-dependent viral control in primary mouse embryonic fibroblasts. Virology 2013, 442, 20–27. [Google Scholar] [CrossRef] [PubMed]
- Zhang, R.; Fang, L.; Wang, D.; Cai, K.; Zhang, H.; Xie, L.; Li, Y.; Chen, H.; Xiao, S. Porcine bocavirus NP1 negatively regulates interferon signaling pathway by targeting the DNA-binding domain of IRF9. Virology 2015, 485, 414–421. [Google Scholar] [CrossRef] [PubMed]
- Randall, R.E.; Goodbourn, S. Interferons and viruses: An interplay between induction, signalling, antiviral responses and virus countermeasures. J. Gen. Virology 2008, 89, 1–47. [Google Scholar] [CrossRef] [PubMed]
- Versteeg, G.A.; Garcia-Sastre, A. Viral tricks to grid-lock the type I Interferon system. Curr. Opin. Microbiol. 2010, 13, 508–516. [Google Scholar] [CrossRef] [PubMed]
- Kagan, J.C.; Barton, G.M. Emerging principles governing signal transduction by pattern-recognition receptors. Cold Spring Harb. Perspect. Biol. 2014, 7, a016253. [Google Scholar] [CrossRef] [PubMed]
- Liu, S.; Cai, X.; Wu, J.; Cong, Q.; Chen, X.; Li, T.; Du, F.; Ren, J.; Wu, Y.T.; Grishin, N.V. Phosphorylation of innate immune adaptor proteins MAVS, STING, and TRIF induces IRF3 activation. Science 2015, 347. [Google Scholar] [CrossRef] [PubMed]
- Tanaka, Y.; Chen, Z.J. STING specifies IRF3 phosphorylation by TBK1 in the cytosolic DNA signaling pathway. Sci. Signal. 2012, 5, ra20. [Google Scholar] [CrossRef] [PubMed]
- Wang, D.; Yuan, W.; Davis, I.; Parrish, C.R. Nonstructural protein-2 and the replication of canine parvovirus. Virology 1998, 240, 273–281. [Google Scholar] [CrossRef] [PubMed]
- Lupas, A. Coiled coils: New structures and new functions. Trends Biochem. Sci. 1996, 21, 375–382. [Google Scholar] [CrossRef]


© 2017 by the authors; licensee MDPI, Basel, Switzerland. This article is an open access article distributed under the terms and conditions of the Creative Commons Attribution (CC BY) license (http://creativecommons.org/licenses/by/4.0/).
Share and Cite
Kang, H.; Liu, D.; Tian, J.; Hu, X.; Zhang, X.; Yin, H.; Wu, H.; Liu, C.; Guo, D.; Li, Z.; et al. Feline Panleucopenia Virus NS2 Suppresses the Host IFN-β Induction by Disrupting the Interaction between TBK1 and STING. Viruses 2017, 9, 23. https://doi.org/10.3390/v9010023
Kang H, Liu D, Tian J, Hu X, Zhang X, Yin H, Wu H, Liu C, Guo D, Li Z, et al. Feline Panleucopenia Virus NS2 Suppresses the Host IFN-β Induction by Disrupting the Interaction between TBK1 and STING. Viruses. 2017; 9(1):23. https://doi.org/10.3390/v9010023
Chicago/Turabian StyleKang, Hongtao, Dafei Liu, Jin Tian, Xiaoliang Hu, Xiaozhan Zhang, Hang Yin, Hongxia Wu, Chunguo Liu, Dongchun Guo, Zhijie Li, and et al. 2017. "Feline Panleucopenia Virus NS2 Suppresses the Host IFN-β Induction by Disrupting the Interaction between TBK1 and STING" Viruses 9, no. 1: 23. https://doi.org/10.3390/v9010023
APA StyleKang, H., Liu, D., Tian, J., Hu, X., Zhang, X., Yin, H., Wu, H., Liu, C., Guo, D., Li, Z., Jiang, Q., Liu, J., & Qu, L. (2017). Feline Panleucopenia Virus NS2 Suppresses the Host IFN-β Induction by Disrupting the Interaction between TBK1 and STING. Viruses, 9(1), 23. https://doi.org/10.3390/v9010023