Article

The ORF1ab of Feline Coronavirus Plays a Critical Role in Regulating the Innate Immune Response

State Key Laboratory for Animal Disease Control and Prevention, Harbin Veterinary Research Institute, Chinese Academy of Agricultural Sciences (CAAS), 678 Haping Street, Harbin 150069, China
*
Authors to whom correspondence should be addressed.
Viruses 2025, 17(9), 1282; https://doi.org/10.3390/v17091282
Submission received: 14 August 2025 / Revised: 12 September 2025 / Accepted: 16 September 2025 / Published: 22 September 2025
(This article belongs to the Section Animal Viruses)

Abstract

Feline coronaviruses (FCoVs) are divided into two groups: feline infectious peritonitis virus (FIPV) and feline enteric coronavirus (FECV). FIPV is responsible for the severe disease known as feline infectious peritonitis, while FECV typically causes mild symptoms, such as diarrhea, and often does not lead to any disease at all. Currently, it is not possible to distinguish between FIPV and FECV at the molecular level. Therefore, there is an urgent need to understand the molecular features of FIPV. Here, we generated a recombinant virus by replacing the ORF1ab region and the coding sequence for the spike (S) protein of an FECV with the corresponding sequences from FIPVs. The recombinant virus (recFECV-SDF-2-1abFIPV) exhibited similar growth kinetics to its parental strain. Our analysis revealed that the replacement of the ORF1ab in the FECV caused significant alterations in protein expression within the host cells. Furthermore, the presence of the ORF1ab from the FIPV strain resulted in enhanced suppression of the innate immune response compared to the parental strain, as determined through proteomic and transcriptomic studies. Additionally, we demonstrated that the papain-like protease 2 (PL2pro) of the non-structural protein 3 (NSP3) from both FIPV and FECV functions in immune suppression, and the protease activity is required for this function.

1. Introduction

FCoV is an enveloped, single-stranded, positive-sense RNA virus belonging to the genus Coronavirus of the Coronaviridae [1]. The genome of FCoV is approximately 29 kilobases (kb) in length and contains seven open reading frames. These frames encode the polyprotein pp1ab (ORF1ab), which can be cleaved into 16 non-structural proteins (NSPs), structural proteins such as the spike protein (S), envelope protein (E), membrane protein (M), and nucleocapsid protein (N), and accessory proteins (ORF3 and ORF7). FCoVs can be categorized into two biotypes based on the clinical symptoms they cause: feline infectious peritonitis virus (FIPV) and feline enteric coronavirus (FECV). FECV often causes enteritis or is asymptomatic, while FIPV leads to feline infectious peritonitis (FIP), a severe and often fatal disease with a mortality rate reaching 100% without treatment. FCoVs are also classified into two genotypes: type I and type II. Type I FCoVs are widely distributed in nature, while type II FCoVs occur less frequently [2,3,4]. Epidemiological surveys have shown that type II arises from recombination between type I FCoVs and canine coronavirus (CCoV). Compared to type I FCoVs, type II FCoVs are easier to culture in vitro, which is why most research on FIP and FIPV focuses on type II FCoVs. Both genotypes can belong to either the FECV or FIPV biotype.
Although low-pathogenicity FCoV is highly contagious, only a small percentage of infected cats develop clinical FIP, and only a few FIP-affected cats shed FIPV [5]. Multiple studies have indicated that FIPV strains are more closely related to FCoVs found in fecal samples of cats living in the same environment but not to the FIPV isolates in other locations [2,4]. Phylogenetic analysis of FIPV strains from different cats in the same household reveals unique genetic signatures, suggesting independent emergence of the virus in each feline host [4]. Furthermore, oral inoculation of healthy cats with FIPV is not efficient in causing the development of FIP [6,7]. Therefore, the likelihood of horizontal transmission of FIPV is low, although it is possible [8,9]. The factors contributing to FIPV outbreaks in multi-cat environments are likely diverse [10,11,12].
The mechanism underlying the development and pathogenesis of FIPV is not clear. Like all coronaviruses, the FCoV genome shows high genetic variability. It has been proposed that mutations in the spike (S) gene, along with accessory genes 3c and 7b, may play a role in this process [13,14], but subsequent research has not fully validated these claims [15]. Recent studies, for instance, have demonstrated that inserting the S protein from virulent type II FIPV into the backbone of low-virulence type I FECV does not change the biotype of the virus [16]. Furthermore, recombinant virulent viruses with an S protein from a low-virulence type II virus continue to exhibit high virulence [16,17]. These findings suggest that the virulence of FIPV does not depend solely on the S protein. Instead, it is likely that a combination of multiple mutations plays a role in the pathogenesis of FIP. Some studies have suggested that antibody-dependent enhancement plays an important role in the development of FIP [18,19]. However, this phenomenon is not often observed under natural conditions [12].
The currently accepted theory on the pathogenesis of FIPV suggests that when cats are infected with FCoV, the accumulation of viral genetic mutations alters the target cells of the virus from intestinal epithelial cells to monocytes/macrophages, leading to FIP development. However, others argue that FECV and FIPV are two distinct types of FCoV that circulate independently within cat populations [20,21]. Previous studies have shown that highly virulent strains of certain viruses can replicate more effectively in monocytes and macrophages [22]. Additionally, the occurrence of FIP is associated with significant reductions in both natural killer cells and regulatory T cells, indicating that both innate immunity and adaptive immunity are being suppressed [23]. Recent studies indicate that the type II FIPV (DF2 strain) fails to induce the production of IFN β and suppresses the IFN β production induced by Sendai virus (SeV) or polyinosinic–polycytidylic acid (poly(I:C)) [24,25]. This suppression is closely related to the activity of non-structural protein NSP5, which disrupts the type I interferon signaling pathway by cleaving NEMO through its protease activity. In addition to NSP5, the NSP1 of FIPV plays a critical role in inhibiting the host immune response [24,26]. However, the immune suppression activities of FIPV are not claimed to be a unique feature that differentiates it from FECV.
In this study, we constructed a recombinant virus of recFECV-SDF-2-1abFIPV, in which the ORF1ab region was replaced with the corresponding region from an FIPV. Our findings revealed that the ORF1ab of FIPV exhibits a stronger ability to suppress innate immunity. Additionally, we discovered that the PL2pro of NSP3 has a strong inhibitory ability in interferon production, and this inhibitory effect is dependent on its deubiquitinase activity.

2. Materials and Methods

2.1. Cells, Viruses, and Antibodies

Crandell feline kidney (CRFK) cells were purchased from National Collection of Authenticated Cell Cultures (Shanghai, China; CAT#3101MAMGNO16). Felis catus whole fetus (Fcwf-4, CRL-2787) cells were obtained from ATCC. CRFK cells were maintained in Dulbecco’s modified Eagle’s medium (DMEM; Sigma Aldrich, Darmstadt, Germany; CAT#D6429-500ML) supplemented with 10% fetal bovine serum (FBS) (Clark Bioscience, Richmond, VA, USA; CAT#FB25015) and 100 U/mL penicillin, 100 μg/mL streptomycin (Gibco, Thermo Fisher Scientific, Waltham, MA, USA; CAT#15140-122), at 37 °C in an atmosphere of humidified air containing 5% (v/v) CO2. Fcwf-4 cells were maintained in Eagle’s minimum essential medium (EMEM, Wisent Biotechnology (Nanjing) Co., Ltd, Nanjing, Jiangsu, China; CAT#320-006-CL) supplemented with 10% FBS (Gibco, Thermo Fisher Scientific, Waltham, MA, USA; CAT#10099141C), 100 U/mL penicillin, 100 μg/mL streptomycina, and 1 mM Sodium Pyruvate (Gibco, Thermo Fisher Scientific, Waltham, MA, USA; CAT#11360-070) at 37 °C in an atmosphere of humidified air containing 5% (v/v) CO2. Feline bone marrow-derived macrophage cells (BMDMs) were maintained in RPMI-1640 medium (Gibco, Thermo Fisher Scientific (Suzhou) Instruments Co., Ltd., Suzhou, Jiangsu, China; CAT#C11875500BT) supplemented with 10% FBS (Gibco, Thermo Fisher Scientific, Waltham, MA, USA; CAT#10099141C) and 100 U/mL penicillin, 100 μg/mL streptomycin, at 37 °C in an atmosphere of humidified air containing 5% (v/v) CO2. The recFECV-SDF-2 was constructed in a previous study and preserved in this laboratory [27].
The mouse-derived polyclonal antibody against FIPV N protein was prepared in this experiment. Monoclonal Anti-β-Actin antibody (CAT#A5441-100UL) and DAPI (CAT#D9542-5MG) were purchased from Sigma Aldrich (Darmstadt, Germany). Goat anti-Mouse IgG (H+L) Alexa Fluor™ 488 (CAT#A11001) was purchased from Thermo Fisher Scientific (Waltham, MA, USA). IRDye® 680RD Goat anti-Mouse IgG (H+L) (CAT#926-68070), IRDye® 800CW Goat anti-Rabbit IgG (H+L) (CAT#926-32211), and IRDye® 800CW Goat anti-Mouse IgG (H+L) (CAT#926-32210) were purchased from LI-COR Biosciences (Lincoln, NE, USA). Anti-HA Rabbit Polyclonal Antibody (CAT#51064-2-AP) was purchased from Proteintech (Wuhan, Hubei, China).

2.2. Rescue of the Recombinant Virus

The FIPV ORF1ab sequence was synthesized based on the NCBI database sequence (HLJ/HRB/2016/10, ACC#: KY566209.1) [28]. The recFECV-SDF-2-1abFIPV was constructed by a rapid reverse genetic system for feline coronavirus based on TAR cloning in yeast [27,29,30,31,32,33,34]. Two micrograms (μg) of infectious clone plasmid was added to 100 μL of DMEM and mixed thoroughly. Six μg of PEI was added to 100 μL of DMEM and mixed thoroughly. The plasmid mixture was combined with the PEI mixture and used to transfect the cells. After 6 h of transfection, the medium was replaced with DMEM containing 2% FBS.

2.3. Isolation and Culture of Feline BMDMs

Feline bone marrow-derived macrophages (BMDMs) were isolated and cultured following established protocols from previous studies [23,24,25]. In brief, a one-year-old, healthy cat was confirmed via PCR testing to be free from feline infectious viruses, including feline coronavirus, feline parvovirus, feline calicivirus, and feline herpes virus-1. To isolate the bone marrow, small openings were made at both ends of the femur and tibia of the cat using needles. Bone marrow cells were then repeatedly flushed using a 50 mL syringe. Following this, 40 mL of red blood cell (RBC) lysis buffer (Solarbio Science & Technology Co., Ltd., Beijing, China, CAT#R1010-500 mL) was added to lyse the red blood cells, and the cell pellet was resuspended in RPMI-1640 medium. The cell suspension was filtered (Falcon, Corning, NY, USA, CAT#352340) and further resuspended in RPMI-1640 medium supplemented with 10% FBS and 100 ng/mL granulocyte–macrophage colony-stimulating factor (GM-CSF) (Solarbio Science & Technology Co., Ltd., Beijing, China, CAT#P00130-50 µg). The cells were counted and seeded into a 24-well plate at a density of 1 × 10⁶ cells per well. Finally, the cells were cultured in an incubator at 37 °C with 5% CO2 for one week.

2.4. Viral Growth Kinetics

CRFK and BMDM cells were infected with the recFECV-SDF-2-1abFIPV at a multiplicity of infection (MOI) of 0.01. At 12 h, 24 h, 36 h, and 48 h postinfection, supernatant was collected and stored at −80 °C. The viral titer (TCID50) was determined in CRFK cells. The cells were seeded at a concentration of 5 × 10⁵ cells/mL. The viral suspension was diluted in a series of 10-fold dilutions (from 10−1 to 10−6), with six replicates for each dilution. Next, 100 µL of the diluted virus was added to each well, while 100 µL of DMEM was added to the control wells. After seven days of culture, cytopathic effects (CPEs) were observed and recorded for each dilution. The Reed–Muench method was then utilized to calculate the viral dilution required to infect 50% of the cells. Each viral suspension from the different time points was diluted independently three times, and the viral titer was evaluated in triplicate. The viral titer with three wells showing CPEs at the 10−1 dilution was considered to be 100 TCID50/mL. The limit of detection was 100 TCID50/mL.

2.5. Immunofluorescence Assay

The cells were washed three times with phosphate-buffered saline (PBS) after clear CPEs were observed, fixed at room temperature for 30 min, and then washed again and permeabilized using a 0.3% Triton X-100 solution for 5 min. They were blocked with 5% BSA in PBS buffer for 30 min before being stained with an anti-FCoV N antibody diluted to 1:1000 for 1 h. Following five more washes with PBS, the cells were incubated with anti-M Alexa 488 and DAPI, both diluted to 1:1000, for 1 h. The cells were washed five additional times with PBS and observed under a fluorescence microscope (Thermo Fisher Scientific, Waltham, MA, USA; EVOS FL Auto 2).

2.6. Electron Microscopy Identification

The rescued virus was inoculated into CRFK cells at an MOI of 0.1. After 72 h, the cells were broken through two freeze–thaw cycles and centrifuged at 60,000× g for 4 h at 4 °C. Following centrifugation, the pellet was resuspended in 8.75 mL of Hepes buffer (0.9% NaCl, 1 mM Hepes, pH 6.7) and kept in a refrigerator at 4 °C to dissolve. After 4 h, 625 µL of a 30% paraformaldehyde solution was added to achieve a final concentration of 2%. The virus was purified through centrifugation against a sucrose gradient (10%, 20%, and 30%) at 60,000× g for 4 h at 4 °C. After centrifugation, 38 mL of Hepes buffer was added and centrifuged again to purify the virus. The pellet was resuspended in 100 µL of Hepes buffer and placed in a refrigerator at 4 °C to dissolve overnight. The virus was then negatively stained and observed using electron microscopy.

2.7. Analysis of Gene Expression Using RT-qPCR

Total RNA was extracted using Trizol reagent (Takara Bio Inc., Beijing, China; CAT#9109). The reverse transcription process was completed by HiScript II Q Select RT SuperMix for qPCR (+gDNA wiper) (Vazyme Biotech Co., Ltd., Nanjing, Jiangsu, China; CAT#R233-01). Real-time RT-qPCR was performed using TB Green® Premix Ex Taq™ II (Tli RNaseH Plus) (Takara Bio Inc., Beijing, China; CAT#RR820A) and the Fluorescent Quantitative PCR Instrument (Applied Biosystems, Thermo Fisher Scientific, Waltham, MA, USA; QuantStudio 5). The amplification procedure was as follows: 95 °C for 30 s, followed by 40 cycles of two steps (95 °C for 10 s and 60 °C for 30 s), 95 °C for 15 s, 60 °C for 1 min, and 95 °C for 15 s. The GAPDH gene served as the internal control. Three replicates were assayed for each individual transcript in each sample. Changes in gene expression relative to the control were calculated using the delta–delta cycle threshold (ΔΔCT) method. The primer pairs used were as follows: RIG-I F and R (TGTCGCCCTGGTTTAAGGAC; CCAAAAAGCCACGGAACCAG), MDA5 F and R (GGAGCTAACAGGCACCACTT; TGACCCGTGGCTACAAGAAC), and GAPDH F and R (GCCATCAATGACCCCTTCAT; GCCGTGGAATTTGCCGT). The primers for MDA5, RIG-I, and GAPDH have been validated through sequencing analysis of the amplicons. The primer pairs for IFN-β, ISG15, and IFIM1 were described previously [24]. All experiments were independently repeated three times.

2.8. Dual-Luciferase Reporter Assay

CRFK cells were plated in 24-well plates at 2.5 × 10⁵ per well and incubated until the cells reached about 80% confluency. Then, the cells were co-transfected with the reporter plasmid IFN-β-Luc [35], pRL-TK (Promega) encoding Renilla luciferase, entry vector (pCAGGs-3HA), or plasmids expressing the NSPs, using Lipofectamine 2000 regent (Invitogen, Thermo Fisher Scientific, Waltham, MA, USA; CAT#11668-019) transfection reagent. After 24 h, cells were stimulated with 20 hemagglutinating activity units of SeV. The luciferase activity was measured with a Dual-Luciferase® Reporter Assay System (Promega Corporation, Madison, WI, USA; CAT#E1910). Successful transfection of the reporter plasmids was validated by measuring the luciferase activity of the cells stimulated with Sev. All experiments were independently repeated three times.

2.9. Transcriptomic Assay

CRFK cells were infected with the recombinant viruses at 0.1 MOI for 16 h. Three replicates were prepared for each group. Then, the cells were washed three times with pre-cooled PBS, and treated with 1 mL Trizol until the cells were fully lysed. Total RNA was extracted and subjected to the transcriptomic analysis (Shanghai Personal Biotechnology Co., Ltd., Shanghai, China).
Briefly, three μg total RNA was used for library preparation. Poly (A)-tailed mRNA was enriched, fragmented, and reverse-transcribed into cDNA. Purified double-stranded cDNA was repaired, adenylated, and ligated with adapters. Fragments with a size of 400–500 bp were selected, PCR-amplified, and purified using AMPure XP beads (Beckman Coulter, Beverly, CA, USA). The libraries were assessed using an Agilent 2100 Bioanalyzer, and then sequenced on the Illumina NovaSeq 6000 platform under PE150 mode.
The high-quality clean reads were aligned to the reference genome (https://ftp.ensembl.org/pub/release-110/fasta/felis_catus/dna/Felis_catus.Felis_catus_9.0.dna.toplevel.fa.gz, accessed on 4 May 2023) using HISAT2 (v2.1.0). The uniquely mapped paired-end reads were retained for downstream analysis. The read counts for each gene were quantified using HTSeq (v0.11.2). Differential gene expression analysis was performed using edgeR (v3.26.6). Briefly, read counts were first normalized using the TMM (Trimmed Mean of M-values) method to account for differences in sequencing depth. Gene-wise exact tests were then applied to calculate p-values for expression differences between groups. The resulting p-values were adjusted for multiple comparisons using the Benjamini–Hochberg (BH) method to control the false discovery rate (FDR). Significantly differentially expressed genes were defined as those with an FDR < 0.05, and fold change (FC) > 2 (up) or FC < 0.5 (down). A hypergeometric test was applied to identify GO terms and the Kyoto Encyclopedia of Genes and Genomes (KEGG) pathways that were significantly enriched among the DEGs compared to the whole genomic background. GO enrichment analysis was performed using topGO (v2.36.0), while KEGG pathway enrichment was conducted with KOBAS (v3.0.3).

2.10. Proteomic Assay

CRFK cells were infected with the recombinant viruses at 0.1 MOI for 20 h and rinsed three times with ice-cold PBS. The cells were collected by scraping and lysed by the SDT buffer (4% SDS, 100 mM Tris–HCl, pH 7.6). Three replicates were prepared for each group. The proteomic analysis was performed by Shanghai Applied Protein Technology Co., Ltd. (Shanghai, China).
Briefly, the lysates were boiled for 15 min. Following centrifugation at 14,000 g for 40 min, the supernatant was quantified using the BCA Protein Assay Kit. DTT was added to each sample to a final concentration of 40 mM and mixed at 600 rpm for 1.5 h at 37 °C. After cooling to room temperature, IAA was introduced at a final concentration of 20 mM to alkylate reduced cysteine residues, followed by a 30 min incubation in the dark. The samples were then transferred to 10 kDa Microcon filter units. Each sample was desalted using C18 cartridges (Empore™ SPE MCX, 30 μm, Waters, Milford, MA, USA), concentrated by vacuum centrifugation, and redissolved in 40 μL of 0.1% (v/v) formic acid. Peptide concentration was determined by measuring UV absorbance at 280 nm. For DIA analysis, indexed retention time (iRT) peptides were added to the sample. The peptides from each sample were analyzed by an Orbitrap TM Astral TM mass spectrometer (Thermo Fisher Scientific, Waltham, MA, USA) connected to a Vanquish Neo system liquid chromatograph (Thermo Fisher Scientific, Waltham, MA, USA) in the data-independent acquisition (DIA) mode.
DIA data were processed using DIA-NN (version 1.8.1) with the following parameters: trypsin as the enzyme, a maximum of one missed cleavage, and carbamidomethylation as a fixed modification. Oxidation and N-terminal acetylation were considered variable modifications. Protein identifications were filtered at a 1% FDR, which corresponds to 99% confidence. The resulting p-values (determined by a t-test) were adjusted for multiple comparisons using the BH method to control FDR. After annotation, significantly differentially expressed proteins were selected based on the following criteria: an FC greater than 1.5 (indicating upregulation) or less than 0.67 (indicating downregulation), with FDR less than 0.05. Additionally, presence–absence differential proteins were identified using a screening criterion where proteins were detected (non-empty values) in at least half of the replicates in one group, while being completely absent (empty values) in all replicates of the other group. These proteins were then searched against the KEGG database (https://www.genome.jp/kegg/, accessed on 28 October 2024) to obtain KEGG Orthology (KO) identifiers, which were subsequently mapped to KEGG pathways.

2.11. Western Blotting

CRFK cells were infected with the rescued virus at an MOI of 0.1, and lysed with lysis buffer 24 h later. After electrophoresis, the protein gel was transferred to a PVDF membrane. The membrane was incubated with primary antibodies—anti-FCoV-N and anti-β-actin—each diluted at a ratio of 1:3000 for 1 h. The secondary antibody, anti-M-800, was applied at a dilution of 1:10,000 for another hour. After washing with TBST, imaging was performed using an Infrared Imaging System (LI-COR Biosciences, Lincoln, NE, USA; Odyssey CLX).
For the Western blotting of PL2pro and its mutants, cell lysates from double-luciferase reporter gene assays were used. The PL2pro and its mutants were detected with anti-HA. β-actin was used as an internal control.

2.12. Plasmid Construction

The coding sequences of the NSPs were amplified and cloned into the SphI site of the pCAGGS-3HA vector, placing a 3 × HA tag at the N-terminus of the protein. The PL1pro domain corresponds to amino acids (aa) 199–462 of NSP3, while the PL2pro domain spans aa 614–899. Using a similar method, the plasmids for the PL2pro mutants (C99A, H252A, and D265A, numbered from the first aa of PL2pro) were generated. The RIG-I and MDA5 genes were amplified from the genomic DNA of CRFK cells and subsequently cloned into the SphI site of the pCAGGS-3Flag vector, which also places a 3 × Flag tag at the N-terminus of the protein.

3. Results

3.1. Rescue of the recFECV-SDF-2-1abFIPV

In the current study, we constructed a recombinant virus, in which the entire ORF1ab of the recFECV-SDF-2 [27] was replaced with the corresponding sequence from a type I FIPV strain [28] (Figure 1a). The full length of the infectious clone was sequenced using the second-generation whole-plasmid sequencing method by Sangon Biotech (Shanghai) Co., Ltd. (Shanghai, China). The results indicated that no mutations occurred in the viral genomic sequence (Supplementary Material: sequence 1).
The recombinant virus (recFECV-SDF-2-1abFIPV) was rescued by transfecting CRFK cells with the plasmid containing the infectious clone. The expression of structural proteins was confirmed by staining the capsid protein N using an immunofluorescence assay (IFA) (Figure 1b). Three days after transfection, clear CPEs formed by the rescued virus were found in the transfected cells, while untransfected cells showed no CPEs. Virus particles exhibiting typical spike structures were observed under a transmission electron microscope (Figure 1c). These results indicate that we have successfully rescued the recFECV-SDF-2-1abFIPV.

3.2. Growth Kinetics of the recFECV-SDF-2-1abFIPV

We examined the growth kinetics of recFECV-SDF-2-1abFIPV in CRFK cells to investigate whether replacing the ORF1ab would affect the replication ability of the virus. Initially, we observed no differences between the recFECV-SDF-2-1abFIPV and the parental strain up to 48 h (Figure 2a,b). To further assess the replication rates of recFECV-SDF-2-1abFIPV in feline macrophages, we isolated monocytes from feline bone marrow and stimulated them in vitro with GM-CSF (100 ng/mL) for one week to induce differentiation into mature macrophages. We then infected these macrophages with each strain of virus at an MOI of 0.01 and measured the viral titers in the cell supernatants. The results indicated that the virus only replicated slightly, and there was still no significant difference between recFECV-SDF-2-1abFIPV and recFECV-SDF-2 during the first 48 h. (Figure 2c). However, at 60 h, the viral titer of recFECV-SDF-2 significantly decreased, while the titer of recFECV-SDF-2-1abFIPV remained relatively high. These findings suggest that the ORF1ab may play a role in virus burden during the later stages of infection.

3.3. Infection of recFECV-SDF-2-1abFIPV Causes Profound Changes in Protein Expression in CRFK Cells

To investigate the alterations in protein expression caused by the recFECV-SDF-2-1abFIPV infection, we conducted a proteomic analysis of CRFK cells infected with the virus at an MOI of 0.1 for 20 h. The analysis identified a total of 796 differentially expressed proteins in the infected cells compared to the uninfected controls. Among these, 490 proteins were upregulated and 306 were downregulated, both showing statistical significance (FDR < 0.05, FC > 1.5 for upregulation or FC < 0.67 for downregulation) (Figure 3a; Supplementary Table S1). For the CRFK cells infected with recFECV-SDF-2, we identified 1197 differentially expressed proteins compared to the uninfected cells, with 664 significantly upregulated and 533 downregulated (FDR < 0.05, FC > 1.5 for upregulation or FC < 0.67 for downregulation) (Figure 3b; Supplementary Table S2). The KEGG pathway enrichment analysis revealed different profiles of altered protein expression in the cells infected with recFECV-SDF-2-1abFIPV and recFECV-SDF-2 (Figure 3c,d), except for the oxidative phosphorylation and leukocyte transendothelial migration pathway. Notably, several interferon-stimulated genes (ISGs) were absent from the list of differentially expressed genes in cells infected with recFECV-SDF-2-1abFIPV (FDR < 0.05).

3.4. The Presence of ORF1ab of FIPV in the Recombinant Virus Enhances Innate Immune Suppression

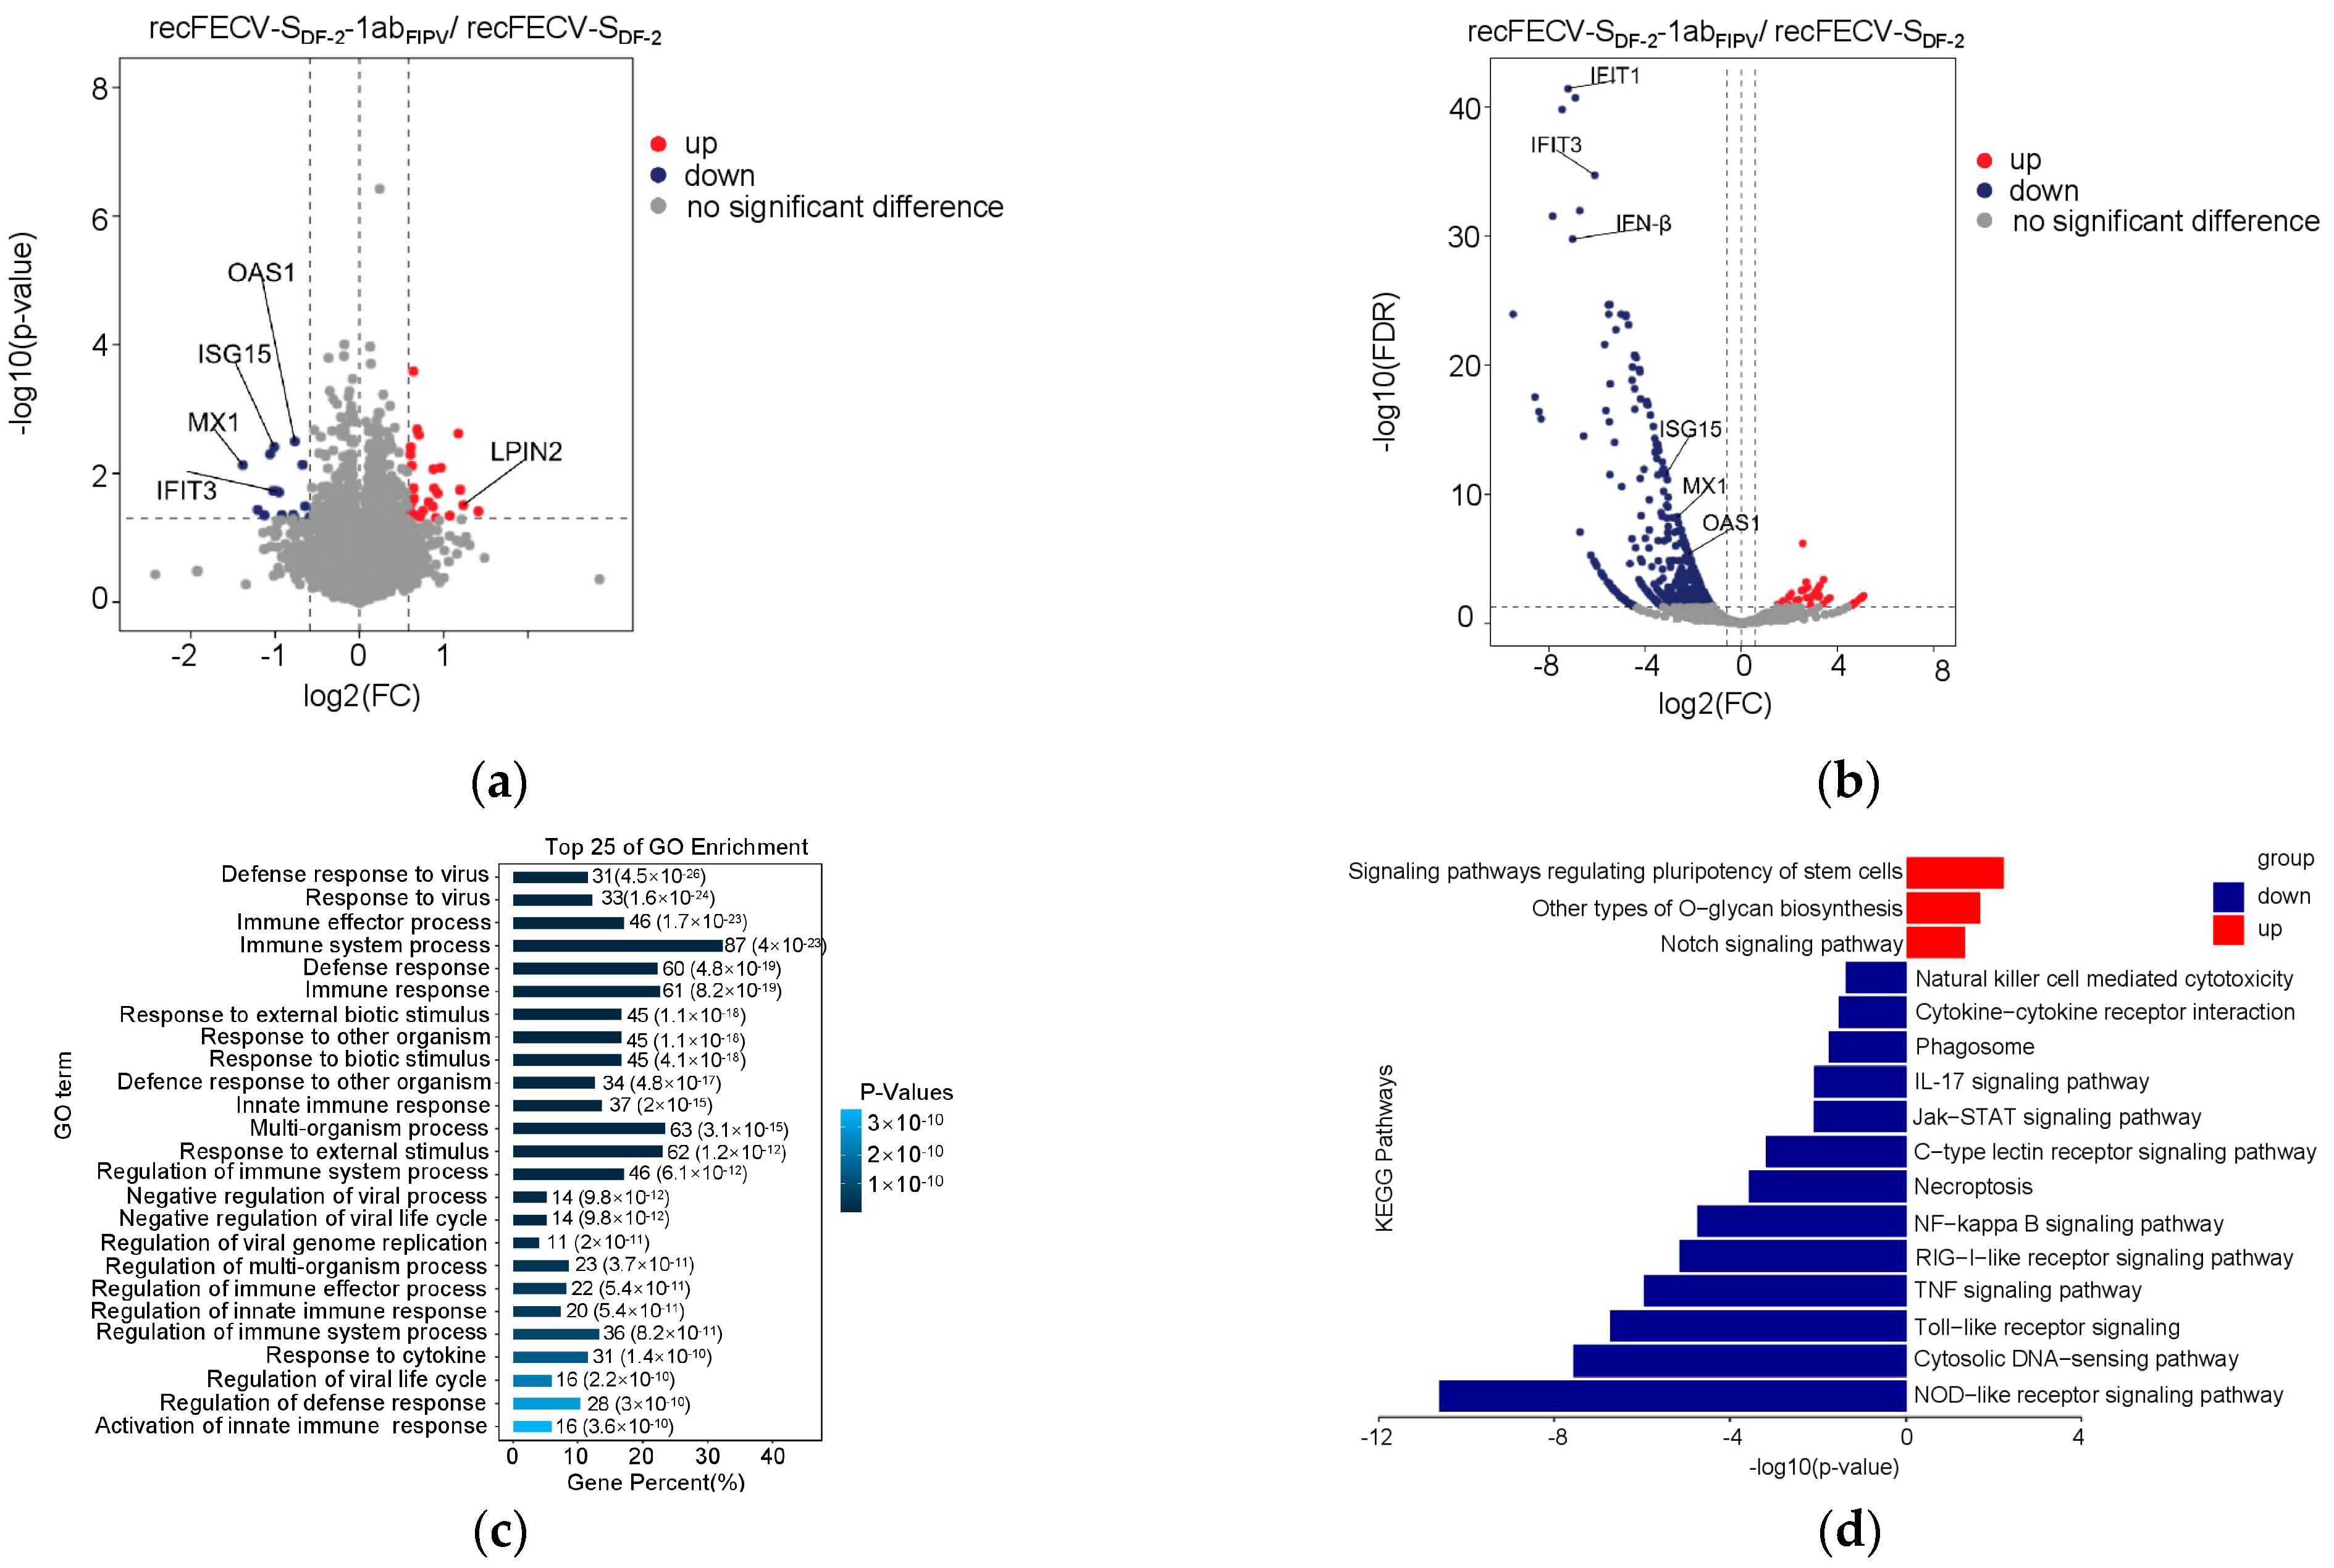
We compared the protein expression profiles in the cells infected with recFECV-SDF-2-1abFIPV to those in cells infected with its parental strain. We noted the overexpression of certain ISGs in cells infected with recFECV-SDF-2; this was not observed in cells infected with recFECV-SDF-2-1abFIPV. Most of the differentially expressed proteins we identified were filtered out after applying multiple testing correction to the p-values, likely due to the relatively low number of differentially expressed proteins. As a result, p-values were not corrected for this comparison. The results revealed a total of 43 proteins that were differentially expressed, with 27 exhibiting increased expression and 16 showing decreased expression (p < 0.05, FC > 1.5 for upregulation or FC < 0.67 for downregulation) (Figure 4a; Supplementary Table S3). As noted, several ISGs displayed lower expression levels in cells infected with recFECV-SDF-2-1abFIPV. To investigate whether similar differences in innate immune suppression could be observed in macrophages, we infected a macrophage-like cell line, Fcwf-4, at a dose of 0.1 MOI for 16 h and performed a transcriptomic analysis. The six transcriptome samples generated paired reads ranging from 26, 046, and 534 to 31, 785, and 660, with an average of 28, 614, and 127 reads per sample (Supplementary Table S4). The Q30 base percentage was greater than 99% for all samples. When comparing the cells infected with recFECV-SDF-2 to those infected with recFECV-SDF-2-1abFIPV, a total of 578 genes exhibited differential expression. Among these, 47 genes were more highly expressed, while 531 genes showed reduced expression in the cells infected with recFECV-SDF-2-1abFIPV (FDR < 0.05, FC > 2 for upregulation or FC < 0.5 for downregulation). Notable examples of these genes include IFN-β and several interferon-stimulated genes (ISGs) such as IFIT-1, IFIT-3, ISG15, MX1, and OAS1 (Figure 4b; Supplementary Table S5). Gene Ontology (GO) analysis indicated that immune-related terms were significantly enriched among the genes differentially expressed in cells infected with recFECV-SDF-2-1abFIPV (Figure 4c). Additionally, KEGG enrichment analysis demonstrated that innate immune response pathways, including the NF-κB, RIG-I-like receptor, and NOD-like receptor signaling pathways, were significantly suppressed in these cells (Figure 4d). These findings suggest that the ORF1ab of this strain of FIPV has an enhanced immune suppression effect in macrophages as well.

3.5. NSP1 and NSP3 Are Involved in the Function of Innate Immune Suppression

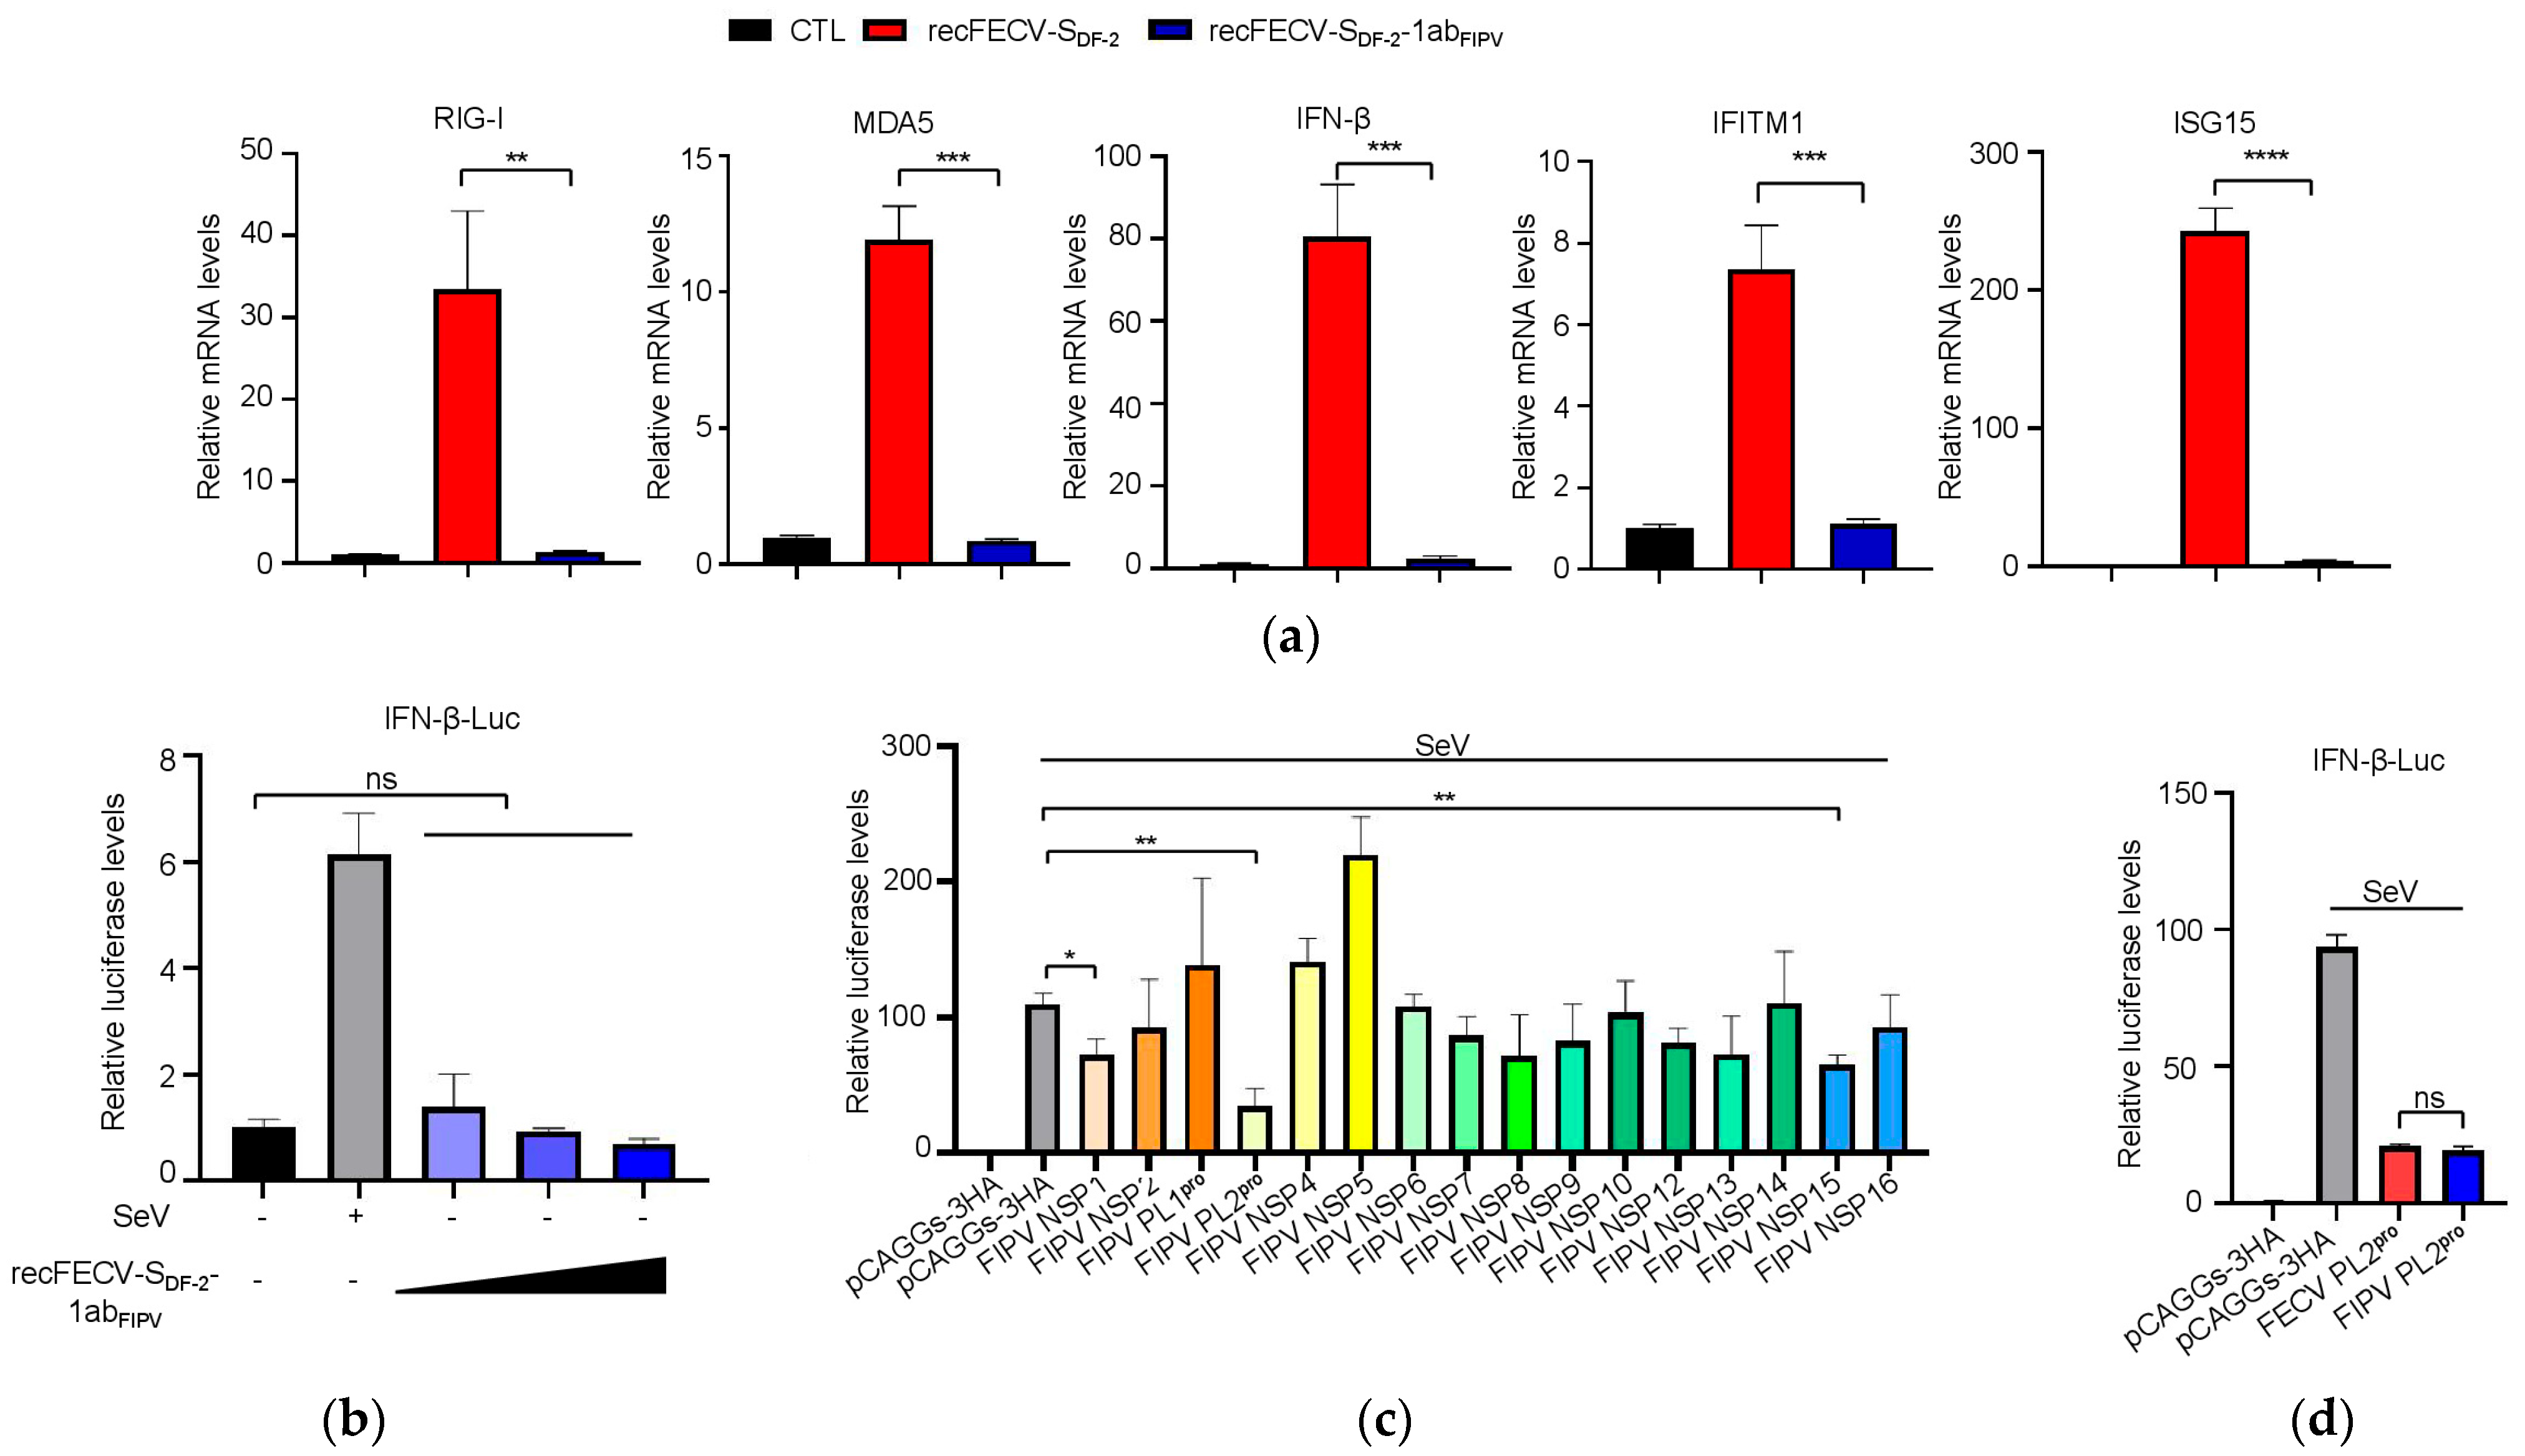
To confirm the immune suppression effect of recFECV-SDF-2-1abFIPV, as indicated by our proteomic and transcriptomic analyses, we measured the mRNA levels of RIG-I, MDA5, IFN-β, and ISGs (ISG15 and IFITM1) in the cells infected with the virus using quantitative reverse transcription PCR (RT-qPCR) in cells infected with either recFECV-SDF-2-1abFIPV or the parental strain virus, recFECV-SDF-2. As expected, we observed upregulation in the expression of all these genes solely in the cells infected with the parental strain (recFECV-SDF-2), while no clear increase was seen in the cells infected with the recFECV-SDF-2-1abFIPV (Figure 5a). Next, we examined the innate immune suppression effect of recFECV-SDF-2-1abFIPV infection in CRFK cells transfected with an IFN-Luc reporter plasmid. The results indicated that IFN-β expression was successfully stimulated in the cells infected with SeV. However, recFECV-SDF-2-1abFIPV failed to stimulate IFN-β expression (Figure 5b).
The ORF1ab encodes 16 NSPs. NSP1 and NSP5 derived from FIPVs have been reported to inhibit innate immune responses [24,26]. To determine whether these NSPs contribute to the innate immune suppression effects, we analyzed the effect of ectopic expression of each NSP on IFN expression induced by SeV in CRFK cells. We co-transfected CRFK cells with HA-tagged NSPs and the IFN-Luc reporter plasmid. SeV was introduced to the cells 24 h later to stimulate expression of the IFN-β promoter. As illustrated in Figure 5c, we identified two NSPs (NSP1 and NSP3) of this FIPV strain that exhibited an inhibitory effect on IFN-β expression. We compared the inhibitory activity of NSP3 from FIPV with that of NSP3 from FECV. Our findings indicated that NSP3 demonstrated no difference in innate immune suppression between FIPV and FECV.

3.6. The PL2 Protease Activity of NSP3 Is Required for Its Role in Innate Immune Suppression

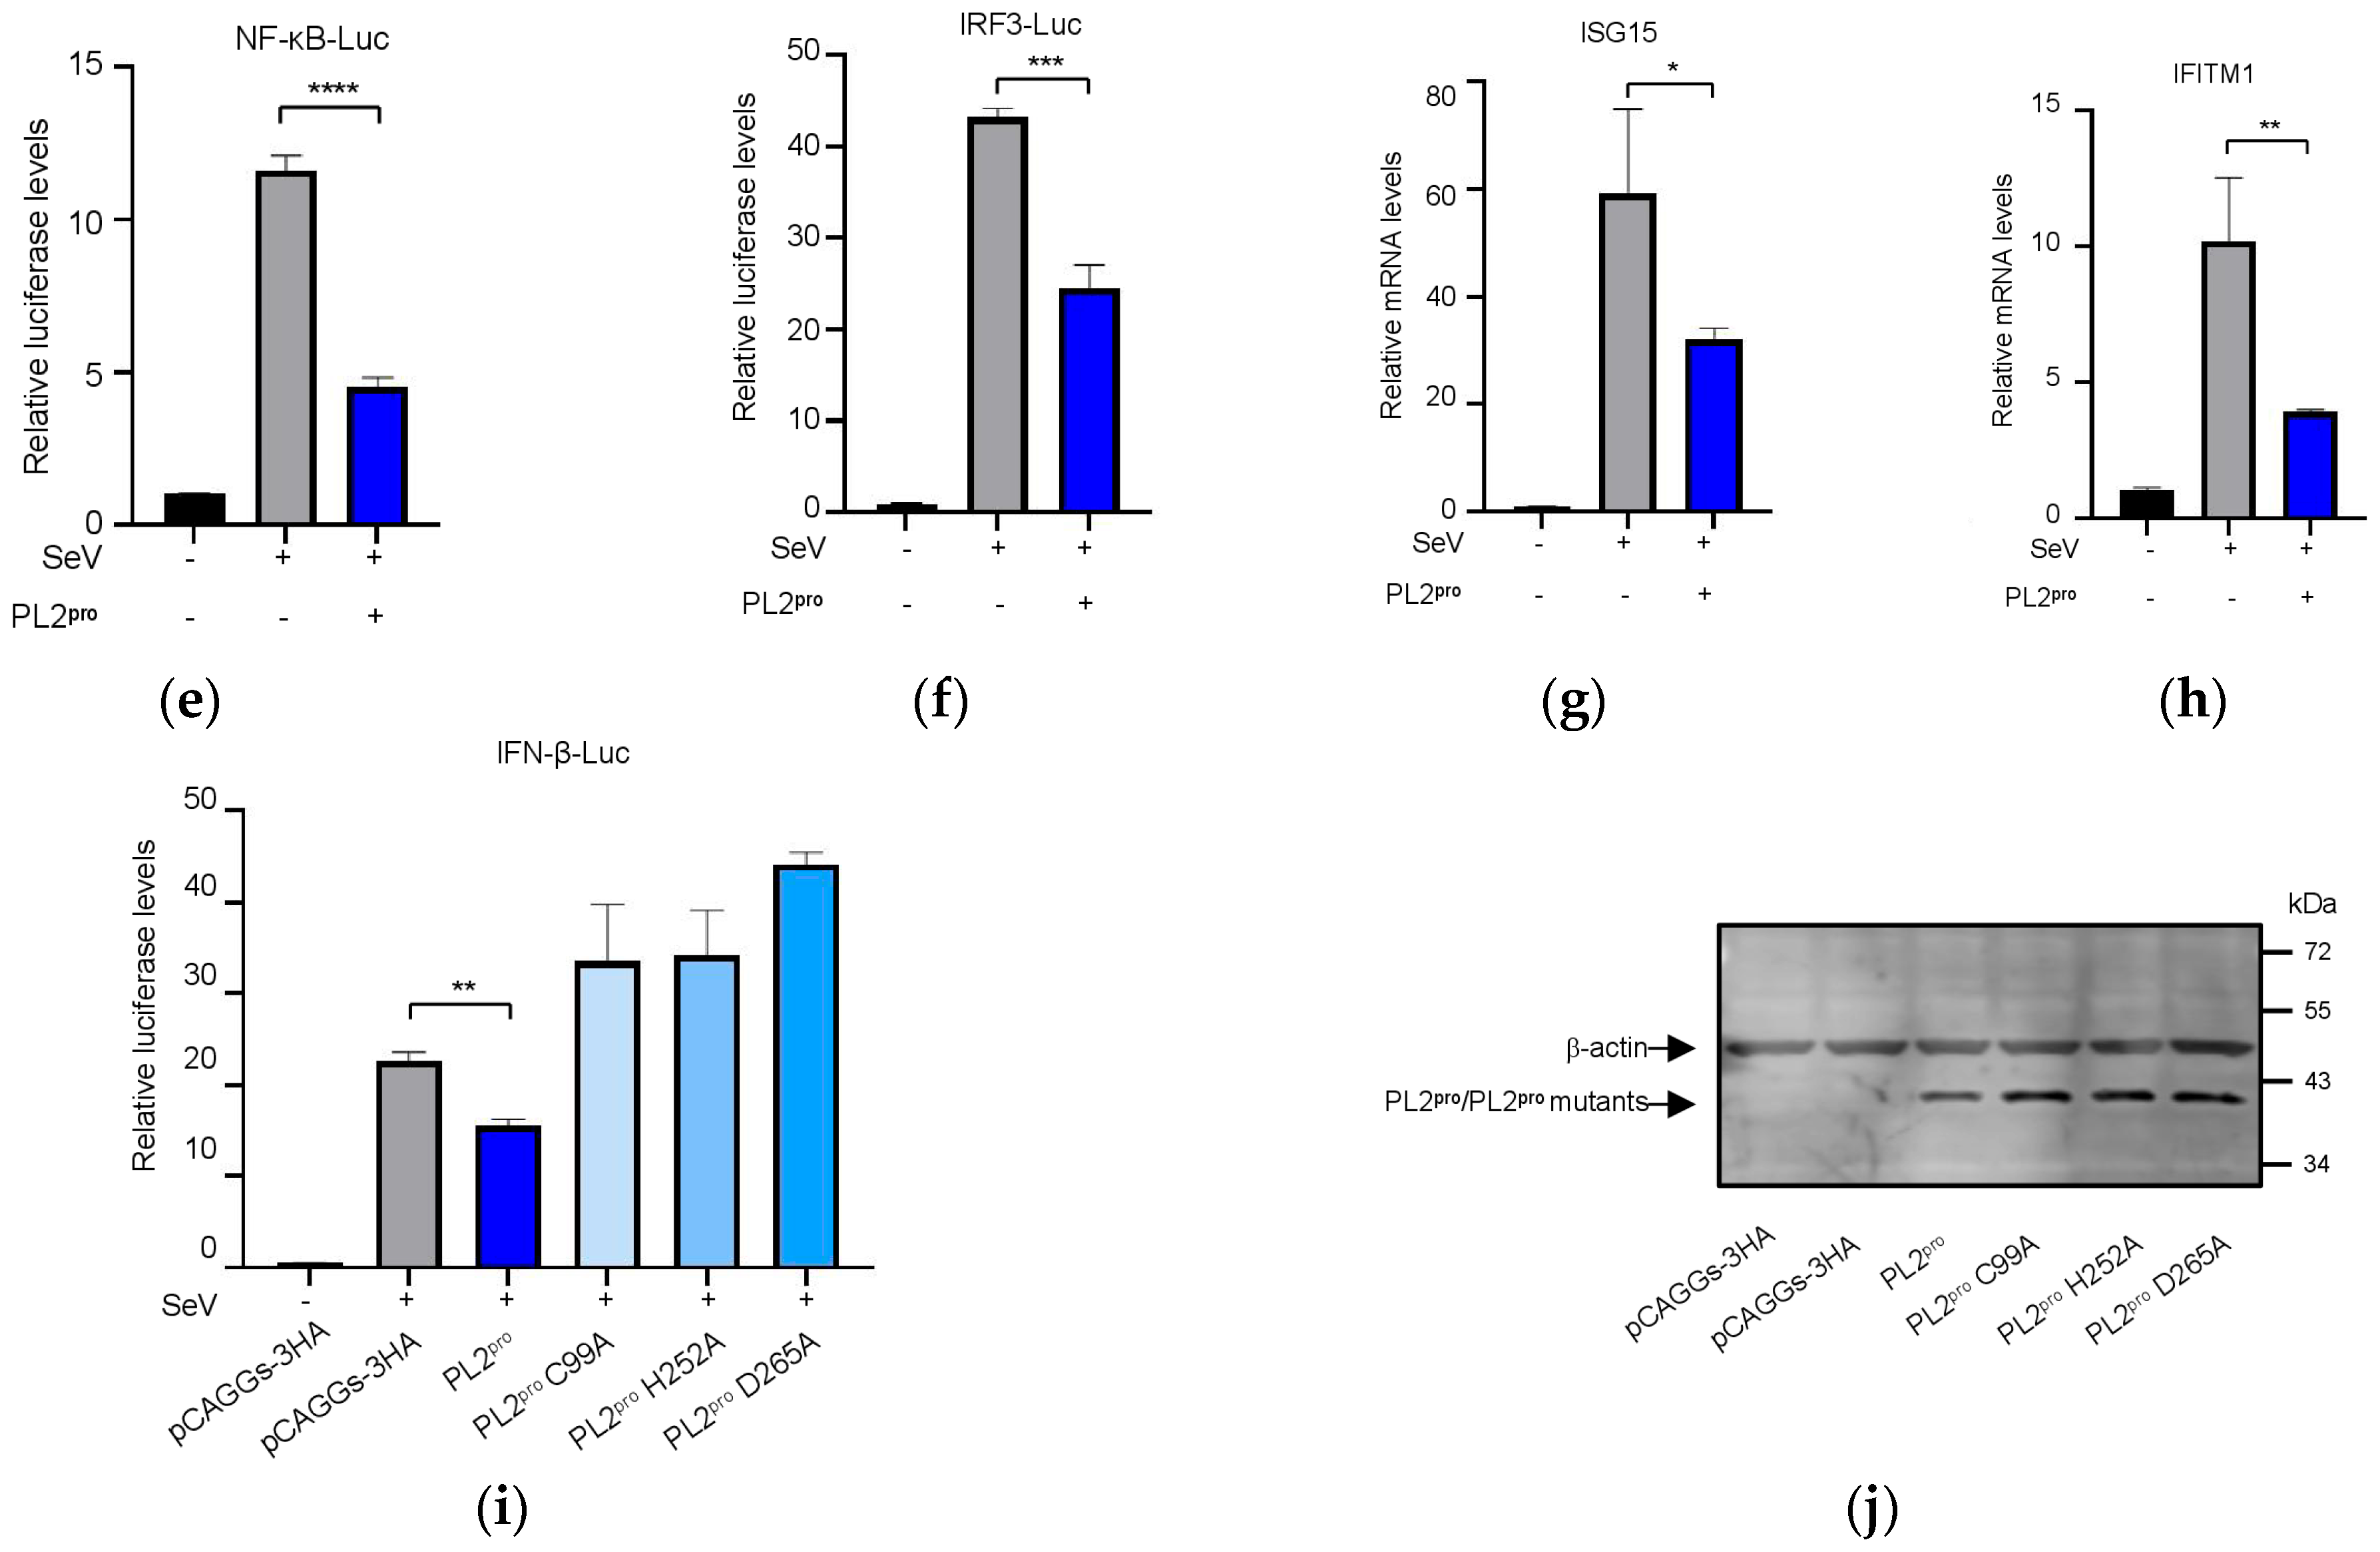
To confirm the inhibitory role of PL2pro of NSP3 in IFN-β production, CRFK cells were transfected with the IFN-β-Luc reporter plasmid along with varying amounts of plasmid expressing PL2pro. Luciferase activity was measured after stimulation with SeV, RIG-I, or MDA5. As shown in Figure 6a–c, activation of the IFN-β promotor could be inhibited by expressing PL2pro. The inhibitory effect of the PL2pro on the production of IFN-β mRNA was confirmed by RT-qPCR (Figure 6d). To identify which transcription factor was inhibited by PL2pro, we co-transfected CRFK cells with the NF-κB-Luc or IRF3-Luc reporter plasmids and PL2pro and stimulated them with SeV. The results indicated that PL2pro significantly reduced the activation of both NF-κB and IRF3 in mediating IFN production (Figure 6e,f). Furthermore, the inhibitory effect of PL2pro on the production of ISG15 and IFITM1 mRNA could be observed through the RT-qPCR (Figure 6g,h). We then constructed plasmids expressing PL2pro with mutated enzymatic sites to evaluate their effect on IFN-β production. The results showed that the inhibitory effect of PL2pro on IFN-β production was dependent on its protease activity (Figure 6i). The results of Western blotting showed that the mutants of PL2pro could be stably expressed (Figure 6j).

4. Discussion

In feline populations, FECV is highly prevalent, primarily causing enteritis in juvenile cats while often remaining asymptomatic in adult cats. In contrast, FIPV occurs sporadically but can cause severe disease. Currently, the development of vaccines for FIP faces several challenges. Firstly, different serotype strains do not offer cross-protection, which limits the clinical efficacy of vaccines. Additionally, antibody-dependent enhancement (ADE) induced by the vaccines could worsen the disease [36]. Clinically, cases of FIP can be categorized as either effusive (wet) or non-effusive (dry). Effusive cases are characterized by the presence of ascites, pleural effusion, and pericardial effusion, while non-effusive cases often present with multiple pyogranulomas. Mixed forms can also occur. In the case of diagnostics, although immunohistochemical staining (IHC) for detecting the virus in infected tissues is considered an effective method for laboratory confirmation of FIP [37], this approach does not enable in vivo detection, particularly in cases where ascites is not produced, making clinical diagnosis more challenging. Therefore, it is urgent to determine the genetic features of FIPV, which will favor the development of molecular diagnostic tools.
In this study, we found that the presence of the ORF1ab derived from an FIPV strain enhanced the immune suppression activity of the virus in both CRFK and Fcwf-4 cells. This finding provides new insights into the biological features of FIPV. A previous study revealed that interferon production is differentially induced when Fcwf-4 cells are infected with various virus strains. In that study, the virulent strains (79-1146, identical to DF-2 and UCD-1) exhibited stronger inhibitory effects on interferon expression, although an avirulent strain (79-1683) demonstrated a similar capability [25]. It would be interesting to investigate whether the enhanced immune suppression caused by ORF1ab is a general feature of FIPVs and whether it occurs in vivo.
In addition, it has been suggested that mutations in the FECV genome lead to biotype conversion of the virus [2,4]. However, this hypothesis remains unverified, partly due to a lack of understanding of the distinct biological characteristics of FIPV and because studies on the pathogenesis of the virus largely rely on animal challenge experiments. A previous study reported that a chimeric type I FCoV containing sequences derived from type II FIPV, including ORF1b and S, 3a, 3b, and 3c, failed to induce clinical signs of FIP, indicating that these sequences are not sufficient to enhance pathogenicity [38]. This suggests that other sequences may play a role in defining the distinct biological characteristics of the viruses. It would be more interesting to investigate whether the enhanced suppression of the innate immune response by ORF1ab of FIPV is related to the pathogenesis of the virus through animal challenge experiments.
In previous studies, NSP1 and NSP5 of FIPV were shown to play important roles in evading the innate immune response [24,26]. In our current study, we also found that NSP1 exhibits an inhibitory effect on the innate immune response. However, NSP5 derived from the current strain of FIPV did not demonstrate any inhibitory function. Instead, we identified that PL2pro fulfills the role of inhibiting IFN-β production. These findings suggest that the inhibitory effects may be strain-specific. Our data revealed that expression of PL2pro could inhibit the activation of the IFN-β promoter stimulated by overexpression of RIG-1 or MDA5, which indicated that the target protein of PL2pro might exist downstream of the RNA sensors. However, PL2pro in other coronaviruses has been reported to have multiple targets for mediating innate immune evasion [39,40]. Therefore, multiple mechanisms might exist for the role of PL2pro in regulating the innate immune response. Unfortunately, our data showed that the PL2pro from both FIPV and FECV functions in immune suppression. Thus, detailed mapping within the ORF1ab using recombinant viruses with exchanged fragments of FIPV and FECV is still necessary for further investigation to identify the core factors associated with ORF1ab that contribute to this immune suppression role.
In summary, we have successfully constructed a recombinant virus harboring the ORF1ab from a virulent FIPV strain. Our findings suggest that ORF1ab from FIPV possesses a unique feature related to immune suppression. It remains unclear why ORF1ab exhibits an enhanced inhibitory function in innate immune responses, especially since PL2pro from FECV and FIPV exhibits similar inhibitory effects. Therefore, additional investigation is needed to address this issue.

Supplementary Materials

The following supporting information can be downloaded at: https://www.mdpi.com/article/10.3390/v17091282/s1, Table S1: Differentially expressed proteins between cells infected with recFECV-SDF-2-1abFIPV and CTL; Table S2: Differentially expressed proteins between cells infected with recFECV-SDF-2 and CTL; Table S3: Differentially expressed proteins between cells infected with recFECV-SDF-2-1abFIPV and recFECV-SDF-2; Table S4: The paired-end reads of cells infected with recFECV-SDF-2-1abFIPV and recFECV-SDF-2; Table S5: Differentially expressed genes between cells infected with recFECV-SDF-2-1abFIPV and recFECV-SDF-2.

Author Contributions

Conceptualization, H.K. and H.J.; formal analysis, H.G.; investigation, H.G. and C.X.; resources, H.J.; writing—original draft preparation, H.G. and H.J.; writing—review and editing, H.K. and H.J.; supervision, H.J.; project administration, H.J.; funding acquisition, H.K. All authors have read and agreed to the published version of the manuscript.

Funding

This research was funded by grants from the National Natural Science Foundation of China (No. 32370164), and Central Public-interest Scientific Institution Basal Research Fund (No. 1610302022009), both provided to H.K.

Institutional Review Board Statement

The animal study protocol was approved by the Animal Welfare and Ethics Committee of Harbin Veterinary Research Institute (241017-01-GR, 17 October 2024).

Data Availability Statement

All data are available in the manuscript.

Acknowledgments

The authors gratefully acknowledge Natalay Kouprina and Vladimir Larionov from the Laboratory of Biosystems and Cancer, National Cancer Institute, Bethesda, Maryland 20892, USA, for kindly providing the Saccharomyces cerevisiae VL6-48N strain.

Conflicts of Interest

The authors declare no conflicts of interest.

Abbreviations

The following abbreviations are used in this manuscript:
FIPFeline infectious peritonitis
FIPVFeline infectious peritonitis virus
FECVFeline enteric coronavirus
FCoVFeline coronavirus
IFN-βInterferon β
SSpike protein
EEnvelope protein
MMembrane protein
NNucleocapsid protein
PL2Papain-like protease 2
CRFKCrandell feline kidney
Fcwf-4Felis catus whole fetus-4
LucLuciferase
SeVSendai virus
NSPsNon-structural proteins
DMEMDulbecco’s modified Eagle’s medium
PBSPhosphate-buffered saline
CPECytopathic effects
GOGene Ontology
KEGGKyoto Encyclopedia of Genes and Genomes
ISGsInterferon-stimulated genes
FDRFalse discovery rate
EMEMEagle’s minimum essential medium
RT-qPCRQuantitative reverse transcription PCR

References

  1. Evermann, J.F.; Baumgartener, L.; Ott, R.L.; Davis, E.V.; McKeirnan, A.J. Characterization of a feline infectious peritonitis virus isolate. Vet. Pathol. 1981, 18, 256–265. [Google Scholar] [CrossRef]
  2. Poland, A.M.; Vennema, H.; Foley, J.E.; Pedersen, N.C. Two related strains of feline infectious peritonitis virus isolated from immunocompromised cats infected with a feline enteric coronavirus. J. Clin. Microbiol. 1996, 34, 3180–3184. [Google Scholar] [CrossRef]
  3. Pedersen, N.C.; Boyle, J.F.; Floyd, K.; Fudge, A.; Barker, J. An enteric coronavirus infection of cats and its relationship to feline infectious peritonitis. Am. J. Vet. Res. 1981, 42, 368–377. [Google Scholar] [CrossRef]
  4. Vennema, H.; Poland, A.; Foley, J.; Pedersen, N.C. Feline infectious peritonitis viruses arise by mutation from endemic feline enteric coronaviruses. Virology 1998, 243, 150–157. [Google Scholar] [CrossRef] [PubMed]
  5. Foley, J.E.; Poland, A.; Carlson, J.; Pedersen, N.C. Patterns of feline coronavirus infection and fecal shedding from cats in multiple-cat environments. J. Am. Vet. Med. Assoc. 1997, 210, 1307–1312. [Google Scholar] [CrossRef]
  6. Solikhah, T.I.; Agustin, Q.A.D.; Damaratri, R.A.; Siwi, D.A.F.; Rafi’uttaqi, G.N.; Hartadi, V.A.; Solikhah, G.P. A review of feline infectious peritonitis virus infection. Vet. World 2024, 17, 2417–2432. [Google Scholar] [CrossRef] [PubMed]
  7. Pedersen, N.C. Virologic and immunologic aspects of feline infectious peritonitis virus infection. Adv. Exp. Med. Biol. 1987, 218, 529–550. [Google Scholar] [CrossRef] [PubMed]
  8. Wang, Y.T.; Su, B.L.; Hsieh, L.E.; Chueh, L.L. An outbreak of feline infectious peritonitis in a Taiwanese shelter: Epidemiologic and molecular evidence for horizontal transmission of a novel type II feline coronavirus. Vet. Res. 2013, 44, 57. [Google Scholar] [CrossRef] [PubMed]
  9. Attipa, C.; Warr, A.S.; Epaminondas, D.; O’Shea, M.; Hanton, A.J.; Fletcher, S.; Malbon, A.; Lyraki, M.; Hammond, R.; Hardas, A.; et al. Feline infectious peritonitis epizootic caused by a recombinant coronavirus. Nature 2025, 645, 228–234. [Google Scholar] [CrossRef]
  10. Tortorici, M.A.; Choi, A.; Gibson, C.A.; Lee, J.; Brown, J.T.; Stewart, C.; Joshi, A.; Harari, S.; Willoughby, I.; Treichel, C.; et al. Loss of FCoV-23 spike domain 0 enhances fusogenicity and entry kinetics. Nature 2025, 645, 235–243. [Google Scholar] [CrossRef]
  11. Olarte-Castillo, X.A.; Frazier, L.E.; Gomes Noll, J.C.; Choi, A.; Whittaker, G.R. Rethinking the drivers of coronavirus virulence and pathogenesis; toward an understanding of the dynamic world of mutations, indels, and recombination within the alphacoronaviruses. mBio 2025, e01921-25. [Google Scholar] [CrossRef]
  12. Pedersen, N.C. A review of feline infectious peritonitis virus infection: 1963–2008. J. Feline Med. Surg. 2009, 11, 225–258. [Google Scholar] [CrossRef]
  13. Bank-Wolf, B.R.; Stallkamp, I.; Wiese, S.; Moritz, A.; Tekes, G.; Thiel, H.J. Mutations of 3c and spike protein genes correlate with the occurrence of feline infectious peritonitis. Vet. Microbiol. 2014, 173, 177–188. [Google Scholar] [CrossRef]
  14. Kennedy, M.; Boedeker, N.; Gibbs, P.; Kania, S. Deletions in the 7a ORF of feline coronavirus associated with an epidemic of feline infectious peritonitis. Vet. Microbiol. 2001, 81, 227–234. [Google Scholar] [CrossRef]
  15. Thiel, V.; Thiel, H.J.; Tekes, G. Tackling feline infectious peritonitis via reverse genetics. Bioengineered 2014, 5, 396–400. [Google Scholar] [CrossRef]
  16. Ehmann, R.; Kristen-Burmann, C.; Bank-Wolf, B.; König, M.; Herden, C.; Hain, T.; Thiel, H.J.; Ziebuhr, J.; Tekes, G. Reverse Genetics for Type I Feline Coronavirus Field Isolate To Study the Molecular Pathogenesis of Feline Infectious Peritonitis. mBio 2018, 9, e01422-18. [Google Scholar] [CrossRef]
  17. Wang, G.; Hu, G.; Liang, R.; Shi, J.; Qiu, X.; Yang, Y.; Jiao, Z.; Chen, Y.; Shen, Z.; Li, M.; et al. Establishment of Full-Length cDNA Clones and an Efficient Oral Infection Model for Feline Coronavirus in Cats. J. Virol. 2021, 95, e0074521. [Google Scholar] [CrossRef]
  18. Takano, T.; Yamada, S.; Doki, T.; Hohdatsu, T. Pathogenesis of oral type I feline infectious peritonitis virus (FIPV) infection: Antibody-dependent enhancement infection of cats with type I FIPV via the oral route. J. Vet. Med. Sci. 2019, 81, 911–915. [Google Scholar] [CrossRef] [PubMed]
  19. Takano, T.; Nakaguchi, M.; Doki, T.; Hohdatsu, T. Antibody-dependent enhancement of serotype II feline enteric coronavirus infection in primary feline monocytes. Arch. Virol. 2017, 162, 3339–3345. [Google Scholar] [CrossRef] [PubMed]
  20. Brown, M.A.; Troyer, J.L.; Pecon-Slattery, J.; Roelke, M.E.; O’Brien, S.J. Genetics and pathogenesis of feline infectious peritonitis virus. Emerg. Infect. Dis. 2009, 15, 1445–1452. [Google Scholar] [CrossRef] [PubMed]
  21. Healey, E.A.; Andre, N.M.; Miller, A.D.; Whittaker, G.R.; Berliner, E.A. Outbreak of feline infectious peritonitis (FIP) in shelter-housed cats: Molecular analysis of the feline coronavirus S1/S2 cleavage site consistent with a ‘circulating virulent-avirulent theory’ of FIP pathogenesis. JFMS Open Rep. 2022, 8, 20551169221074226. [Google Scholar] [CrossRef]
  22. Dedeurwaerder, A.; Desmarets, L.M.; Olyslaegers, D.A.J.; Vermeulen, B.L.; Dewerchin, H.L.; Nauwynck, H.J. The role of accessory proteins in the replication of feline infectious peritonitis virus in peripheral blood monocytes. Vet. Microbiol. 2013, 162, 447–455. [Google Scholar] [CrossRef] [PubMed]
  23. Vermeulen, B.L.; Devriendt, B.; Olyslaegers, D.A.; Dedeurwaerder, A.; Desmarets, L.M.; Favoreel, H.W.; Dewerchin, H.L.; Nauwynck, H.J. Suppression of NK cells and regulatory T lymphocytes in cats naturally infected with feline infectious peritonitis virus. Vet. Microbiol. 2013, 164, 46–59. [Google Scholar] [CrossRef]
  24. Chen, S.; Tian, J.; Li, Z.; Kang, H.; Zhang, J.; Huang, J.; Yin, H.; Hu, X.; Qu, L. Feline Infectious Peritonitis Virus Nsp5 Inhibits Type I Interferon Production by Cleaving NEMO at Multiple Sites. Viruses 2019, 12, 43. [Google Scholar] [CrossRef]
  25. Doki, T.; Yabe, M.; Takano, T.; Hohdatsu, T. Differential induction of type I interferon by type I and type II feline coronaviruses in vitro. Res. Vet. Sci. 2018, 120, 57–62. [Google Scholar] [CrossRef]
  26. Shen, Z.; Yang, Y.; Yang, S.; Zhang, G.; Xiao, S.; Fu, Z.F.; Peng, G. Structural and Biological Basis of Alphacoronavirus nsp1 Associated with Host Proliferation and Immune Evasion. Viruses 2020, 12, 812. [Google Scholar] [CrossRef]
  27. Cao, H.; Gu, H.; Kang, H.; Jia, H. Development of a rapid reverse genetics system for feline coronavirus based on TAR cloning in yeast. Front. Microbiol. 2023, 14, 1141101. [Google Scholar] [CrossRef] [PubMed]
  28. Li, C.; Liu, Q.; Kong, F.; Guo, D.; Zhai, J.; Su, M.; Sun, D. Circulation and genetic diversity of Feline coronavirus type I and II from clinically healthy and FIP-suspected cats in China. Transbound. Emerg. Dis. 2019, 66, 763–775. [Google Scholar] [CrossRef] [PubMed]
  29. Kouprina, N.; Larionov, V. TAR cloning: Insights into gene function, long-range haplotypes and genome structure and evolution. Nat. Rev. Genet. 2006, 7, 805–812. [Google Scholar] [CrossRef]
  30. Kouprina, N.; Larionov, V. Selective isolation of genomic loci from complex genomes by transformation-associated recombination cloning in the yeast Saccharomyces cerevisiae. Nat. Protoc. 2008, 3, 371–377. [Google Scholar] [CrossRef]
  31. Kouprina, N.; Larionov, V. Transformation-associated recombination (TAR) cloning and its applications for gene function; genome architecture and evolution; biotechnology and biomedicine. Oncotarget 2023, 14, 1009–1033. [Google Scholar] [CrossRef]
  32. Noskov, V.N.; Kouprina, N.; Leem, S.H.; Ouspenski, I.; Barrett, J.C.; Larionov, V. A general cloning system to selectively isolate any eukaryotic or prokaryotic genomic region in yeast. BMC Genom. 2003, 4, 16. [Google Scholar] [CrossRef]
  33. Nikiforuk, A.M.; Leung, A.; Cook, B.W.M.; Court, D.A.; Kobasa, D.; Theriault, S.S. Rapid one-step construction of a Middle East Respiratory Syndrome (MERS-CoV) infectious clone system by homologous recombination. J. Virol. Methods 2016, 236, 178–183. [Google Scholar] [CrossRef] [PubMed]
  34. Thi Nhu Thao, T.; Labroussaa, F.; Ebert, N.; V’Kovski, P.; Stalder, H.; Portmann, J.; Kelly, J.; Steiner, S.; Holwerda, M.; Kratzel, A.; et al. Rapid reconstruction of SARS-CoV-2 using a synthetic genomics platform. Nature 2020, 582, 561–565. [Google Scholar] [CrossRef] [PubMed]
  35. Tian, J.; Zhang, X.; Wu, H.; Liu, C.; Liu, J.; Hu, X.; Qu, L. Assessment of the IFN-β response to four feline caliciviruses: Infection in CRFK cells. Infect. Genet. Evol. J. Mol. Epidemiol. Evol. Genet. Infect. Dis. 2015, 34, 352–360. [Google Scholar] [CrossRef] [PubMed]
  36. Weiss, R.C.; Scott, F.W. Antibody-mediated enhancement of disease in feline infectious peritonitis: Comparisons with dengue hemorrhagic fever. Comp. Immunol. Microbiol. Infect. Dis. 1981, 4, 175–189. [Google Scholar] [CrossRef]
  37. Giori, L.; Giordano, A.; Giudice, C.; Grieco, V.; Paltrinieri, S. Performances of different diagnostic tests for feline infectious peritonitis in challenging clinical cases. J. Small Anim. Pract. 2011, 52, 152–157. [Google Scholar] [CrossRef] [PubMed]
  38. Tekes, G.; Spies, D.; Bank-Wolf, B.; Thiel, V.; Thiel, H.J. A reverse genetics approach to study feline infectious peritonitis. J. Virol. 2012, 86, 6994–6998. [Google Scholar] [CrossRef]
  39. Barretto, N.; Jukneliene, D.; Ratia, K.; Chen, Z.; Mesecar, A.D.; Baker, S.C. The papain-like protease of severe acute respiratory syndrome coronavirus has deubiquitinating activity. J. Virol. 2005, 79, 15189–15198. [Google Scholar] [CrossRef]
  40. Bailey-Elkin, B.A.; Knaap, R.C.; Johnson, G.G.; Dalebout, T.J.; Ninaber, D.K.; van Kasteren, P.B.; Bredenbeek, P.J.; Snijder, E.J.; Kikkert, M.; Mark, B.L. Crystal structure of the Middle East respiratory syndrome coronavirus (MERS-CoV) papain-like protease bound to ubiquitin facilitates targeted disruption of deubiquitinating activity to demonstrate its role in innate immune suppression. J. Biol. Chem. 2014, 289, 34667–34682. [Google Scholar] [CrossRef]
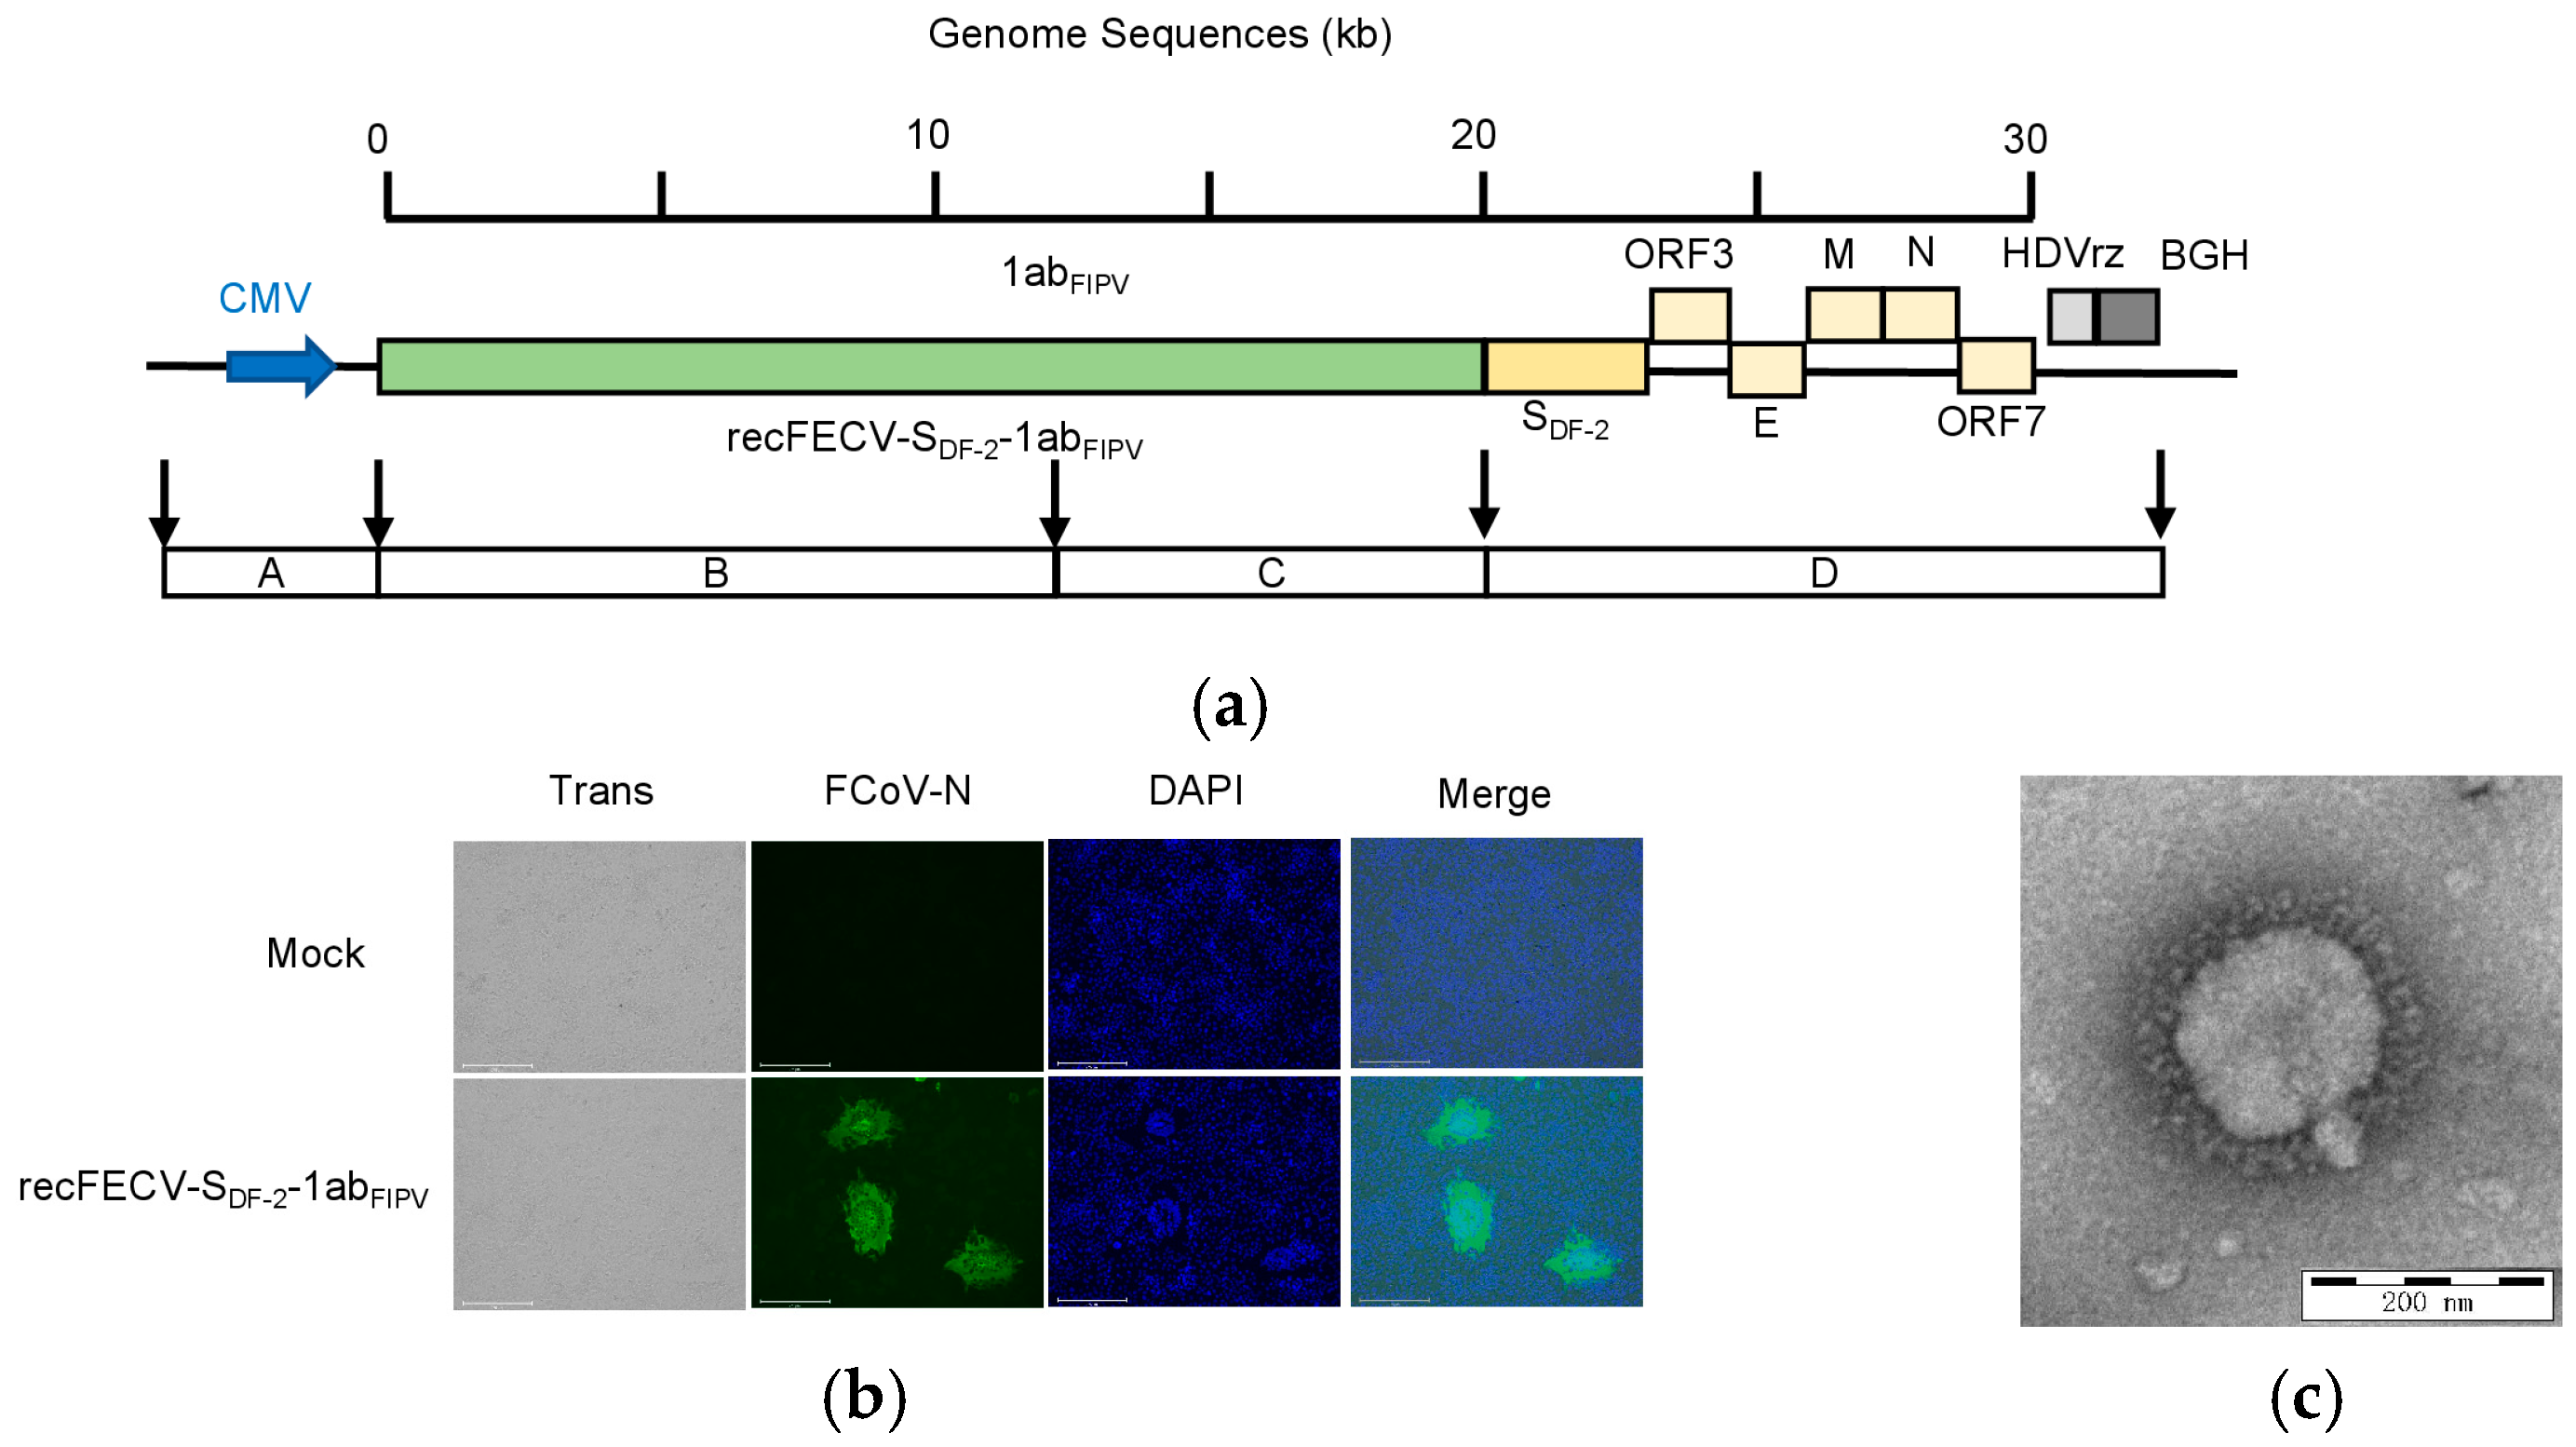
Figure 1. Construction and in vitro characterization of recFECV-SDF-2-1abFIPV. (a) Schematic diagram of recFECV-SDF-2-1abFIPV cDNA clone. The full-length FECV-SDF-2-1abFIPV genome was assembled from four fragments. The A fragment contains a CMV promoter. The D fragment contains not only the S protein from DF-2 and the following part of the FECV genome but also the HDV ribozyme and the BGH transcription signal sequence. (b) IFA confirmed the successful rescue of the virus recFECV-SDF-2-1abFIPV. (c) Electron microscopy images showed recFECV-SDF-2-1abFIPV particles purified from the supernatant of infected cells.
Viruses 17 01282 g001
Figure 2. Construction and in vitro characterization of recFECV-SDF-2-1abFIPV. (a) CRFK cells were infected with recFECV-SDF-2-1abFIPV and recFECV-SDF-2 at an MOI of 0.01. The expression of N protein was detected after 24 h post viral infection. (b) Growth curves of recFECV-SDF-2-1abFIPV and recFECV-SDF-2 in CRFK cells with an original MOI of 0.01. (c) Growth curves of recFECV-SDF-2-1abFIPV and recFECV-SDF-2 in BMDM cells with an original MOI of 0.01. The data shown represent the means ± SD, and all experiments were repeated three times. Asterisks indicate statistical significance as determined by two-way ANOVA; **** p < 0.0001.
Viruses 17 01282 g002
Figure 3. Changes in protein expression in CRFK cells infected with the recFECV-SDF-2-1abFIPV (a) and the recFECV-SDF-2 (b). X-axis indicates log2FC, and Y-axis indicates −log10 (FDR). Up- and downregulated genes were filtered based on statistical significance (FDR < 0.05, FC > 1.5 for upregulation or FC < 0.67 for downregulation). (c,d) KEGG enrichment of differentially expressed proteins in the cells infected with recFECV-SDF-2-1abFIPV (c) and recFECV-SDF-2 (d). The x-axis is the −log10 (FDR), and the y-axis is the name of each pathway entry. The size of the dot indicates the number of genes enriched, and the depth of the color indicates the size of the enrichment factor.
Viruses 17 01282 g003
Figure 4. The ORF1ab of FIPV exhibits enhanced activity of innate immune suppression. (a) Comparison of the protein expression in the cells infected with the recFECV-SDF-2-1abFIPV and the recFECV-SDF-2. X-axis indicates log2 FC, and Y-axis indicates −log10 (p-value). Up- and downregulated genes were filtered based on statistical significance (p < 0.05, FC > 1.5 for upregulation or FC < 0.67 for downregulation). (b) Comparison of the gene transcription in the Fcwf-4 cells infected with the recFECV-SDF-2-1abFIPV and the recFECV-SDF-2. X-axis indicates log2 FC, and Y-axis indicates −log10 (FDR). Up- and downregulated genes were filtered based on statistical significance (FDR < 0.05, FC > 2 for upregulation or FC < 0.5 for downregulation). (c) Top25 in GO enrichment for differentially expressed genes. The color from dark to light represents high to low q-values, and the x-axis of the bar graph represents the proportion of differentially expressed genes enriched in each term relative to the total number of associated genes, with the number next to each bar representing the number of differentially expressed genes in each term. (d) Enrichment of selected KEGG pathways for differentially expressed genes. The X-axis indicates −log10 (p-value), and the y-axis is the name of each pathway entry. The pathways involved in upregulated proteins are indicated in red, and those involved in downregulated proteins are indicated in blue.
Viruses 17 01282 g004
Figure 5. NSP1 and NSP3 are involved in the function of innate immune suppression. (a) RT PCR analysis of the transcription of the selected genes (RIG-I, MDA5, IFN-β, ISG15, and IFITM1) in recFECV-SDF-2-1abFIPV-infected, recFECV-SDF-2-infected, and uninfected Fcwf-4 cells. Fcwf-4 cells (5 × 10⁵/well) were infected with 0.1 MOI recFECV-SDF-2 or recFECV-SDF-2-1abFIPV. After 24 h, cells were collected and subjected to the analysis. The uninfected Fcwf-4 cells served as a negative control, while the GAPDH gene acted as an internal control. (b) CRFK cells (5 × 10⁵/well) were transfected with 400 ng/well of the IFN-β-Luc plasmid and 40 ng/well of the pRL-TK plasmid. At 24 h post-transfection, cells were stimulated by SeV or 0.01, 0.1, or 1 MOI of recFECV-SDF-2-1abFIPV. The relative luciferase activity was determined after 20 h. The uninfected CRFK cells served as the negative control, while the CRFK cells infected with SeV acted as the positive control. (c) CRFK cells were transfected with the IFN-β-Luc and pRL-TK plasmids, together with 500 ng/well of the empty vector or the plasmid expressing each NSP. At 24 h post-transfection, cells were stimulated by SeV. The positive and negative controls were established as described in b. (d) CRFK cells were transfected with the IFN-β-Luc and pRL-TK plasmids, together with 500 ng/well of the empty vector or the plasmids expressing the PL2pro of FECV or FIPV. The positive and negative controls were established as described in b. Differences between two experimental groups were analyzed using Student’s t-test. The data shown represent the means ± SD (n = 3), and all experiments were repeated three times. The significant differences are indicated as follows: * p < 0.05, ** p < 0.01, *** p < 0.001, and **** p < 0.0001.
Viruses 17 01282 g005
Figure 6. The enzymatic activity of PL2 protease is required for its role in innate immune suppression. (a). CRFK cells were co-transfected with 400 ng/well of IFN-β-Luc plasmid and 10 ng/well of pRL-TK plasmid, along with 400 ng/well of pCAGGs-3HA or increasing amounts of FIPV-PL2pro (100 ng/well, 200/well, 400 ng/well). At 24 h, the cells were infected with SeV for 20 h. The cells were collected and the luciferase activities were measured. Cells transfected with pCAGGs-3HA served as the negative control, while those transfected with the pCAGGs-3HA and subsequently infected with SeV were used as the positive control. (b,c). CRFK cells were co-transfected with 400 ng/well of pCAGGs-3Flag, pCAGGs-3Flag-RIG-I (b), or pCAGGs-3Flag-MDA5 (c) and 400 ng/well of the reporter plasmid of IFN-β promoter and 10 ng/well of pRL-TK, along with 400 ng/well of pCAGGs-3HA or FIPV-PL2pro. At 24 h, the cells were collected and the luciferase activities were measured. Cells transfected with pCAGGs-3HA and pCAGGs-3Flag served as the negative control, while those transfected with pCAGGs-3HA and pCAGGs-3Flag-RIG-I (b) or pCAGGs-3Flag-MDA5 (c) were used as the positive control. (d). CRFK cells were transfected with 400 ng/well pCAGGs-3HA and FIPV-PL2pro for 24 h and then infected with SeV for 20 h. The cells were collected and the mRNA levels of IFN-β were evaluated by RT-qPCR. The GAPDH gene served as an internal control. (e,f). CRFK cells were co-transfected with 400 ng/well of a reporter plasmid of the NF-κB promoter (e) or IRF3 promoter (f), 40 ng/well of pRL-TK, and 400 ng/well of pCAGGs-3HA or FIPV-PL2pro. At 24 h, the cells were infected with SeV. (g,h). CRFK cells were transfected with FIPV-PL2pro (400 ng) for 24 h and then infected with SeV for 20 h, and the mRNA levels of ISG15 (g) and IFITM1 (h) were evaluated by RT-qPCR. The GAPDH gene served as an internal control. (i). CRFK cells were co-transfected with 400 ng/well of the IFN-β reporter plasmid and 10 ng/well of pRL-TK, along with 400 ng/well of pCAGGs-3HA, FIPV-PL2pro, PL2pro C99A, PL2pro H252A, or PL2pro D265A for 24 h, and then infected with SeV for 20 h. (j). The expression of PL2pro or the mutants was detected using the cell lysate in (i). The β-actin protein was used as an internal control. Differences between two experimental groups were analyzed using Student’s t-test. The data shown represent the means ± SD (n = 3), and all experiments were repeated three times. The significant differences are indicated as follows: * p < 0.05, ** p < 0.01, *** p < 0.001, and **** p < 0.0001.
Viruses 17 01282 g006aViruses 17 01282 g006b
Disclaimer/Publisher’s Note: The statements, opinions and data contained in all publications are solely those of the individual author(s) and contributor(s) and not of MDPI and/or the editor(s). MDPI and/or the editor(s) disclaim responsibility for any injury to people or property resulting from any ideas, methods, instructions or products referred to in the content.