
Spatiotemporal Characterization of Changes in the Respiratory Tract and the Nervous System, Including the Eyes in SARS-CoV-2-Infected K18-hACE2 Mice

 , , , , , ,
Abstract

1. Introduction
2. Materials and Methods
2.1. Animals
2.2. Study Design
2.3. Histopathology
2.4. Immunohistochemistry
2.5. Evaluation of Results
2.6. Digital Analysis of Immunohistochemical Results
2.7. Real-Time RT-qPCR
2.8. Statistical Analysis
3. Results
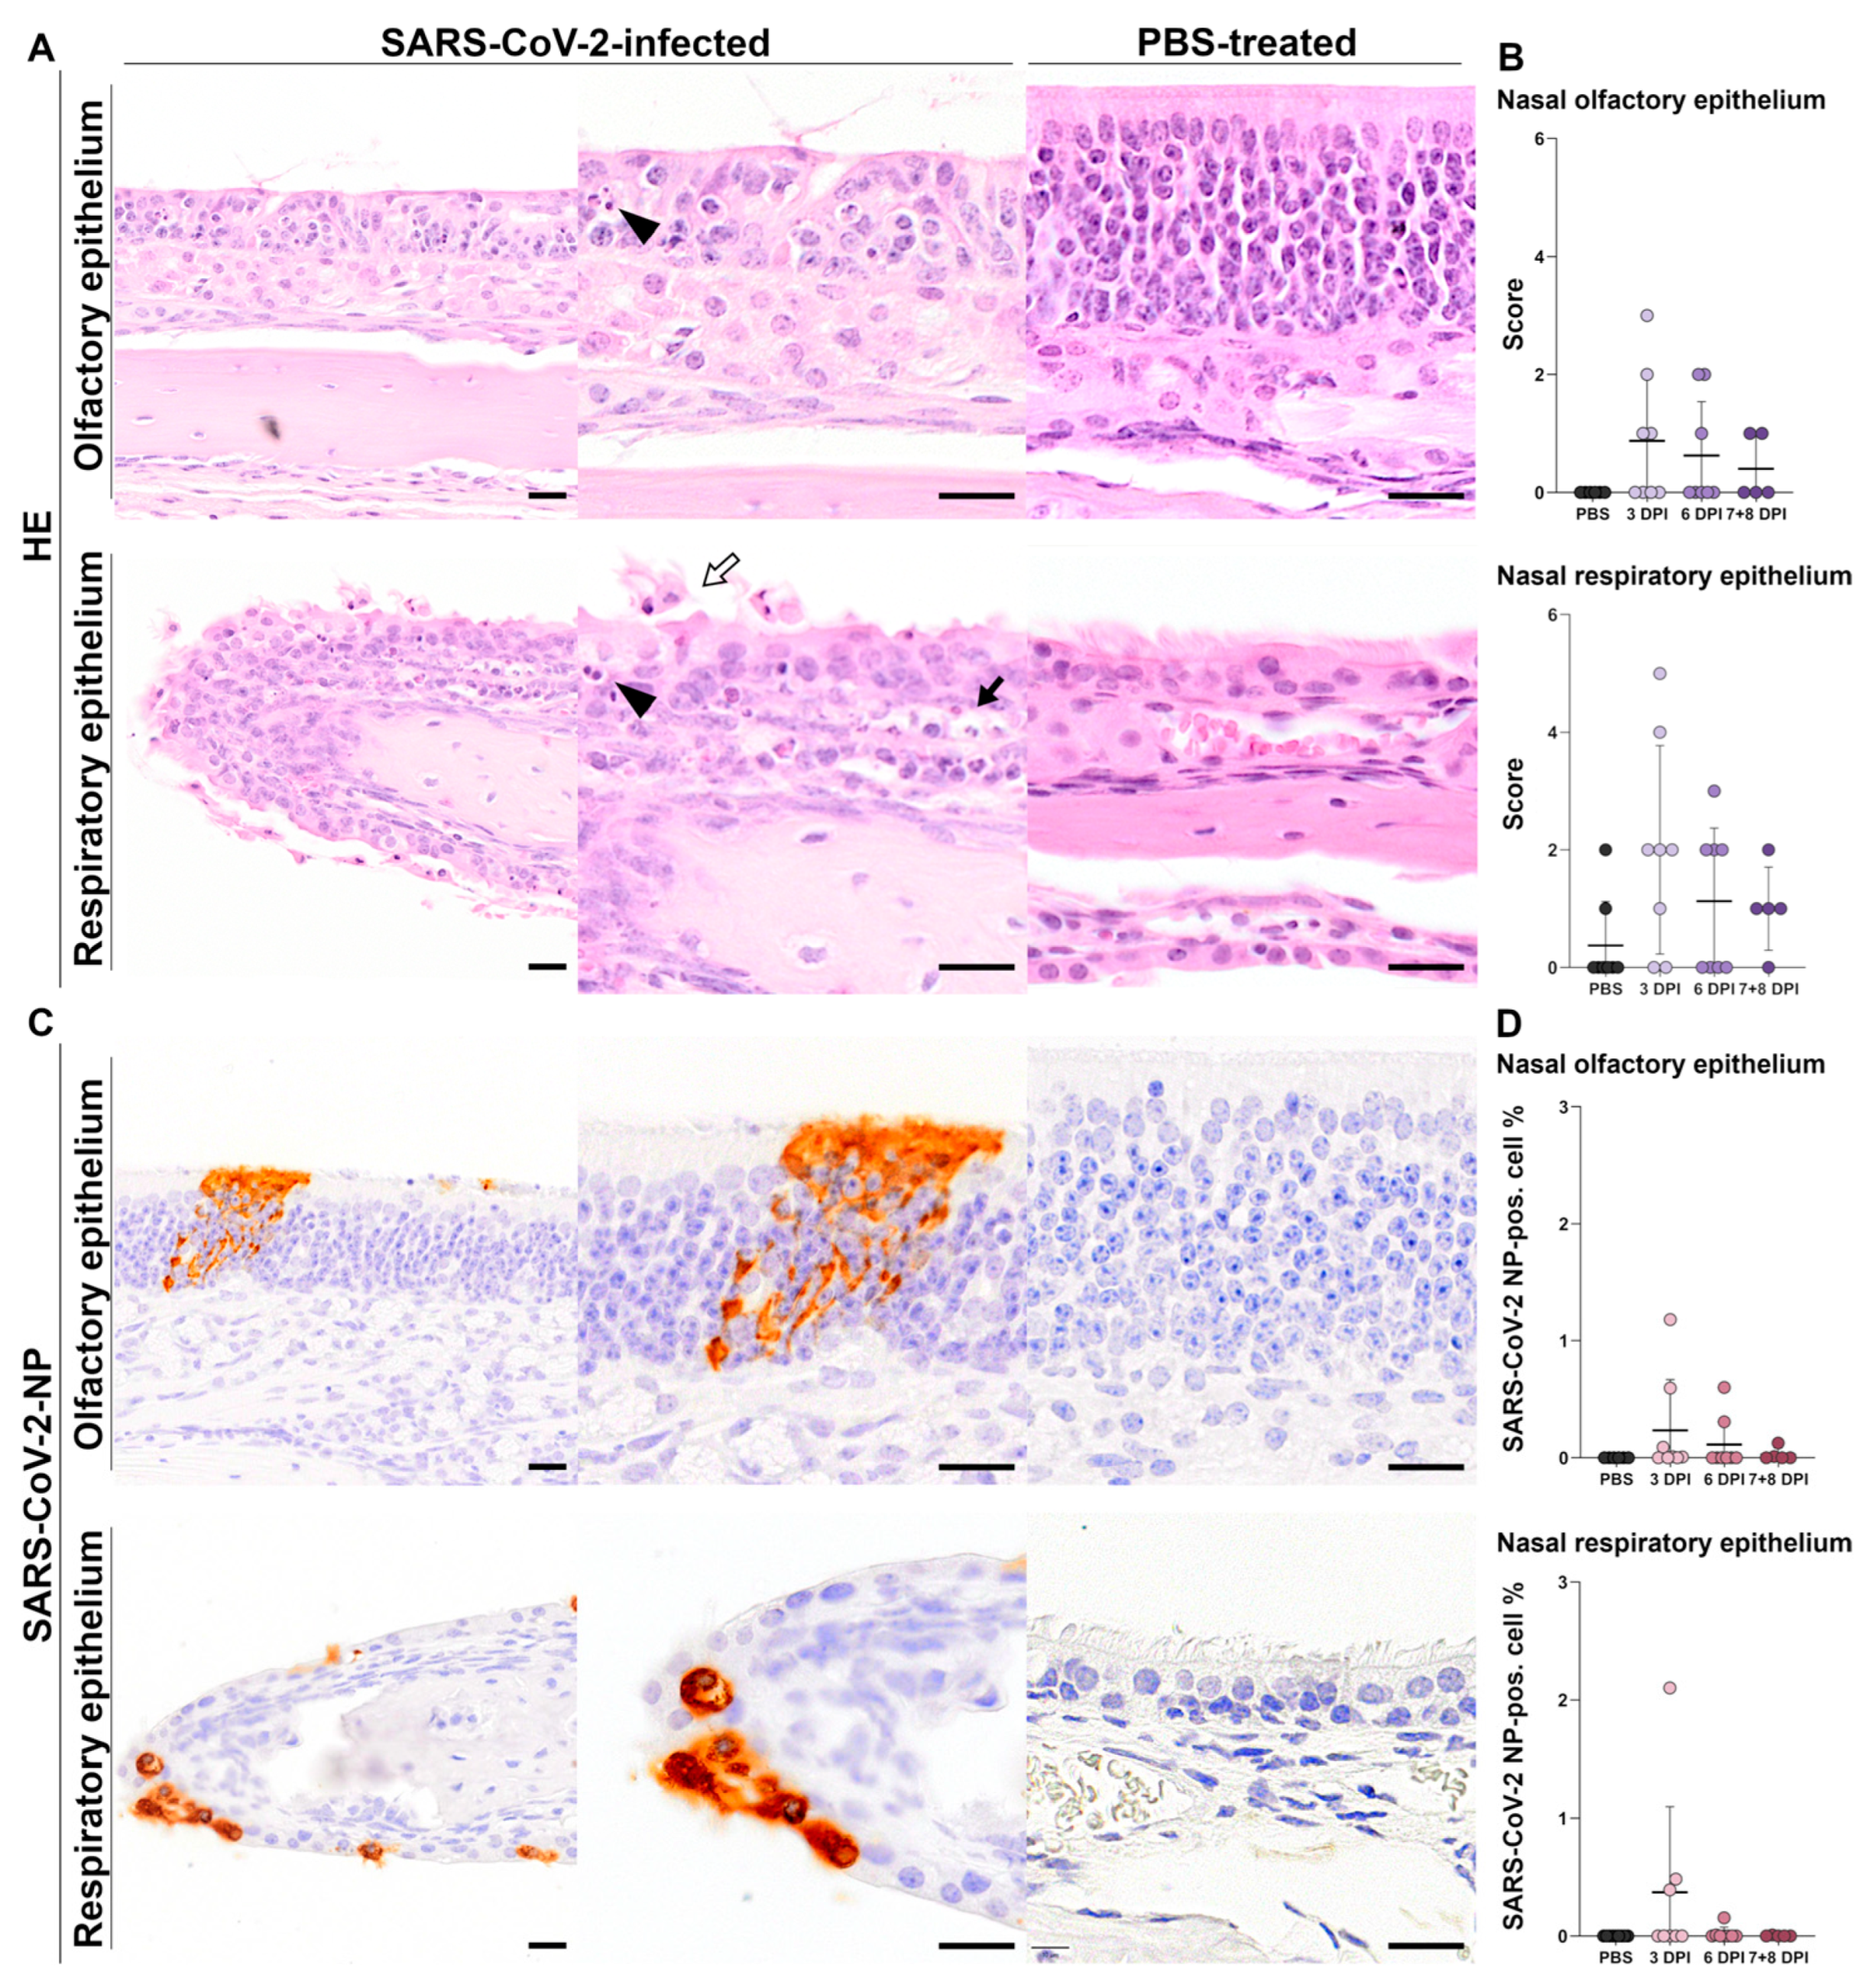
3.1. Nasal Tissue
3.1.1. Histology of Nasal Tissue
Histology of Olfactory Epithelium
Histology of Respiratory Epithelium
3.1.2. Immunohistochemistry of Nasal Tissue
SARS-CoV-2-NP Immunohistochemistry of Olfactory Epithelium
SARS-CoV-2-NP Immunohistochemistry of Respiratory Epithelium
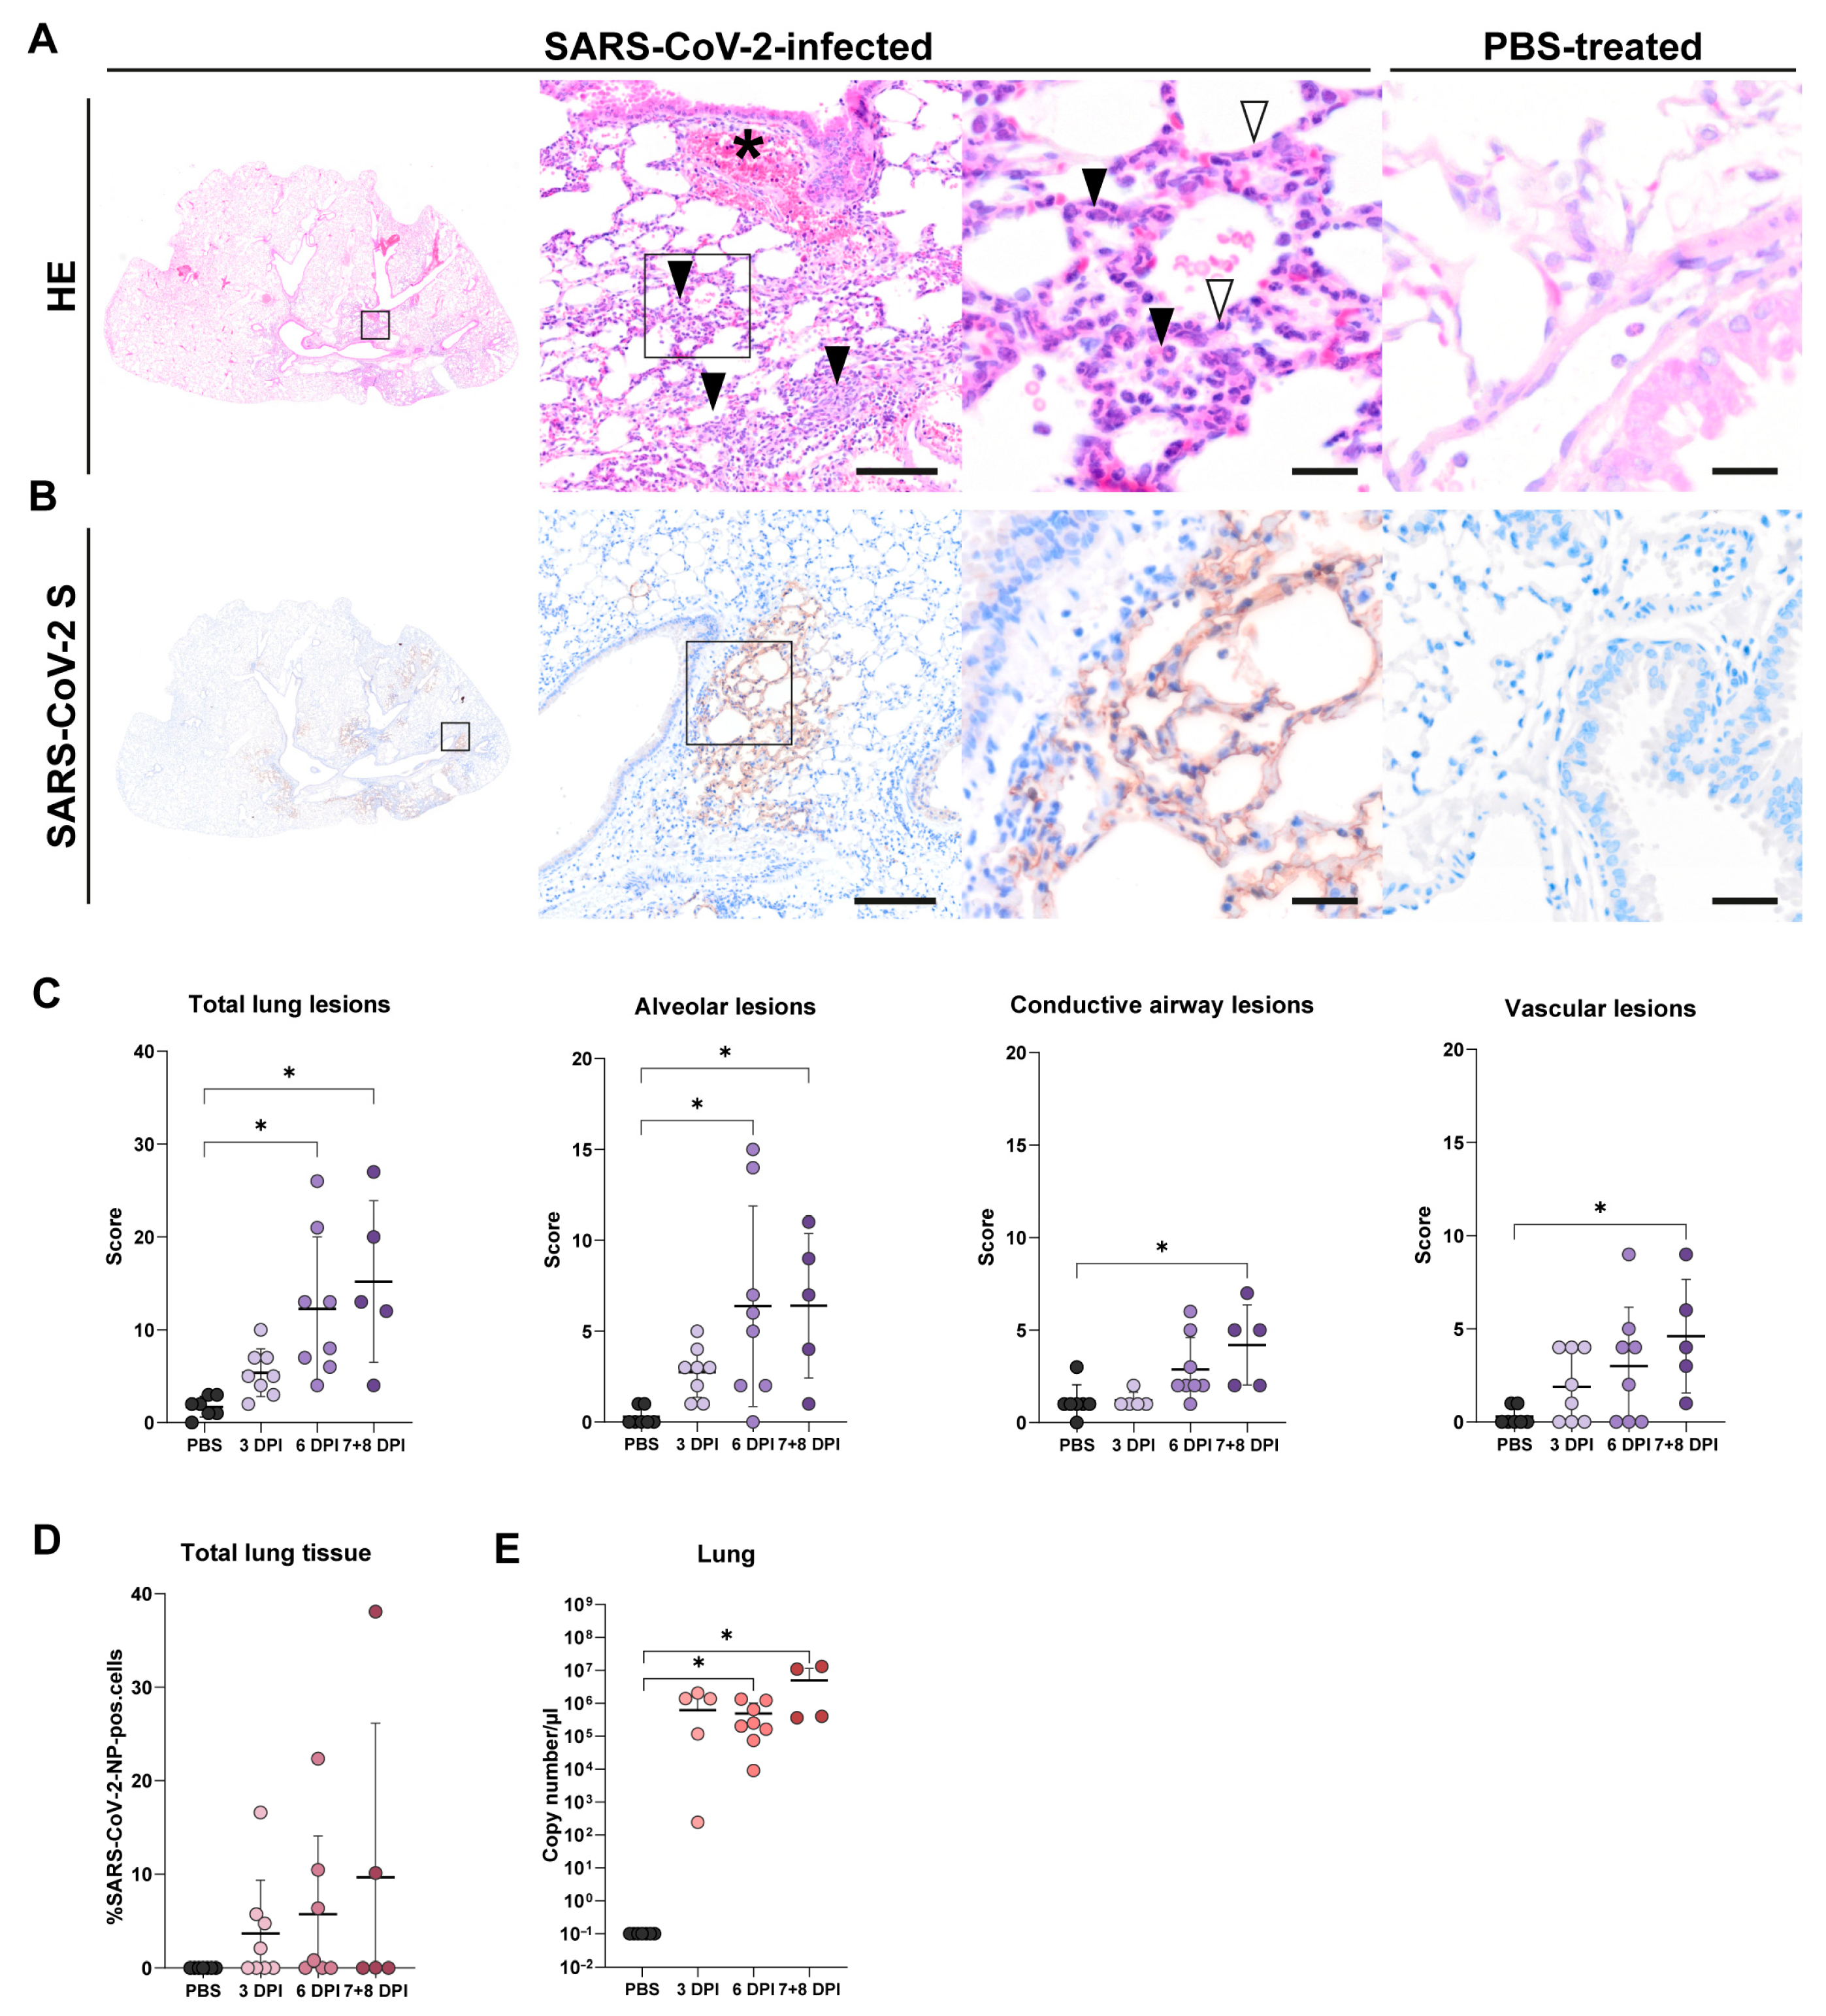
3.2. Lung Tissue
3.2.1. Histology of Lung Tissue
3.2.2. SARS-CoV-2-NP Immunohistochemistry of Lung Tissue
3.2.3. RT-qPCR of Lung Tissue
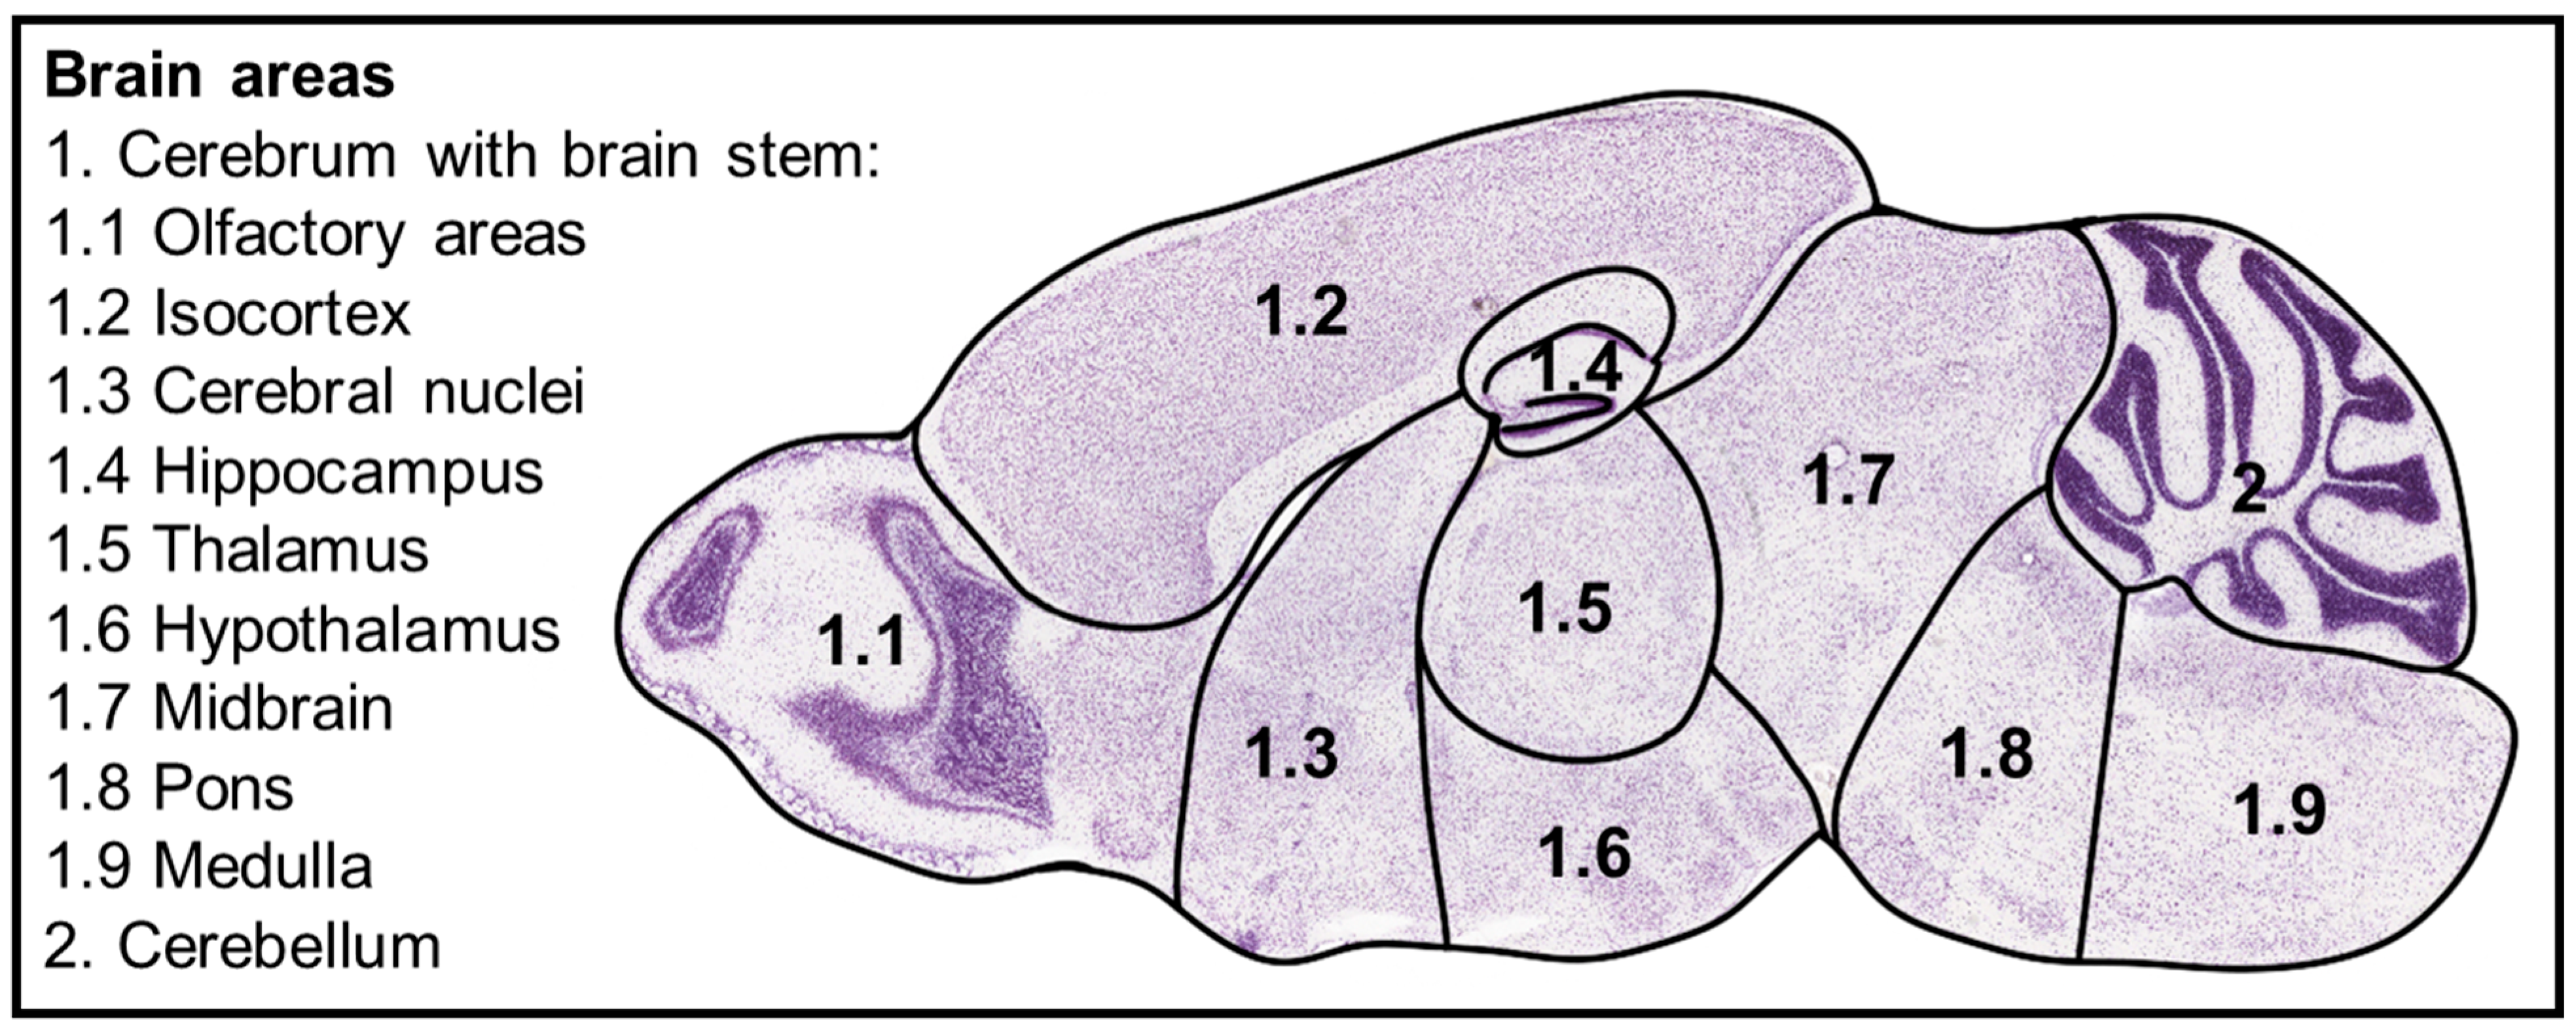
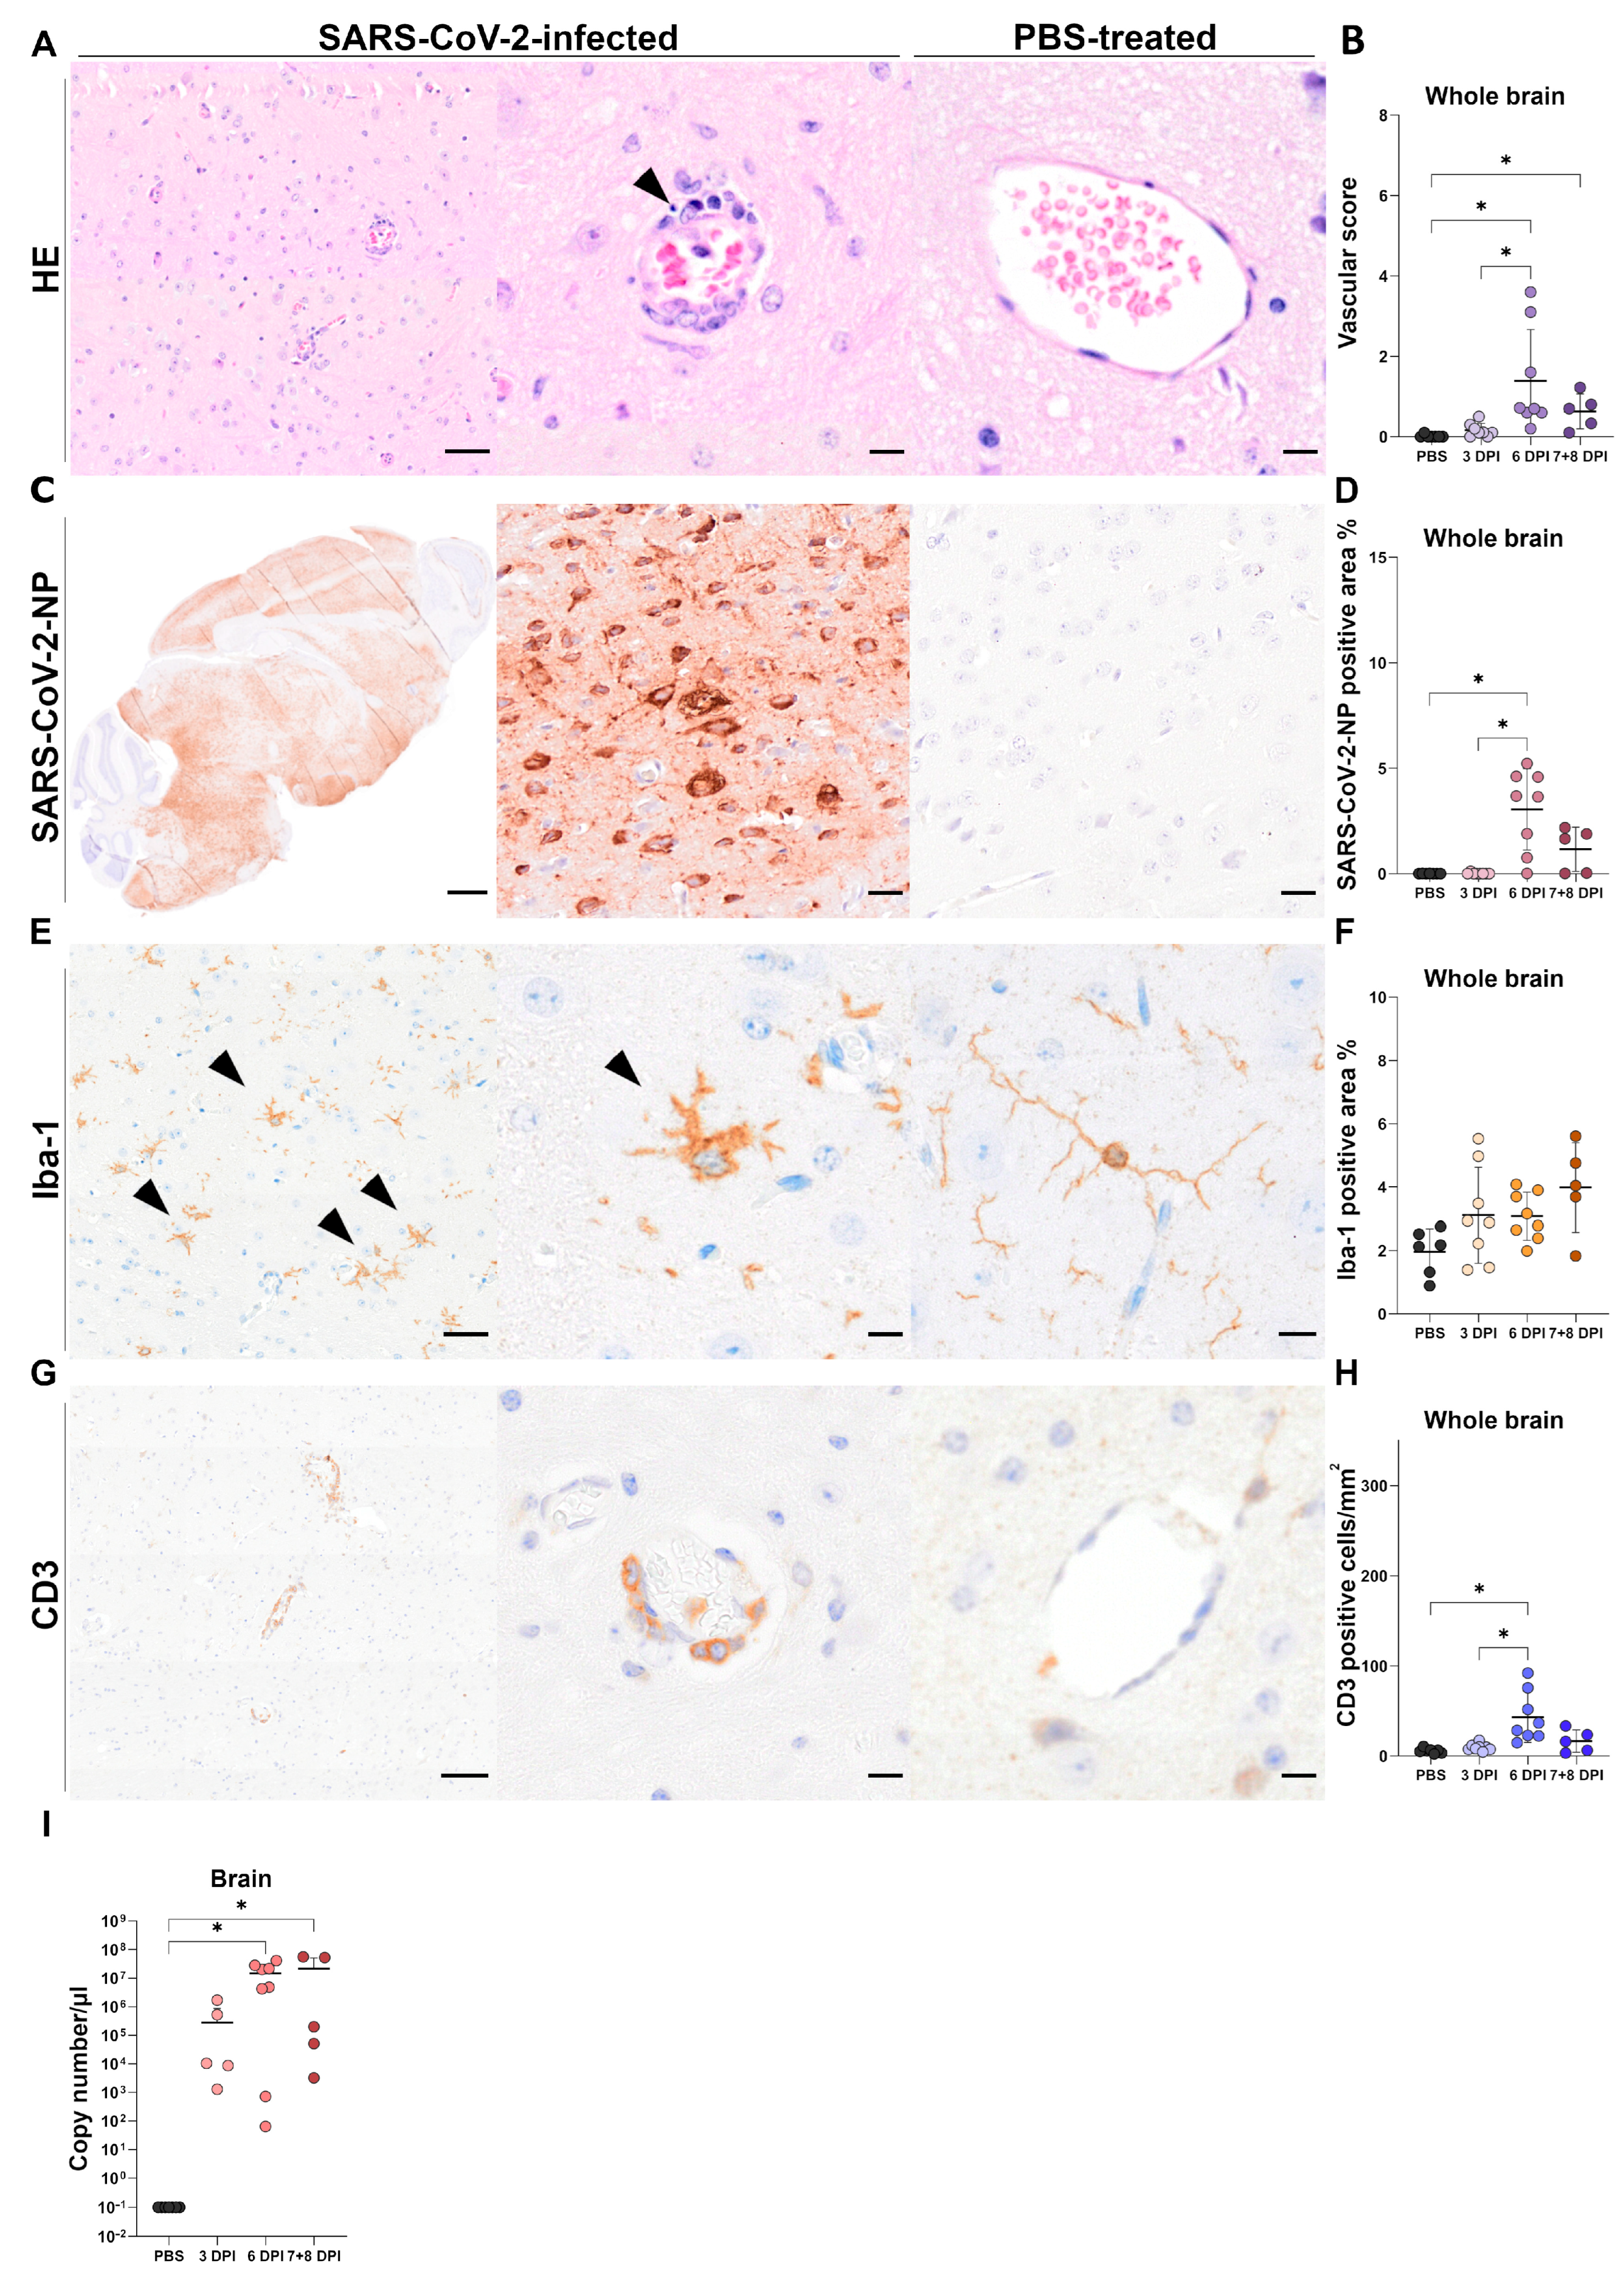
3.3. Brain Tissue
3.3.1. Histology of Brain Tissue
3.3.2. Immunohistochemistry of Brain Tissue
SARS-CoV-2-NP Immunohistochemistry
Iba-1 Immunohistochemistry
CD3 Immunohistochemistry
CD45R and Myeloperoxidase Immunohistochemistry
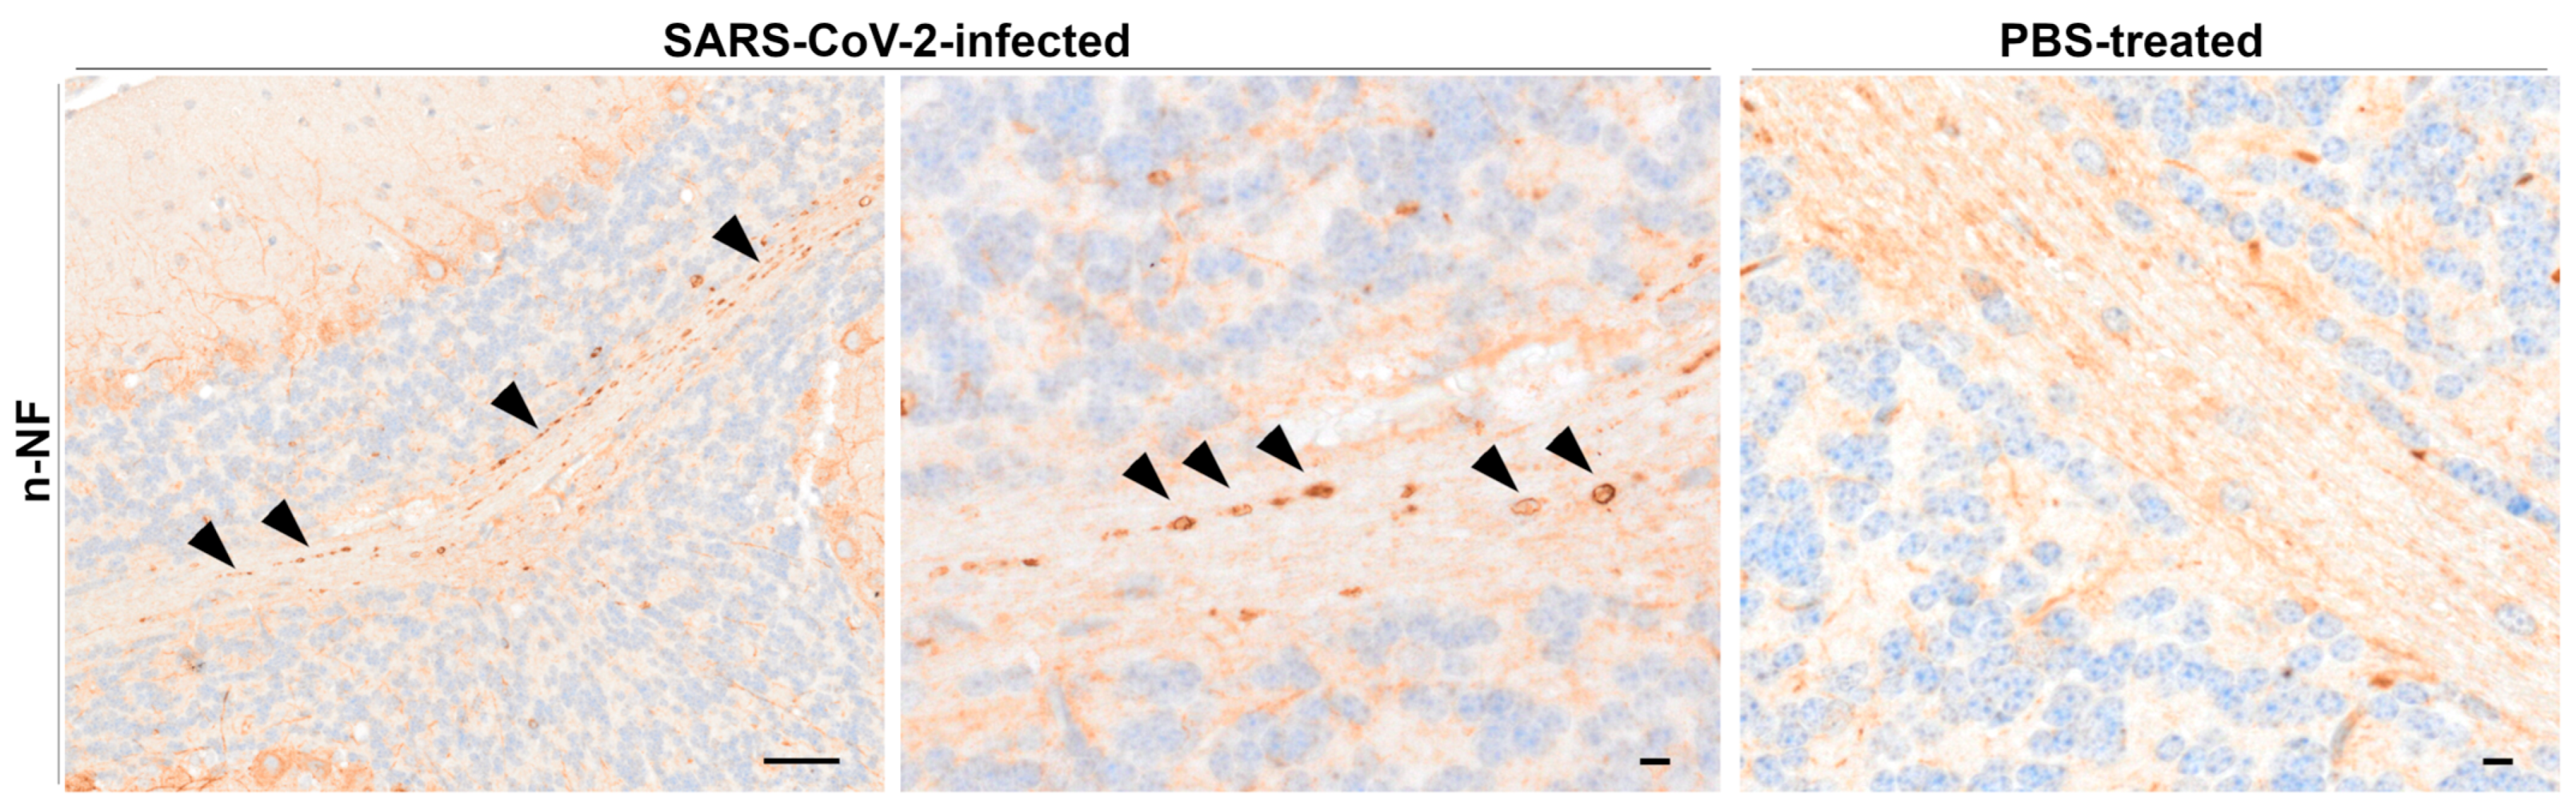
Beta-Amyloid Precursor Protein, Kinesin, and Neurofilament Immunohistochemistry
3.3.3. RT-qPCR of Brain Tissue
3.4. Globes and Optic Chiasms
3.4.1. Histology of Globes and Optic Chiasms
3.4.2. Immunohistochemistry of Globes
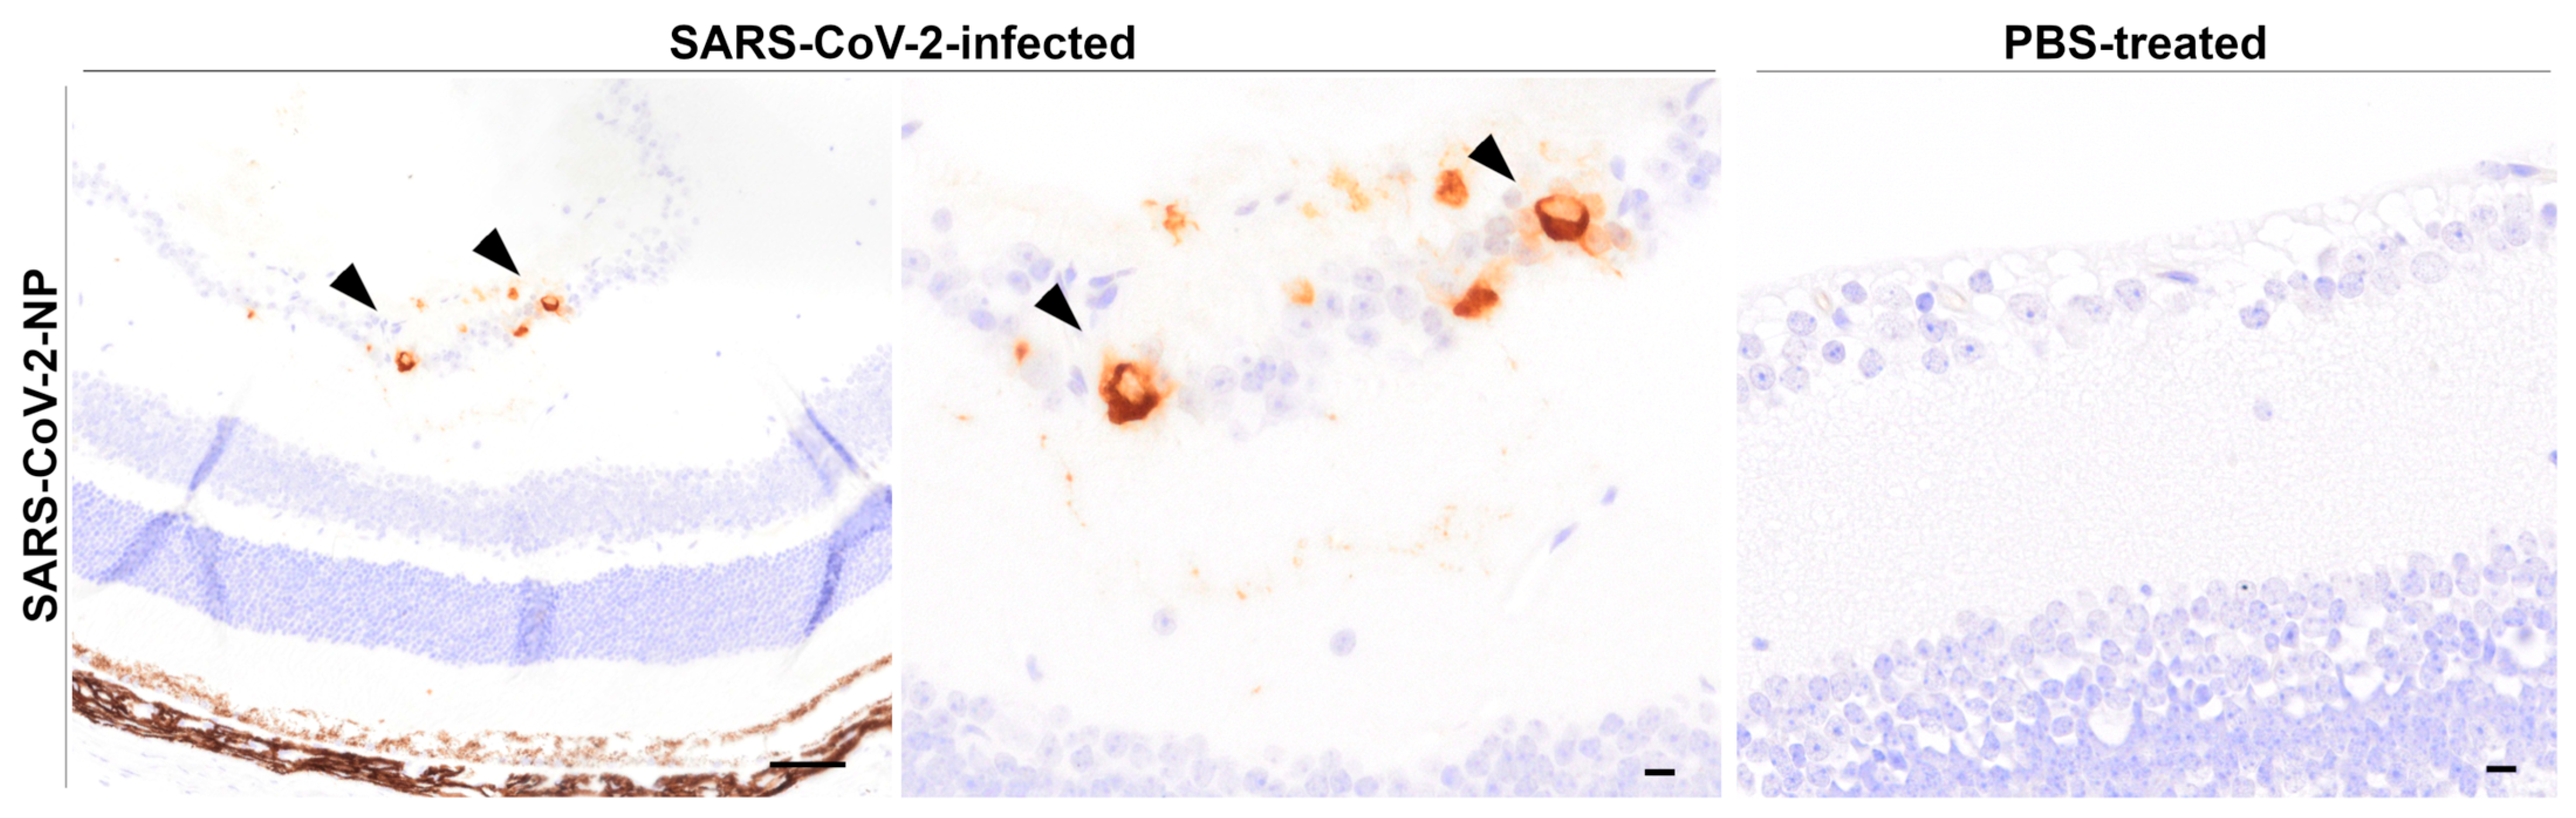
SARS-CoV-2-NP Immunohistochemistry
Iba-1, CD3, Glial Fibrillary Acidic Protein (GFAP) and Glutamine Synthetase (GS), β-Tubulin, Neurofilaments, and Caspase 3 Immunohistochemistry
4. Discussion
4.1. Olfactory Epithelium Shows Prolonged SARS-CoV-2 Infection Compared to Respiratory Epithelium in K18-hACE2 Mice
4.2. Aveolar-Restricted SARS-CoV-2 Pneumonia in K18-hACE2 Mice
4.3. Mononuclear Meningoencephalitis and Microgliosis Represent Common Features of SARS-CoV-2 Infection
4.4. Neurofilament Accumulation Points to Axonal Transport Dysfunction in the CNS
4.5. SARS-CoV-2 Invades Ocular Tissues via Neuronal Routes in K18-hACE2 Mice
5. Conclusions
Supplementary Materials
Author Contributions
Funding
Institutional Review Board Statement
Informed Consent Statement
Data Availability Statement
Acknowledgments
Conflicts of Interest
References
- Gupta, A.; Madhavan, M.V.; Sehgal, K.; Nair, N.; Mahajan, S.; Sehrawat, T.S.; Bikdeli, B.; Ahluwalia, N.; Ausiello, J.C.; Wan, E.Y.; et al. Extrapulmonary manifestations of COVID-19. Nat. Med. 2020, 26, 1017–1032. [Google Scholar] [CrossRef]
- Champion, S.N.; Williams, I.M.; Martinez Lage, M.; Stagner, A.M. Pathology of the brain and the eye in Severe Acute Respiratory Syndrome Coronavirus-2-infected patients: A review. J. Neuroopthalmol. 2021, 41, 285–292. [Google Scholar] [CrossRef]
- Nasiri, N.; Sharifi, H.; Bazrafshan, A.; Noori, A.; Karamouzian, M.; Sharifi, A. Ocular manifestations of COVID-19: A systematic review and meta-analysis. J. Ophthalmic Vis. Res. 2021, 16, 103–112. [Google Scholar] [CrossRef] [PubMed]
- Vashishtha, V.M.; Kumar, P. Preliminary clinical characteristics of pediatric COVID-19 cases during the ongoing Omicron XBB.1.16 driven surge in a north Indian city. medRxiv 2023, 2023.2004.2018.23288715. [Google Scholar] [CrossRef]
- Dai, J.; He, F.; Chen, Q.; Li, Q.; Zhao, L.; Du, Y. Animal models of post-acute COVID-19 syndrome: A call for longitudinal animal studies. Front. Immunol. 2025, 16, 1521029. [Google Scholar] [CrossRef]
- Kirk, N.M.; Liang, Y.; Ly, H. Pathogenesis and virulence of coronavirus disease: Comparative pathology of animal models for COVID-19. Virulence 2024, 15, 2316438. [Google Scholar] [CrossRef]
- Tiwari, S.; Goel, G.; Kumar, A. Natural and genetically-modified animal models to investigate pulmonary and extrapulmonary manifestations of COVID-19. Int. Rev. Immunol. 2024, 43, 13–32. [Google Scholar] [CrossRef]
- Vanderheiden, A.; Diamond, M.S. Animal models of non-respiratory, post-acute sequelae of COVID-19. Viruses 2025, 17, 98. [Google Scholar] [CrossRef]
- Zhang, Y.; Chen, H.; Li, Y.; Luo, C.; Zhu, Y.; Zhou, X.; Wang, R.; He, J.; Guo, H.; Xu, X.; et al. Animal models for long COVID: Current advances, limitations, and future directions. J. Med. Virol. 2025, 97, e70237. [Google Scholar] [CrossRef]
- McCray, P.B., Jr.; Pewe, L.; Wohlford-Lenane, C.; Hickey, M.; Manzel, L.; Shi, L.; Netland, J.; Jia, H.P.; Halabi, C.; Sigmund, C.D.; et al. Lethal infection of K18-hACE2 mice infected with severe acute respiratory syndrome coronavirus. J. Virol. 2007, 81, 813–821. [Google Scholar] [CrossRef]
- Dong, W.; Mead, H.; Tian, L.; Park, J.-G.; Garcia, J.I.; Jaramillo, S.; Barr, T.; Kollath, D.S.; Coyne, V.K.; Stone, N.E.; et al. The K18-human ACE2 transgenic mouse model recapitulates non-severe and severe COVID-19 in response to an infectious dose of the SARS-CoV-2 virus. J. Virol. 2022, 96, e00964-21. [Google Scholar] [CrossRef] [PubMed]
- Carossino, M.; Kenney, D.; O’Connell, A.K.; Montanaro, P.; Tseng, A.E.; Gertje, H.P.; Grosz, K.A.; Ericsson, M.; Huber, B.R.; Kurnick, S.A.; et al. Fatal neurodissemination and SARS-CoV-2 tropism in K18-hACE2 mice is only partially dependent on hACE2 expression. Viruses 2022, 14, 535. [Google Scholar] [CrossRef]
- Dedoni, S.; Avdoshina, V.; Camoglio, C.; Siddi, C.; Fratta, W.; Scherma, M.; Fadda, P. K18- and CAG-hACE2 transgenic mouse models and SARS-CoV-2: Implications for neurodegeneration research. Molecules 2022, 27, 4142. [Google Scholar] [CrossRef]
- Winkler, E.S.; Bailey, A.L.; Kafai, N.M.; Nair, S.; McCune, B.T.; Yu, J.; Fox, J.M.; Chen, R.E.; Earnest, J.T.; Keeler, S.P.; et al. SARS-CoV-2 infection of human ACE2-transgenic mice causes severe lung inflammation and impaired function. Nat. Immunol. 2020, 21, 1327–1335. [Google Scholar] [CrossRef]
- Zheng, J.; Wong, L.R.; Li, K.; Verma, A.K.; Ortiz, M.E.; Wohlford-Lenane, C.; Leidinger, M.R.; Knudson, C.M.; Meyerholz, D.K.; McCray, P.B., Jr.; et al. COVID-19 treatments and pathogenesis including anosmia in K18-hACE2 mice. Nature 2021, 589, 603–607. [Google Scholar] [CrossRef]
- Oladunni, F.S.; Park, J.G.; Pino, P.A.; Gonzalez, O.; Akhter, A.; Allué-Guardia, A.; Olmo-Fontánez, A.; Gautam, S.; Garcia-Vilanova, A.; Ye, C.; et al. Lethality of SARS-CoV-2 infection in K18 human angiotensin-converting enzyme 2 transgenic mice. Nat. Commun. 2020, 11, 6122. [Google Scholar] [CrossRef]
- Yinda, C.K.; Port, J.R.; Bushmaker, T.; Offei Owusu, I.; Purushotham, J.N.; Avanzato, V.A.; Fischer, R.J.; Schulz, J.E.; Holbrook, M.G.; Hebner, M.J.; et al. K18-hACE2 mice develop respiratory disease resembling severe COVID-19. PLoS Pathog. 2021, 17, e1009195. [Google Scholar] [CrossRef]
- Yu, P.; Deng, W.; Bao, L.; Qu, Y.; Xu, Y.; Zhao, W.; Han, Y.; Qin, C. Comparative pathology of the nasal epithelium in K18-hACE2 Tg mice, hACE2 Tg mice, and hamsters infected with SARS-CoV-2. Vet. Pathol. 2022, 59, 602–612. [Google Scholar] [CrossRef]
- Kumari, P.; Rothan, H.A.; Natekar, J.P.; Stone, S.; Pathak, H.; Strate, P.G.; Arora, K.; Brinton, M.A.; Kumar, M. Neuroinvasion and Encephalitis Following Intranasal Inoculation of SARS-CoV-2 in K18-hACE2 Mice. Viruses 2021, 13, 132. [Google Scholar] [CrossRef]
- Al-Sarraj, S.; Troakes, C.; Hanley, B.; Osborn, M.; Richardson, M.P.; Hotopf, M.; Bullmore, E.; Everall, I.P. Invited Review: The spectrum of neuropathology in COVID-19. Neuropathol. Appl. Neurobiol. 2021, 47, 3–16. [Google Scholar] [CrossRef]
- Bauer, L.; Laksono, B.M.; de Vrij, F.M.S.; Kushner, S.A.; Harschnitz, O.; van Riel, D. The neuroinvasiveness, neurotropism, and neurovirulence of SARS-CoV-2. Trends Neurosci. 2022, 45, 358–368. [Google Scholar] [CrossRef] [PubMed]
- Liu, J.M.; Tan, B.H.; Wu, S.; Gui, Y.; Suo, J.L.; Li, Y.C. Evidence of central nervous system infection and neuroinvasive routes, as well as neurological involvement, in the lethality of SARS-CoV-2 infection. J. Med. Virol. 2021, 93, 1304–1313. [Google Scholar] [CrossRef] [PubMed]
- Matschke, J.; Lütgehetmann, M.; Hagel, C.; Sperhake, J.P.; Schröder, A.S.; Edler, C.; Mushumba, H.; Fitzek, A.; Allweiss, L.; Dandri, M.; et al. Neuropathology of patients with COVID-19 in Germany: A post-mortem case series. Lancet Neurol. 2020, 19, 919–929. [Google Scholar] [CrossRef]
- Meinhardt, J.; Radke, J.; Dittmayer, C.; Franz, J.; Thomas, C.; Mothes, R.; Laue, M.; Schneider, J.; Brünink, S.; Greuel, S.; et al. Olfactory transmucosal SARS-CoV-2 invasion as a port of central nervous system entry in individuals with COVID-19. Nat. Neurosci. 2021, 24, 168–175. [Google Scholar] [CrossRef]
- Vidal, E.; Lopez-Figueroa, C.; Rodon, J.; Perez, M.; Brustolin, M.; Cantero, G.; Guallar, V.; Izquierdo-Useros, N.; Carrillo, J.; Blanco, J.; et al. Chronological brain lesions after SARS-CoV-2 infection in hACE2-transgenic mice. Vet. Pathol. 2021, 59, 613–626. [Google Scholar] [CrossRef] [PubMed]
- Seehusen, F.; Clark, J.J.; Sharma, P.; Bentley, E.G.; Kirby, A.; Subramaniam, K.; Wunderlin-Giuliani, S.; Hughes, G.L.; Patterson, E.I.; Michael, B.D.; et al. Neuroinvasion and Neurotropism by SARS-CoV-2 Variants in the K18-hACE2 Mouse. Viruses 2022, 14, 1020. [Google Scholar] [CrossRef]
- SeyedAlinaghi, S.; Mehraeen, E.; Afzalian, A.; Dashti, M.; Ghasemzadeh, A.; Pashaei, A.; Masoud Afsahi, A.; Saeed Tamehri Zadeh, S.; Amiri Fard, I.; Vafaee, A.; et al. Ocular manifestations of COVID-19: A systematic review of current evidence. Prev. Med. Rep. 2024, 38, 102608. [Google Scholar] [CrossRef]
- Aiello, F.; Gallo Afflitto, G.; Mancino, R.; Li, J.O.; Cesareo, M.; Giannini, C.; Nucci, C. Coronavirus disease 2019 (SARS-CoV-2) and colonization of ocular tissues and secretions: A systematic review. Eye 2020, 34, 1206–1211. [Google Scholar] [CrossRef]
- Brechbühl, J.; Ferreira, F.; Lopes, A.C.; Corset, E.; Gilliand, N.; Broillet, M.C. Ocular Symptoms Associated with COVID-19 Are Correlated with the Expression Profile of Mouse SARS-CoV-2 Binding Sites. Viruses 2023, 15, 354. [Google Scholar] [CrossRef]
- Collin, J.; Queen, R.; Zerti, D.; Dorgau, B.; Georgiou, M.; Djidrovski, I.; Hussain, R.; Coxhead, J.M.; Joseph, A.; Rooney, P.; et al. Co-expression of SARS-CoV-2 entry genes in the superficial adult human conjunctival, limbal and corneal epithelium suggests an additional route of entry via the ocular surface. Ocul. Surf. 2021, 19, 190–200. [Google Scholar] [CrossRef]
- Ma, D.; Chen, C.B.; Jhanji, V.; Xu, C.; Yuan, X.L.; Liang, J.J.; Huang, Y.; Cen, L.P.; Ng, T.K. Expression of SARS-CoV-2 receptor ACE2 and TMPRSS2 in human primary conjunctival and pterygium cell lines and in mouse cornea. Eye 2020, 34, 1212–1219. [Google Scholar] [CrossRef]
- Zhou, L.; Xu, Z.; Castiglione, G.M.; Soiberman, U.S.; Eberhart, C.G.; Duh, E.J. ACE2 and TMPRSS2 are expressed on the human ocular surface, suggesting susceptibility to SARS-CoV-2 infection. Ocul. Surf. 2020, 18, 537–544. [Google Scholar] [CrossRef] [PubMed]
- Belser, J.A.; Sun, X.; Kieran, T.J.; Brock, N.; Pulit-Penaloza, J.A.; Pappas, C.; Basu Thakur, P.; Jones, J.; Wentworth, D.E.; Zhou, B.; et al. Detection of airborne influenza A and SARS-CoV-2 virus shedding following ocular inoculation of ferrets. J. Virol. 2022, 96, e0140322. [Google Scholar] [CrossRef] [PubMed]
- Deng, W.; Bao, L.; Gao, H.; Xiang, Z.; Qu, Y.; Song, Z.; Gong, S.; Liu, J.; Liu, J.; Yu, P.; et al. Ocular conjunctival inoculation of SARS-CoV-2 can cause mild COVID-19 in rhesus macaques. Nat. Commun. 2020, 11, 4400. [Google Scholar] [CrossRef] [PubMed]
- Jeong, G.U.; Kwon, H.-J.; Ng, W.H.; Liu, X.; Moon, H.W.; Yoon, G.Y.; Shin, H.J.; Lee, I.-C.; Ling, Z.L.; Spiteri, A.G.; et al. Ocular tropism of SARS-CoV-2 in animal models with retinal inflammation via neuronal invasion following intranasal inoculation. Nat. Commun. 2022, 13, 7675. [Google Scholar] [CrossRef]
- Monu, M.; Ahmad, F.; Olson, R.M.; Balendiran, V.; Singh, P.K. SARS-CoV-2 infects cells lining the blood-retinal barrier and induces a hyperinflammatory immune response in the retina via systemic exposure. PLoS Pathog. 2024, 20, e1012156. [Google Scholar] [CrossRef]
- Sawant, O.B.; Singh, S.; Wright, R.E.; Jones, K.M.; Titus, M.S.; Dennis, E.; Hicks, E.; Majmudar, P.A.; Kumar, A.; Mian, S.I. Prevalence of SARS-CoV-2 in human post-mortem ocular tissues. Ocul. Surf. 2021, 19, 322–329. [Google Scholar] [CrossRef]
- Casagrande, M.; Fitzek, A.; Puschel, K.; Aleshcheva, G.; Schultheiss, H.P.; Berneking, L.; Spitzer, M.S.; Schultheiss, M. Detection of SARS-CoV-2 in Human Retinal Biopsies of Deceased COVID-19 Patients. Ocul. Immunol. Inflamm. 2020, 28, 721–725. [Google Scholar] [CrossRef]
- Araujo-Silva, C.A.; Marcos, A.A.A.; Marinho, P.M.; Branco, A.M.C.; Roque, A.; Romano, A.C.; Matuoka, M.L.; Farah, M.; Burnier, M.; Moraes, N.F.; et al. Presumed SARS-CoV-2 viral particles in the human retina of patients with COVID-19. JAMA Ophthalmol. 2021, 139, 1015–1021. [Google Scholar] [CrossRef]
- Sen, H.N.; Vannella, K.M.; Wang, Y.; Chung, J.Y.; Kodati, S.; Ramelli, S.C.; Lee, J.W.; Perez, P.; Stein, S.R.; Grazioli, A.; et al. Histopathology and SARS-CoV-2 cellular localization in eye tissues of COVID-19 autopsies. Am. J. Pathol. 2023, 193, 1809–1816. [Google Scholar] [CrossRef]
- Singh, S.; Garcia, G., Jr.; Shah, R.; Kramerov, A.A.; Wright, R.E., 3rd; Spektor, T.M.; Ljubimov, A.V.; Arumugaswami, V.; Kumar, A. SARS-CoV-2 and its beta variant of concern infect human conjunctival epithelial cells and induce differential antiviral innate immune response. Ocul. Surf. 2022, 23, 184–194. [Google Scholar] [CrossRef] [PubMed]
- Menuchin-Lasowski, Y.; Schreiber, A.; Lecanda, A.; Mecate-Zambrano, A.; Brunotte, L.; Psathaki, O.E.; Ludwig, S.; Rauen, T.; Scholer, H.R. SARS-CoV-2 infects and replicates in photoreceptor and retinal ganglion cells of human retinal organoids. Stem Cell Rep. 2022, 17, 789–803. [Google Scholar] [CrossRef]
- Teo, K.Y.; Invernizzi, A.; Staurenghi, G.; Cheung, C.M.G. COVID-19-related retinal micro-vasculopathy—A review of current evidence. Am. J. Ophthalmol. 2022, 235, 98–110. [Google Scholar] [CrossRef] [PubMed]
- Seah, I.; Agrawal, R. Can the Coronavirus Disease 2019 (COVID-19) Affect the Eyes? A review of coronaviruses and ocular implications in humans and animals. Ocul. Immunol. Inflamm. 2020, 28, 391–395. [Google Scholar] [CrossRef]
- Gregor, K.M.; Becker, S.C.; Hellhammer, F.; Schön, K.; Baumgärtner, W.; Puff, C. Histochemical staining techniques in Culex pipiens and Drosophila melanogaster (Diptera) with a comparison to mammals. Vet. Pathol. 2022, 59, 836–849. [Google Scholar] [CrossRef]
- Clever, S.; Limpinsel, L.; Meyer zu Natrup, C.; Schünemann, L.-M.; Beythien, G.; Rosiak, M.; Hülskötter, K.; Gregor, K.M.; Tuchel, T.; Kalodimou, G.; et al. Single MVA-SARS-2-ST/N vaccination rapidly protects K18-hACE2 mice against a lethal SARS-CoV-2 challenge infection. Viruses 2024, 16, 417. [Google Scholar] [CrossRef]
- Meyer Zu Natrup, C.; Tscherne, A.; Dahlke, C.; Ciurkiewicz, M.; Shin, D.L.; Fathi, A.; Rohde, C.; Kalodimou, G.; Halwe, S.; Limpinsel, L.; et al. Stabilized recombinant SARS-CoV-2 spike antigen enhances vaccine immunogenicity and protective capacity. J. Clin. Investig. 2022, 132, e159895. [Google Scholar] [CrossRef]
- Augusto-Oliveira, M.; Arrifano, G.P.; Delage, C.I.; Tremblay, M.E.; Crespo-Lopez, M.E.; Verkhratsky, A. Plasticity of microglia. Biol. Rev. Camb. Philos. Soc. 2022, 97, 217–250. [Google Scholar] [CrossRef]
- Allen Mouse Brain Atlas. Available online: https://mouse.brain-map.org/static/atlas (accessed on 22 April 2025).
- Bankhead, P.; Loughrey, M.B.; Fernández, J.A.; Dombrowski, Y.; McArt, D.G.; Dunne, P.D.; McQuaid, S.; Gray, R.T.; Murray, L.J.; Coleman, H.G.; et al. QuPath: Open source software for digital pathology image analysis. Sci. Rep. 2017, 7, 16878. [Google Scholar] [CrossRef]
- Maiese, A.; Manetti, A.C.; La Russa, R.; Di Paolo, M.; Turillazzi, E.; Frati, P.; Fineschi, V. Autopsy findings in COVID-19-related deaths: A literature review. Forensic Sci. Med. Pathol. 2021, 17, 279–296. [Google Scholar] [CrossRef]
- Chen, M.; Pekosz, A.; Villano, J.S.; Shen, W.; Zhou, R.; Kulaga, H.; Li, Z.; Smith, A.; Gurung, A.; Beck, S.E.; et al. Evolution of nasal and olfactory infection characteristics of SARS-CoV-2 variants. J. Clin. Investig. 2024, 134, e174439. [Google Scholar] [CrossRef] [PubMed]
- O’Neill, A.; Mantri, C.K.; Tan, C.W.; Saron, W.A.A.; Nagaraj, S.K.; Kala, M.P.; Joy, C.M.; Rathore, A.P.S.; Tripathi, S.; Wang, L.F.; et al. Mucosal SARS-CoV-2 vaccination of rodents elicits superior systemic T central memory function and cross-neutralising antibodies against variants of concern. eBioMedicine 2024, 99, 104924. [Google Scholar] [CrossRef]
- Bauer, L.; Rissmann, M.; Benavides, F.F.W.; Leijten, L.; van Run, P.; Begeman, L.; Veldhuis Kroeze, E.J.B.; Lendemeijer, B.; Smeenk, H.; de Vrij, F.M.S.; et al. In vitro and in vivo differences in neurovirulence between D614G, Delta And Omicron BA.1 SARS-CoV-2 variants. Acta Neuropathol. Commun. 2022, 10, 124. [Google Scholar] [CrossRef] [PubMed]
- Butowt, R.; von Bartheld, C.S. Anosmia in COVID-19: Underlying mechanisms and assessment of an olfactory route to brain infection. Neuroscientist 2021, 27, 582–603. [Google Scholar] [CrossRef]
- Butowt, R.; von Bartheld, C.S. The route of SARS-CoV-2 to brain infection: Have we been barking up the wrong tree? Mol. Neurodegener. 2022, 17, 20. [Google Scholar] [CrossRef]
- Ellul, M.A.; Benjamin, L.; Singh, B.; Lant, S.; Michael, B.D.; Easton, A.; Kneen, R.; Defres, S.; Sejvar, J.; Solomon, T. Neurological associations of COVID-19. Lancet Neurol. 2020, 19, 767–783. [Google Scholar] [CrossRef]
- Meinhardt, J.; Streit, S.; Dittmayer, C.; Manitius, R.V.; Radbruch, H.; Heppner, F.L. The neurobiology of SARS-CoV-2 infection. Nat. Rev. Neurosci. 2024, 25, 30–42. [Google Scholar] [CrossRef]
- Solomon, I.H.; Normandin, E.; Bhattacharyya, S.; Mukerji, S.S.; Keller, K.; Ali, A.S.; Adams, G.; Hornick, J.L.; Padera, R.F., Jr.; Sabeti, P. Neuropathological features of COVID-19. N. Engl. J. Med. 2020, 383, 989–992. [Google Scholar] [CrossRef]
- Ye, Q.; Zhou, J.; He, Q.; Li, R.T.; Yang, G.; Zhang, Y.; Wu, S.J.; Chen, Q.; Shi, J.H.; Zhang, R.R.; et al. SARS-CoV-2 infection in the mouse olfactory system. Cell Discov. 2021, 7, 49. [Google Scholar] [CrossRef]
- Choi, S.; Lee, J.; Kim, S.; Lee, Y.W.; Kim, G.C.; Hong, S.M.; An, S.H.; Noh, H.; Kim, K.E.; On, D.; et al. A longitudinal molecular and cellular lung atlas of lethal SARS-CoV-2 infection in K18-hACE2 transgenic mice. eBioMedicine 2024, 99, 104932. [Google Scholar] [CrossRef]
- Golden, J.W.; Cline, C.R.; Zeng, X.; Garrison, A.R.; Carey, B.D.; Mucker, E.M.; White, L.E.; Shamblin, J.D.; Brocato, R.L.; Liu, J.; et al. Human angiotensin-converting enzyme 2 transgenic mice infected with SARS-CoV-2 develop severe and fatal respiratory disease. JCI Insight 2020, 5, e142032. [Google Scholar] [CrossRef] [PubMed]
- Moreau, G.B.; Burgess, S.L.; Sturek, J.M.; Donlan, A.N.; Petri, W.A.; Mann, B.J. Evaluation of K18-hACE2 mice as a model of SARS-CoV-2 infection. Am. J. Trop. Med. Hyg. 2020, 103, 1215–1219. [Google Scholar] [CrossRef] [PubMed]
- Yen, H.L.; Valkenburg, S.; Sia, S.F.; Choy, K.T.; Peiris, J.S.M.; Wong, K.H.M.; Crossland, N.; Douam, F.; Nicholls, J.M. Cellular tropism of SARS-CoV-2 in the respiratory tract of Syrian hamsters and B6.Cg-Tg(K18-ACE2)2Prlmn/J transgenic mice. Vet. Pathol. 2022, 59, 639–647. [Google Scholar] [CrossRef] [PubMed]
- Bagato, O.; Balkema-Buschmann, A.; Todt, D.; Weber, S.; Gömer, A.; Qu, B.; Miskey, C.; Ivics, Z.; Mettenleiter, T.C.; Finke, S.; et al. Spatiotemporal analysis of SARS-CoV-2 infection reveals an expansive wave of monocyte-derived macrophages associated with vascular damage and virus clearance in hamster lungs. Microbiol. Spectr. 2024, 12, e02469-23. [Google Scholar] [CrossRef]
- Beythien, G.; de le Roi, M.; Stanelle-Bertram, S.; Armando, F.; Heydemann, L.; Rosiak, M.; Becker, S.; Lamers, M.M.; Kaiser, F.K.; Haagmans, B.L.; et al. Detection of double-stranded RNA intermediates during SARS-CoV-2 infections of Syrian Golden hamsters with monoclonal antibodies and its implications for histopathological evaluation of in vivo studies. Int. J. Mol. Sci. 2024, 25, 11425. [Google Scholar] [CrossRef]
- Giannakopoulos, S.; Park, J.; Pak, J.; Tallquist, M.D.; Verma, S. Post-COVID pulmonary injury in K18-hACE2 mice shows persistent neutrophils and neutrophil extracellular trap formation. Immun. Inflamm. Dis. 2024, 12, e1343. [Google Scholar] [CrossRef]
- Jeong, H.; Woo Lee, Y.; Park, I.H.; Noh, H.; Kim, S.H.; Kim, J.; Jeon, D.; Jang, H.J.; Oh, J.; On, D.; et al. Comparison of the pathogenesis of SARS-CoV-2 infection in K18-hACE2 mouse and Syrian golden hamster models. Dis. Model. Mech. 2022, 15, dmm049632. [Google Scholar] [CrossRef]
- Kim, S.H.; Kim, J.; Jang, J.Y.; Noh, H.; Park, J.; Jeong, H.; Jeon, D.; Uhm, C.; Oh, H.; Cho, K.; et al. Mouse models of lung-specific SARS-CoV-2 infection with moderate pathological traits. Front. Immunol. 2022, 13, 1055811. [Google Scholar] [CrossRef]
- Pons-Grifols, A.; Tarres-Freixas, F.; Perez, M.; Riveira-Munoz, E.; Raich-Regue, D.; Perez-Zsolt, D.; Munoz-Basagoiti, J.; Tondelli, B.; Pradenas, E.; Izquierdo-Useros, N.; et al. A human-ACE2 knock-in mouse model for SARS-CoV-2 infection recapitulates respiratory disorders but avoids neurological disease associated with the transgenic K18-hACE2 model. mBio 2025, 16, e0072025. [Google Scholar] [CrossRef]
- Trimpert, J.; Vladimirova, D.; Dietert, K.; Abdelgawad, A.; Kunec, D.; Dokel, S.; Voss, A.; Gruber, A.D.; Bertzbach, L.D.; Osterrieder, N. The Roborovski Dwarf hamster is a highly susceptible model for a rapid and fatal course of SARS-CoV-2 infection. Cell Rep. 2020, 33, 108488. [Google Scholar] [CrossRef]
- Armando, F.; Beythien, G.; Kaiser, F.K.; Allnoch, L.; Heydemann, L.; Rosiak, M.; Becker, S.; Gonzalez-Hernandez, M.; Lamers, M.M.; Haagmans, B.L.; et al. SARS-CoV-2 Omicron variant causes mild pathology in the upper and lower respiratory tract of hamsters. Nat. Commun. 2022, 13, 3519. [Google Scholar] [CrossRef] [PubMed]
- Pia, L. Spatial resolution of SARS-CoV-2 lung infection. Nat. Rev. Immunol. 2020, 20, 591. [Google Scholar] [CrossRef]
- Sia, S.F.; Yan, L.M.; Chin, A.W.H.; Fung, K.; Choy, K.T.; Wong, A.Y.L.; Kaewpreedee, P.; Perera, R.; Poon, L.L.M.; Nicholls, J.M.; et al. Pathogenesis and transmission of SARS-CoV-2 in golden hamsters. Nature 2020, 583, 834–838. [Google Scholar] [CrossRef] [PubMed]
- Cervia, C.; Nilsson, J.; Zurbuchen, Y.; Valaperti, A.; Schreiner, J.; Wolfensberger, A.; Raeber, M.E.; Adamo, S.; Weigang, S.; Emmenegger, M.; et al. Systemic and mucosal antibody responses specific to SARS-CoV-2 during mild versus severe COVID-19. J. Allergy Clin. Immunol. 2021, 147, 545–557.e549. [Google Scholar] [CrossRef] [PubMed]
- Fumagalli, V.; Rava, M.; Marotta, D.; Di Lucia, P.; Laura, C.; Sala, E.; Grillo, M.; Bono, E.; Giustini, L.; Perucchini, C.; et al. Administration of aerosolized SARS-CoV-2 to K18-hACE2 mice uncouples respiratory infection from fatal neuroinvasion. Sci. Immunol. 2022, 7, eabl9929. [Google Scholar] [CrossRef]
- Yao, X.H.; Luo, T.; Shi, Y.; He, Z.C.; Tang, R.; Zhang, P.P.; Cai, J.; Zhou, X.D.; Jiang, D.P.; Fei, X.C.; et al. A cohort autopsy study defines COVID-19 systemic pathogenesis. Cell Res. 2021, 31, 836–846. [Google Scholar] [CrossRef]
- Divani, A.A.; Andalib, S.; Biller, J.; Di Napoli, M.; Moghimi, N.; Rubinos, C.A.; Nobleza, C.O.; Sylaja, P.N.; Toledano, M.; Lattanzi, S.; et al. Central nervous system manifestations associated with COVID-19. Curr. Neurol. Neurosci. Rep. 2020, 20, 60. [Google Scholar] [CrossRef]
- Lou, J.J.; Movassaghi, M.; Gordy, D.; Olson, M.G.; Zhang, T.; Khurana, M.S.; Chen, Z.; Perez-Rosendahl, M.; Thammachantha, S.; Singer, E.J.; et al. Neuropathology of COVID-19 (neuro-COVID): Clinicopathological update. Free Neuropathol. 2021, 2, 2. [Google Scholar] [CrossRef]
- Lebrun, L.; Absil, L.; Remmelink, M.; De Mendonça, R.; D’Haene, N.; Gaspard, N.; Rusu, S.; Racu, M.L.; Collin, A.; Allard, J.; et al. SARS-Cov-2 infection and neuropathological findings: A report of 18 cases and review of the literature. Acta Neuropathol. Commun. 2023, 11, 78. [Google Scholar] [CrossRef]
- Puelles, V.G.; Lütgehetmann, M.; Lindenmeyer, M.T.; Sperhake, J.P.; Wong, M.N.; Allweiss, L.; Chilla, S.; Heinemann, A.; Wanner, N.; Liu, S.; et al. Multiorgan and renal tropism of SARS-CoV-2. N. Engl. J. Med. 2020, 383, 590–592. [Google Scholar] [CrossRef]
- Song, E.; Zhang, C.; Israelow, B.; Lu-Culligan, A.; Prado, A.V.; Skriabine, S.; Lu, P.; Weizman, O.E.; Liu, F.; Dai, Y.; et al. Neuroinvasion of SARS-CoV-2 in human and mouse brain. J. Exp. Med. 2021, 218, e20202135. [Google Scholar] [CrossRef] [PubMed]
- Kantonen, J.; Mahzabin, S.; Mäyränpää, M.I.; Tynninen, O.; Paetau, A.; Andersson, N.; Sajantila, A.; Vapalahti, O.; Carpén, O.; Kekäläinen, E.; et al. Neuropathologic features of four autopsied COVID-19 patients. Brain Pathol. 2020, 30, 1012–1016. [Google Scholar] [CrossRef]
- Chen, Z.; Zhong, D.; Li, G. The role of microglia in viral encephalitis: A review. J. Neuroinflamm. 2019, 16, 76. [Google Scholar] [CrossRef]
- Fekete, R.; Cserép, C.; Lénárt, N.; Tóth, K.; Orsolits, B.; Martinecz, B.; Méhes, E.; Szabó, B.; Németh, V.; Gönci, B.; et al. Microglia control the spread of neurotropic virus infection via P2Y12 signalling and recruit monocytes through P2Y12-independent mechanisms. Acta Neuropathol. 2018, 136, 461–482. [Google Scholar] [CrossRef] [PubMed]
- Murta, V.; Villarreal, A.; Ramos, A.J. Severe acute respiratory syndrome coronavirus 2 impact on the central nervous system: Are astrocytes and microglia main players or merely bystanders? ASN Neuro 2020, 12, 1759091420954960. [Google Scholar] [CrossRef]
- Dwivedi, V.; Shivanna, V.; Gautam, S.; Delgado, J.; Hicks, A.; Argonza, M.; Meredith, R.; Turner, J.; Martinez-Sobrido, L.; Torrelles, J.B.; et al. Age associated susceptibility to SARS-CoV-2 infection in the K18-hACE2 transgenic mouse model. GeroScience 2024, 46, 2901–2913. [Google Scholar] [CrossRef]
- Aw, Z.Q.; Mok, C.K.; Wong, Y.H.; Chen, H.; Mak, T.M.; Lin, R.T.P.; Lye, D.C.; Tan, K.S.; Chu, J.J.H. Early pathogenesis profiles across SARS-CoV-2 variants in K18-hACE2 mice revealed differential triggers of lung damages. Front. Immunol. 2022, 13, 950666. [Google Scholar] [CrossRef]
- Jeong, G.U.; Lyu, J.; Kim, K.D.; Chung, Y.C.; Yoon, G.Y.; Lee, S.; Hwang, I.; Shin, W.H.; Ko, J.; Lee, J.Y.; et al. SARS-CoV-2 infection of microglia elicits proinflammatory activation and apoptotic cell death. Microbiol. Spectr. 2022, 10, e0109122. [Google Scholar] [CrossRef]
- Oxley, T.J.; Mocco, J.; Majidi, S.; Kellner, C.P.; Shoirah, H.; Singh, I.P.; De Leacy, R.A.; Shigematsu, T.; Ladner, T.R.; Yaeger, K.A.; et al. Large-vessel stroke as a presenting feature of COVID-19 in the young. N. Engl. J. Med. 2020, 382, e60. [Google Scholar] [CrossRef]
- Perry, V.H.; Cunningham, C.; Holmes, C. Systemic infections and inflammation affect chronic neurodegeneration. Nat. Rev. Immunol. 2007, 7, 161–167. [Google Scholar] [CrossRef]
- Perry, V.H.; Teeling, J. Microglia and macrophages of the central nervous system: The contribution of microglia priming and systemic inflammation to chronic neurodegeneration. Semin. Immunopathol. 2013, 35, 601–612. [Google Scholar] [CrossRef] [PubMed]
- Tremblay, M.E.; Madore, C.; Bordeleau, M.; Tian, L.; Verkhratsky, A. Neuropathobiology of COVID-19: The role for glia. Front. Cell Neurosci. 2020, 14, 592214. [Google Scholar] [CrossRef]
- Woodburn, S.C.; Bollinger, J.L.; Wohleb, E.S. The semantics of microglia activation: Neuroinflammation, homeostasis, and stress. J. Neuroinflamm. 2021, 18, 258. [Google Scholar] [CrossRef]
- Perrot, R.; Berges, R.; Bocquet, A.; Eyer, J. Review of the multiple aspects of neurofilament functions, and their possible contribution to neurodegeneration. Mol. Neurobiol. 2008, 38, 27–65. [Google Scholar] [CrossRef]
- Schlaepfer, W.W. Calcium-induced degeneration of axoplasm in isolated segments of rat peripheral nerve. Brain Res. 1974, 69, 203–215. [Google Scholar] [CrossRef]
- Sternberger, L.A.; Sternberger, N.H. Monoclonal antibodies distinguish phosphorylated and nonphosphorylated forms of neurofilaments in situ. Proc. Natl. Acad. Sci. USA 1983, 80, 6126–6130. [Google Scholar] [CrossRef]
- Ulfig, N.; Nickel, J.; Bohl, J. Monoclonal antibodies SMI 311 and SMI 312 as tools to investigate the maturation of nerve cells and axonal patterns in human fetal brain. Cell Tissue Res. 1998, 291, 433–443. [Google Scholar] [CrossRef]
- Grant, P.; Pant, H.C. Neurofilament protein synthesis and phosphorylation. J. Neurocytol. 2000, 29, 843–872. [Google Scholar] [CrossRef]
- Sihag, R.K.; Inagaki, M.; Yamaguchi, T.; Shea, T.B.; Pant, H.C. Role of phosphorylation on the structural dynamics and function of types III and IV intermediate filaments. Exp. Cell Res. 2007, 313, 2098–2109. [Google Scholar] [CrossRef]
- Trapp, B.D.; Peterson, J.; Ransohoff, R.M.; Rudick, R.; Mörk, S.; Bö, L. Axonal transection in the lesions of multiple sclerosis. N. Engl. J. Med. 1998, 338, 278–285. [Google Scholar] [CrossRef]
- Yuan, A.; Rao, M.V.; Veeranna; Nixon, R.A. Neurofilaments and neurofilament proteins in health and disease. Cold Spring Harb. Perspect. Biol. 2017, 9, a018309. [Google Scholar] [CrossRef]
- Muresan, V.; Ladescu Muresan, Z. Amyloid-β precursor protein: Multiple fragments, numerous transport routes and mechanisms. Exp. Cell Res. 2015, 334, 45–53. [Google Scholar] [CrossRef] [PubMed]
- Sharma, P.; Giri, A.; Tripathi, P.N. Emerging Trends: Neurofilament Biomarkers in Precision Neurology. Neurochem. Res. 2024, 49, 3208–3225. [Google Scholar] [CrossRef] [PubMed]
- Diez-Cirarda, M.; Yus-Fuertes, M.; Sanchez-Sanchez, R.; Gonzalez-Rosa, J.J.; Gonzalez-Escamilla, G.; Gil-Martinez, L.; Delgado-Alonso, C.; Gil-Moreno, M.J.; Valles-Salgado, M.; Cano-Cano, F.; et al. Hippocampal subfield abnormalities and biomarkers of pathologic brain changes: From SARS-CoV-2 acute infection to post-COVID syndrome. eBioMedicine 2023, 94, 104711. [Google Scholar] [CrossRef]
- Duindam, H.B.; Mengel, D.; Kox, M.; Göpfert, J.C.; Kessels, R.P.C.; Synofzik, M.; Pickkers, P.; Abdo, W.F. Systemic inflammation relates to neuroaxonal damage associated with long-term cognitive dysfunction in COVID-19 patients. Brain Behav. Immun. 2024, 117, 510–520. [Google Scholar] [CrossRef]
- Gutman, E.G.; Salvio, A.L.; Fernandes, R.A.; Duarte, L.A.; Raposo-Vedovi, J.V.; Alcaraz, H.F.; Teixeira, M.A.; Passos, G.F.; de Medeiros, K.Q.M.; Hammerle, M.B.; et al. Long COVID: Plasma levels of neurofilament light chain in mild COVID-19 patients with neurocognitive symptoms. Mol. Psychiatry 2024, 29, 3106–3116. [Google Scholar] [CrossRef]
- Zingaropoli, M.A.; Pasculli, P.; Barbato, C.; Petrella, C.; Fiore, M.; Dominelli, F.; Latronico, T.; Ciccone, F.; Antonacci, M.; Liuzzi, G.M.; et al. Biomarkers of neurological damage: From acute stage to post-acute sequelae of COVID-19. Cells 2023, 12, 2270. [Google Scholar] [CrossRef]
- DiLeonardi, A.M.; Huh, J.W.; Raghupathi, R. Impaired axonal transport and neurofilament compaction occur in separate populations of injured axons following diffuse brain injury in the immature rat. Brain Res. 2009, 1263, 174–182. [Google Scholar] [CrossRef]
- Gudi, V.; Gai, L.; Herder, V.; Tejedor, L.S.; Kipp, M.; Amor, S.; Sühs, K.W.; Hansmann, F.; Beineke, A.; Baumgärtner, W.; et al. Synaptophysin is a reliable marker for axonal damage. J. Neuropathol. Exp. Neurol. 2017, 76, 109–125. [Google Scholar] [CrossRef]
- Koo, E.H.; Sisodia, S.S.; Archer, D.R.; Martin, L.J.; Weidemann, A.; Beyreuther, K.; Fischer, P.; Masters, C.L.; Price, D.L. Precursor of amyloid protein in Alzheimer disease undergoes fast anterograde axonal transport. Proc. Natl. Acad. Sci. USA 1990, 87, 1561–1565. [Google Scholar] [CrossRef]
- Reichard, R.R.; Kashani, K.B.; Boire, N.A.; Constantopoulos, E.; Guo, Y.; Lucchinetti, C.F. Neuropathology of COVID-19: A spectrum of vascular and acute disseminated encephalomyelitis (ADEM)-like pathology. Acta Neuropathol. 2020, 140, 1–6. [Google Scholar] [CrossRef]
- Bosello, F.; Marastoni, D.; Pizzini, F.B.; Zaffalon, C.; Zuliani, A.; Turri, G.; Mariotto, S.; Bonacci, E.; Pedrotti, E.; Calabrese, M. Atypical myelin oligodendrocyte glycoprotein antibody-associated optic neuritis and acute demyelinating polyneuropathy after SARS-CoV-2 infection: Case report and literature review. J. Neuroimmunol. 2023, 375, 578011. [Google Scholar] [CrossRef] [PubMed]
- Shi, J.; Danesh-Meyer, H.V. A review of neuro-ophthalmic sequelae following COVID-19 infection and vaccination. Front. Cell Infect. Microbiol. 2024, 14, 1345683. [Google Scholar] [CrossRef]
- Vélez Cevallos, M.A.; Vásquez, A.M. Alterations in the optic nerve and retina in patients with COVID-19. A theoretical review. Arch. Soc. Esp. Oftalmol. (Engl. Ed.) 2023, 98, 454–469. [Google Scholar] [CrossRef] [PubMed]
- Abdul-Salam State, S.E.; Sfredel, V.; Mocanu, C.L.; Albu, C.V.; Bălășoiu, A.T. Optic neuropathies post-COVID 19—Review. Rom. J. Ophthalmol. 2022, 66, 289–298. [Google Scholar] [CrossRef]
- Land, P.; Shah, V.; Lovell, D.J.; Miraldi Utz, V. Panuveitis and optic neuropathy following SARS-COV-2 in the absence of multisystem inflammatory syndrome in a child. Am. J. Ophthalmol. Case Rep. 2023, 32, 101876. [Google Scholar] [CrossRef]
- Bullen, C.K.; Hogberg, H.T.; Bahadirli-Talbott, A.; Bishai, W.R.; Hartung, T.; Keuthan, C.; Looney, M.M.; Pekosz, A.; Romero, J.C.; Sillé, F.C.M.; et al. Infectability of human BrainSphere neurons suggests neurotropism of SARS-CoV-2. Altex 2020, 37, 665–671. [Google Scholar] [CrossRef]
- Plante, J.A.; Mitchell, B.M.; Plante, K.S.; Debbink, K.; Weaver, S.C.; Menachery, V.D. The variant gambit: COVID-19’s next move. Cell Host Microbe 2021, 29, 508–515. [Google Scholar] [CrossRef]
- Starr, T.N.; Greaney, A.J.; Hilton, S.K.; Ellis, D.; Crawford, K.H.D.; Dingens, A.S.; Navarro, M.J.; Bowen, J.E.; Tortorici, M.A.; Walls, A.C.; et al. Deep mutational scanning of SARS-CoV-2 receptor binding domain reveals constraints on folding and ACE2 binding. Cell 2020, 182, 1295–1310.e1220. [Google Scholar] [CrossRef]
- Liu, Z.; VanBlargan, L.A.; Bloyet, L.M.; Rothlauf, P.W.; Chen, R.E.; Stumpf, S.; Zhao, H.; Errico, J.M.; Theel, E.S.; Liebeskind, M.J.; et al. Landscape analysis of escape variants identifies SARS-CoV-2 spike mutations that attenuate monoclonal and serum antibody neutralization. bioRxiv 2021. [Google Scholar] [CrossRef]
- Gregor, K.M.; Ciurkiewicz, M.; Rosiak, M.; Volz, A.; Allnoch, L.; Clever, S.; Zu Natrup, C.M.; Schünemann, L.M.; Armando, F.; Gerhauser, I.; et al. Retinal pathology in COVID-19: Will animal models help us? J. Comp. Pathol. 2023, 203, 46–47. [Google Scholar] [CrossRef]

Disclaimer/Publisher’s Note: The statements, opinions and data contained in all publications are solely those of the individual author(s) and contributor(s) and not of MDPI and/or the editor(s). MDPI and/or the editor(s) disclaim responsibility for any injury to people or property resulting from any ideas, methods, instructions or products referred to in the content. |
© 2025 by the authors. Licensee MDPI, Basel, Switzerland. This article is an open access article distributed under the terms and conditions of the Creative Commons Attribution (CC BY) license (https://creativecommons.org/licenses/by/4.0/).
Share and Cite
Rosiak, M.; Schreiner, T.; Beythien, G.; Leitzen, E.; Ulianytska, A.; Allnoch, L.; Becker, K.; Michaely, L.M.; Lockow, S.; Clever, S.; et al. Spatiotemporal Characterization of Changes in the Respiratory Tract and the Nervous System, Including the Eyes in SARS-CoV-2-Infected K18-hACE2 Mice. Viruses 2025, 17, 963. https://doi.org/10.3390/v17070963
Rosiak M, Schreiner T, Beythien G, Leitzen E, Ulianytska A, Allnoch L, Becker K, Michaely LM, Lockow S, Clever S, et al. Spatiotemporal Characterization of Changes in the Respiratory Tract and the Nervous System, Including the Eyes in SARS-CoV-2-Infected K18-hACE2 Mice. Viruses. 2025; 17(7):963. https://doi.org/10.3390/v17070963
Chicago/Turabian StyleRosiak, Malgorzata, Tom Schreiner, Georg Beythien, Eva Leitzen, Anastasiya Ulianytska, Lisa Allnoch, Kathrin Becker, Lukas M. Michaely, Sandra Lockow, Sabrina Clever, and et al. 2025. "Spatiotemporal Characterization of Changes in the Respiratory Tract and the Nervous System, Including the Eyes in SARS-CoV-2-Infected K18-hACE2 Mice" Viruses 17, no. 7: 963. https://doi.org/10.3390/v17070963
APA StyleRosiak, M., Schreiner, T., Beythien, G., Leitzen, E., Ulianytska, A., Allnoch, L., Becker, K., Michaely, L. M., Lockow, S., Clever, S., Meyer zu Natrup, C., Volz, A., Baumgärtner, W., Ciurkiewicz, M., Hülskötter, K., & Gregor, K. M. (2025). Spatiotemporal Characterization of Changes in the Respiratory Tract and the Nervous System, Including the Eyes in SARS-CoV-2-Infected K18-hACE2 Mice. Viruses, 17(7), 963. https://doi.org/10.3390/v17070963