
COVID-19 Outcomes and Vaccinations in Swedish Solid Organ Transplant Recipients 2020–2021: A Nationwide Multi-Register Comparative Cohort Study

 , , , , , , , , and
Abstract
1. Introduction
2. Materials and Methods
2.1. Study Design
2.2. Data Sources
2.3. Study Variables
2.3.1. Transplantation Status
2.3.2. COVID-19 Outcomes
2.3.3. Covariates
2.4. Statistical Analyses
3. Results
3.1. Patient Characteristics
3.2. Outcomes
3.2.1. Comparisons with the General Population:
3.2.2. Comparisons with Weighted Comparison Cohorts
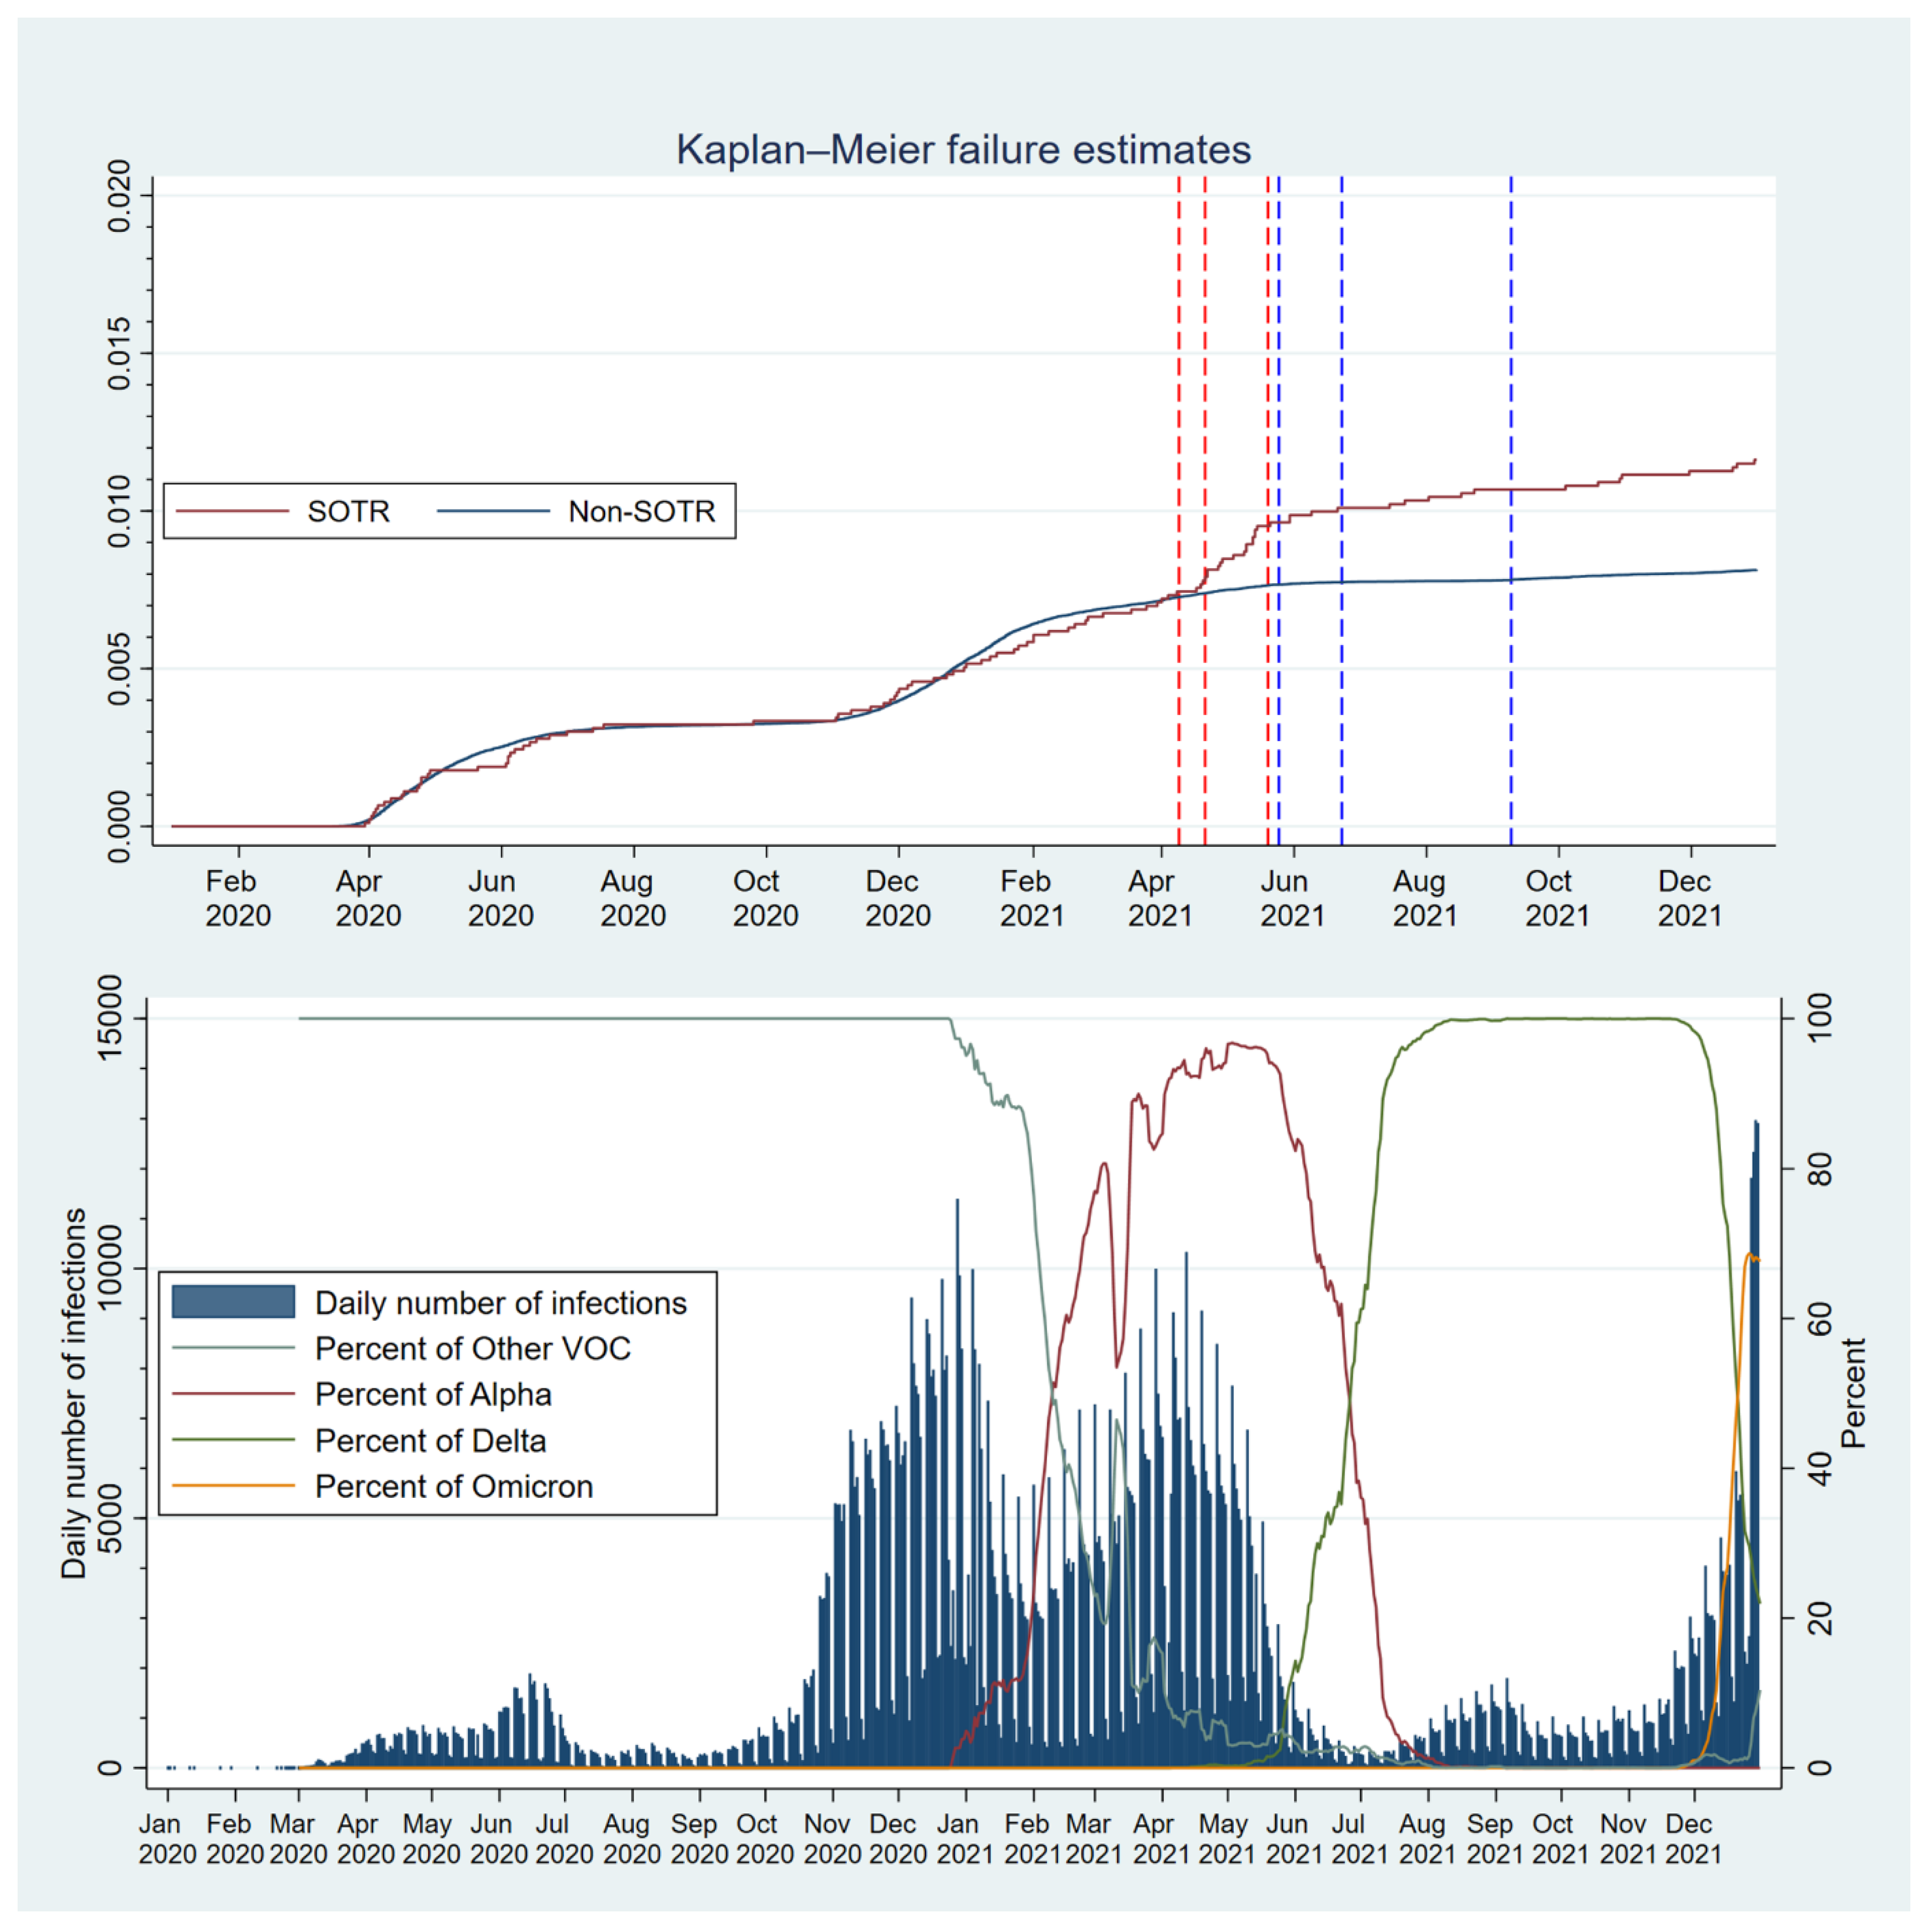
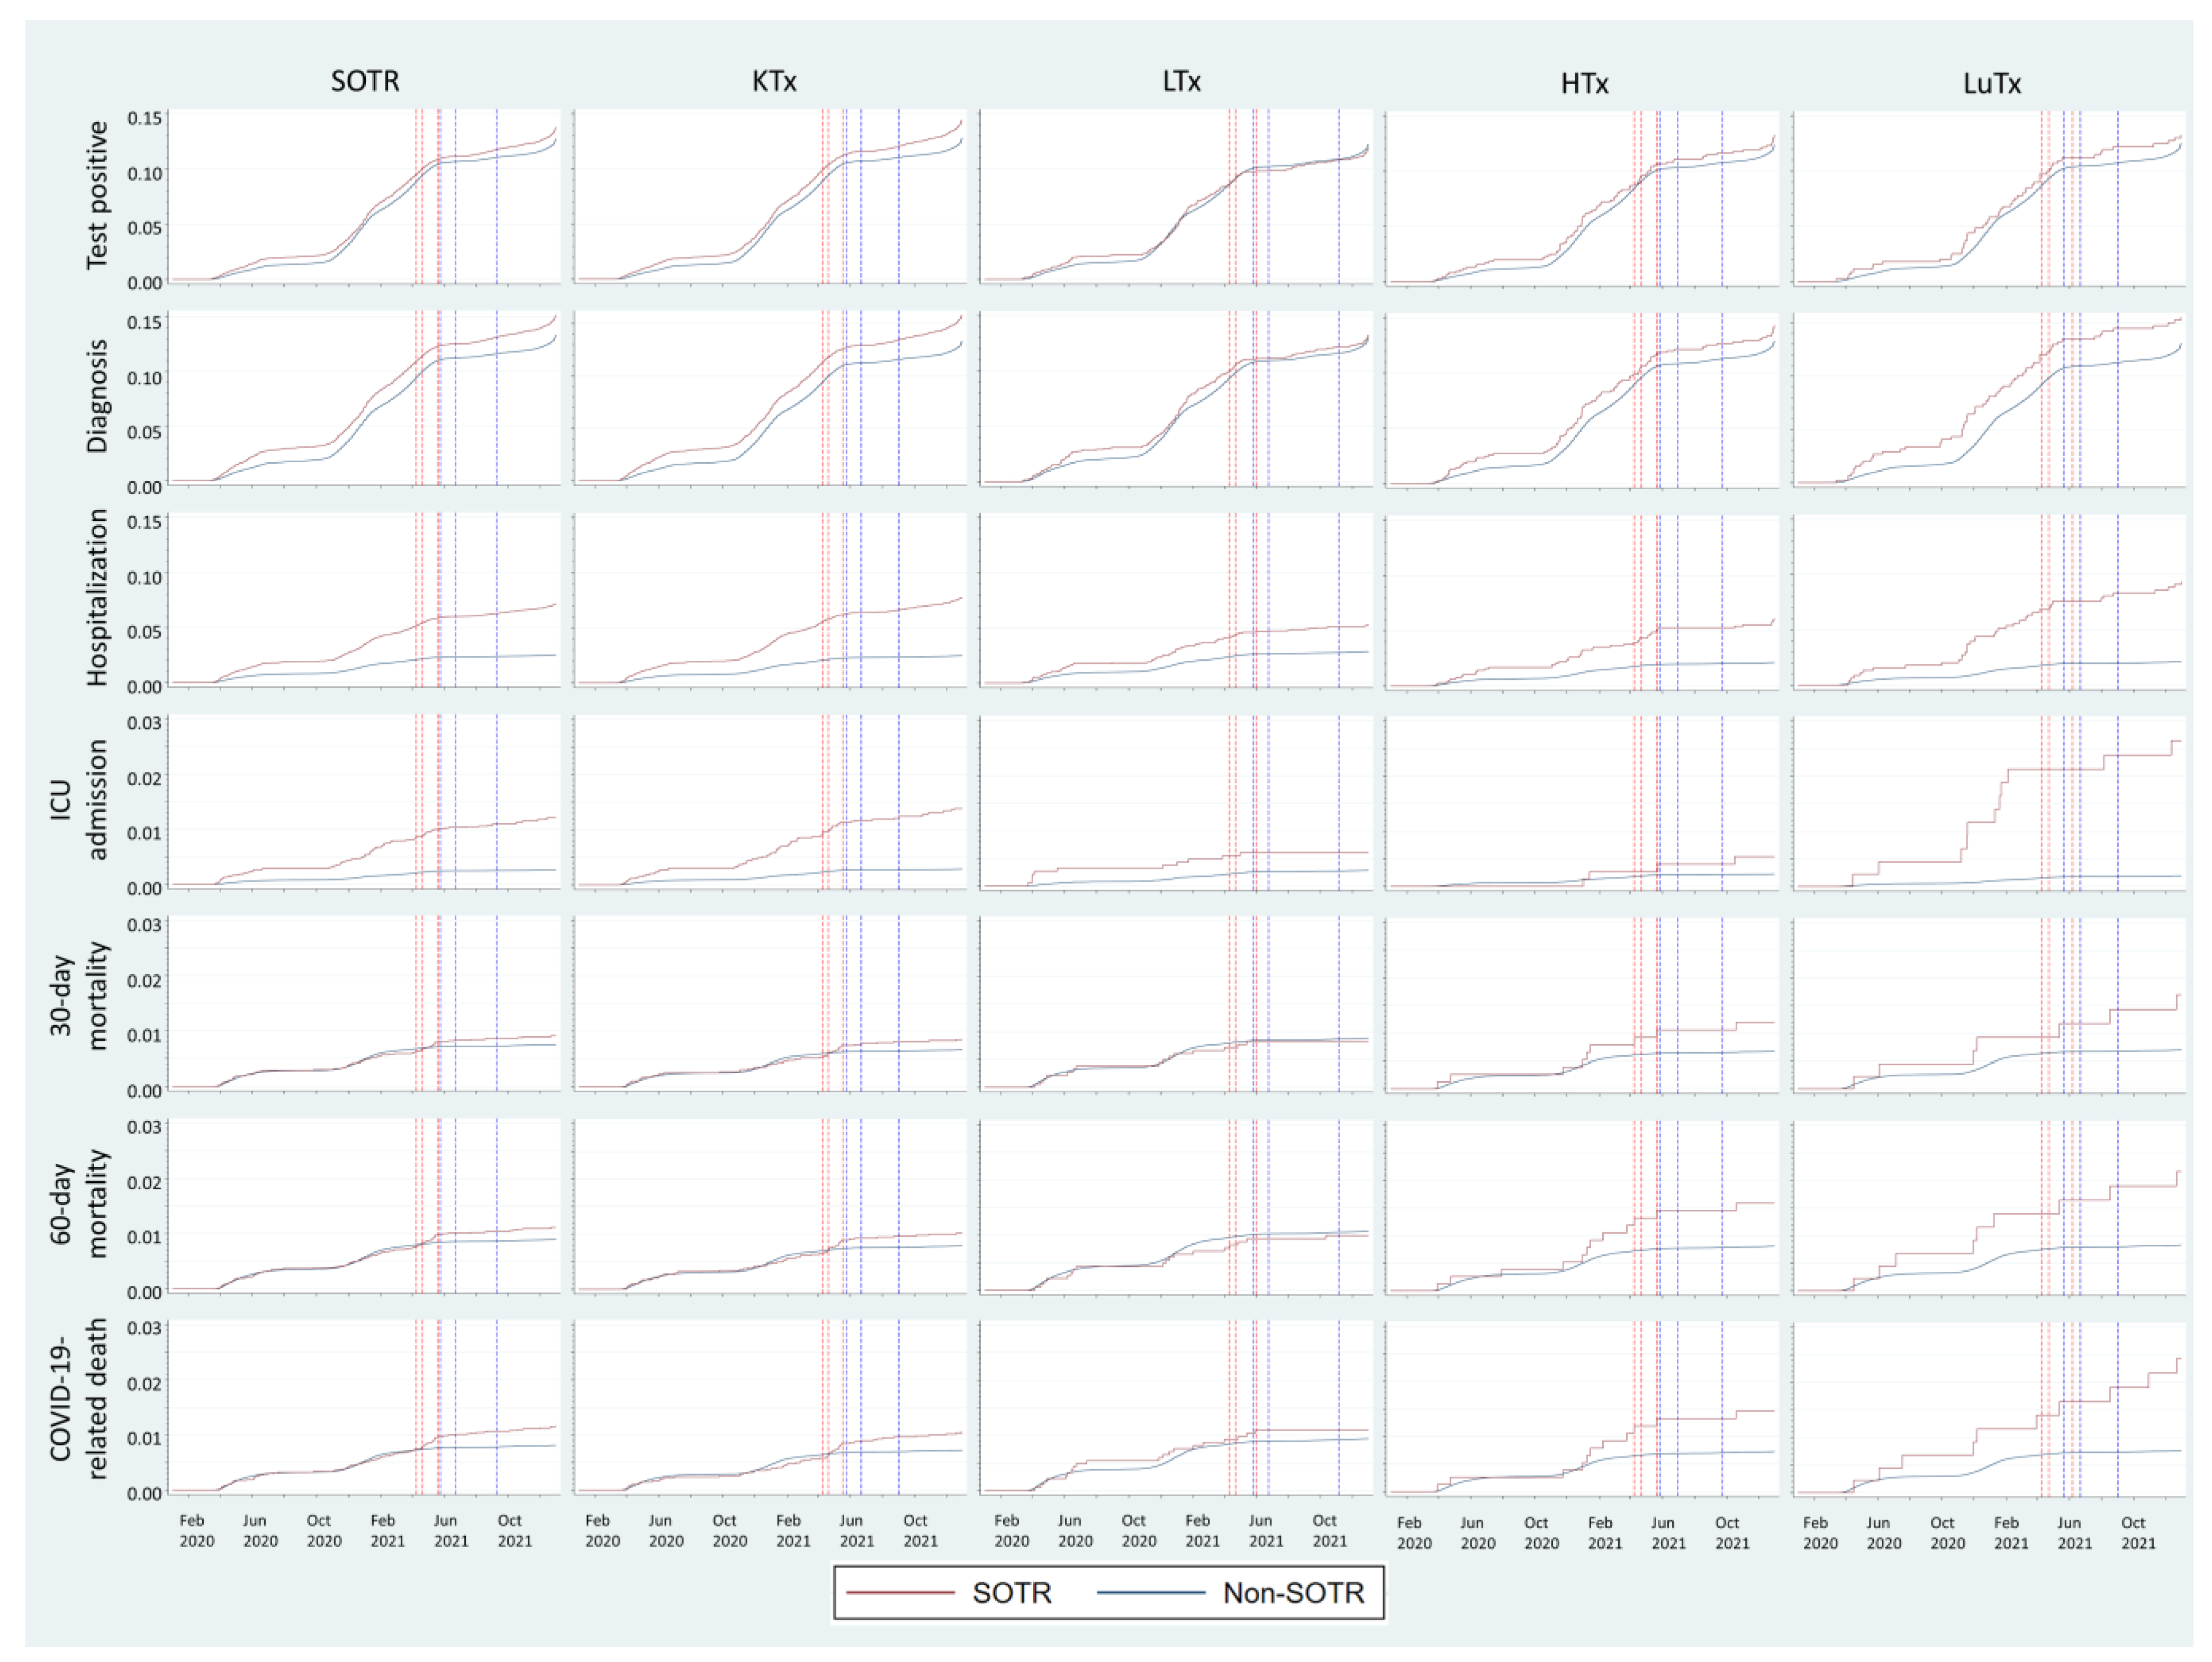
3.2.3. Variations over Time throughout the Pandemic
3.2.4. SARS-CoV-2 Vaccination
4. Discussion
5. Conclusions
Supplementary Materials
Author Contributions
Funding
Institutional Review Board Statement
Informed Consent Statement
Data Availability Statement
Conflicts of Interest
Appendix A

| Patient Type | ICD-10 | NCSP-Codes |
|---|---|---|
| Kidney (KTx) | Z940 | KAS10 KAS20 KAS96 KAS97 |
| Heart (HTx) | Z941 | FQA10 FQA00 FQA96 FQA20 |
| Lung (LuTx) | Z942 | GDG10 GDG00 GDG30 GDG03 GDG13 GDG96 |
| Liver (LTX) | Z944 | JJC00 JJC96 JJC10 JJC20 |
| Dialysis status | Z992 | DR015 DR016 DR024 |
| Drug | ATC Code |
|---|---|
| Ciclosporin | L04AD01 |
| Tacrolimus | L04AD02 |
| Mycophenolic acid | L04AA06 |
| Sirolimus | L04AA10 |
| Everolimus | L04AA18 |
| Methotrexate | L04AX03 |
| Azathioprine | L04AX01 |
| Prednisolone | H02AB06 |
| A. SOTRs Overall | ||||||||
|---|---|---|---|---|---|---|---|---|
| Overall SOTR | Before Weighting | After Weighting | ||||||
| SOTR | Non-SOTR | p | SMD | SOTR | Non-SOTR | p | SMD | |
| Count | 9073 | 10,362,960 | 9073 | 9070.49 | ||||
| Age, mean (SD) | 54.90 (16.33) | 40.74 (23.98) | <0.001 | 0.69 | 54.90 (16.33) | 54.88 (21.86) | 0.887 | 0.001 |
| Gender (female), n (%) | 3342 (36.8) | 5,148,823 (49.7) | <0.001 | 0.262 | 3342.0 (36.8) | 3341.1 (36.8) | 0.999 | <0.001 |
| Education, n (%) | <0.001 | 0.549 | 1 | 0.001 | ||||
| Primary | 1784 (19.7) | 1,623,103 (15.7) | 1784.0 (19.7) | 1785.4 (19.7) | ||||
| Secondary | 4128 (45.5) | 3,511,577 (33.9) | 4128.0 (45.5) | 4128.1 (45.5) | ||||
| Tertiary | 2801 (30.9) | 3,031,146 (29.2) | 2801.0 (30.9) | 2797.1 (30.8) | ||||
| Unknown | 360 (4.0) | 2,197,134 (21.2) | 360.0 (4.0) | 359.9 (4.0) | ||||
| Charlson comorbidity index, n (%) | <0.001 | 3.49 | 1 | 0.003 | ||||
| 0 | 305 (3.4) | 9,301,653 (89.8) | 305.0 (3.4) | 305.0 (3.4) | ||||
| 1 | 3850 (42.4) | 453,394 (4.4) | 3850.0 (42.4) | 3856.6 (42.5) | ||||
| 2 | 2201 (24.3) | 413,578 (4.0) | 2201.0 (24.3) | 2201.7 (24.3) | ||||
| 3 | 1092 (12.0) | 74,577 (0.7) | 1092.0 (12.0) | 1086.4 (12.0) | ||||
| 4 | 858 (9.5) | 45,322 (0.4) | 858.0 (9.5) | 857.7 (9.5) | ||||
| 5 | 330 (3.6) | 13,808 (0.1) | 330.0 (3.6) | 326.7 (3.6) | ||||
| 6 | 204 (2.2) | 46,807 (0.5) | 204.0 (2.2) | 204.1 (2.2) | ||||
| 7 | 127 (1.4) | 7322 (0.1) | 127.0 (1.4) | 126.7 (1.4) | ||||
| 8 | 65 (0.7) | 4196 (0.0) | 65.0 (0.7) | 64.8 (0.7) | ||||
| 9 | 22 (0.2) | 1431 (0.0) | 22.0 (0.2) | 21.9 (0.2) | ||||
| 10 | 11 (0.1) | 646 (0.0) | 11.0 (0.1) | 11.0 (0.1) | ||||
| 11 | 6 (0.1) | 177 (0.0) | 6.0 (0.1) | 5.9 (0.1) | ||||
| 12 | 2 (0.0) | 49 (0.0) | 2.0 (0.0) | 2.0 (0.0) | ||||
| Income, n (%) | <0.001 | 0.534 | 1 | <0.001 | ||||
| Low | 2098 (23.1) | 1,989,214 (19.2) | 2098.0 (23.1) | 2097.9 (23.1) | ||||
| Low-Middle | 2281 (25.1) | 2,133,870 (20.6) | 2281.0 (25.1) | 2280.0 (25.1) | ||||
| Middle-High | 2212 (24.4) | 2,199,276 (21.2) | 2212.0 (24.4) | 2211.8 (24.4) | ||||
| High | 2274 (25.1) | 2,198,569 (21.2) | 2274.0 (25.1) | 2272.9 (25.1) | ||||
| Unknown | 208 (2.3) | 1,842,031 (17.8) | 208.0 (2.3) | 207.9 (2.3) | ||||
| Country of birth, n (%) | 0.001 | 0.048 | 1 | 0.001 | ||||
| Sweden | 7324 (80.7) | 8,304,260 (80.1) | 7324.0 (80.7) | 7319.9 (80.7) | ||||
| Low-income | 522 (5.8) | 623,055 (6.0) | 522.0 (5.8) | 522.2 (5.8) | ||||
| Low-Middle-income | 291 (3.2) | 414,380 (4.0) | 291.0 (3.2) | 291.9 (3.2) | ||||
| Middle-High-income | 263 (2.9) | 300,270 (2.9) | 263.0 (2.9) | 263.3 (2.9) | ||||
| High-income | 548 (6.0) | 573,754 (5.5) | 548.0 (6.0) | 548.2 (6.0) | ||||
| Unknown | 125 (1.4) | 147,241 (1.4) | 125.0 (1.4) | 125.0 (1.4) | ||||
| Marrital status (not married), n (%) | 4866 (53.6) | 6,958,660 (67.1) | <0.001 | 0.279 | 4866.0 (53.6) | 4869.2 (53.7) | 0.924 | 0.001 |
| Healthcare region, n (%) | <0.001 | 0.082 | 1 | <0.001 | ||||
| North | 894 (9.9) | 899,110 (8.7) | 894.0 (9.9) | 894.3 (9.9) | ||||
| Stockholm | 1920 (21.2) | 2,452,115 (23.7) | 1920.0 (21.2) | 1919.5 (21.2) | ||||
| Southeast | 909 (10.0) | 1,076,468 (10.4) | 909.0 (10.0) | 908.7 (10.0) | ||||
| South | 1582 (17.4) | 1,886,581 (18.2) | 1582.0 (17.4) | 1580.9 (17.4) | ||||
| Uppsala-Örebrö | 1917 (21.1) | 2,123,167 (20.5) | 1917.0 (21.1) | 1917.1 (21.1) | ||||
| West | 1851 (20.4) | 1,925,519 (18.6) | 1851.0 (20.4) | 1849.9 (20.4) | ||||
 | ||||||||
| B. KTx | ||||||||
| KTx | Before Weighting | After Weighting | ||||||
| SOTR | Non-SOTR | p | SMD | SOTR | Non-SOTR | p | SMD | |
| Count | 5967 | 1,061,258 | 5967 | 5967.54 | ||||
| Age, mean (SD) | 55.35 (15.54) | 57.43 (26.10) | <0.001 | 0.097 | 55.35 (15.54) | 55.31 (21.42) | 0.84 | 0.002 |
| Gender (female), n (%) | 2166 (36.3) | 519,868 (49.0) | <0.001 | 0.259 | 2166.0 (36.3) | 2167.2 (36.3) | 0.98 | <0.001 |
| Education, n (%) | <0.001 | 0.455 | 1 | 0.001 | ||||
| Primary | 1187 (19.9) | 263,498 (24.8) | 1187.0 (19.9) | 1187.5 (19.9) | ||||
| Secondary | 2769 (46.4) | 391,657 (36.9) | 2769.0 (46.4) | 2770.4 (46.4) | ||||
| Tertiary | 1832 (30.7) | 254,159 (23.9) | 1832.0 (30.7) | 1830.6 (30.7) | ||||
| Unknown | 179 (3.0) | 151,944 (14.3) | 179.0 (3.0) | 179.1 (3.0) | ||||
| Charlson comorbidity index, n (%) | <0.001 | 0.563 | 1 | 0.001 | ||||
| 0 * | 0 | 0 | 0 | 0 | ||||
| 1 | 3617 (60.6) | 453,394 (42.7) | 3617.0 (60.6) | 3619.0 (60.6) | ||||
| 2 | 1089 (18.3) | 413,578 (39.0) | 1089.0 (18.3) | 1089.5 (18.3) | ||||
| 3 | 704 (11.8) | 74,577 (7.0) | 704.0 (11.8) | 702.1 (11.8) | ||||
| 4 | 314 (5.3) | 45,322 (4.3) | 314.0 (5.3) | 314.3 (5.3) | ||||
| 5 | 116 (1.9) | 13,808 (1.3) | 116.0 (1.9) | 115.6 (1.9) | ||||
| 6 | 45 (0.8) | 46,807 (4.4) | 45.0 (0.8) | 45.0 (0.8) | ||||
| 7 | 55 (0.9) | 7322 (0.7) | 55.0 (0.9) | 55.0 (0.9) | ||||
| 8 | 15 (0.3) | 4196 (0.4) | 15.0 (0.3) | 15.0 (0.3) | ||||
| 9 | 8 (0.1) | 1431 (0.1) | 8.0 (0.1) | 8.0 (0.1) | ||||
| 10 | 3 (0.1) | 646 (0.1) | 3.0 (0.1) | 3.0 (0.1) | ||||
| 11 | 1 (0.0) | 177 (0.0) | 1.0 (0.0) | 1.0 (0.0) | ||||
| 12 | ||||||||
| Income, n (%) | <0.001 | 0.49 | 1 | <0.001 | ||||
| Low | 1404 (23.5) | 267,061 (25.2) | 1404.0 (23.5) | 1403.8 (23.5) | ||||
| Low-Middle | 1483 (24.9) | 282,484 (26.6) | 1483.0 (24.9) | 1482.8 (24.8) | ||||
| Middle-High | 1480 (24.8) | 187,316 (17.7) | 1480.0 (24.8) | 1480.8 (24.8) | ||||
| High | 1516 (25.4) | 192,325 (18.1) | 1516.0 (25.4) | 1516.1 (25.4) | ||||
| Unknown | 84 (1.4) | 132,072 (12.4) | 84.0 (1.4) | 84.0 (1.4) | ||||
| Country of birth, n (%) | <0.001 | 0.2 | 1 | <0.001 | ||||
| Sweden | 4780 (80.1) | 903,967 (85.2) | 4780.0 (80.1) | 4780.4 (80.1) | ||||
| Low-income | 324 (5.4) | 69,578 (6.6) | 324.0 (5.4) | 323.9 (5.4) | ||||
| Low-Middle-income | 215 (3.6) | 20,642 (1.9) | 215.0 (3.6) | 215.2 (3.6) | ||||
| Middle-High-income | 188 (3.2) | 18,839 (1.8) | 188.0 (3.2) | 188.1 (3.2) | ||||
| High-income | 377 (6.3) | 38,105 (3.6) | 377.0 (6.3) | 376.8 (6.3) | ||||
| Unknown | 83 (1.4) | 10,127 (1.0) | 83.0 (1.4) | 83.1 (1.4) | ||||
| Marital status (not married), n (%) | 3200 (53.6) | 649,249 (61.2) | <0.001 | 0.153 | 3200.0 (53.6) | 3202.6 (53.7) | 0.95 | 0.001 |
| Healthcare region, n (%) | <0.001 | 0.084 | 1 | <0.001 | ||||
| North | 550 (9.2) | 97,361 (9.2) | 550.0 (9.2) | 549.9 (9.2) | ||||
| Stockholm | 1241 (20.8) | 245,884 (23.2) | 1241.0 (20.8) | 1241.2 (20.8) | ||||
| Southeast | 614 (10.3) | 117,278 (11.1) | 614.0 (10.3) | 614.0 (10.3) | ||||
| South | 1041 (17.4) | 192,943 (18.2) | 1041.0 (17.4) | 1040.8 (17.4) | ||||
| Uppsala-Örebrö | 1405 (23.5) | 229,185 (21.6) | 1405.0 (23.5) | 1405.8 (23.6) | ||||
| West | 1116 (18.7) | 178,607 (16.8) | 1116.0 (18.7) | 1115.9 (18.7) | ||||
| * Since kidney transplantation (KTx) is a contributing factor of the Charlson comorbidity index (1 point), all KTx patients had a CCI ≥ 1. Therefore, individuals in the non-KTx group with a CCI = 0 did not obtain a valid propensity score and thus were not included. | ||||||||
 | ||||||||
| C. LTx | ||||||||
| LTx | Before Weighting | After Weighting | ||||||
| SOTR | Non-SOTR | p | SMD | SOTR | Non-SOTR | p | SMD | |
| Count | 1866 | 607,913 | 1866 | 1865.81 | ||||
| Age, mean (SD) | 54.11 (18.31) | 68.45 (17.03) | <0.001 | 0.811 | 54.11 (18.31) | 54.09 (21.39) | 0.961 | 0.001 |
| Gender (female), n (%) | 700 (37.5) | 281,571 (46.3) | <0.001 | 0.179 | 700.0 (37.5) | 699.4 (37.5) | 0.978 | 0.001 |
| Education, n (%) | <0.001 | 0.297 | 1 | 0.002 | ||||
| Primary | 357 (19.1) | 179,777 (29.6) | 357.0 (19.1) | 357.6 (19.2) | ||||
| Secondary | 798 (42.8) | 251,675 (41.4) | 798.0 (42.8) | 798.2 (42.8) | ||||
| Tertiary | 588 (31.5) | 159,663 (26.3) | 588.0 (31.5) | 587.8 (31.5) | ||||
| Unknown | 123 (6.6) | 16,798 (2.8) | 123.0 (6.6) | 122.2 (6.5) | ||||
| Charlson comorbidity index, n (%) | <0.001 | 0.711 | 1 | 0.004 | ||||
| 0 * | 0 | 0 | 0 | 0 | ||||
| 1 | 0 | 0 | 0 | 0 | ||||
| 2 | 771 (41.3) | 413,578 (68.0) | 771.0 (41.3) | 771.5 (41.3) | ||||
| 3 | 193 (10.3) | 74,577 (12.3) | 193.0 (10.3) | 193.2 (10.4) | ||||
| 4 | 468 (25.1) | 45,322 (7.5) | 468.0 (25.1) | 468.2 (25.1) | ||||
| 5 | 165 (8.8) | 13,808 (2.3) | 165.0 (8.8) | 163.3 (8.8) | ||||
| 6 | 143 (7.7) | 46,807 (7.7) | 143.0 (7.7) | 143.4 (7.7) | ||||
| 7 | 54 (2.9) | 7322 (1.2) | 54.0 (2.9) | 54.2 (2.9) | ||||
| 8 | 48 (2.6) | 4196 (0.7) | 48.0 (2.6) | 47.8 (2.6) | ||||
| 9 | 11 (0.6) | 1431 (0.2) | 11.0 (0.6) | 10.9 (0.6) | ||||
| 10 | 7 (0.4) | 646 (0.1) | 7.0 (0.4) | 7.1 (0.4) | ||||
| 11 | 4 (0.2) | 177 (0.0) | 4.0 (0.2) | 4.1 (0.2) | ||||
| 12 | 2 (0.1) | 49 (0.0) | 2.0 (0.1) | 2.0 (0.1) | ||||
| Income, n (%) | <0.001 | 0.322 | 1 | 0.002 | ||||
| Low | 460 (24.7) | 182,910 (30.1) | 460.0 (24.7) | 460.8 (24.7) | ||||
| Low-Middle | 431 (23.1) | 188,556 (31.0) | 431.0 (23.1) | 430.4 (23.1) | ||||
| Middle-High | 430 (23.0) | 110,914 (18.2) | 430.0 (23.0) | 430.4 (23.1) | ||||
| High | 459 (24.6) | 119,084 (19.6) | 459.0 (24.6) | 459.0 (24.6) | ||||
| Unknown | 86 (4.6) | 6449 (1.1) | 86.0 (4.6) | 85.1 (4.6) | ||||
| Country of birth, n (%) | <0.001 | 0.141 | 1 | 0.003 | ||||
| Sweden | 1470 (78.8) | 504,101 (82.9) | 1470.0 (78.8) | 1467.9 (78.7) | ||||
| Low-income | 140 (7.5) | 47,554 (7.8) | 140.0 (7.5) | 140.3 (7.5) | ||||
| Low-Middle-income | 62 (3.3) | 13,565 (2.2) | 62.0 (3.3) | 62.5 (3.3) | ||||
| Middle-High-income | 49 (2.6) | 11,740 (1.9) | 49.0 (2.6) | 49.2 (2.6) | ||||
| High-income | 117 (6.3) | 24,481 (4.0) | 117.0 (6.3) | 117.9 (6.3) | ||||
| Unknown | 28 (1.5) | 6472 (1.1) | 28.0 (1.5) | 28.1 (1.5) | ||||
| Marital status (not married), n (%) | 1008 (54.0) | 326,897 (53.8) | 0.85 | 0.005 | 1008.0 (54.0) | 1009.1 (54.1) | 0.955 | 0.001 |
| Healthcare region, n (%) | <0.001 | 0.216 | 1 | 0.002 | ||||
| North | 201 (10.8) | 57,899 (9.5) | 201.0 (10.8) | 201.1 (10.8) | ||||
| Stockholm | 453 (24.3) | 133,072 (21.9) | 453.0 (24.3) | 453.7 (24.3) | ||||
| Southeast | 176 (9.4) | 66,672 (11.0) | 176.0 (9.4) | 175.5 (9.4) | ||||
| South | 299 (16.0) | 111,895 (18.4) | 299.0 (16.0) | 298.5 (16.0) | ||||
| Uppsala-Örebrö | 303 (16.2) | 134,181 (22.1) | 303.0 (16.2) | 302.5 (16.2) | ||||
| West | 434 (23.3) | 104,194 (17.1) | 434.0 (23.3) | 434.5 (23.3) | ||||
| * Since liver transplantation (LTx) is a contributing factor of the Charlson comorbidity index (2 points), all LTx patients had CCI ≥ 2. Therefore, individuals in the non-LTx group with CCI ≤ 1 did not obtain a valid propensity score and thus were not included. | ||||||||
 | ||||||||
| D. HTx | ||||||||
| HTx | Before Weighting | After Weighting | ||||||
| SOTR | Non-SOTR | p | SMD | SOTR | Non-SOTR | p | SMD | |
| Count | 778 | 10,362,734 | 778 | 777.64 | ||||
| Age, mean (SD) | 52.58 (17.98) | 40.74 (23.98) | <0.001 | 0.56 | 52.58 (17.98) | 52.59 (22.77) | 0.99 | <0.001 |
| Gender (female), n (%) | 235 (30.2) | 5,148,725 (49.7) | <0.001 | 0.41 | 235.0 (30.2) | 234.9 (30.2) | 1 | <0.001 |
| Education, n (%) | <0.001 | 0.45 | 1 | <0.001 | ||||
| Primary | 140 (18.0) | 1,623,019 (15.7) | 140.0 (18.0) | 140.0 (18.0) | ||||
| Secondary | 359 (46.1) | 3,511,467 (33.9) | 359.0 (46.1) | 358.8 (46.1) | ||||
| Tertiary | 227 (29.2) | 3,031,121 (29.3) | 227.0 (29.2) | 226.9 (29.2) | ||||
| Unknown | 52 (6.7) | 2,197,127 (21.2) | 52.0 (6.7) | 52.0 (6.7) | ||||
| Charlson comorbidity index, n (%) | <0.001 | 1.77 | 1 | 0.001 | ||||
| 0 | 198 (25.4) | 9,301,653 (89.8) | 198.0 (25.4) | 198.0 (25.5) | ||||
| 1 | 71 (9.1) | 453,394 (4.4) | 71.0 (9.1) | 71.0 (9.1) | ||||
| 2 | 249 (32.0) | 413,578 (4.0) | 249.0 (32.0) | 249.0 (32.0) | ||||
| 3 | 146 (18.8) | 74,577 (0.7) | 146.0 (18.8) | 145.8 (18.7) | ||||
| 4 | 46 (5.9) | 45,322 (0.4) | 46.0 (5.9) | 46.0 (5.9) | ||||
| 5 | 41 (5.3) | 13,808 (0.1) | 41.0 (5.3) | 40.9 (5.3) | ||||
| 6 | 9 (1.2) | 46,807 (0.5) | 9.0 (1.2) | 9.0 (1.2) | ||||
| 7 | 12 (1.5) | 7322 (0.1) | 12.0 (1.5) | 12.0 (1.5) | ||||
| 8 | 2 (0.3) | 4196 (0.0) | 2.0 (0.3) | 2.0 (0.3) | ||||
| 9 | 3 (0.4) | 1431 (0.0) | 3.0 (0.4) | 3.0 (0.4) | ||||
| 10 | 1 (0.1) | 646 (0.0) | 1.0 (0.1) | 1.0 (0.1) | ||||
| 11 | ||||||||
| 12 | ||||||||
| Income, n (%) | <0.001 | 0.46 | 1 | <0.001 | ||||
| Low | 134 (17.2) | 1,989,113 (19.2) | 134.0 (17.2) | 134.0 (17.2) | ||||
| Low-Middle | 221 (28.4) | 2,133,801 (20.6) | 221.0 (28.4) | 220.9 (28.4) | ||||
| Middle-High | 201 (25.8) | 2,199,250 (21.2) | 201.0 (25.8) | 200.8 (25.8) | ||||
| High | 187 (24.0) | 2,198,541 (21.2) | 187.0 (24.0) | 187.0 (24.0) | ||||
| Unknown | 35 (4.5) | 1,842,029 (17.8) | 35.0 (4.5) | 35.0 (4.5) | ||||
| Country of birth, n (%) | <0.001 | 0.24 | 1 | <0.001 | ||||
| Sweden | 676 (86.9) | 8,304,075 (80.1) | 676.0 (86.9) | 675.7 (86.9) | ||||
| Low-income | 29 (3.7) | 623,032 (6.0) | 29.0 (3.7) | 29.0 (3.7) | ||||
| Low-Middle-income | 8 (1.0) | 414,374 (4.0) | 8.0 (1.0) | 8.0 (1.0) | ||||
| Middle-High-income | 22 (2.8) | 300,267 (2.9) | 22.0 (2.8) | 22.0 (2.8) | ||||
| High-income | 33 (4.2) | 573,751 (5.5) | 33.0 (4.2) | 33.0 (4.2) | ||||
| Unknown | 10 (1.3) | 147,235 (1.4) | 10.0 (1.3) | 10.0 (1.3) | ||||
| Marital status (not married), n (%) | 403 (51.8) | 6,958,537 (67.1) | <0.001 | 0.32 | 403.0 (51.8) | 402.8 (51.8) | 1 | <0.001 |
| Healthcare region, n (%) | <0.001 | 0.3 | 1 | <0.001 | ||||
| North | 106 (13.6) | 899,095 (8.7) | 106.0 (13.6) | 105.9 (13.6) | ||||
| Stockholm | 122 (15.7) | 2,452,037 (23.7) | 122.0 (15.7) | 122.0 (15.7) | ||||
| Southeast | 78 (10.0) | 1,076,443 (10.4) | 78.0 (10.0) | 78.0 (10.0) | ||||
| South | 141 (18.1) | 1,886,546 (18.2) | 141.0 (18.1) | 140.9 (18.1) | ||||
| Uppsala-Örebrö | 127 (16.3) | 2,123,127 (20.5) | 127.0 (16.3) | 126.9 (16.3) | ||||
| West | 204 (26.2) | 1,925,486 (18.6) | 204.0 (26.2) | 203.9 (26.2) | ||||
 | ||||||||
| E. LuTx | ||||||||
| LuTx | Before Weighting | After Weighting | ||||||
| SOTR | Non-SOTR | p | SMD | SOTR | Non-SOTR | p | SMD | |
| Count | 462 | 10,356,638 | 462 | 461.99 | ||||
| Age, mean (SD) | 56.21 (14.37) | 40.72 (23.98) | <0.001 | 0.78 | 56.21 (14.37) | 56.21 (21.40) | 1 | <0.001 |
| Gender (female), n (%) | 241 (52.2) | 5,145,951 (49.7) | 0.309 | 0.05 | 241.0 (52.2) | 241.0 (52.2) | 1 | <0.001 |
| Education, n (%) | <0.001 | 0.67 | 1 | <0.001 | ||||
| Primary | 100 (21.6) | 1,620,885 (15.7) | 100.0 (21.6) | 100.0 (21.6) | ||||
| Secondary | 202 (43.7) | 3,509,014 (33.9) | 202.0 (43.7) | 202.0 (43.7) | ||||
| Tertiary | 154 (33.3) | 3,029,716 (29.3) | 154.0 (33.3) | 154.0 (33.3) | ||||
| Unknown | 6 (1.3) | 2,197,023 (21.2) | 6.0 (1.3) | 6.0 (1.3) | ||||
| Charlson comorbidity index, n (%) | <0.001 | 1.83 | 1 | <0.001 | ||||
| 0 | 107 (23.2) | 9,301,653 (89.8) | 107.0 (23.2) | 107.0 (23.2) | ||||
| 1 | 162 (35.1) | 453,394 (4.4) | 162.0 (35.1) | 162.0 (35.1) | ||||
| 2 | 92 (19.9) | 413,578 (4.0) | 92.0 (19.9) | 92.0 (19.9) | ||||
| 3 | 49 (10.6) | 74,577 (0.7) | 49.0 (10.6) | 49.0 (10.6) | ||||
| 4 | 30 (6.5) | 45,322 (0.4) | 30.0 (6.5) | 30.0 (6.5) | ||||
| 5 | 8 (1.7) | 13,808 (0.1) | 8.0 (1.7) | 8.0 (1.7) | ||||
| 6 | 7 (1.5) | 46,807 (0.5) | 7.0 (1.5) | 7.0 (1.5) | ||||
| 7 | 6 (1.3) | 7322 (0.1) | 6.0 (1.3) | 6.0 (1.3) | ||||
| 8 | ||||||||
| 9 | ||||||||
| 10 | ||||||||
| 11 | 1 (0.2) | 177 (0.0) | 1.0 (0.2) | 1.0 (0.2) | ||||
| 12 | ||||||||
| Income, n (%) | <0.001 | 0.64 | 1 | <0.001 | ||||
| Low | 100 (21.6) | 1,987,081 (19.2) | 100.0 (21.6) | 100.0 (21.6) | ||||
| Low-Middle | 146 (31.6) | 2,131,588 (20.6) | 146.0 (31.6) | 146.0 (31.6) | ||||
| Middle-High | 101 (21.9) | 2,198,296 (21.2) | 101.0 (21.9) | 101.0 (21.9) | ||||
| High | 112 (24.2) | 2,197,665 (21.2) | 112.0 (24.2) | 112.0 (24.2) | ||||
| Unknown | 3 (0.6) | 1,842,008 (17.8) | 3.0 (0.6) | 3.0 (0.6) | ||||
| Country of birth, n (%) | 0.002 | 0.24 | 1 | <0.001 | ||||
| Sweden | 398 (86.1) | 8,298,966 (80.1) | 398.0 (86.1) | 398.0 (86.1) | ||||
| Low-income | 29 (6.3) | 622,453 (6.0) | 29.0 (6.3) | 29.0 (6.3) | ||||
| Low-Middle-income | 6 (1.3) | 414,275 (4.0) | 6.0 (1.3) | 6.0 (1.3) | ||||
| Middle-High-income | 4 (0.9) | 300,198 (2.9) | 4.0 (0.9) | 4.0 (0.9) | ||||
| High-income | 21 (4.5) | 573,552 (5.5) | 21.0 (4.5) | 21.0 (4.5) | ||||
| Unknown | 4 (0.9) | 147,194 (1.4) | 4.0 (0.9) | 4.0 (0.9) | ||||
| Marital status(not married), n (%) | 255 (55.2) | 6,955,242 (67.2) | <0.001 | 0.25 | 255.0 (55.2) | 255.0 (55.2) | 1 | <0.001 |
| Healthcare region, n (%) | 0.154 | 0.13 | 1 | <0.001 | ||||
| North | 37 (8.0) | 898,525 (8.7) | 37.0 (8.0) | 37.0 (8.0) | ||||
| Stockholm | 104 (22.5) | 2,450,444 (23.7) | 104.0 (22.5) | 104.0 (22.5) | ||||
| Southeast | 41 (8.9) | 1,075,768 (10.4) | 41.0 (8.9) | 41.0 (8.9) | ||||
| South | 101 (21.9) | 1,885,548 (18.2) | 101.0 (21.9) | 101.0 (21.9) | ||||
| Uppsala-Örebrö | 82 (17.7) | 2,121,837 (20.5) | 82.0 (17.7) | 82.0 (17.7) | ||||
| West | 97 (21.0) | 1,924,516 (18.6) | 97.0 (21.0) | 97.0 (21.0) | ||||
 | ||||||||
| Transplanted | Weighted Comparison Cohort | |
|---|---|---|
| SOTRs overall | ||
| First quartile | 9 April 2021 | 25 May 2021 |
| Second quartile | 21 April 2021 | 23 Jun 2021 |
| Third quartile | 20 May 2021 | 9 September 2021 |
| Kidney (KTx) | ||
| First quartile | 9 April 2021 | 25 May 2021 |
| Second quartile | 20 April 2021 | 22 June 2021 |
| Third quartile | 18 May 21 | 1 September 2021 |
| Liver (LTx) | ||
| First quartile | 10 April 2021 | 26 May 2021 |
| Second quartile | 22 April 2021 | 24 June 2021 |
| Third quartile | 1 June 2021 | 8 November 2021 |
| Heart (HTx) | ||
| First quartile | 8 April 2021 | 27 May 2021 |
| Second quartile | 22 April 2021 | 30 June 2021 |
| Third quartile | 21 May 2021 | 23 September 2021 |
| Lung (LuTx) | ||
| First quartile | 9 April 2021 | 21 May 2021 |
| Second quartile | 23 Apr 2021 | 22 June 2021 |
| Third quartile | 7 June 2021 | 1 September 2021 |
References
- Sahota, A.; Tien, A.; Yao, J.; Dong, E.; Herald, J.; Javaherifar, S.; Neyer, J.; Hwang, J.; Lee, R.; Fong, T.-L. Incidence, Risk Factors, and Outcomes of COVID-19 Infection in a Large Cohort of Solid Organ Transplant Recipients. Transplantation 2022, 106, 2426–2434. [Google Scholar] [CrossRef]
- Jering, K.S.; McGrath, M.M.; Mc Causland, F.R.; Claggett, B.; Cunningham, J.W.; Solomon, S.D. Excess mortality in solid organ transplant recipients hospitalized with COVID-19: A large-scale comparison of SOT recipients hospitalized with or without COVID-19. Clin. Transplant. 2022, 36, e14492. [Google Scholar] [CrossRef]
- Søfteland, J.M.; Friman, G.; von Zur-Mühlen, B.; Ericzon, B.-G.; Wallquist, C.; Karason, K.; Friman, V.; Ekelund, J.; Felldin, M.; Magnusson, J.; et al. COVID-19 in solid organ transplant recipients: A national cohort study from Sweden. Am. J. Transplant. 2021, 21, 2762–2773. [Google Scholar] [CrossRef]
- Avery, R.K.; Chiang, T.P.-Y.; Marr, K.A.; Brennan, D.C.; Sait, A.S.; Garibaldi, B.T.; Shah, P.; Ostrander, D.; Steinke, S.M.; Permpalung, N.; et al. Inpatient COVID-19 outcomes in solid organ transplant recipients compared to non-solid organ transplant patients: A retrospective cohort. Am. J. Transplant. 2021, 21, 2498–2508. [Google Scholar] [CrossRef]
- Trapani, S.; Masiero, L.; Puoti, F.; Rota, M.C.; Del Manso, M.; Lombardini, L.; Riccardo, F.; Amoroso, A.; Pezzotti, P.; Grossi, P.A.; et al. Incidence and outcome of SARS-CoV-2 infection on solid organ transplantation recipients: A nationwide population-based study. Am. J. Transplant. 2021, 21, 2509–2521. [Google Scholar] [CrossRef]
- Coll, E.; Fernández-Ruiz, M.; Sánchez-Álvarez, J.E.; Martínez-Fernández, J.R.; Crespo, M.; Gayoso, J.; Bada-Bosch, T.; Oppenheimer, F.; Moreso, F.; López-Oliva, M.O.; et al. COVID-19 in transplant recipients: The Spanish experience. Am. J. Transplant. 2021, 21, 1825–1837. [Google Scholar] [CrossRef]
- Ao, G.; Wang, Y.; Qi, X.; Nasr, B.; Bao, M.; Gao, M.; Sun, Y.; Xie, D. The association between severe or death COVID-19 and solid organ transplantation: A systematic review and meta-analysis. Transplant. Rev. 2021, 35, 100628. [Google Scholar] [CrossRef] [PubMed]
- Gatti, M.; Rinaldi, M.; Bussini, L.; Bonazzetti, C.; Pascale, R.; Pasquini, Z.; Faní, F.; Guedes, M.N.P.; Azzini, A.M.; Carrara, E.; et al. Clinical outcome in solid organ transplant recipients affected by COVID-19 compared to general population: A systematic review and meta-analysis. Clin. Microbiol. Infect. 2022, 28, 1057–1065. [Google Scholar] [CrossRef] [PubMed]
- Heldman, M.R.; Kates, O.S. COVID-19 in Solid Organ Transplant Recipients: A Review of the Current Literature. Curr. Treat. Options Infect. Dis. 2021, 13, 67–82. [Google Scholar] [CrossRef] [PubMed]
- Tschopp, J.; L’Huillier, A.G.; Mombelli, M.; Mueller, N.J.; Khanna, N.; Garzoni, C.; Meloni, D.; Papadimitriou-Olivgeris, M.; Neofytos, D.; Hirsch, H.H.; et al. First experience of SARS-CoV-2 infections in solid organ transplant recipients in the Swiss Transplant Cohort Study. Am. J. Transplant. 2020, 20, 2876–2882. [Google Scholar] [CrossRef] [PubMed]
- Heldman, M.R.; Kates, O.S.; Safa, K.; Kotton, C.N.; Mutani, A.K.; Georgia, S.J.; Steinbrink, J.M.; Alexander, B.D.; Blumberg, E.A.; Haydel, B.; et al. Delayed mortality among solid organ transplant recipients hospitalized for COVID-19. Clin. Infect. Dis. 2022. [Google Scholar]
- Kamp, J.C.; Hinrichs, J.B.; Fuge, J.; Ewen, R.; Gottlieb, J. COVID-19 in lung transplant recipients—Risk prediction and outcomes. PLoS ONE 2021, 16, e0257807. [Google Scholar] [CrossRef] [PubMed]
- Saez-Giménez, B.; Berastegui, C.; Barrecheguren, M.; Revilla-López, E.; Arcos, I.L.; Alonso, R.; Aguilar, M.; Mora, V.M.; Otero, I.; Reig, J.P.; et al. COVID-19 in lung transplant recipients: A multicenter study. Am. J. Transplant. 2021, 21, 1816–1824. [Google Scholar] [CrossRef] [PubMed]
- Nimmo, A.M.; Gardiner, D.M.; Ushiro-Lumb, I.M.; Ravanan, R.M.; Forsythe, J.L.R.M. The Global Impact of COVID-19 on Solid Organ Transplantation: Two Years into a Pandemic. Transplantation 2022, 106, 1312–1329. [Google Scholar] [CrossRef] [PubMed]
- Bin Lee, A.R.Y.; Wong, S.Y.; Chai, L.Y.A.; Lee, S.C.; Lee, M.X.; Muthiah, M.D.; Tay, S.H.; Teo, C.B.; Tan, B.K.J.; Chan, Y.H.; et al. Efficacy of COVID-19 vaccines in immunocompromised patients: Systematic review and meta-analysis. BMJ 2022, 376, e068632. [Google Scholar]
- Nyberg, F.; Franzén, S.; Lindh, M.; Vanfleteren, L.; Hammar, N.; Wettermark, B.; Sundström, J.; Santosa, A.; Björck, S.; Gisslén, M. Swedish COVID-19 Investigation for Future Insights–A Population Epidemiology Approach Using Register Linkage (SCIFI-PEARL). Clin. Epidemiol. 2021, 13, 649–659. [Google Scholar] [CrossRef] [PubMed]
- Ludvigsson, J.F.; Otterblad-Olausson, P.; Pettersson, B.U.; Ekbom, A. The Swedish personal identity number: Possibilities and pitfalls in healthcare and medical research. Eur. J. Epidemiol. 2009, 24, 659–667. [Google Scholar] [CrossRef]
- Ludvigsson, J.F.; Andersson, E.; Ekbom, A.; Feychting, M.; Kim, J.-L.; Reuterwall, C.; Heurgren, M.; Olausson, P.O. External review and validation of the Swedish national inpatient register. BMC Public Health 2011, 11, 450. [Google Scholar] [CrossRef]
- Svenska Intensivvårdsregistret. Available online: https://www.icuregswe.org/ (accessed on 30 June 2023).
- Wettermark, B.; Hammar, N.; MichaelFored, C.; Leimanis, A.; Olausson, P.O.; Bergman, U.; Persson, I.; Sundström, A.; Westerholm, B.; Rosén, M. The new Swedish Prescribed Drug Register—Opportunities for pharmacoepidemiological research and experience from the first six months. Pharmacoepidemiol. Drug Saf. 2007, 16, 726–735. [Google Scholar] [CrossRef]
- Rolfhamre, P.; Janson, A.; Arneborn, M.; Ekdahl, K. SmiNet-2: Description of an internet-based surveillance system for communicable diseases in Sweden. Eurosurveillance 2006, 11, 15–16. [Google Scholar] [CrossRef]
- Brooke, H.L.; Talbäck, M.; Hörnblad, J.; Johansson, L.A.; Ludvigsson, J.F.; Druid, H.; Feychting, M.; Ljung, R. The Swedish cause of death register. Eur. J. Epidemiol. 2017, 32, 765–773. [Google Scholar] [CrossRef]
- Chrapkowska, C.; Galanis, I.; Kark, M.; Lepp, T.; Lindstrand, A.; Roth, A.; Nilsson, A. Validation of the new Swedish vaccination register–Accuracy and completeness of register data. Vaccine 2020, 38, 4104–4110. [Google Scholar] [CrossRef]
- Ludvigsson, J.F.; Svedberg, P.; Olén, O.; Bruze, G.; Neovius, M. The longitudinal integrated database for health insurance and labour market studies (LISA) and its use in medical research. Eur. J. Epidemiol. 2019, 34, 423–437. [Google Scholar] [CrossRef]
- El Karoui, K.; De Vriese, A.S. COVID-19 in dialysis: Clinical impact, immune response, prevention, and treatment. Kidney Int. 2022, 101, 883–894. [Google Scholar] [CrossRef]
- Quan, H.; Sundararajan, V.; Halfon, P.; Fong, A.; Burnand, B.; Luthi, J.-C.; Saunders, L.D.; Beck, C.A.; Feasby, T.E.; Ghali, W.A. Coding Algorithms for Defining Comorbidities in ICD-9-CM and ICD-10 Administrative Data. Med. Care 2005, 43, 1130–1139. [Google Scholar] [CrossRef]
- Quan, H.; Li, B.; Couris, C.M.; Fushimi, K.; Graham, P.; Hider, P.; Januel, J.-M.; Sundararajan, V. Updating and validating the Charlson comorbidity index and score for risk adjustment in hospital discharge abstracts using data from 6 countries. Am. J. Epidemiol. 2011, 173, 676–682. [Google Scholar] [CrossRef] [PubMed]
- Public Health Agency of Sweden. COVID-19 Recommendations for at-Risk Patient Groups. 2020. Available online: https://www.folkhalsomyndigheten.se/smittskydd-beredskap/utbrott/aktuella-utbrott/covid-19/skydda-dig-sjalv-och-andra-rekommendationer-om-covid-19/rad-och-information-till-riskgrupper/ (accessed on 17 July 2023).
- Colmenero, J.; Rodríguez-Perálvarez, M.; Salcedo, M.; Arias-Milla, A.; Muñoz-Serrano, A.; Graus, J.; Nuño, J.; Gastaca, M.; Bustamante-Schneider, J.; Cachero, A.; et al. Epidemiological pattern, incidence, and outcomes of COVID-19 in liver transplant patients. J. Hepatol. 2021, 74, 148–155. [Google Scholar] [CrossRef] [PubMed]
- Polack, F.P.; Thomas, S.J.; Kitchin, N.; Absalon, J.; Gurtman, A.; Lockhart, S.; Perez, J.L.; Pérez Marc, G.; Moreira, E.D.; Zerbini, C.; et al. Safety and Efficacy of the BNT162b2 mRNA COVID-19 Vaccine. N. Engl. J. Med. 2020, 383, 2603–2615. [Google Scholar] [CrossRef] [PubMed]
- Baden, L.R.; El Sahly, H.M.; Essink, B.; Kotloff, K.; Frey, S.; Novak, R.; Diemert, D.; Spector, S.A.; Rouphael, N.; Creech, C.B.; et al. Efficacy and Safety of the mRNA-1273 SARS-CoV-2 Vaccine. N. Engl. J. Med. 2021, 384, 403–416. [Google Scholar] [CrossRef]
- Chen, X.; Luo, D.; Mei, B.; Du, J.; Liu, X.; Xie, H.; Liu, L.; Su, S.; Mai, G. Immunogenicity of COVID-19 vaccines in solid organ transplant recipients: A systematic review and meta-analysis. Clin. Microbiol. Infect. 2023, 29, 441–456. [Google Scholar] [CrossRef] [PubMed]
- Wei, J.; Stoesser, N.; Matthews, P.C.; Ayoubkhani, D.; Studley, R.; Bell, I.; Bell, J.I.; Newton, J.N.; Farrar, J.; Diamond, I.; et al. Antibody responses to SARS-CoV-2 vaccines in 45,965 adults from the general population of the United Kingdom. Nat. Microbiol. 2021, 6, 1140–1149. [Google Scholar] [CrossRef]
- Abir, T.; Kalimullah, N.A.; Osuagwu, U.L.; Yazdani, D.M.N.A.; Mamun, A.A.; Husain, T.; Basak, P.; Permarupan, P.Y.; Agho, K.E. Factors Associated with the Perception of Risk and Knowledge of Contracting the SARS-CoV-2 among Adults in Bangladesh: Analysis of Online Surveys. Int. J. Environ. Res. Public Health 2020, 17, 5252. [Google Scholar] [CrossRef] [PubMed]
- Khedmat, H.; Karbasi-Afshar, R.; Izadi, M.; Fazel, M. Response of transplant recipients to influenza vaccination based on type of immunosuppression: A meta-analysis. Saudi J. Kidney Dis. Transplant. 2015, 26, 877–883. [Google Scholar] [CrossRef]
- Søfteland, J.M.; Gisslén, M.; Liljeqvist, J.; Friman, V.; de Coursey, E.; Karason, K.; Ekelund, J.; Felldin, M.; Magnusson, J.; Baid-Agrawal, S.; et al. Longevity of anti-spike and anti-nucleocapsid antibodies after COVID-19 in solid organ transplant recipients compared to immunocompetent controls. Am. J. Transplant. 2022, 22, 1245–1252. [Google Scholar] [CrossRef] [PubMed]
- The National Board of Health and Welfare. Organ and Tissue Donation in Sweden. 2020. Available online: https://www.socialstyrelsen.se/globalassets/sharepoint-dokument/artikelkatalog/ovrigt/2021-6-7445.pdf (accessed on 5 July 2023).
- Petrou, P.; Samoutis, G.; Lionis, C. Single-payer or a multipayer health system: A systematic literature review. Public Health 2018, 163, 141–152. [Google Scholar] [CrossRef] [PubMed]
- Magesh, S.; John, D.; Li, W.T.; Li, Y.; Mattingly-App, A.; Jain, S.; Chang, E.Y.; Ongkeko, W.M. Disparities in COVID-19 Outcomes by Race, Ethnicity, and Socioeconomic Status: A Systematic-Review and Meta-analysis. JAMA Netw. Open. 2021, 4, e2134147. [Google Scholar] [CrossRef]
- Benchimol, E.I.; Smeeth, L.; Guttmann, A.; Harron, K.; Moher, D.; Petersen, I.; Sørensen, H.T.; von Elm, E.; Langan, S.M.; RECORD Working Committee. The REporting of studies Conducted using Observational Routinely-collected health Data (RECORD) statement. PLoS Med. 2015, 12, e1001885. [Google Scholar] [CrossRef]
| Register | Retrieved Variables |
|---|---|
| National Patient Register (NPR) [18] | Transplant status (exposure) Selected comorbidities recorded in inpatient care or during consultations in specialist ambulatory care (potential confounders) COVID-19-related hospitalization (outcome) |
| Swedish Intensive Care Register (SIR) [19] | COVID-19-related ICU records (outcome) |
| National Prescribed Drug Register (NPDR) [20] | Dispensed prescriptions of immunosuppressive drugs (exposure) |
| National database of notifiable diseases (SmiNet) [21] | Positive SARS-CoV-2 polymerase chain reaction (PCR) test results (outcome) |
| Cause-of-death register (CoDR) [22] | Date and causes of death (outcome) |
| National Vaccine Registry (NVR) [23] | Date and type of COVID-19 vaccination (potential confounders) |
| Longitudinal integrated database for health insurance and labor market studies (LISA) [24] | Demographic and socioeconomic characteristics (potential confounders) |
| COVID-19 Outcome | Description |
|---|---|
| Test-positive | PCR test positive for SARS-CoV-2 from SmiNet |
| Infection | The earliest of the following: (1) test-positive; (2) receiving a diagnosis of COVID-19 infection (ICD-10 U07.1, U07.2) as a primary or secondary diagnosis from the NPR; (3) death due to COVID-19 (COVID-19-related death) from the CoDR |
| Hospitalization | Inpatient records with a primary or secondary diagnosis of COVID-19 from the NPR |
| ICU admission | Intensive care records with a primary or secondary diagnosis of COVID-19 from the SIR |
| 30-day mortality (all-cause) | Death (of any cause) within 30 days from a test-positive |
| 60-day mortality (all-cause) | Death (of any cause) within 60 days from a test-positive |
| COVID-19-related death | COVID-19 diagnosis as an underlying or contributing cause of death from the CoDR |
| Case fatality rate (CFR) | Calculated using COVID-19-related death as the numerator and infection as the denominator (as defined above) |
| Overall SOTRs | KTx | LTx | HTx | LuTx | |
|---|---|---|---|---|---|
| Count | 9073 | 5967 | 1866 | 778 | 462 |
| Age, mean(SD) | 54.90 (16.33) | 55.35 (15.54) | 54.11 (18.31) | 52.58 (17.98) | 56.21 (14.37) |
| Gender (female), n (%) | 3342 (36.8%) | 2166 (36.3%) | 700 (37.5%) | 235 (30.2%) | 241 (52.2%) |
| Education level, n (%) | |||||
| Primary | 1784 (19.7%) | 1187 (19.9%) | 357 (19.1%) | 140 (18.0%) | 100 (21.6%) |
| Secondary | 4128 (45.5%) | 2769 (46.4%) | 798 (42.8%) | 359 (46.1%) | 202 (43.7%) |
| Tertiary | 2801 (30.9%) | 1832 (30.7%) | 588 (31.5%) | 227 (29.2%) | 154 (33.3%) |
| Unknown | 360 (4.0%) | 179 (3.0%) | 123 (6.6%) | 52 (6.7%) | 6 (1.3%) |
| Charlson comorbidity index, median, n (%) | 2 | 1 | 3 | 2 | 1 |
| 0 | 305 (3.4%) | 0 (0.0%) | 0 (0.0%) | 198 (25.4%) | 107 (23.2%) |
| 1 | 3850 (42.4%) | 3617 (60.6%) | 0 (0.0%) | 71 (9.1%) | 162 (35.1%) |
| 2 | 2201 (24.3%) | 1089 (18.3%) | 771 (41.3%) | 249 (32.0%) | 92 (19.9%) |
| 3 | 1092 (12.0%) | 704 (11.8%) | 193 (10.3%) | 146 (18.8%) | 49 (10.6%) |
| 4 | 858 (9.5%) | 314 (5.3%) | 468 (25.1%) | 46 (5.9%) | 30 (6.5%) |
| 5 | 330 (3.6%) | 116 (1.9%) | 165 (8.8%) | 41 (5.3%) | 8 (1.7%) |
| 6 | 204 (2.2%) | 45 (0.8%) | 143 (7.7%) | 9 (1.2%) | 7 (1.5%) |
| 7 | 127 (1.4%) | 55 (0.9%) | 54 (2.9%) | 12 (1.5%) | 6 (1.3%) |
| 8 | 65 (0.7%) | 15 (0.3%) | 48 (2.6%) | 2 (0.3%) | 0 (0.0%) |
| 9 | 22 (0.2%) | 8 (0.1%) | 11 (0.6%) | 3 (0.4%) | 0 (0.0%) |
| 10 | 11 (0.1%) | 3 (0.1%) | 7 (0.4%) | 1 (0.1%) | 0 (0.0%) |
| 11 | 6 (0.1%) | 1 (0.0%) | 4 (0.2%) | 0 (0.0%) | 1 (0.2%) |
| 12 | 2 (0.0%) | 0 (0.0%) | 2 (0.1%) | 0 (0.0%) | 0 (0.0%) |
| Income, n (%) | |||||
| Low | 2098 (23.1%) | 1404 (23.5%) | 460 (24.7%) | 134 (17.2%) | 100 (21.6%) |
| Low-Middle | 2281 (25.1%) | 1483 (24.9%) | 431 (23.1%) | 221 (28.4%) | 146 (31.6%) |
| Middle-High | 2212 (24.4%) | 1480 (24.8%) | 430 (23.0%) | 201 (25.8%) | 101 (21.9%) |
| High | 2274 (25.1%) | 1516 (25.4%) | 459 (24.6%) | 187 (24.0%) | 112 (24.2%) |
| Unknown | 208 (2.3%) | 84 (1.4%) | 86 (4.6%) | 35 (4.5%) | 3 (0.6%) |
| Country of birth, n (%) | |||||
| Sweden | 7324 (80.7%) | 4780 (80.1%) | 1470 (78.8%) | 676 (86.9%) | 398 (86.1%) |
| Low-income | 522 (5.8%) | 324 (5.4%) | 140 (7.5%) | 29 (3.7%) | 29 (6.3%) |
| Low-Middle-income | 291 (3.2%) | 215 (3.6%) | 62 (3.3%) | 8 (1.0%) | 6 (1.3%) |
| Middle-High-income | 263 (2.9%) | 188 (3.2%) | 49 (2.6%) | 22 (2.8%) | 4 (0.9%) |
| High-income | 548 (6.0%) | 377 (6.3%) | 117 (6.3%) | 33 (4.2%) | 21 (4.5%) |
| Unknown | 125 (1.4%) | 83 (1.4%) | 28 (1.5%) | 10 (1.3%) | 4 (0.9%) |
| Marital status (not married *), n (%) | 4866 (53.6%) | 3200 (53.6%) | 1008 (54.0%) | 403 (51.8%) | 255 (55.2%) |
| Healthcare region, n (%) | |||||
| North | 894 (9.9%) | 550 (9.2%) | 201 (10.8%) | 106 (13.6%) | 37 (8.0%) |
| Stockholm | 1920 (21.2%) | 1241 (20.8%) | 453 (24.3%) | 122 (15.7%) | 104 (22.5%) |
| Southeast | 909 (10.0%) | 614 (10.3%) | 176 (9.4%) | 78 (10.0%) | 41 (8.9%) |
| South | 1582 (17.4%) | 1041 (17.4%) | 299 (16.0%) | 141 (18.1%) | 101 (21.9%) |
| Uppsala-Örebrö | 1917 (21.1%) | 1405 (23.5%) | 303 (16.2%) | 127 (16.3%) | 82 (17.7%) |
| West | 1851 (20.4%) | 1116 (18.7%) | 434 (23.3%) | 204 (26.2%) | 97 (21.0%) |
| Immunosuppression | |||||
| Ciclosporin | 1530 (16.9%) | 935 (15.7%) | 139 (7.4%) | 202 (26.0%) | 254 (54.9%) |
| Tacrolimus | 7162 (78.9%) | 4774 (80.0%) | 1625 (87.1%) | 554 (71.2%) | 209 (45.1%) |
| Methotrexate | 6 (0.1%) | 1 (0.0%) | 2 (0.1%) | 1 (0.1%) | 2 (0.4%) |
| Prednisolone | 6876 (75.8%) | 5102 (85.5%) | 920 (49.3%) | 399 (51.3%) | 455 (98.3%) |
| Sirolimus | 63 (0.7%) | 35 (0.6%) | 22 (1.2%) | 2 (0.3%) | 4 (0.9%) |
| Everolimus | 806 (8.9%) | 294 (4.9%) | 123 (6.6%) | 229 (29.4%) | 160 (34.6%) |
| Mycophenolic acid | 6353 (70.0%) | 4457 (74.7%) | 827 (44.3%) | 671 (86.2%) | 398 (86.0%) |
| Azathioprine | 662 (7.3%) | 394 (6.6%) | 179 (9.6%) | 53 (6.8%) | 36 (7.8%) |
| Average number of prescribed immunosuppressants per patient | 2.59 | 2.68 | 2.06 | 2.71 | 3.28 |
| Before Weighting | After Weighting | |||||
|---|---|---|---|---|---|---|
| Non-SOTR | SOTR | SMD | Non-SOTR | SOTR | SMD | |
| Count (or equivalent weighted count) | 10,362,960 | 9073 | 9070.49 | 9073 | ||
| Age, mean (SD) | 40.74 (23.98) | 54.90 (16.33) | 0.690 | 54.88 (21.86) | 54.90 (16.33) | 0.001 |
| Gender (female), n (%) | 5,148,823 (49.7%) | 3342 (36.8%) | 0.262 | 3341.1 (36.8%) | 3342.0 (36.8%) | <0.001 |
| Education level, n (%) | 0.549 | 0.001 | ||||
| Primary | 1,623,103 (15.7%) | 1784 (19.7%) | 1785.4 (19.7%) | 1784.0 (19.7%) | ||
| Secondary | 3,511,577 (33.9%) | 4128 (45.5%) | 4128.1 (45.5%) | 4128.0 (45.5%) | ||
| Tertiary | 3,031,146 (29.2%) | 2801 (30.9%) | 2797.1 (30.8%) | 2801.0 (30.9%) | ||
| Unknown | 2,197,134 (21.2%) | 360 (4.0%) | 359.9 (4.0%) | 360.0 (4.0%) | ||
| Charlson comorbidity index, median, n (%) | 0 | 2 | 3.490 | 2 | 2 | 0.003 |
| 0 | 9,301,653 (89.8%) | 305 (3.4%) | 305.0 (3.4%) | 305.0 (3.4%) | ||
| 1 | 453,394 (4.4%) | 3850 (42.4%) | 3856.6 (42.5%) | 3850.0 (42.4%) | ||
| 2 | 413,578 (4.0%) | 2201 (24.3%) | 2201.7 (24.3%) | 2201.0 (24.3%) | ||
| 3 | 74,577 (0.7%) | 1092 (12.0%) | 1086.4 (12.0%) | 1092.0 (12.0%) | ||
| 4 | 45,322 (0.4%) | 858 (9.5%) | 857.7 (9.5%) | 858.0 (9.5%) | ||
| 5 | 13,808 (0.1%) | 330 (3.6%) | 326.7 (3.6%) | 330.0 (3.6%) | ||
| 6 | 46,807 (0.5%) | 204 (2.2%) | 204.1 (2.2%) | 204.0 (2.2%) | ||
| 7 | 7322 (0.1%) | 127 (1.4%) | 126.7 (1.4%) | 127.0 (1.4%) | ||
| 8 | 4196 (0.0%) | 65 (0.7%) | 64.8 (0.7%) | 65.0 (0.7%) | ||
| 9 | 1431 (0.0%) | 22 (0.2%) | 21.9 (0.2%) | 22.0 (0.2%) | ||
| 10 | 646 (0.0%) | 11 (0.1%) | 11.0 (0.1%) | 11.0 (0.1%) | ||
| 11 | 177 (0.0%) | 6 (0.1%) | 5.9 (0.1%) | 6.0 (0.1%) | ||
| 12 | 49 (0.0%) | 2 (0.0%) | 2.0 (0.0%) | 2.0 (0.0%) | ||
| Income, n (%) | 0.534 | <0.001 | ||||
| Low | 1,989,214 (19.2%) | 2098 (23.1%) | 2097.9 (23.1%) | 2098.0 (23.1%) | ||
| Low-Middle | 2,133,870 (20.6%) | 2281 (25.1%) | 2280.0 (25.1%) | 2281.0 (25.1%) | ||
| Middle-High | 2,199,276 (21.2%) | 2212 (24.4%) | 2211.8 (24.4%) | 2212.0 (24.4%) | ||
| High | 2,198,569 (21.2%) | 2274 (25.1%) | 2272.9 (25.1%) | 2274.0 (25.1%) | ||
| Unknown | 1,842,031 (17.8%) | 208 (2.3%) | 207.9 (2.3%) | 208.0 (2.3%) | ||
| Country of birth, n (%) | 0.048 | 0.001 | ||||
| Sweden | 8,304,260 (80.1%) | 7324 (80.7%) | 7319.9 (80.7%) | 7324.0 (80.7%) | ||
| Low-income | 623,055 (6.0%) | 522 (5.8%) | 522.2 (5.8%) | 522.0 (5.8%) | ||
| Low-Middle-income | 414,380 (4.0%) | 291 (3.2%) | 291.9 (3.2%) | 291.0 (3.2%) | ||
| Middle-High-income | 300,270 (2.9%) | 263 (2.9%) | 263.3 (2.9%) | 263.0 (2.9%) | ||
| High-income | 573,754 (5.5%) | 548 (6.0%) | 548.2 (6.0%) | 548.0 (6.0%) | ||
| Unknown | 147,241 (1.4%) | 125 (1.4%) | 125.0 (1.4%) | 125.0 (1.4%) | ||
| Marital status (not married *), n (%) | 6,958,660 (67.1%) | 4866 (53.6%) | 0.279 | 4869.2 (53.7%) | 4866.0 (53.6%) | 0.001 |
| Healthcare region, n (%) | 0.082 | <0.001 | ||||
| North | 899,110 (8.7%) | 894 (9.9%) | 894.3 (9.9%) | 894.0 (9.9%) | ||
| Stockholm | 2,452,115 (23.7%) | 1920 (21.2%) | 1919.5 (21.2%) | 1920.0 (21.2%) | ||
| Southeast | 1,076,468 (10.4%) | 909 (10.0%) | 908.7 (10.0%) | 909.0 (10.0%) | ||
| South | 1,886,581 (18.2%) | 1582 (17.4%) | 1580.9 (17.4%) | 1582.0 (17.4%) | ||
| Uppsala-Örebrö | 2,123,167 (20.5%) | 1917 (21.1%) | 1917.1 (21.1%) | 1917.0 (21.1%) | ||
| West | 1,925,519 (18.6%) | 1851 (20.4%) | 1849.9 (20.4%) | 1851.0 (20.4%) | ||
| SOTRs Overall vs. Unweighted Comparison Cohort | SOTRs Overall vs. Weighted Comparison Cohort | KTx vs. Weighted Comparison Cohort | LTx vs. Weighted Comparison Cohort | HTx vs. Weighted Comparison Cohort | LuTx vs. Weighted Comparison Cohort | ||
|---|---|---|---|---|---|---|---|
| Total count in SOTR and weighted comparison cohorts | SOTRs | 9073 | 9073 | 5967 | 1866 | 778 | 462 |
| Comparators | 10,362,960 | 9070.49 | 5967.54 | 1865.81 | 777.64 | 461.99 | |
| Test-positive n (%) | SOTRs | 1204 (13.27%) | 1204 (13.27%) | 834 (13.98%) | 215 (11.52%) | 100 (12.85%) | 55 (11.90%) |
| Comparators | 1,276,293 (12.32%) | 1098.43 (12.11%) | 732.83 (12.28%) | 212.64 (11.40%) | 91.36 (11.75%) | 55.27 (11.96%) | |
| Infection n (%) | SOTRs | 1328 (14.64%) | 1328 (14.64%) | 915 (15.33%) | 240 (12.86%) | 108 (13.88%) | 65 (14.07%) |
| Comparators | 1,294,658 (12.49%) | 1150.90 (12.69%) | 765.33 (12.82%) | 226.02 (12.11%) | 95.56 (12.29%) | 57.66 (12.48%) | |
| Hospitalization n (%) | SOTRs | 628 (6.92%) | 628 (6.92%) | 447 (7.49%) | 96 (5.14%) | 46 (5.91%) | 39 (8.44%) |
| Comparators | 74,245 (0.72%) | 218.45 (2.41%) | 143.52 (2.41%) | 50.56 (2.71%) | 15.95 (2.05%) | 9.46 (2.05%) | |
| ICU care n (%) | SOTRs | 106 (1.17%) | 106 (1.17%) | 80 (1.34%) | 11 (0.59%) | 4 (0.51%) | 11 (2.38%) |
| Comparators | 8101 (0.15%) | 22.85 (0.25%) | 16.59 (0.28%) | 4.92 (0.26%) | 1.66 (0.21%) | 0.85 (0.18%) | |
| 30-day mortality | SOTRs | 80 (0.88%) | 80 (0.88%) | 49 (0.82%) | 15 (0.80%) | 9 (1.16%) | 7 (1.52%) |
| (all-cause) n (%) | Comparators | 15,091 (0.17%) | 65.37 (0.72%) | 38.27 (0.64%) | 15.56 (0.83%) | 5.03 (0.65%) | 3.12 (0.68%) |
| 60-day mortality | SOTRs | 98 (1.08%) | 98 (1.08%) | 59 (0.99%) | 18 (0.96%) | 12 (1.54%) | 9 (1.95%) |
| (all-cause) n (%) | Comparators | 18,004 (0.17%) | 78.19 (0.86%) | 45.67 (0.77%) | 18.92 (1.01%) | 6.07 (0.78%) | 3.71 (0.80%) |
| COVID-19-related death n (%) | SOTRs | 102 (1.12%) | 102 (1.12%) | 61 (1.02%) | 20 (1.07%) | 11 (1.41%) | 10 (2.16%) |
| Comparators | 16,582 (0.16%) | 71.01 (0.78%) | 41.94 (0.70%) | 16.62 (0.89%) | 5.44 (0.70%) | 3.40 (0.74%) | |
| Case fatality rate * (%) | SOTRs | 7.7% | 7.7% | 6.7% | 8.3% | 10.2% | 15.4% |
| Comparators | 1.3% | 6.2% | 5.5% | 7.4% | 5.7% | 5.9% |
| Group | Outcome | HR | 95% Confidence Interval | p |
|---|---|---|---|---|
| SOTRs Overall | Test-positive | 1.09 | 1.03–1.15 | 0.004 |
| Infection | 1.15 | 1.09–1.22 | <0.001 | |
| Hospitalization | 2.89 | 2.67–3.13 | <0.001 | |
| ICU admission | 4.59 | 3.76–5.60 | <0.001 | |
| 30-day mortality (all-cause) | 1.21 | 0.97–1.51 | 0.094 | |
| 60-day mortality (all-cause) | 1.24 | 1.01–1.51 | 0.037 | |
| COVID-19-related death | 1.42 | 1.17–1.72 | <0.001 | |
| KTx | Test positive | 1.14 | 1.06–1.22 | <0.001 |
| Infection | 1.21 | 1.13–1.29 | <0.001 | |
| Hospitalization | 3.16 | 2.88–3.47 | <0.001 | |
| ICU admission | 4.80 | 3.83–6.02 | <0.001 | |
| 30-day mortality (all-cause) | 1.27 | 0.96–1.68 | 0.096 | |
| 60-day mortality (all-cause) | 1.28 | 0.99–1.66 | 0.058 | |
| COVID-19-related death | 1.44 | 1.12–1.86 | 0.004 | |
| LTx | Test positive | 0.98 | 0.85–1.12 | 0.709 |
| Infection | 1.03 | 0.91–1.17 | 0.648 | |
| Hospitalization | 1.86 | 1.52–2.27 | <0.001 | |
| ICU admission | 2.17 | 1.19–3.97 | 0.012 | |
| 30-day mortality (all-cause) | 0.94 | 0.56–1.56 | 0.796 | |
| 60-day mortality (all-cause) | 0.92 | 0.58–1.47 | 0.732 | |
| COVID-19-related death | 1.17 | 0.75–1.81 | 0.491 | |
| HTx | Test positive | 1.08 | 0.89–1.32 | 0.431 |
| Infection | 1.13 | 0.93–1.36 | 0.223 | |
| Hospitalization | 2.89 | 2.16–3.85 | <0.001 | |
| ICU admission | 2.38 | 0.89–6.35 | 0.084 | |
| 30-day mortality (all-cause) | 1.77 | 0.92–3.40 | 0.088 | |
| 60-day mortality (all-cause) | 1.95 | 1.11–3.43 | 0.021 | |
| COVID-19-related death | 1.99 | 1.10–3.60 | 0.022 | |
| LuTx | Test positive | 1.07 | 0.82–1.40 | 0.599 |
| Infection | 1.23 | 0.96–1.57 | 0.101 | |
| Hospitalization | 4.52 | 3.30–6.19 | <0.001 | |
| ICU admission | 13.82 | 7.64–25.0 | <0.001 | |
| 30-day mortality (all-cause) | 2.40 | 1.14–5.04 | 0.021 | |
| 60-day mortality (all-cause) | 2.59 | 1.34–4.98 | 0.004 | |
| COVID-19-related death | 3.15 | 1.69–5.87 | <0.001 |
| Days from COVID-19 Infection to Respective Outcome | SOTRs Overall | Weighted Comparison Cohort for SOTRs | KTx | Weighted Comparison Cohort for KTx | LTx | Weighted Comparison Cohort for LTx | HTx | Weighted Comparison Cohort for HTx | LuTx | Weighted Comparison Cohort for LuTx |
|---|---|---|---|---|---|---|---|---|---|---|
| Hospitalization | 0 (0–5) | 0 (0–3) | 0 (0–6) | 0 (0–4) | 0 (0–1.5) | 0 (0–2) | 0 (0–1) | 0 (0–3) | 0 (0–3) | 0 (0–3) |
| ICU admission | 7 (3–12) | 4 (1–8) | 8 (2–12) | 4 (1–8) | 6 (2–9) | 4 (1–8) | 3 (2–13) | 5 (1–8) | 7 (4–10) | 4 (1–8) |
| 30-day mortality (all-cause) | 12 (6–21) | 10 (6–16) | 12 (6–22) | 10 (6–16) | 12 (6–22) | 10 (6–17) | 6 (3–10) | 10 (6–17) | 16 (11–21) | 10 (6–16) |
| 60-day mortality (all-cause) | 14 (7–24) | 11 (6–20) | 14 (7–28) | 11 (6–20) | 13.5 (7–22) | 11 (6–21) | 9 (3.5–30) | 11 (6–21) | 19 (14–23) | 11 (6–20) |
| COVID-19-related death | 16 (7–32) | 10 (5–18) | 19 (9–33) | 10 (6–18) | 15 (7–50) | 10 (5–18) | 8 (3–29) | 10 (6–19) | 20 (14–64) | 10 (5–18) |
Disclaimer/Publisher’s Note: The statements, opinions and data contained in all publications are solely those of the individual author(s) and contributor(s) and not of MDPI and/or the editor(s). MDPI and/or the editor(s) disclaim responsibility for any injury to people or property resulting from any ideas, methods, instructions or products referred to in the content. |
© 2024 by the authors. Licensee MDPI, Basel, Switzerland. This article is an open access article distributed under the terms and conditions of the Creative Commons Attribution (CC BY) license (https://creativecommons.org/licenses/by/4.0/).
Share and Cite
Søfteland, J.M.; Li, H.; Magnusson, J.M.; Leach, S.; Friman, V.; Gisslén, M.; Felldin, M.; Schult, A.; Karason, K.; Baid-Agrawal, S.; et al. COVID-19 Outcomes and Vaccinations in Swedish Solid Organ Transplant Recipients 2020–2021: A Nationwide Multi-Register Comparative Cohort Study. Viruses 2024, 16, 271. https://doi.org/10.3390/v16020271
Søfteland JM, Li H, Magnusson JM, Leach S, Friman V, Gisslén M, Felldin M, Schult A, Karason K, Baid-Agrawal S, et al. COVID-19 Outcomes and Vaccinations in Swedish Solid Organ Transplant Recipients 2020–2021: A Nationwide Multi-Register Comparative Cohort Study. Viruses. 2024; 16(2):271. https://doi.org/10.3390/v16020271
Chicago/Turabian StyleSøfteland, John Mackay, Huiqi Li, Jesper M. Magnusson, Susannah Leach, Vanda Friman, Magnus Gisslén, Marie Felldin, Andreas Schult, Kristjan Karason, Seema Baid-Agrawal, and et al. 2024. "COVID-19 Outcomes and Vaccinations in Swedish Solid Organ Transplant Recipients 2020–2021: A Nationwide Multi-Register Comparative Cohort Study" Viruses 16, no. 2: 271. https://doi.org/10.3390/v16020271
APA StyleSøfteland, J. M., Li, H., Magnusson, J. M., Leach, S., Friman, V., Gisslén, M., Felldin, M., Schult, A., Karason, K., Baid-Agrawal, S., Wallquist, C., & Nyberg, F. (2024). COVID-19 Outcomes and Vaccinations in Swedish Solid Organ Transplant Recipients 2020–2021: A Nationwide Multi-Register Comparative Cohort Study. Viruses, 16(2), 271. https://doi.org/10.3390/v16020271