
Short- and Long-Interval Prime-Boost Vaccination with the Candidate Vaccines MVA-SARS-2-ST and MVA-SARS-2-S Induces Comparable Humoral and Cell-Mediated Immunity in Mice

 , , , , and
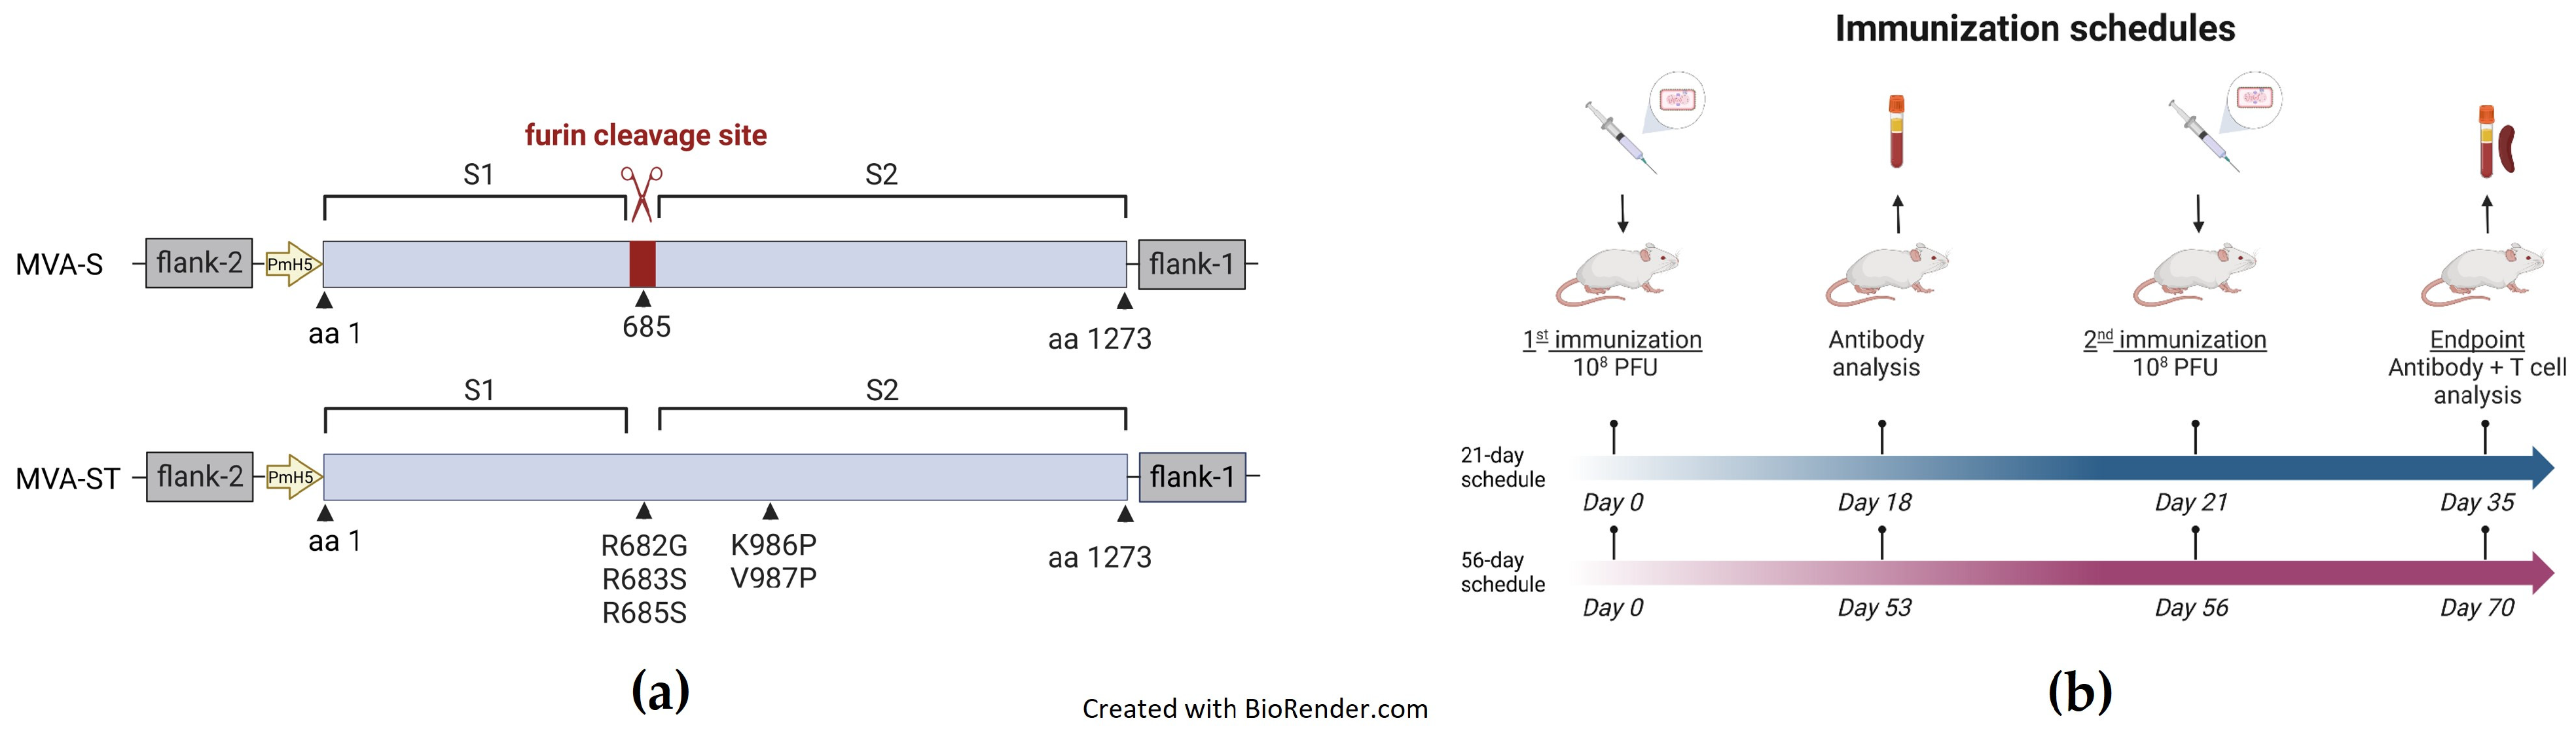
Abstract
1. Introduction
2. Materials and Methods
2.1. Plasmid Construction
2.2. Generation of Recombinant Viruses
2.3. Vaccination Experiments in Mice
2.4. Antigen-Specific IgG Enzyme-Linked Immunosorbent Assay (ELISA)
2.5. SARS-CoV-2 Virus Neutralization Test 100 (VNT100)
2.6. Measurement of Cellular Response by Enzyme-Linked Immunospot (ELISPOT)
2.7. Intracellular Cytokine Staining (ICS)
2.8. Statistical Analysis
3. Results
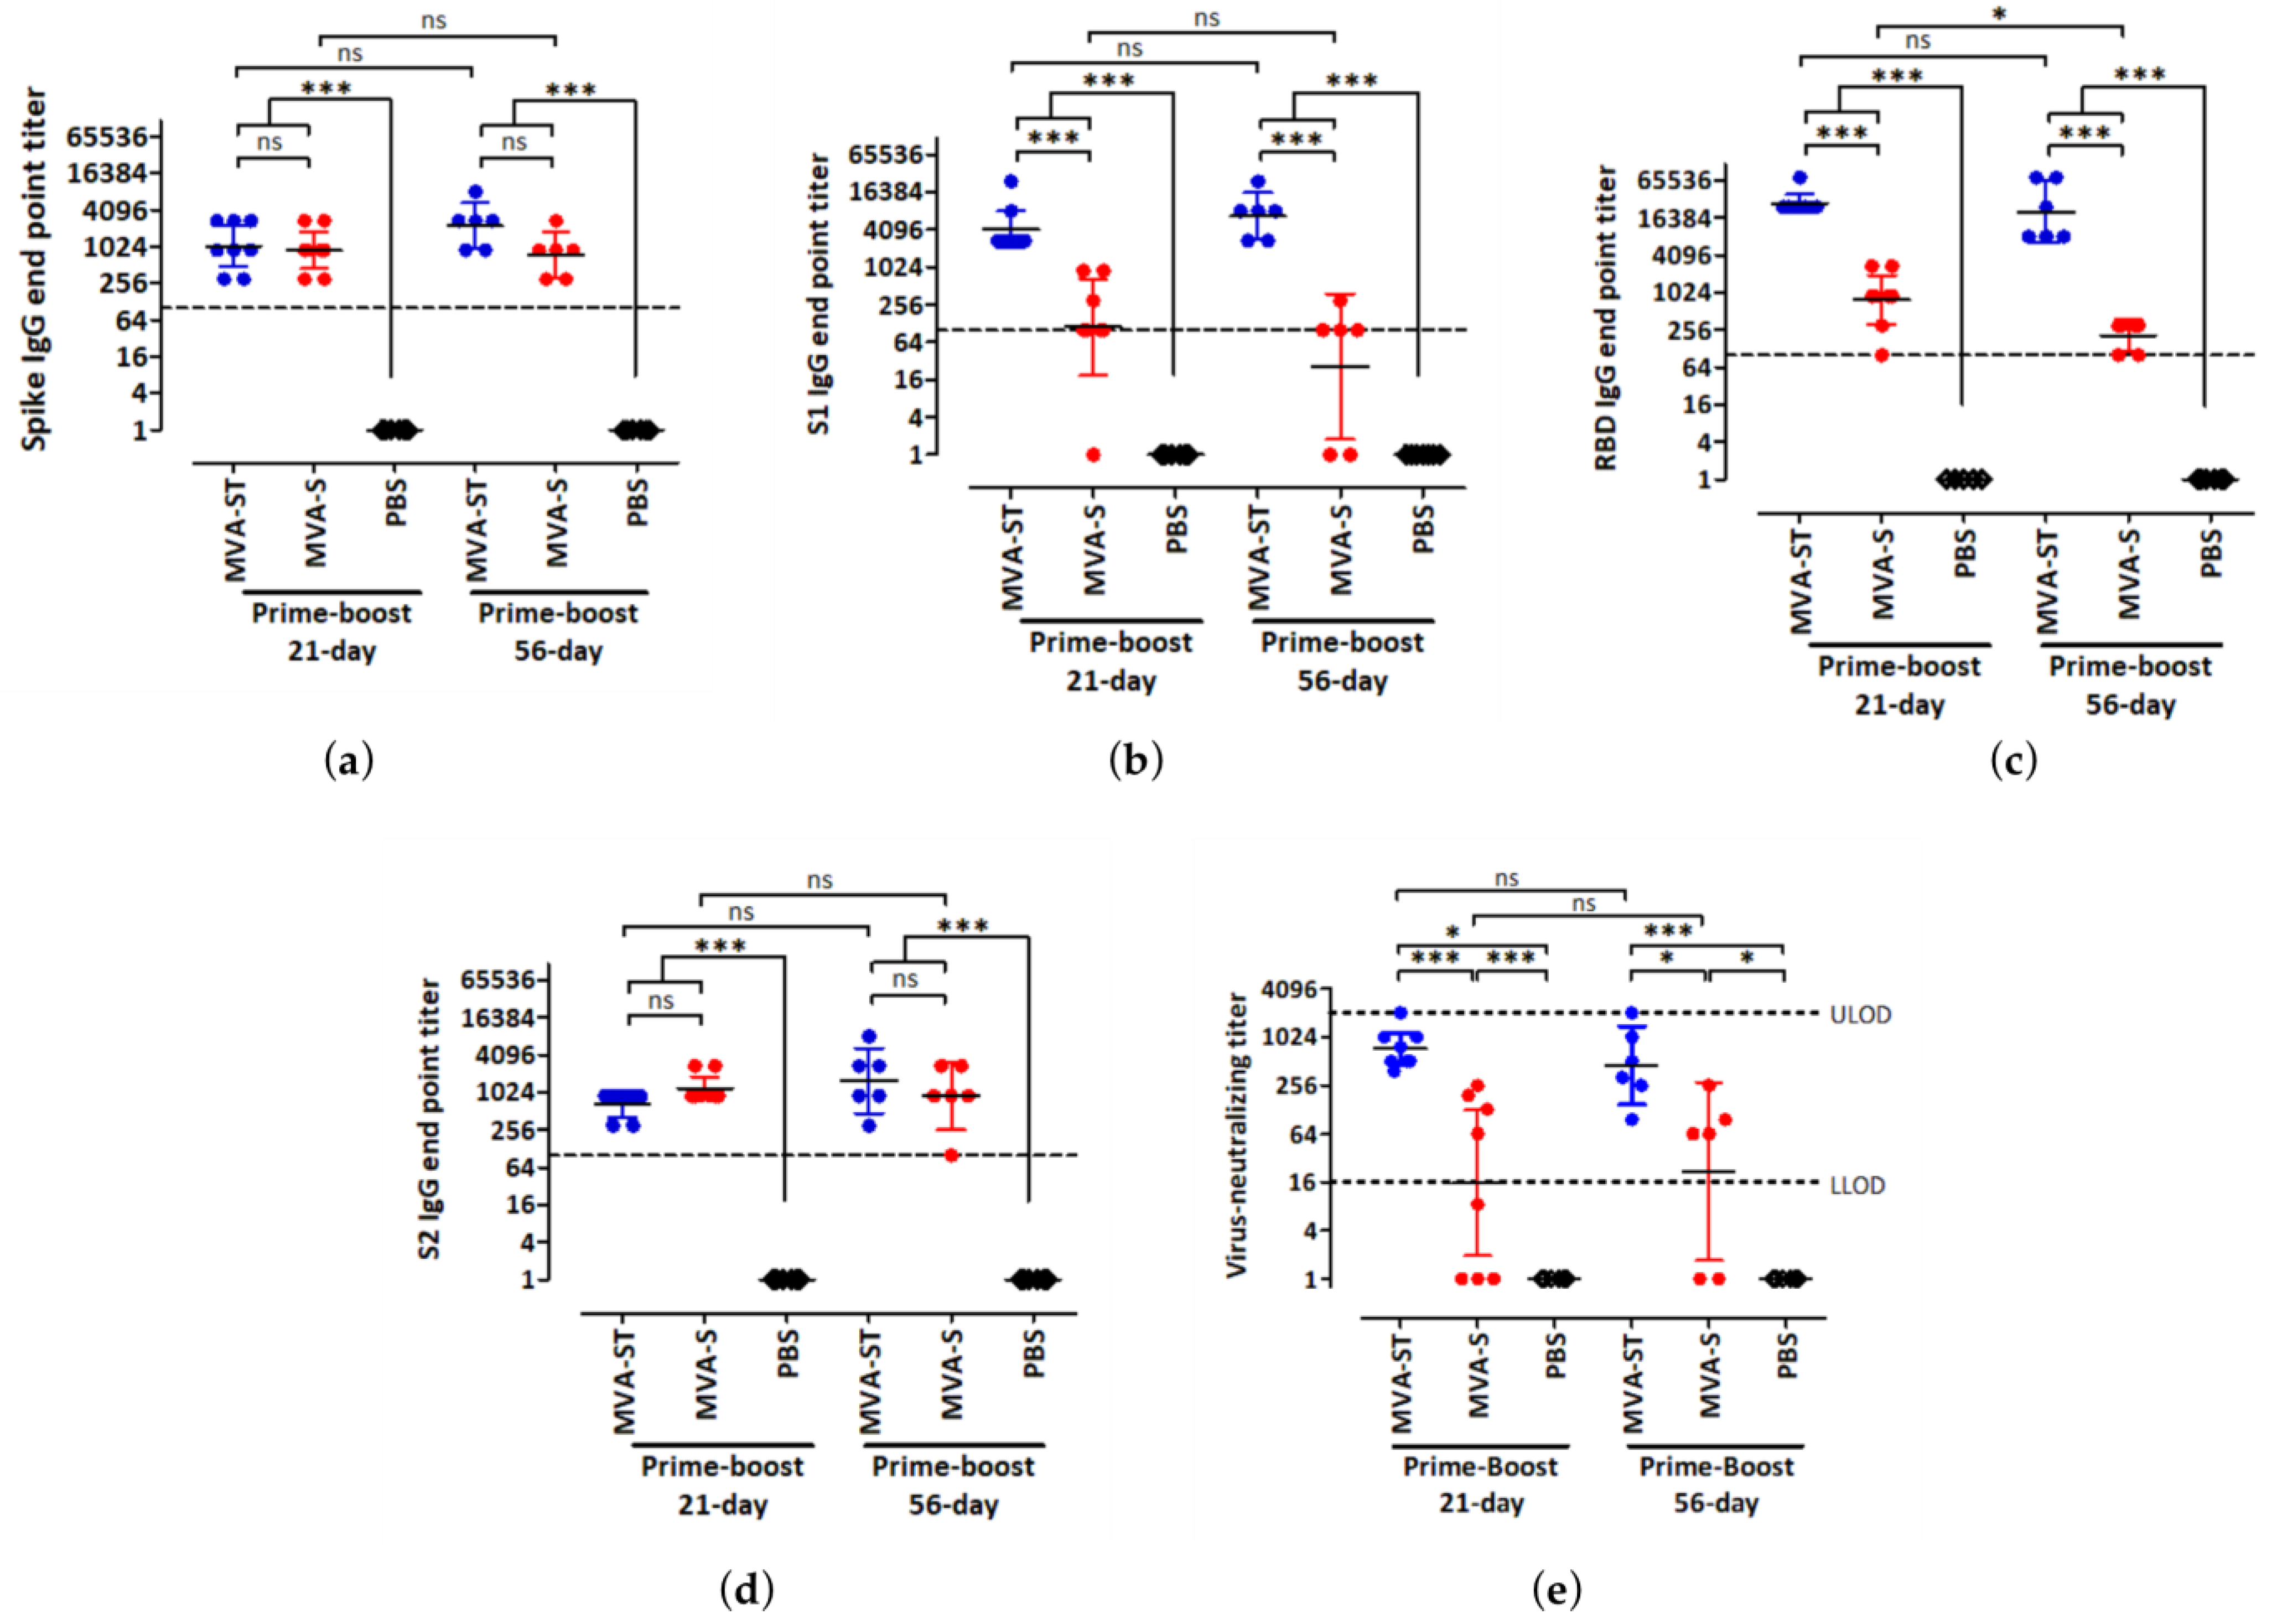
3.1. Humoral Immunity Induced by High Doses of MVA-S and MVA-ST after Short- and Long-Interval Prime-Boost Immunization Schedules
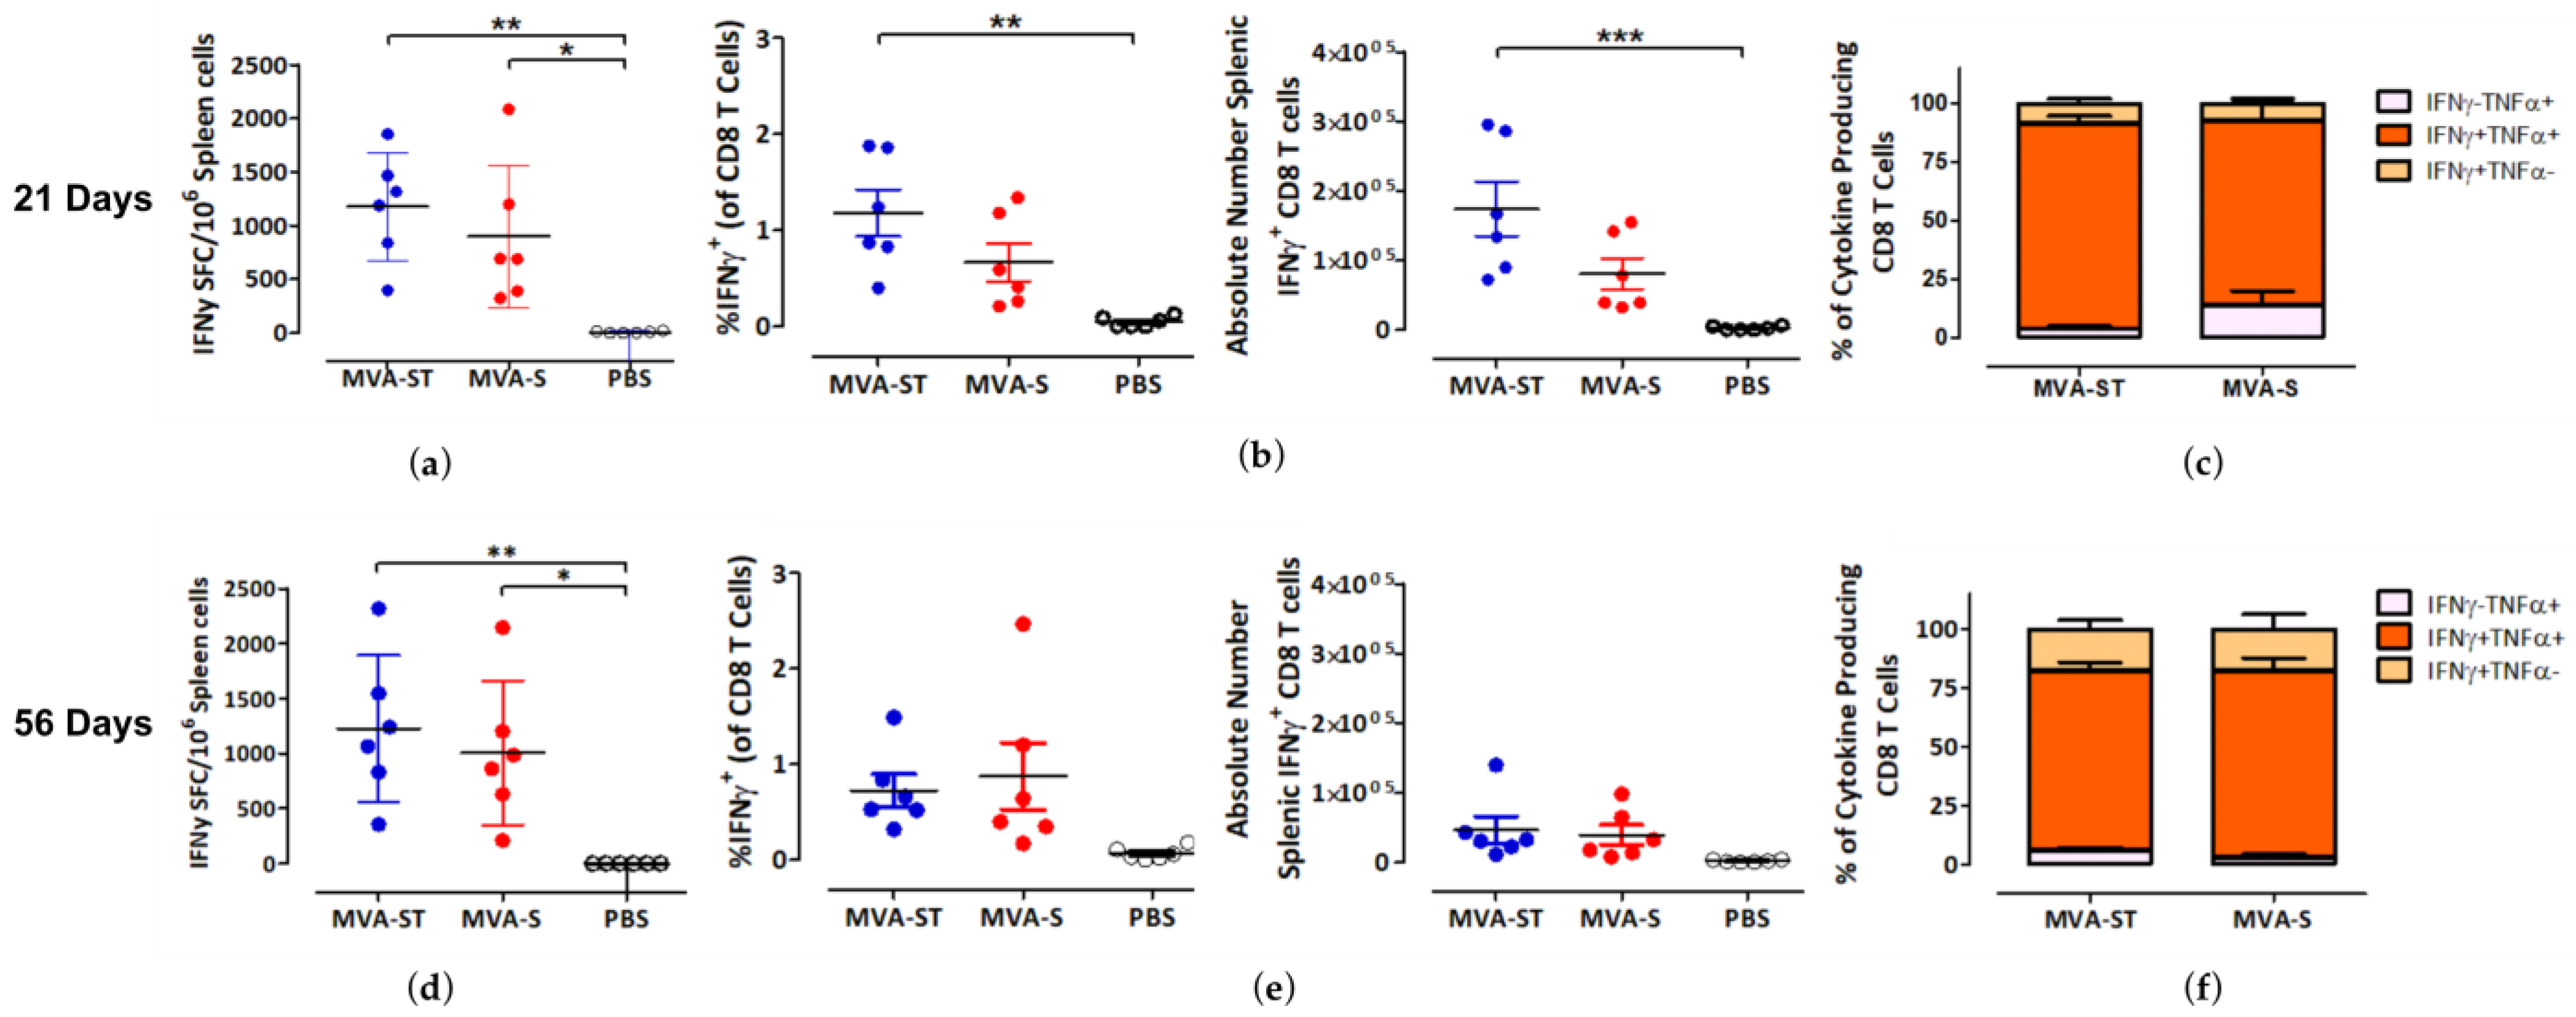
3.2. CD8 T Cell-Mediated Immunity Induced by MVA-S and MVA-ST after Short- and Long-Interval Prime-Boost Immunization Schedules
4. Discussion
Supplementary Materials
Author Contributions
Funding
Institutional Review Board Statement
Informed Consent Statement
Data Availability Statement
Acknowledgments
Conflicts of Interest
References
- Polack, F.P.; Thomas, S.J.; Kitchin, N.; Absalon, J.; Gurtman, A.; Lockhart, S.; Perez, J.L.; Pérez Marc, G.; Moreira, E.D.; Zerbini, C.; et al. Safety and Efficacy of the BNT162b2 mRNA COVID-19 Vaccine. N. Engl. J. Med. 2020, 383, 2603–2615. [Google Scholar] [CrossRef] [PubMed]
- Voysey, M.; Clemens, S.A.C.; Madhi, S.A.; Weckx, L.Y.; Folegatti, P.M.; Aley, P.K.; Angus, B.; Baillie, V.L.; Barnabas, S.L.; Bhorat, Q.E.; et al. Safety and efficacy of the ChAdOx1 nCoV-19 vaccine (AZD1222) against SARS-CoV-2: An interim analysis of four randomised controlled trials in Brazil, South Africa, and the UK. Lancet 2021, 397, 99–111. [Google Scholar] [CrossRef] [PubMed]
- Sadoff, J.; Gray, G.; Vandebosch, A.; Cárdenas, V.; Shukarev, G.; Grinsztejn, B.; Goepfert, P.A.; Truyers, C.; Fennema, H.; Spiessens, B.; et al. Safety and Efficacy of Single-Dose Ad26.COV2.S Vaccine against COVID-19. N. Engl. J. Med. 2021, 384, 2187–2201. [Google Scholar] [CrossRef] [PubMed]
- Baden, L.R.; El Sahly, H.M.; Essink, B.; Kotloff, K.; Frey, S.; Novak, R.; Diemert, D.; Spector, S.A.; Rouphael, N.; Creech, C.B.; et al. Efficacy and Safety of the mRNA-1273 SARS-CoV-2 Vaccine. N. Engl. J. Med. 2020, 384, 403–416. [Google Scholar] [CrossRef]
- Al Kaabi, N.; Zhang, Y.; Xia, S.; Yang, Y.; Al Qahtani, M.M.; Abdulrazzaq, N.; Al Nusair, M.; Hassany, M.; Jawad, J.S.; Abdalla, J.; et al. Effect of 2 Inactivated SARS-CoV-2 Vaccines on Symptomatic COVID-19 Infection in Adults: A Randomized Clinical Trial. J. Am. Med. Assoc. 2021, 326, 35–45. [Google Scholar] [CrossRef] [PubMed]
- STIKO. STIKO-Empfehlung zur COVID-19-Impfung. Epidemiol. Bull. 2021, 19. [Google Scholar]
- Rodrigues, C.M.C.; Plotkin, S.A. The influence of interval between doses on response to vaccines. Vaccine 2021, 39, 7123–7127. [Google Scholar] [CrossRef]
- Paltiel, D.A.; Zheng, A.; Schwartz, J.L. Speed Versus Efficacy: Quantifying Potential Tradeoffs in COVID-19 Vaccine Deployment. Ann. Intern. Med. 2021, 174, 568–570. [Google Scholar] [CrossRef]
- Tuite, A.R.; Zhu, L.; Fisman, D.N.; Salomon, J.A. Alternative Dose Allocation Strategies to Increase Benefits From Constrained COVID-19 Vaccine Supply. Ann. Intern. Med. 2021, 174, 570–572. [Google Scholar] [CrossRef]
- Iacobucci, G.; Mahase, E. COVID-19 vaccination: What’s the evidence for extending the dosing interval? Br. Med. J. 2021, 372, n18. [Google Scholar] [CrossRef]
- Payne, R.P.; Longet, S.; Austin, J.A.; Skelly, D.T.; Dejnirattisai, W.; Adele, S.; Meardon, N.; Faustini, S.; Al-Taei, S.; Moore, S.C.; et al. Immunogenicity of standard and extended dosing intervals of BNT162b2 mRNA vaccine. Cell 2021, 184, 5699–5714.e5611. [Google Scholar] [CrossRef] [PubMed]
- Amirthalingam, G.; Bernal, J.L.; Andrews, N.J.; Whitaker, H.; Gower, C.; Stowe, J.; Tessier, E.; Subbarao, S.; Ireland, G.; Baawuah, F.; et al. Serological responses and vaccine effectiveness for extended COVID-19 vaccine schedules in England. Nat. Commun. 2021, 12, 7217. [Google Scholar] [CrossRef] [PubMed]
- Skowronski, D.M.; Febriani, Y.; Ouakki, M.; Setayeshgar, S.; El Adam, S.; Zou, M.; Talbot, D.; Prystajecky, N.; Tyson, J.R.; Gilca, R.; et al. Two-Dose Severe Acute Respiratory Syndrome Coronavirus 2 Vaccine Effectiveness With Mixed Schedules and Extended Dosing Intervals: Test-Negative Design Studies From British Columbia and Quebec, Canada. Clin. Infect. Dis. 2022, 75, 1980–1992. [Google Scholar] [CrossRef] [PubMed]
- Volz, A.; Sutter, G. Chapter Five—Modified Vaccinia Virus Ankara: History, Value in Basic Research, and Current Perspectives for Vaccine Development. In Advances in Virus Research; Kielian, M., Mettenleiter, T.C., Roossinck, M.J., Eds.; Academic Press: Cambridge, MA, USA, 2017; Volume 97, pp. 187–243. [Google Scholar]
- Rimmelzwaan, G.F.; Sutter, G. Candidate influenza vaccines based on recombinant modified vaccinia virus Ankara. Expert Rev. Vaccines 2009, 8, 447–454. [Google Scholar] [CrossRef]
- Sutter, G.; Moss, B. Nonreplicating vaccinia vector efficiently expresses recombinant genes. Proc. Natl. Acad. Sci. USA 1992, 89, 10847–10851. [Google Scholar] [CrossRef]
- Koch, T.; Dahlke, C.; Fathi, A.; Kupke, A.; Krähling, V.; Okba, N.M.A.; Halwe, S.; Rohde, C.; Eickmann, M.; Volz, A.; et al. Safety and immunogenicity of a modified vaccinia virus Ankara vector vaccine candidate for Middle East respiratory syndrome: An open-label, phase 1 trial. Lancet Infect. Dis. 2020, 20, 827–838. [Google Scholar] [CrossRef]
- Kreijtz, J.H.C.M.; Goeijenbier, M.; Moesker, F.M.; van den Dries, L.; Goeijenbier, S.; De Gruyter, H.L.M.; Lehmann, M.H.; Mutsert, G.d.; van de Vijver, D.A.M.C.; Volz, A.; et al. Safety and immunogenicity of a modified-vaccinia-virus-Ankara-based influenza A H5N1 vaccine: A randomised, double-blind phase 1/2a clinical trial. Lancet Infect. Dis. 2014, 14, 1196–1207. [Google Scholar] [CrossRef]
- Tscherne, A.; Schwarz, J.H.; Rohde, C.; Kupke, A.; Kalodimou, G.; Limpinsel, L.; Okba, N.M.A.; Bošnjak, B.; Sandrock, I.; Odak, I.; et al. Immunogenicity and efficacy of the COVID-19 candidate vector vaccine MVA-SARS-2-S in preclinical vaccination. Proc. Natl. Acad. Sci. USA 2021, 118, e2026207118. [Google Scholar] [CrossRef]
- Meyer zu Natrup, C.; Tscherne, A.; Dahlke, C.; Ciurkiewicz, M.; Shin, D.-L.; Fathi, A.; Rohde, C.; Kalodimou, G.; Halwe, S.; Limpinsel, L.; et al. Stabilized recombinant SARS-CoV-2 spike antigen enhances vaccine immunogenicity and protective capacity. J. Clin. Investig. 2022, 132, e159895. [Google Scholar] [CrossRef]
- Wilson, I.A.; Niman, H.L.; Houghten, R.A.; Cherenson, A.R.; Connolly, M.L.; Lerner, R.A. The structure of an antigenic determinant in a protein. Cell 1984, 37, 767–778. [Google Scholar] [CrossRef]
- Wyatt, L.S.; Shors, S.T.; Murphy, B.R.; Moss, B. Development of a replication-deficient recombinant vaccinia virus vaccine effective against parainfluenza virus 3 infection in an animal model. Vaccine 1996, 14, 1451–1458. [Google Scholar] [CrossRef] [PubMed]
- Kremer, M.; Volz, A.; Kreijtz, J.H.C.M.; Fux, R.; Lehmann, M.H.; Sutter, G. Easy and Efficient Protocols for Working with Recombinant Vaccinia Virus MVA. In Vaccinia Virus and Poxvirology: Methods and Protocols; Isaacs, S.N., Ed.; Humana Press: Totowa, NJ, USA, 2012; pp. 59–92. [Google Scholar]
- Kalodimou, G.; Veit, S.; Jany, S.; Kalinke, U.; Broder, C.C.; Sutter, G.; Volz, A. A Soluble Version of Nipah Virus Glycoprotein G Delivered by Vaccinia Virus MVA Activates Specific CD8 and CD4 T Cells in Mice. Viruses 2020, 12, 26. [Google Scholar] [CrossRef]
- Kreer, C.; Zehner, M.; Weber, T.; Ercanoglu, M.S.; Gieselmann, L.; Rohde, C.; Halwe, S.; Korenkov, M.; Schommers, P.; Vanshylla, K.; et al. Longitudinal Isolation of Potent Near-Germline SARS-CoV-2-Neutralizing Antibodies from COVID-19 Patients. Cell 2020, 182, 843–854.e812. [Google Scholar] [CrossRef]
- Veit, S.; Jany, S.; Fux, R.; Sutter, G.; Volz, A. CD8+ T Cells Responding to the Middle East Respiratory Syndrome Coronavirus Nucleocapsid Protein Delivered by Vaccinia Virus MVA in Mice. Viruses 2018, 10, 718. [Google Scholar] [CrossRef] [PubMed]
- Tscharke, D.C.; Woo, W.-P.; Sakala, I.G.; Sidney, J.; Sette, A.; Moss, D.J.; Bennink, J.R.; Karupiah, G.; Yewdell, J.W. Poxvirus CD8+ T-Cell Determinants and Cross-Reactivity in BALB/c Mice. J. Virol. 2006, 80, 6318–6323. [Google Scholar] [CrossRef]
- Pitisuttithum, P.; Nitayaphan, S.; Chariyalertsak, S.; Kaewkungwal, J.; Dawson, P.; Dhitavat, J.; Phonrat, B.; Akapirat, S.; Karasavvas, N.; Wieczorek, L.; et al. Late boosting of the RV144 regimen with AIDSVAX B/E and ALVAC-HIV in HIV-uninfected Thai volunteers: A double-blind, randomised controlled trial. Lancet HIV 2020, 7, e238–e248. [Google Scholar] [CrossRef] [PubMed]
- Palgen, J.-L.; Tchitchek, N.; Rodriguez-Pozo, A.; Jouhault, Q.; Abdelhouahab, H.; Dereuddre-Bosquet, N.; Contreras, V.; Martinon, F.; Cosma, A.; Lévy, Y.; et al. Innate and secondary humoral responses are improved by increasing the time between MVA vaccine immunizations. NPJ Vaccines 2020, 5, 24. [Google Scholar] [CrossRef] [PubMed]
- Jackson, L.A.; Frey, S.E.; El Sahly, H.M.; Mulligan, M.J.; Winokur, P.L.; Kotloff, K.L.; Campbell, J.D.; Atmar, R.L.; Graham, I.; Anderson, E.J.; et al. Safety and immunogenicity of a modified vaccinia Ankara vaccine using three immunization schedules and two modes of delivery: A randomized clinical non-inferiority trial. Vaccine 2017, 35, 1675–1682. [Google Scholar] [CrossRef]
- Pettini, E.; Pastore, G.; Fiorino, F.; Medaglini, D.; Ciabattini, A. Short or Long Interval between Priming and Boosting: Does It Impact on the Vaccine Immunogenicity? Vaccines 2021, 9, 289. [Google Scholar] [CrossRef]
- Nicolas, A.; Sannier, G.; Dubé, M.; Nayrac, M.; Tauzin, A.; Painter, M.M.; Goel, R.R.; Laporte, M.; Gendron-Lepage, G.; Medjahed, H.; et al. An extended SARS-CoV-2 mRNA vaccine prime-boost interval enhances B cell immunity with limited impact on T cells. iScience 2023, 26, 105904. [Google Scholar] [CrossRef]
- Pedersen, G.K.; Wørzner, K.; Andersen, P.; Christensen, D. Vaccine Adjuvants Differentially Affect Kinetics of Antibody and Germinal Center Responses. Front. Immunol. 2020, 11, 579761. [Google Scholar] [CrossRef] [PubMed]
- Wang, C.; Hart, M.; Chui, C.; Ajuogu, A.; Brian, I.J.; de Cassan, S.C.; Borrow, P.; Draper, S.J.; Douglas, A.D. Germinal Center B Cell and T Follicular Helper Cell Responses to Viral Vector and Protein-in-Adjuvant Vaccines. J. Immunol. 2016, 197, 1242–1251. [Google Scholar] [CrossRef]
- Lederer, K.; Castaño, D.; Gómez Atria, D.; Oguin, T.H.; Wang, S.; Manzoni, T.B.; Muramatsu, H.; Hogan, M.J.; Amanat, F.; Cherubin, P.; et al. SARS-CoV-2 mRNA Vaccines Foster Potent Antigen-Specific Germinal Center Responses Associated with Neutralizing Antibody Generation. Immunity 2020, 53, 1281–1295.e1285. [Google Scholar] [CrossRef] [PubMed]
- Voysey, M.; Costa Clemens, S.A.; Madhi, S.A.; Weckx, L.Y.; Folegatti, P.M.; Aley, P.K.; Angus, B.; Baillie, V.L.; Barnabas, S.L.; Bhorat, Q.E.; et al. Single-dose administration and the influence of the timing of the booster dose on immunogenicity and efficacy of ChAdOx1 nCoV-19 (AZD1222) vaccine: A pooled analysis of four randomised trials. Lancet 2021, 397, 881–891. [Google Scholar] [CrossRef] [PubMed]
- Knudsen, M.L.; Ljungberg, K.; Kakoulidou, M.; Kostic, L.; Hallengärd, D.; García-Arriaza, J.; Merits, A.; Esteban, M.; Liljeström, P.; Perlman, S. Kinetic and Phenotypic Analysis of CD8+ T Cell Responses after Priming with Alphavirus Replicons and Homologous or Heterologous Booster Immunizations. J. Virol. 2014, 88, 12438–12451. [Google Scholar] [CrossRef]
- Miller, J.D.; van der Most, R.G.; Akondy, R.S.; Glidewell, J.T.; Albott, S.; Masopust, D.; Murali-Krishna, K.; Mahar, P.L.; Edupuganti, S.; Lalor, S.; et al. Human Effector and Memory CD8+ T Cell Responses to Smallpox and Yellow Fever Vaccines. Immunity 2008, 28, 710–722. [Google Scholar] [CrossRef]
- Bruña-Romero, O.; González-Aseguinolaza, G.; Hafalla, J.C.R.; Tsuji, M.; Nussenzweig, R.S. Complete, long-lasting protection against malaria of mice primed and boosted with two distinct viral vectors expressing the same plasmodial antigen. Proc. Natl. Acad. Sci. USA 2001, 98, 11491–11496. [Google Scholar] [CrossRef]


Disclaimer/Publisher’s Note: The statements, opinions and data contained in all publications are solely those of the individual author(s) and contributor(s) and not of MDPI and/or the editor(s). MDPI and/or the editor(s) disclaim responsibility for any injury to people or property resulting from any ideas, methods, instructions or products referred to in the content. |
© 2023 by the authors. Licensee MDPI, Basel, Switzerland. This article is an open access article distributed under the terms and conditions of the Creative Commons Attribution (CC BY) license (https://creativecommons.org/licenses/by/4.0/).
Share and Cite
Kalodimou, G.; Jany, S.; Freudenstein, A.; Schwarz, J.H.; Limpinsel, L.; Rohde, C.; Kupke, A.; Becker, S.; Volz, A.; Tscherne, A.; et al. Short- and Long-Interval Prime-Boost Vaccination with the Candidate Vaccines MVA-SARS-2-ST and MVA-SARS-2-S Induces Comparable Humoral and Cell-Mediated Immunity in Mice. Viruses 2023, 15, 1180. https://doi.org/10.3390/v15051180
Kalodimou G, Jany S, Freudenstein A, Schwarz JH, Limpinsel L, Rohde C, Kupke A, Becker S, Volz A, Tscherne A, et al. Short- and Long-Interval Prime-Boost Vaccination with the Candidate Vaccines MVA-SARS-2-ST and MVA-SARS-2-S Induces Comparable Humoral and Cell-Mediated Immunity in Mice. Viruses. 2023; 15(5):1180. https://doi.org/10.3390/v15051180
Chicago/Turabian StyleKalodimou, Georgia, Sylvia Jany, Astrid Freudenstein, Jan Hendrik Schwarz, Leonard Limpinsel, Cornelius Rohde, Alexandra Kupke, Stephan Becker, Asisa Volz, Alina Tscherne, and et al. 2023. "Short- and Long-Interval Prime-Boost Vaccination with the Candidate Vaccines MVA-SARS-2-ST and MVA-SARS-2-S Induces Comparable Humoral and Cell-Mediated Immunity in Mice" Viruses 15, no. 5: 1180. https://doi.org/10.3390/v15051180
APA StyleKalodimou, G., Jany, S., Freudenstein, A., Schwarz, J. H., Limpinsel, L., Rohde, C., Kupke, A., Becker, S., Volz, A., Tscherne, A., & Sutter, G. (2023). Short- and Long-Interval Prime-Boost Vaccination with the Candidate Vaccines MVA-SARS-2-ST and MVA-SARS-2-S Induces Comparable Humoral and Cell-Mediated Immunity in Mice. Viruses, 15(5), 1180. https://doi.org/10.3390/v15051180