

Comparison of PB1-F2 Proximity Interactomes Reveals Functional Differences between a Human and an Avian Influenza Virus

 and
and 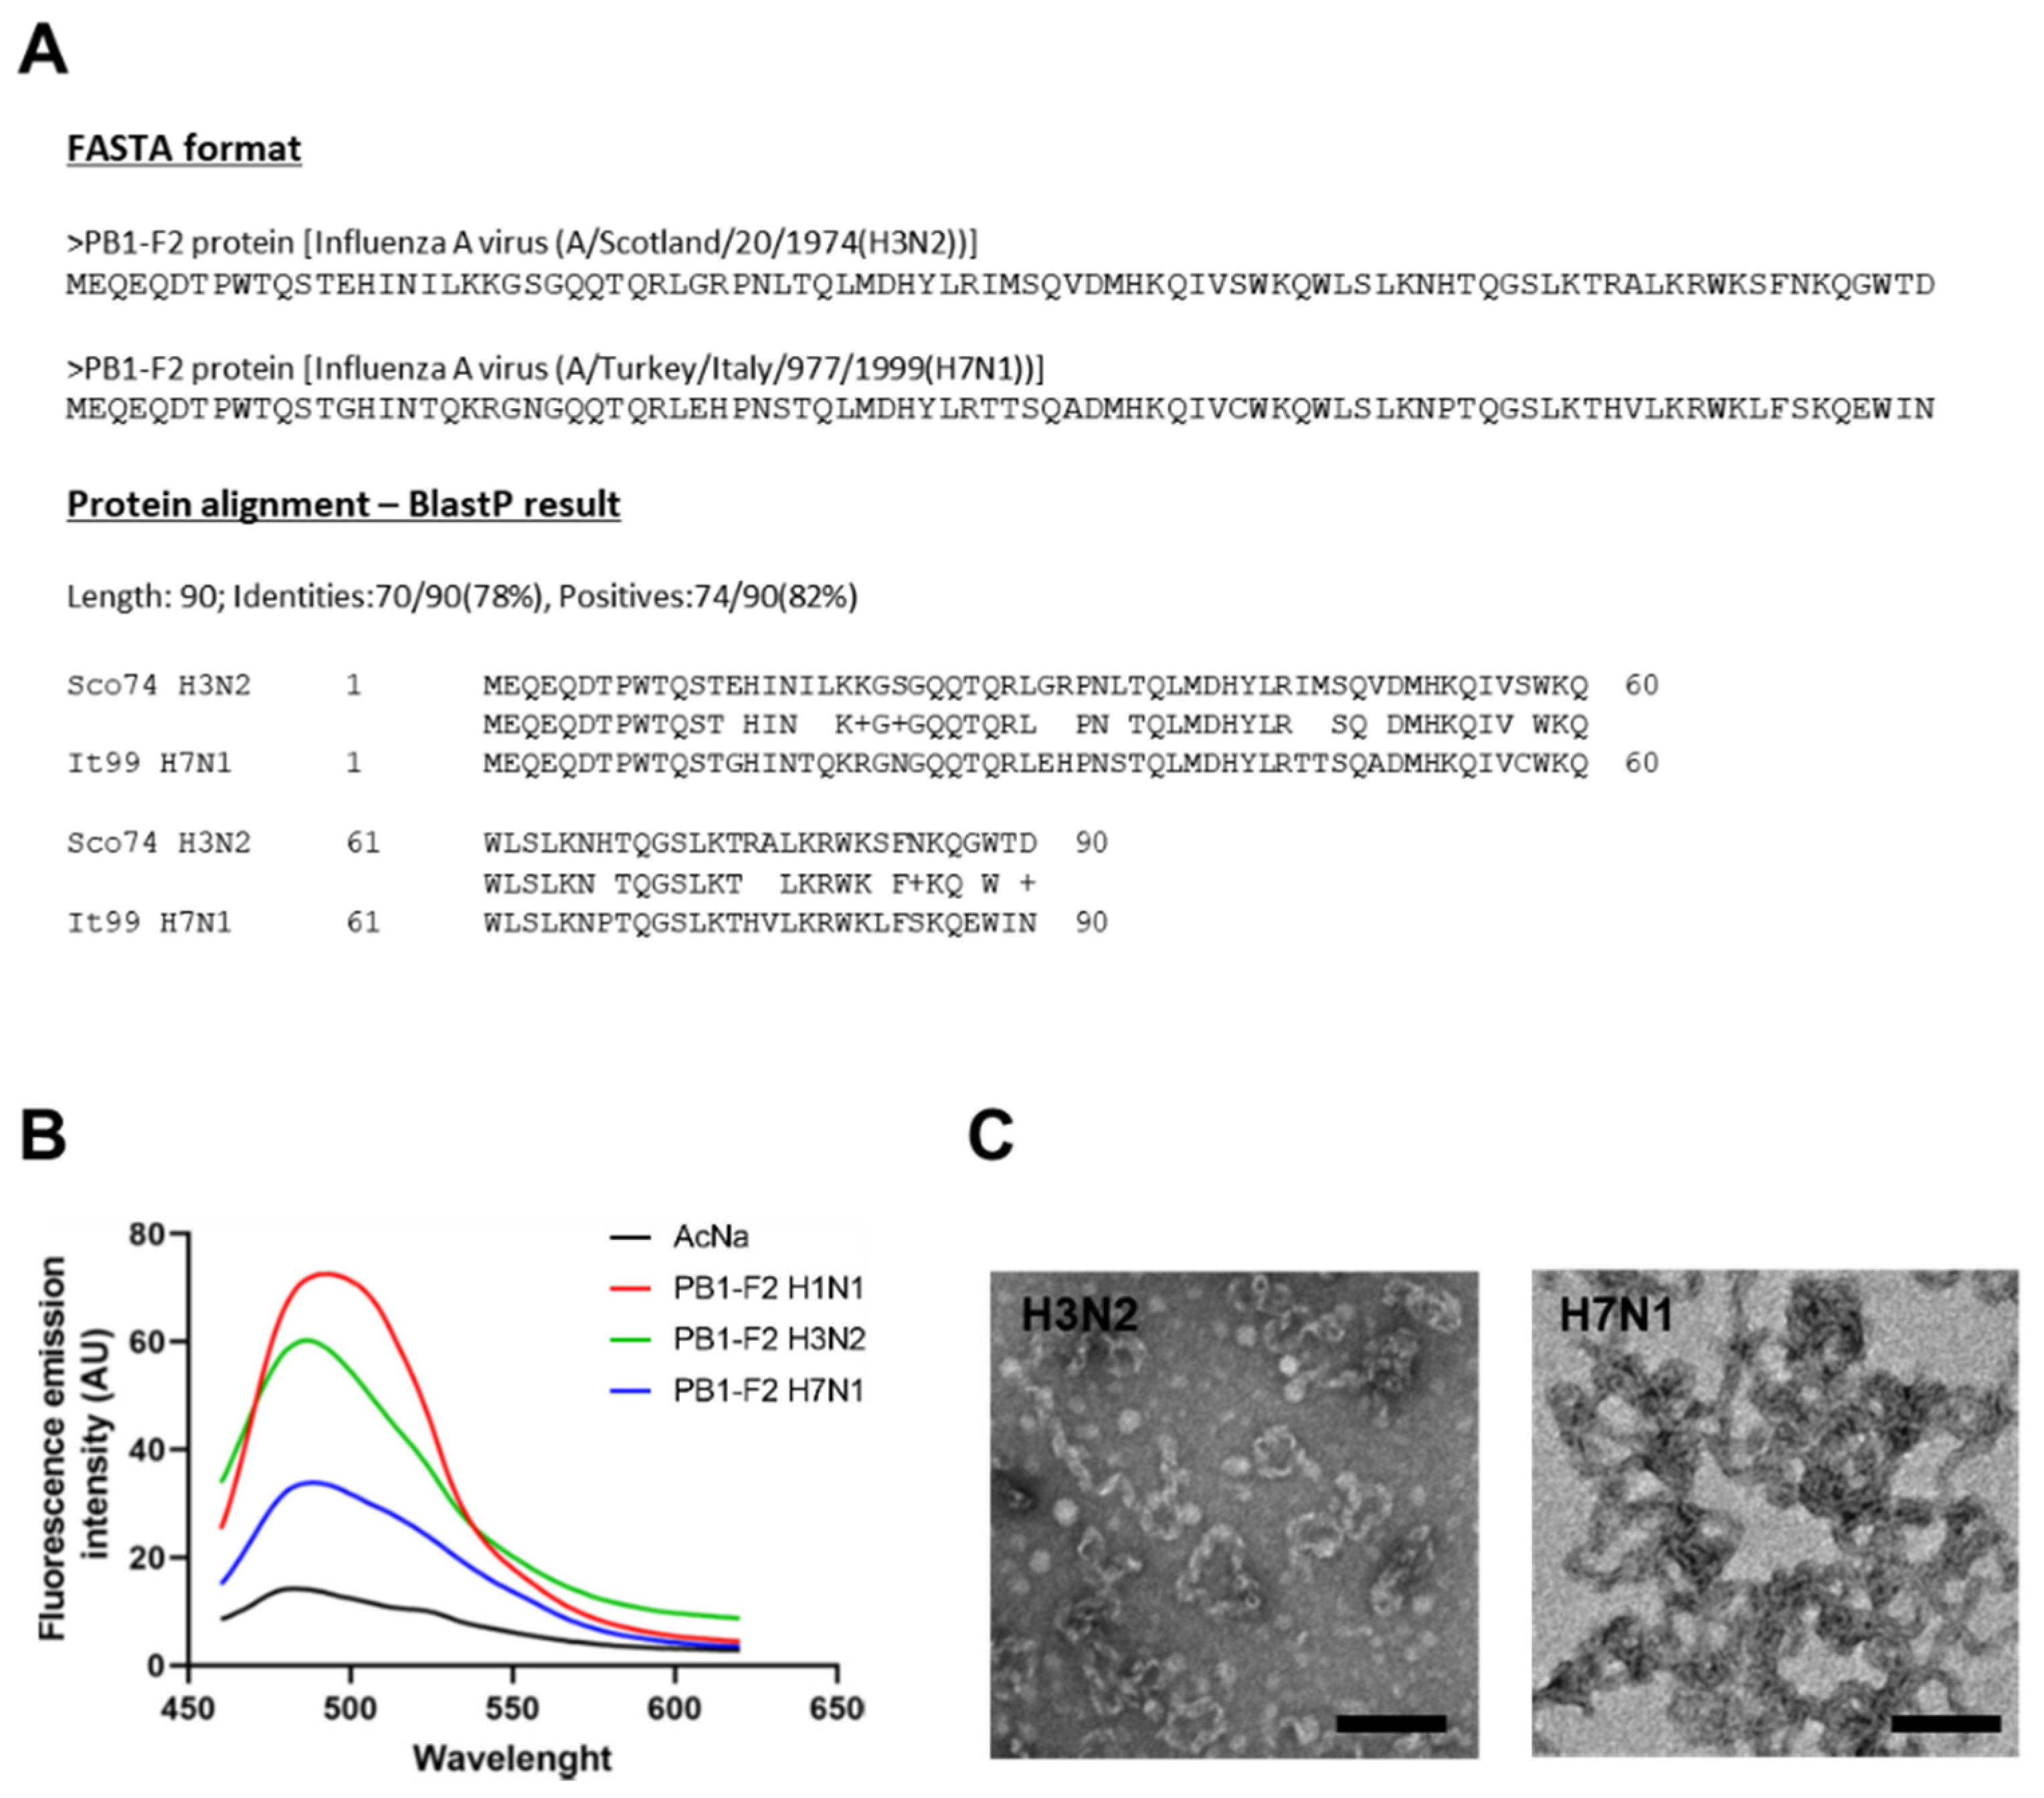
Abstract
1. Introduction
2. Materials and Methods
2.1. Purification of Recombinant PB1-F2 and Fibrillation Assays
2.2. Thioflavin T Fluorescence Measurements
2.3. Electronic Microscopy
2.4. Cell Culture
2.5. BioID2 Pull Down
2.6. Immunofluorescence
2.7. Western Blot Analysis
2.8. Coimmunoprecipitation Assays
3. Results
3.1. Fibrillation Capacities of PB1-F2
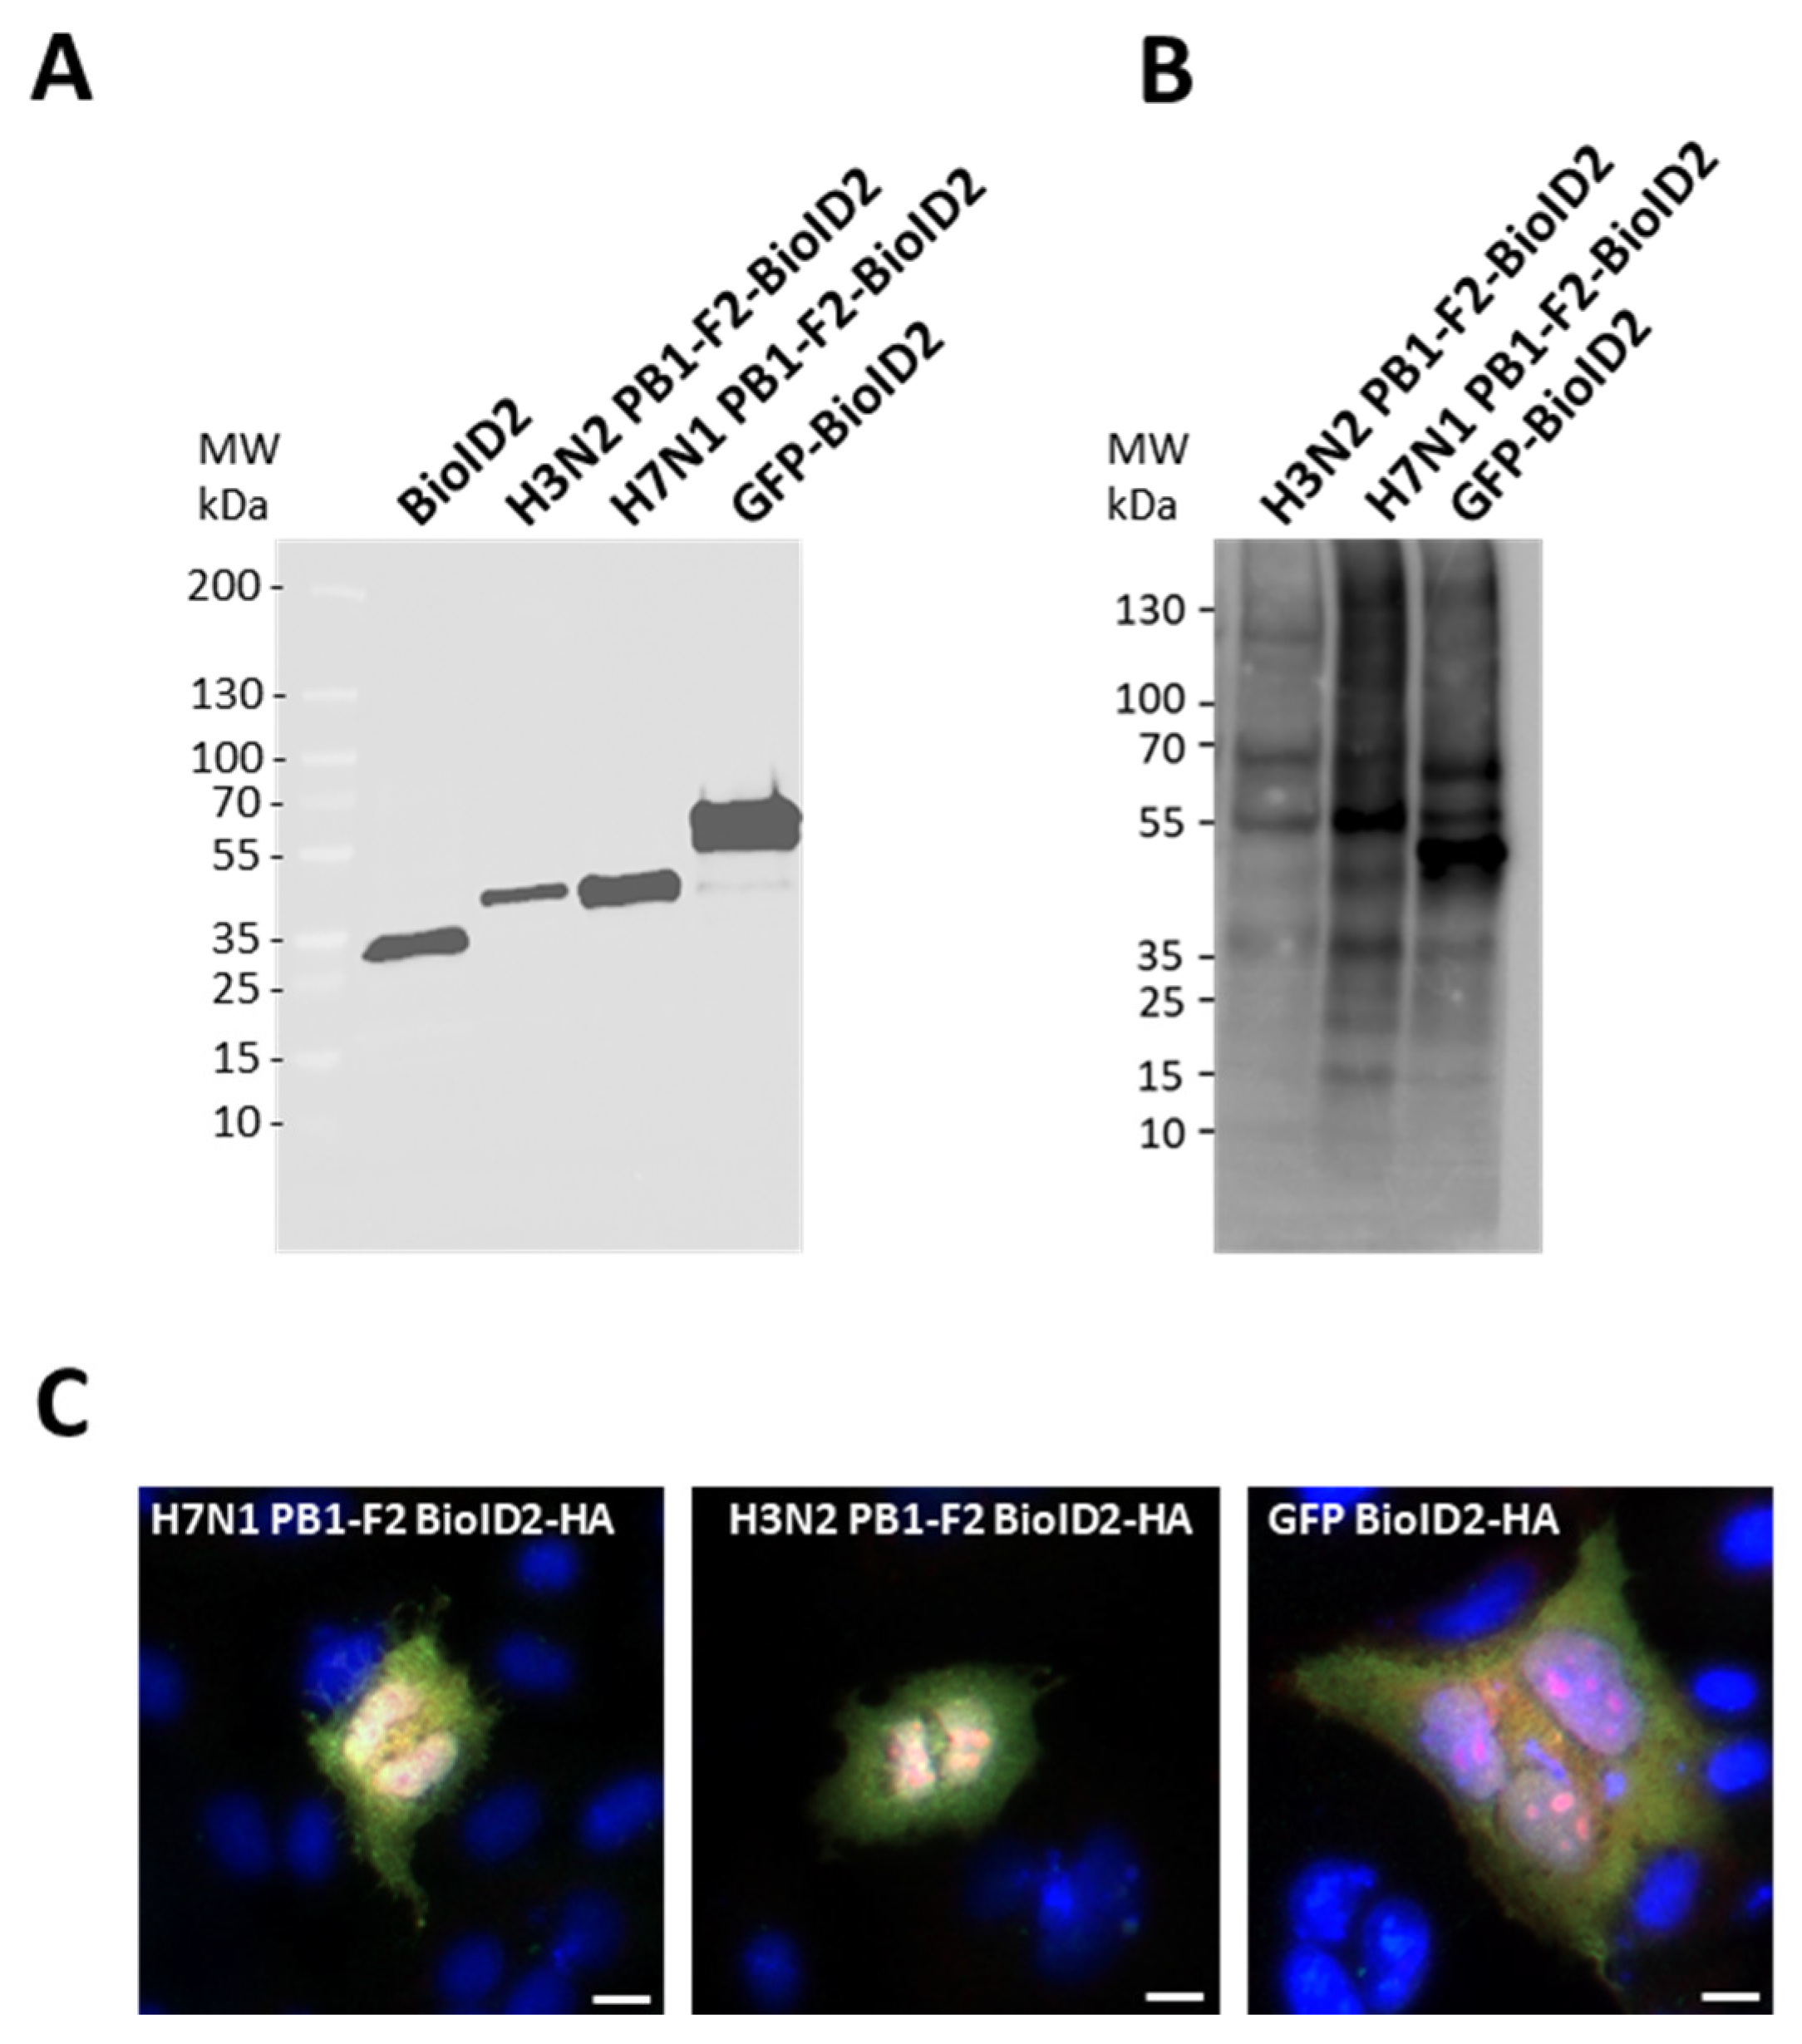
3.2. Expression of BioID2-Tagged PB1-F2
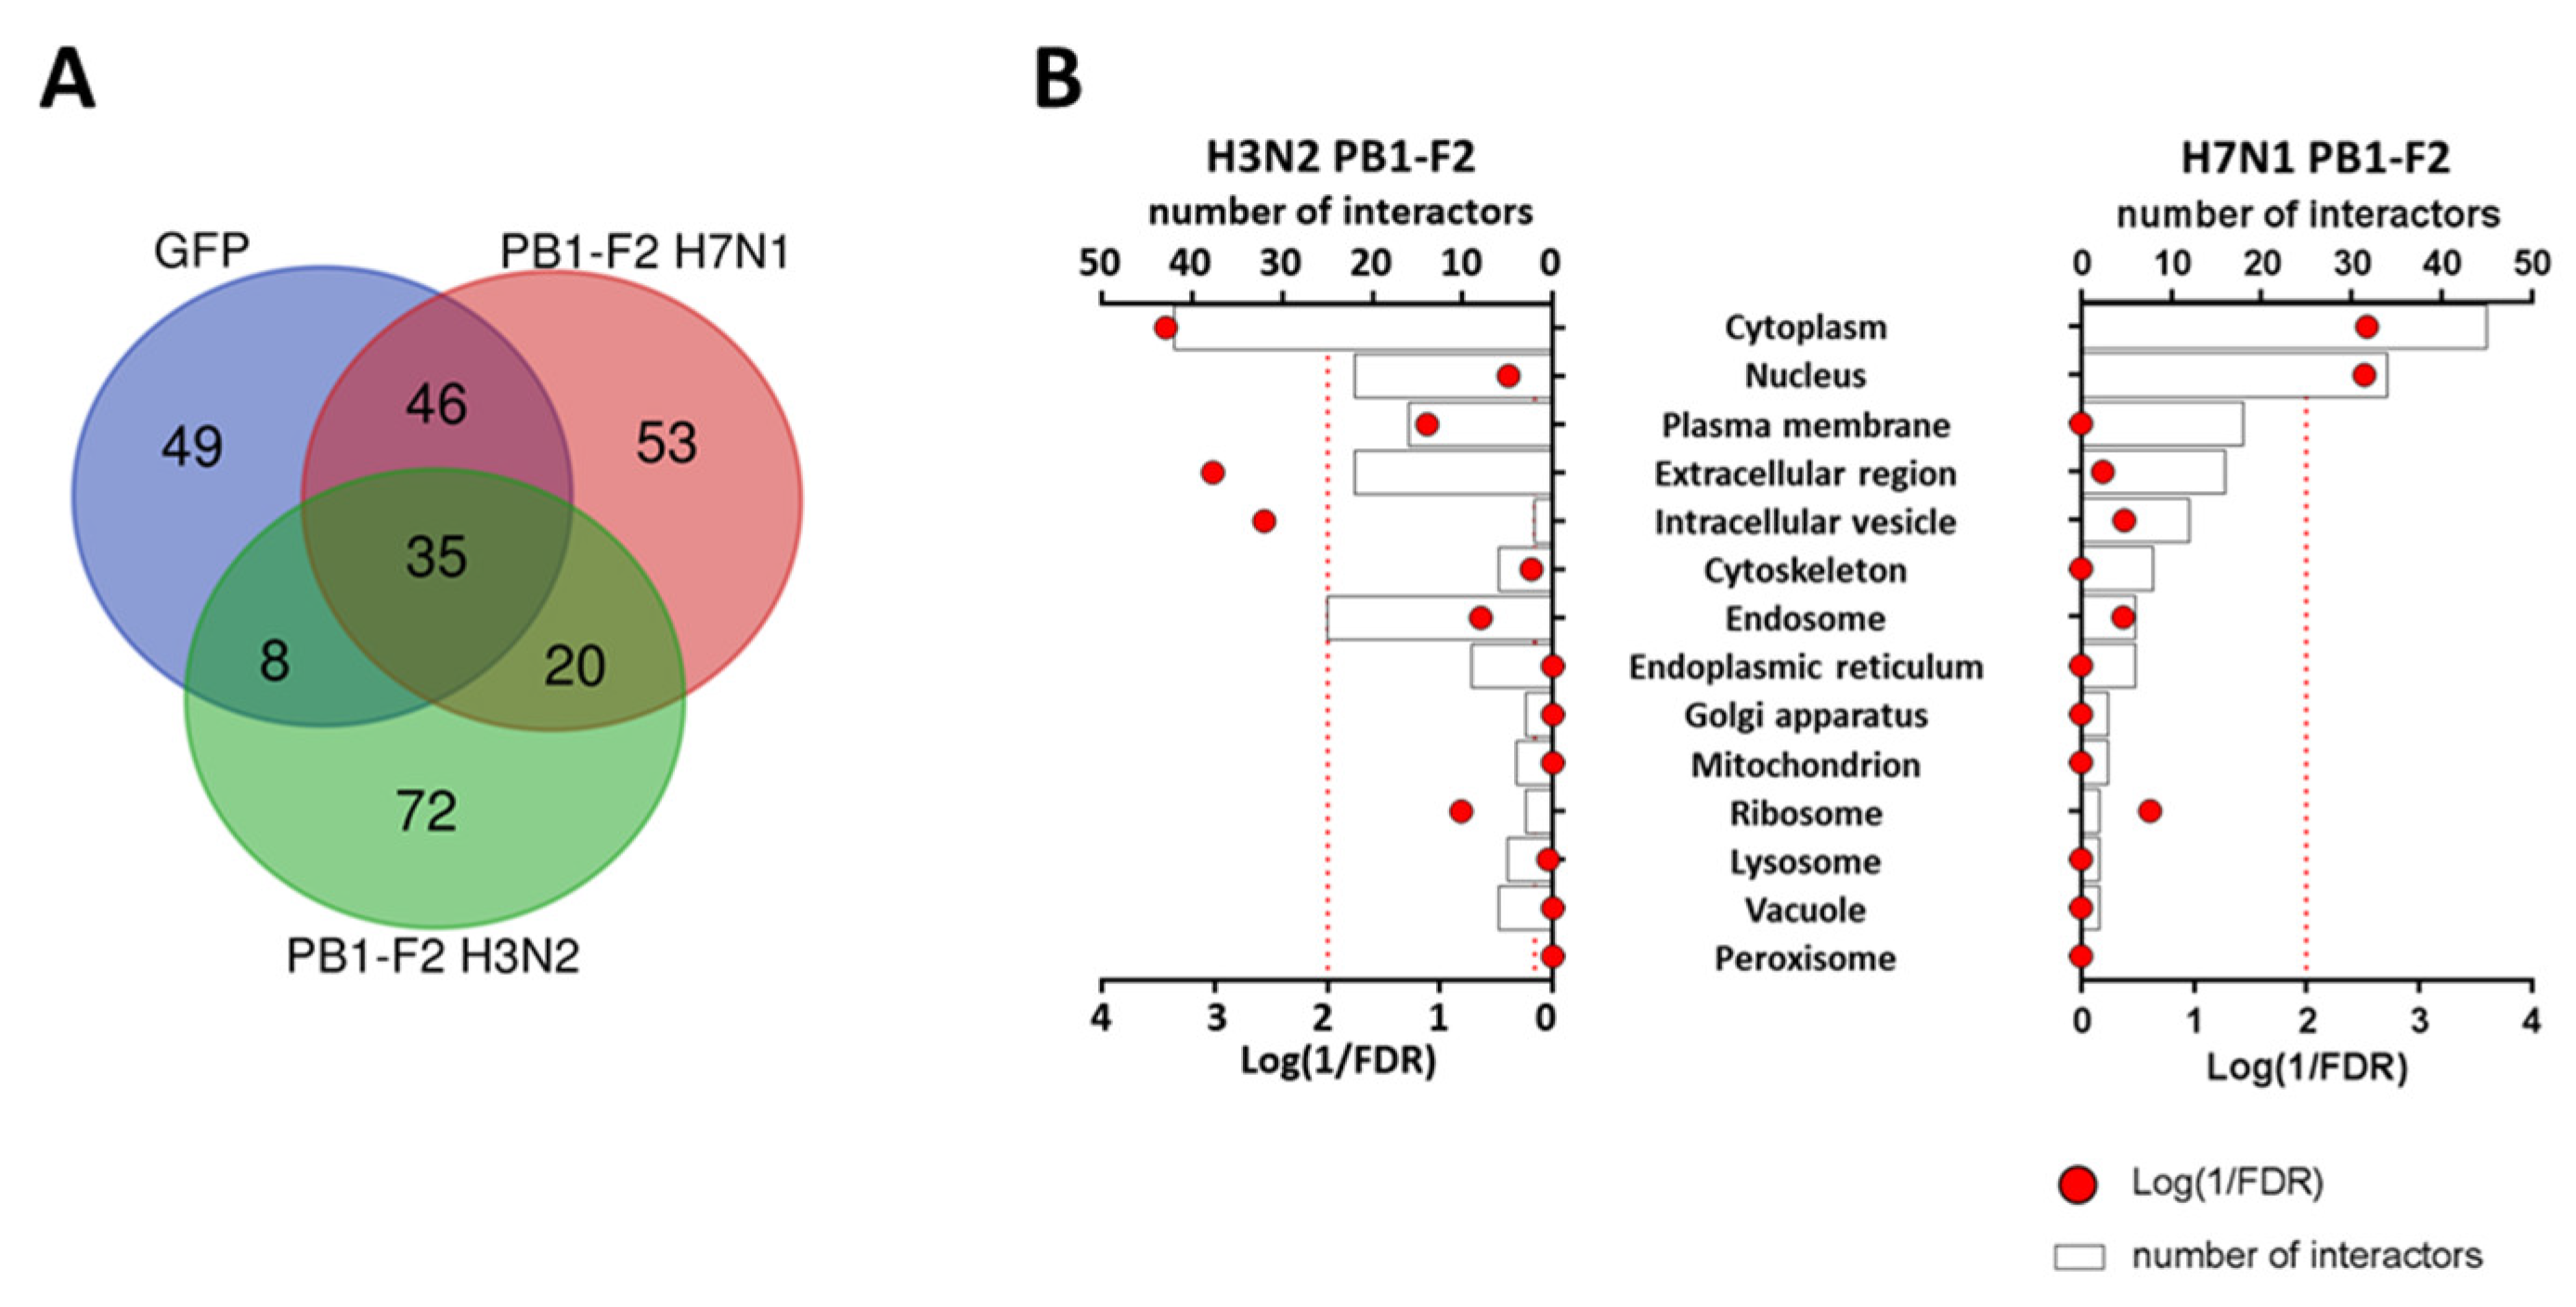
3.3. PB1-F2 Proximity Interactomes Comparison
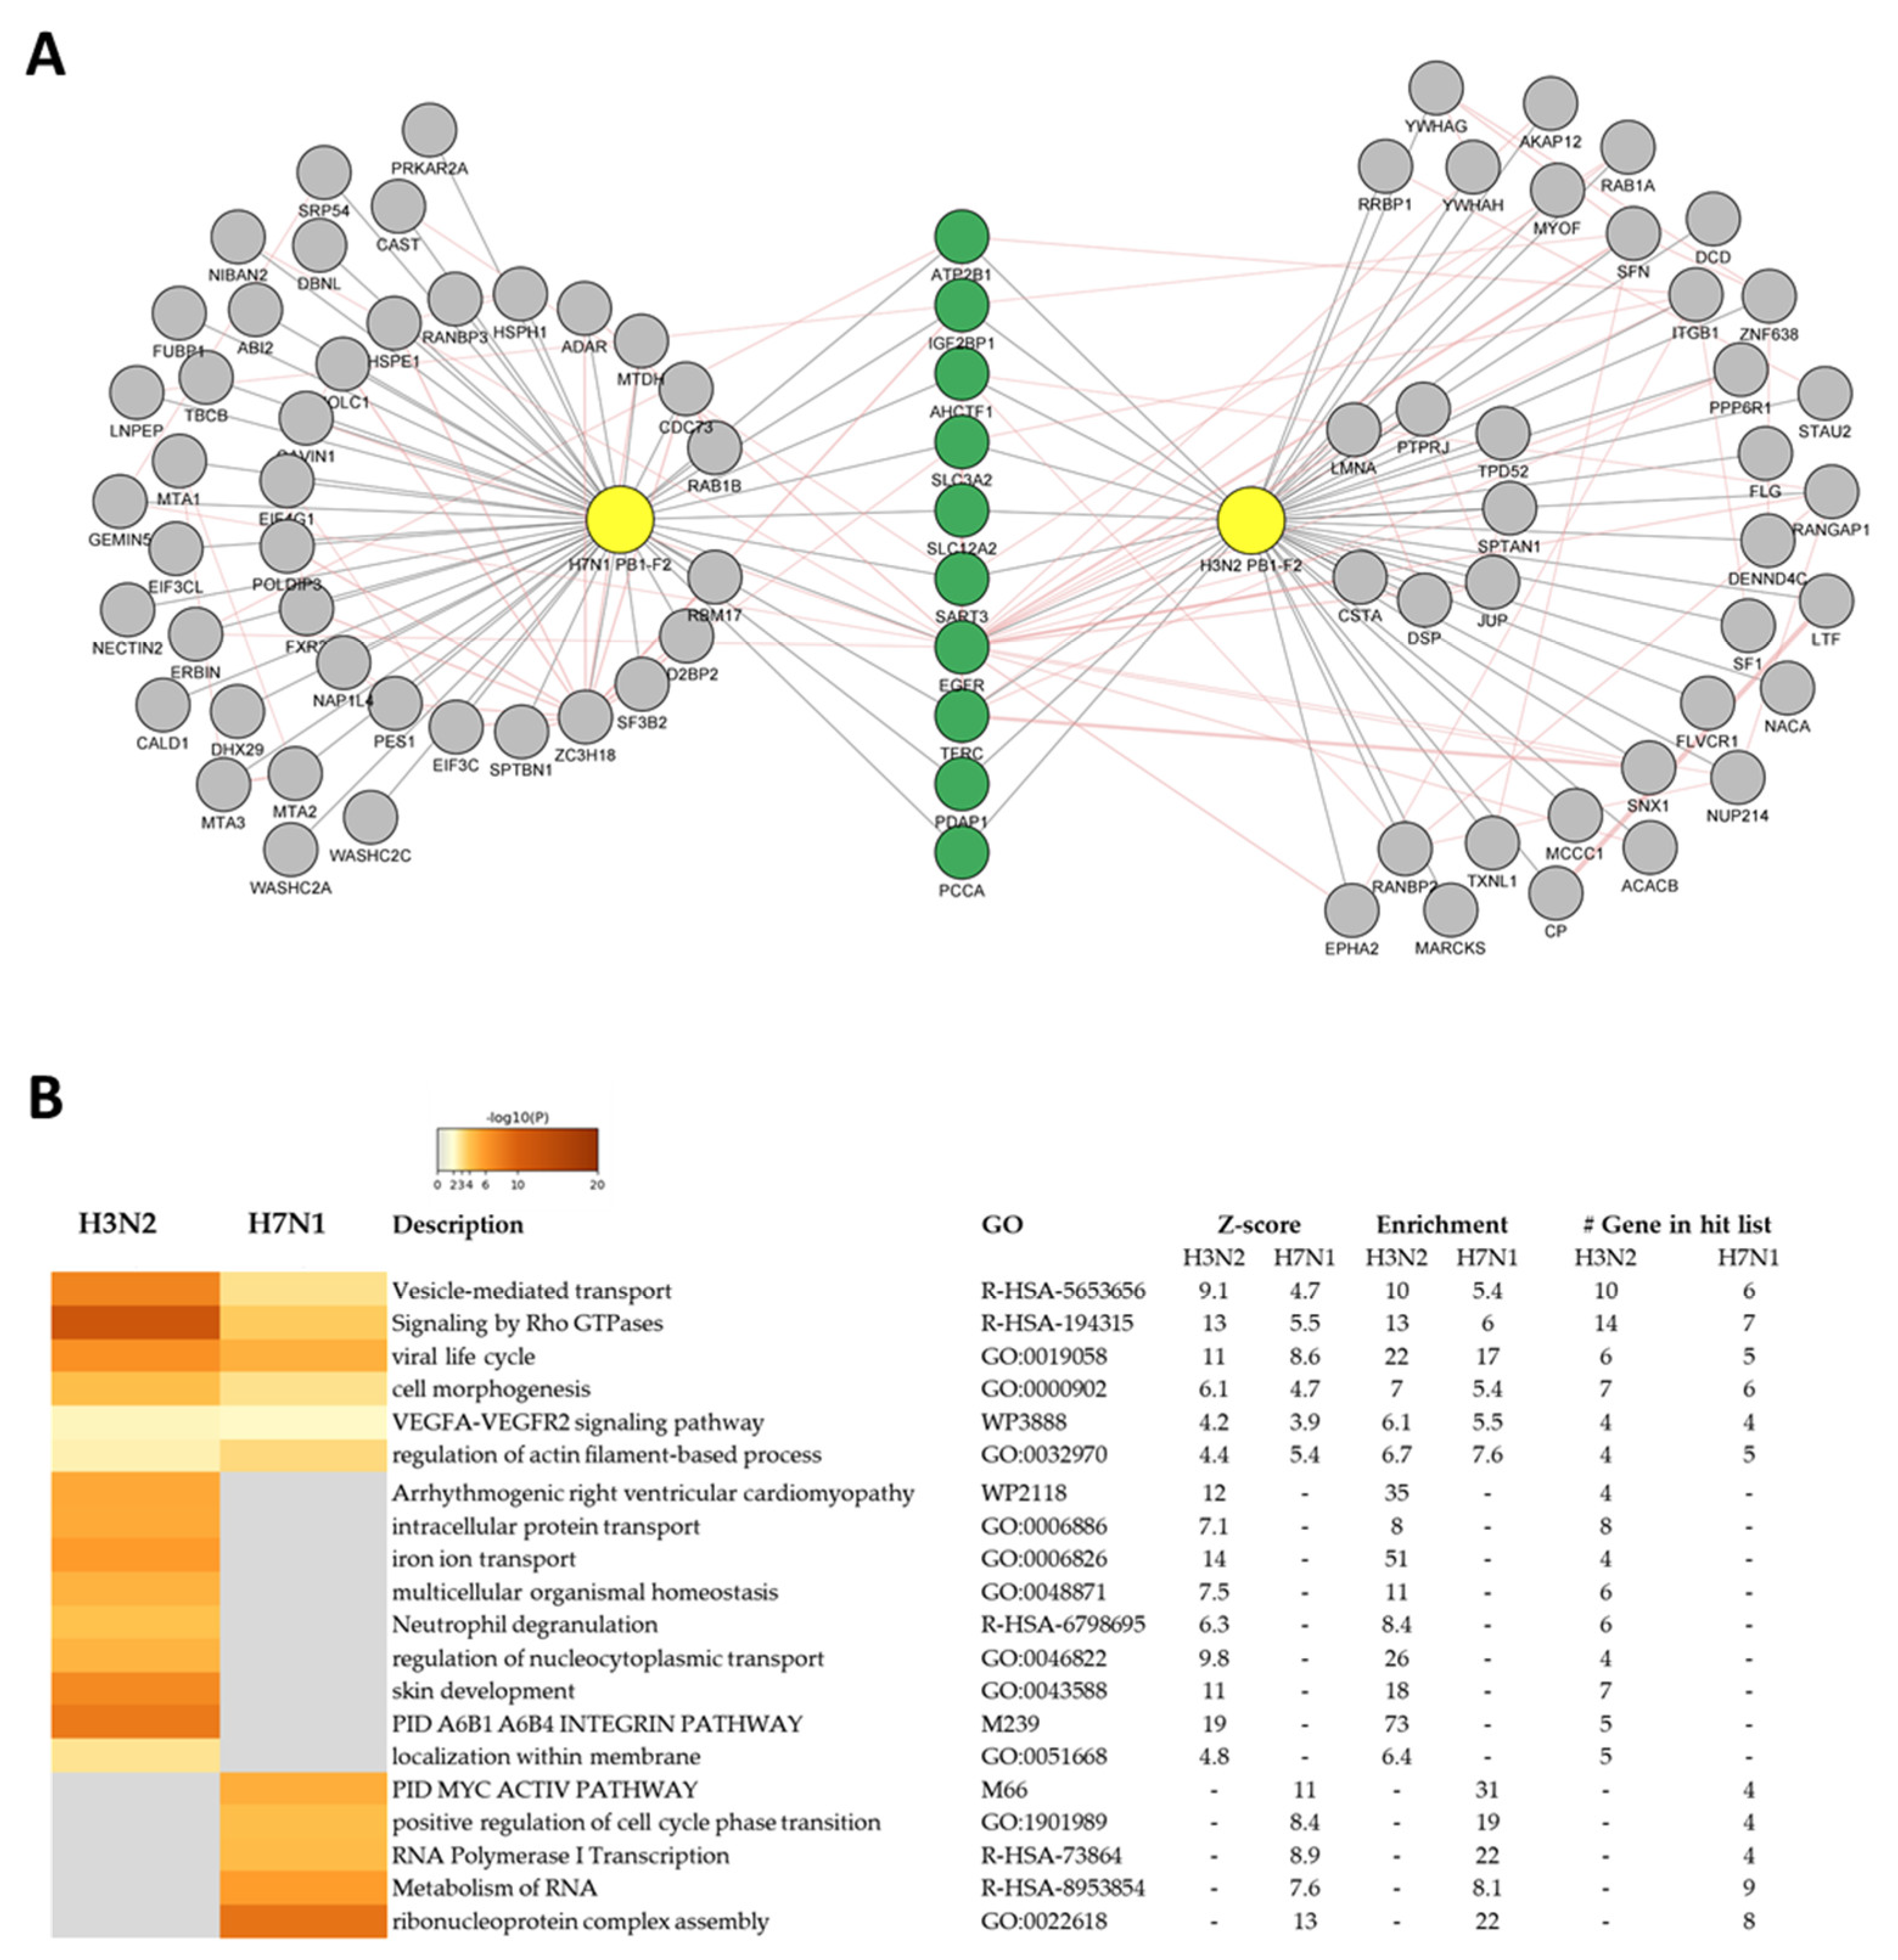
3.4. PB1-F2 Network Analysis
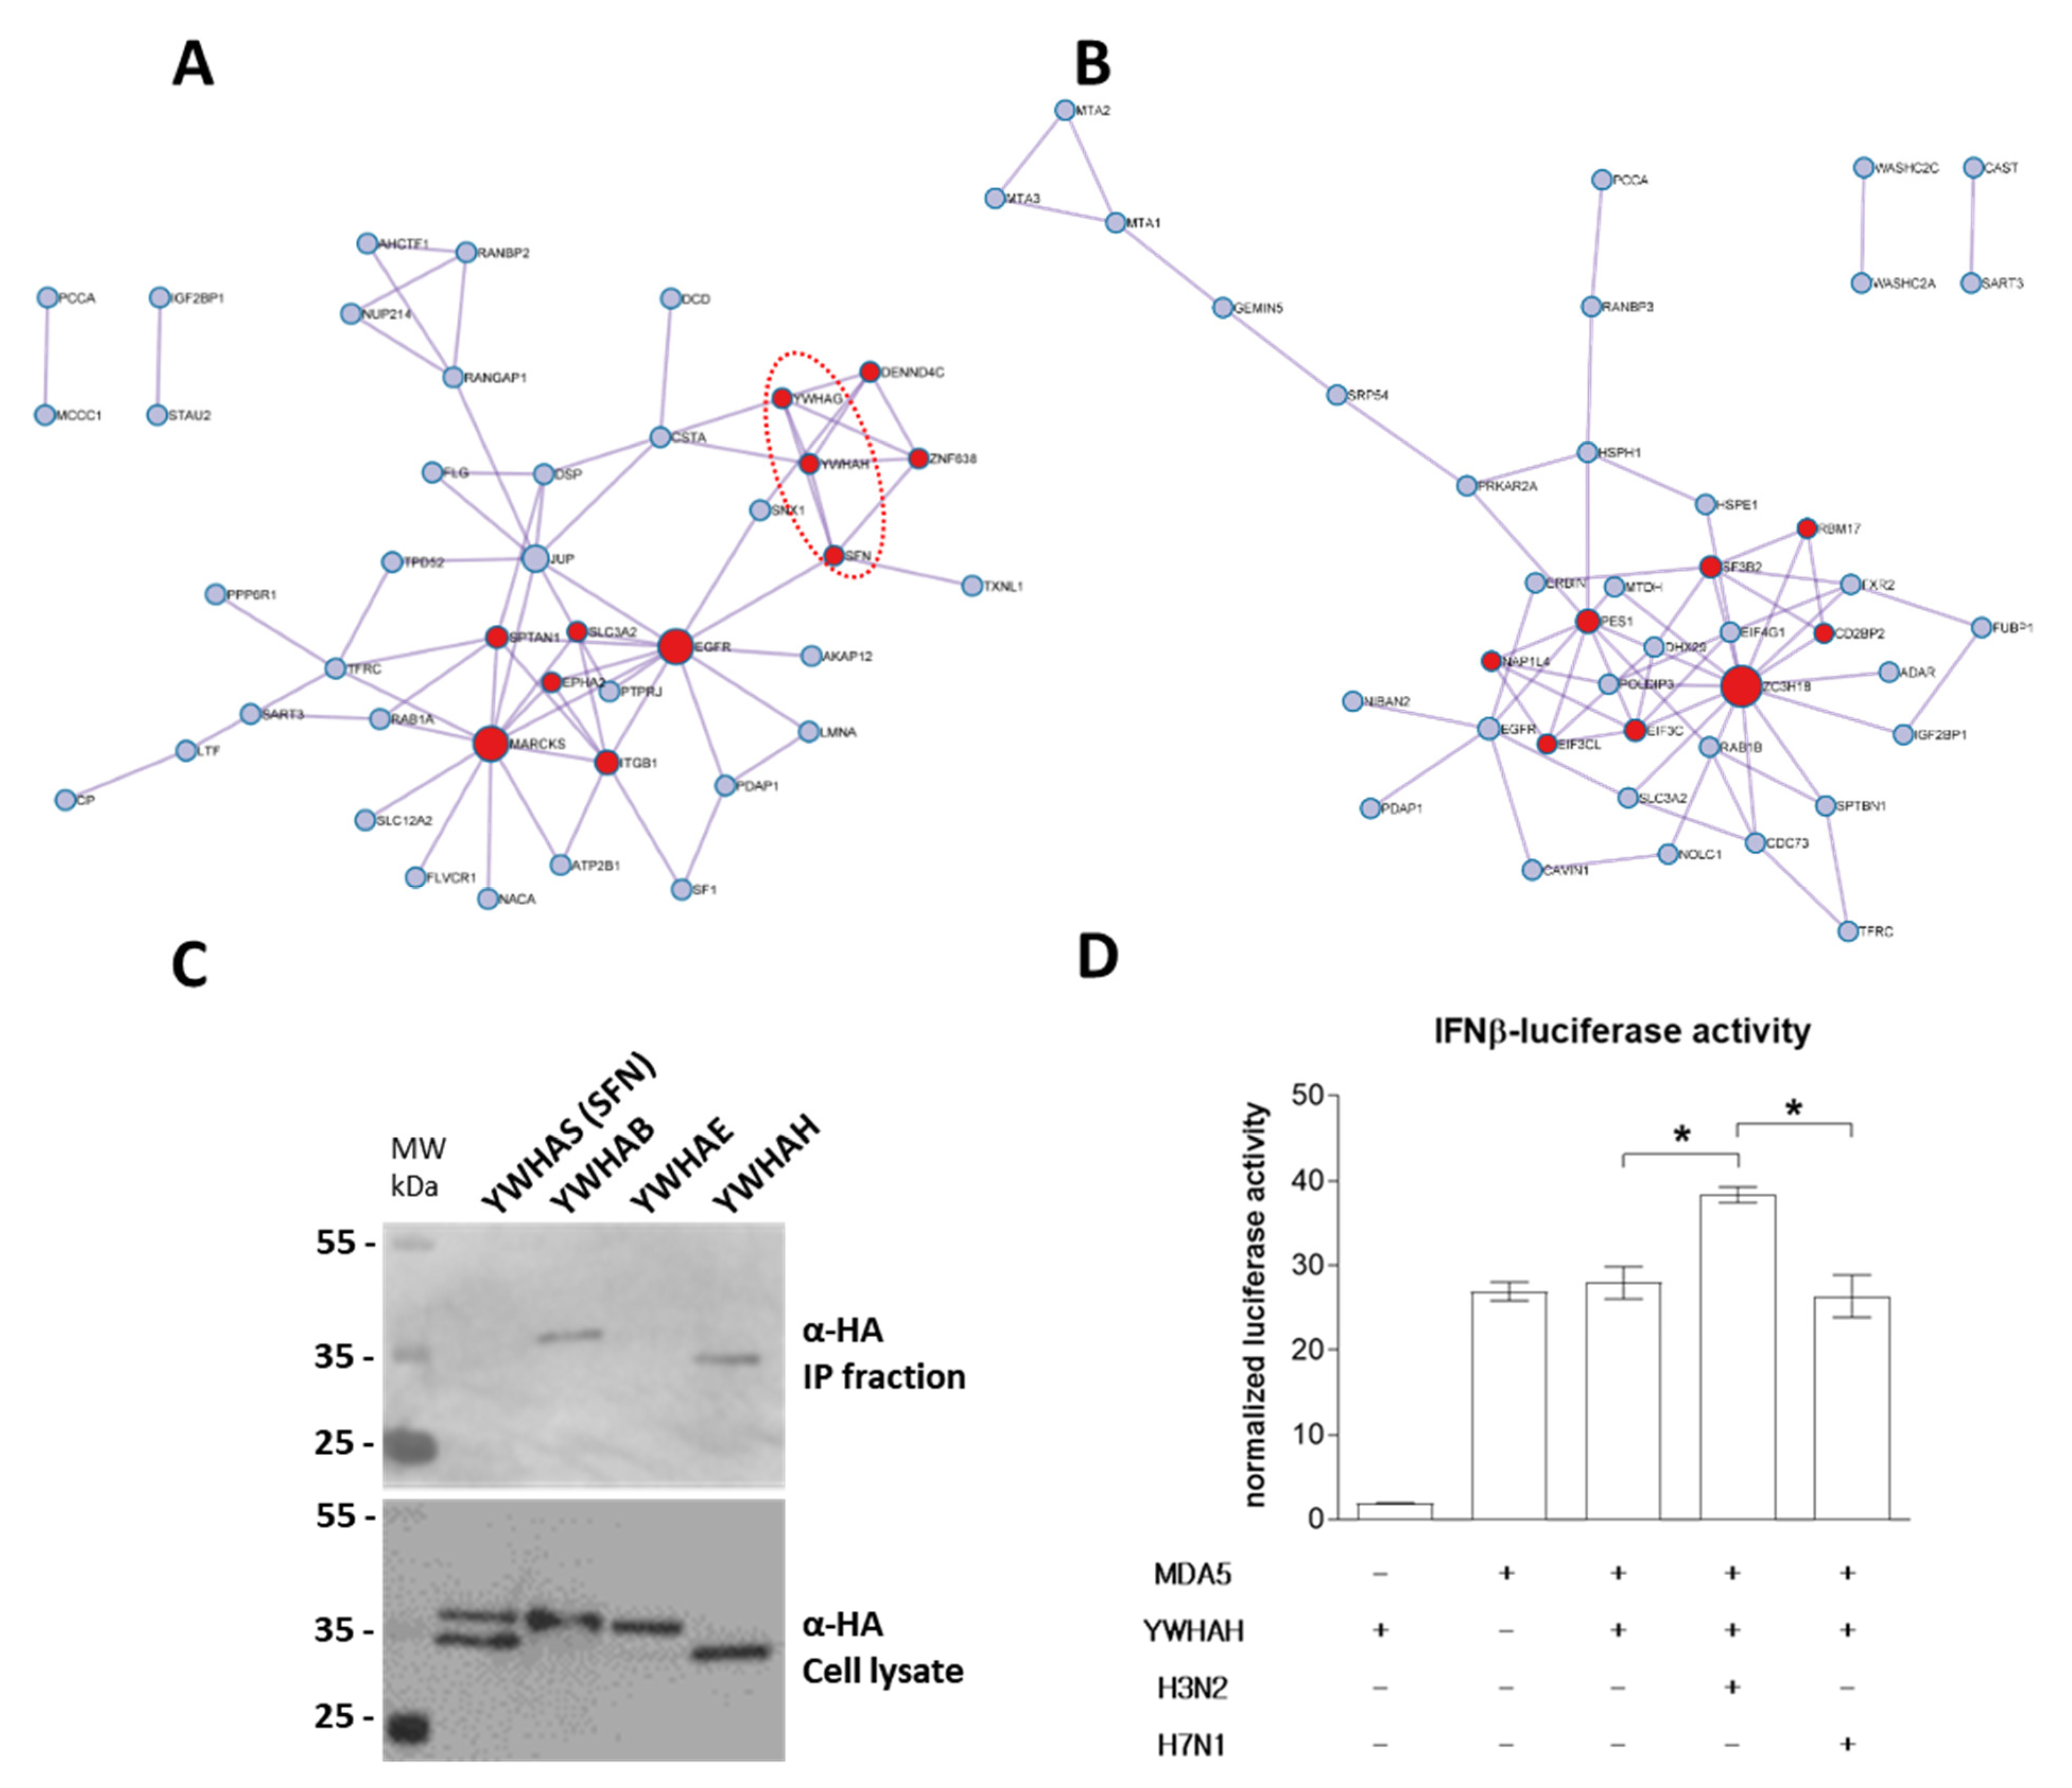
3.5. H3N2 PB1-F2 Interact with 14-3-3 Proteins to Modulate Host Response
4. Discussion
Supplementary Materials
Author Contributions
Funding
Institutional Review Board Statement
Informed Consent Statement
Data Availability Statement
Acknowledgments
Conflicts of Interest
References
- European Food Safety Authority; Adlhoch, C.; Fusaro, A.; Gonzales, J.L.; Kuiken, T.; Marangon, S.; Niqueux, E.; Staubach, C.; Terregino, C.; Aznar, I.; et al. Avian influenza overview September–December 2021. EFSA. J. 2021, 19, e07108. [Google Scholar] [CrossRef]
- Wu, Z.Q.; Zhang, Y.; Zhao, N.; Yu, Z.; Pan, H.; Chan, T.C.; Zhang, Z.R.; Liu, S.L. Comparative Epidemiology of Human Fatal Infections with Novel, High (H5N6 and H5N1) and Low (H7N9 and H9N2) Pathogenicity Avian Influenza A Viruses. Int. J. Environ. Res. Public Health 2017, 14, 263. [Google Scholar] [CrossRef]
- Suzuki, Y.; Ito, T.; Suzuki, T.; Holland, R.E., Jr.; Chambers, T.M.; Kiso, M.; Ishida, H.; Kawaoka, Y. Sialic acid species as a determinant of the host range of influenza A viruses. J. Virol. 2000, 74, 11825–11831. [Google Scholar] [CrossRef]
- Carrique, L.; Fan, H.; Walker, A.P.; Keown, J.R.; Sharps, J.; Staller, E.; Barclay, W.S.; Fodor, E.; Grimes, J.M. Host ANP32A mediates the assembly of the influenza virus replicase. Nature 2020, 587, 638–643. [Google Scholar] [CrossRef]
- Long, J.S.; Giotis, E.S.; Moncorge, O.; Frise, R.; Mistry, B.; James, J.; Morisson, M.; Iqbal, M.; Vignal, A.; Skinner, M.A.; et al. Species difference in ANP32A underlies influenza A virus polymerase host restriction. Nature 2016, 529, 101–104. [Google Scholar] [CrossRef]
- Foeglein, A.; Loucaides, E.M.; Mura, M.; Wise, H.M.; Barclay, W.S.; Digard, P. Influence of PB2 host-range determinants on the intranuclear mobility of the influenza A virus polymerase. J. Gen. Virol. 2011, 92, 1650–1661. [Google Scholar] [CrossRef]
- Zanin, M.; Wong, S.S.; Barman, S.; Kaewborisuth, C.; Vogel, P.; Rubrum, A.; Darnell, D.; Marinova-Petkova, A.; Krauss, S.; Webby, R.J.; et al. Molecular basis of mammalian transmissibility of avian H1N1 influenza viruses and their pandemic potential. Proc. Natl. Acad. Sci. USA 2017, 114, 11217–11222. [Google Scholar] [CrossRef]
- Schrauwen, E.J.; de Graaf, M.; Herfst, S.; Rimmelzwaan, G.F.; Osterhaus, A.D.; Fouchier, R.A. Determinants of virulence of influenza A virus. Eur. J. Clin. Microbiol. Infect. Dis. 2014, 33, 479–490. [Google Scholar] [CrossRef]
- Chen, W.; Calvo, P.A.; Malide, D.; Gibbs, J.; Schubert, U.; Bacik, I.; Basta, S.; O’Neill, R.; Schickli, J.; Palese, P.; et al. A novel influenza A virus mitochondrial protein that induces cell death. Nat. Med. 2001, 7, 1306–1312. [Google Scholar] [CrossRef]
- Zell, R.; Krumbholz, A.; Eitner, A.; Krieg, R.; Halbhuber, K.J.; Wutzler, P. Prevalence of PB1-F2 of influenza A viruses. J. Gen. Virol. 2007, 88, 536–546. [Google Scholar] [CrossRef]
- Kamal, R.P.; Kumar, A.; Davis, C.T.; Tzeng, W.P.; Nguyen, T.; Donis, R.O.; Katz, J.M.; York, I.A. Emergence of Highly Pathogenic Avian Influenza A(H5N1) Virus PB1-F2 Variants and Their Virulence in BALB/c Mice. J. Virol. 2015, 89, 5835–5846. [Google Scholar] [CrossRef]
- Trifonov, V.; Racaniello, V.; Rabadan, R. The Contribution of the PB1-F2 Protein to the Fitness of Influenza A Viruses and its Recent Evolution in the 2009 Influenza A (H1N1) Pandemic Virus. PLoS. Curr. 2009, 1, RRN1006. [Google Scholar] [CrossRef]
- Worobey, M.; Han, G.Z.; Rambaut, A. Genesis and pathogenesis of the 1918 pandemic H1N1 influenza A virus. Proc. Natl. Acad. Sci. USA 2014, 111, 8107–8112. [Google Scholar] [CrossRef]
- Kawaoka, Y.; Krauss, S.; Webster, R.G. Avian-to-human transmission of the PB1 gene of influenza A viruses in the 1957 and 1968 pandemics. J. Virol. 1989, 63, 4603–4608. [Google Scholar] [CrossRef]
- McAuley, J.L.; Hornung, F.; Boyd, K.L.; Smith, A.M.; McKeon, R.; Bennink, J.; Yewdell, J.W.; McCullers, J.A. Expression of the 1918 influenza A virus PB1-F2 enhances the pathogenesis of viral and secondary bacterial pneumonia. Cell Host Microbe 2007, 2, 240–249. [Google Scholar] [CrossRef]
- Kaji, M.; Watanabe, A.; Aizawa, H. Differences in clinical features between influenza A H1N1, A H3N2, and B in adult patients. Respirology 2003, 8, 231–233. [Google Scholar] [CrossRef]
- Carrat, F.; Tachet, A.; Rouzioux, C.; Housset, B.; Valleron, A.J. Evaluation of clinical case definitions of influenza: Detailed investigation of patients during the 1995–1996 epidemic in France. Clin. Infect. Dis. 1999, 28, 283–290. [Google Scholar] [CrossRef]
- Conenello, G.M.; Tisoncik, J.R.; Rosenzweig, E.; Varga, Z.T.; Palese, P.; Katze, M.G. A single N66S mutation in the PB1-F2 protein of influenza A virus increases virulence by inhibiting the early interferon response in vivo. J. Virol. 2011, 85, 652–662. [Google Scholar] [CrossRef]
- Le Goffic, R.; Bouguyon, E.; Chevalier, C.; Vidic, J.; Da Costa, B.; Leymarie, O.; Bourdieu, C.; Decamps, L.; Dhorne-Pollet, S.; Delmas, B. Influenza A virus protein PB1-F2 exacerbates IFN-beta expression of human respiratory epithelial cells. J. Immunol. 2010, 185, 4812–4823. [Google Scholar] [CrossRef]
- Le Goffic, R.; Leymarie, O.; Chevalier, C.; Rebours, E.; Da Costa, B.; Vidic, J.; Descamps, D.; Sallenave, J.M.; Rauch, M.; Samson, M.; et al. Transcriptomic analysis of host immune and cell death responses associated with the influenza A virus PB1-F2 protein. PLoS Pathog. 2011, 7, e1002202. [Google Scholar] [CrossRef]
- McAuley, J.L.; Chipuk, J.E.; Boyd, K.L.; Van De Velde, N.; Green, D.R.; McCullers, J.A. PB1-F2 proteins from H5N1 and 20 century pandemic influenza viruses cause immunopathology. PLoS Pathog. 2010, 6, e1001014. [Google Scholar] [CrossRef]
- Leymarie, O.; Embury-Hyatt, C.; Chevalier, C.; Jouneau, L.; Moroldo, M.; Da Costa, B.; Berhane, Y.; Delmas, B.; Weingartl, H.M.; Le Goffic, R. PB1-F2 attenuates virulence of highly pathogenic avian H5N1 influenza virus in chickens. PLoS ONE 2014, 9, e100679. [Google Scholar] [CrossRef]
- Schmolke, M.; Manicassamy, B.; Pena, L.; Sutton, T.; Hai, R.; Varga, Z.T.; Hale, B.G.; Steel, J.; Perez, D.R.; Garcia-Sastre, A. Differential contribution of PB1-F2 to the virulence of highly pathogenic H5N1 influenza A virus in mammalian and avian species. PLoS Pathog. 2011, 7, e1002186. [Google Scholar] [CrossRef]
- James, J.; Howard, W.; Iqbal, M.; Nair, V.K.; Barclay, W.S.; Shelton, H. Influenza A virus PB1-F2 protein prolongs viral shedding in chickens lengthening the transmission window. J. Gen. Virol. 2016, 97, 2516–2527. [Google Scholar] [CrossRef]
- Chakrabarti, A.K.; Pasricha, G. An insight into the PB1F2 protein and its multifunctional role in enhancing the pathogenicity of the influenza A viruses. Virology 2013, 440, 97–104. [Google Scholar] [CrossRef]
- Mettier, J.; Marc, D.; Sedano, L.; Da Costa, B.; Chevalier, C.; Le Goffic, R. Study of the host specificity of PB1-F2-associated virulence. Virulence 2021, 12, 1647–1660. [Google Scholar] [CrossRef]
- Chevalier, C.; Leymarie, O.; Sedano, L.; Da Costa, B.; Richard, C.A.; Maisonnasse, P.; Refregiers, M.; Jamme, F.; Le Goffic, R. PB1-F2 amyloid-like fibers correlate with proinflammatory signaling and respiratory distress in influenza-infected mice. J. Biol. Chem. 2021, 297, 100885. [Google Scholar] [CrossRef]
- Chevalier, C.; Al Bazzal, A.; Vidic, J.; Fevrier, V.; Bourdieu, C.; Bouguyon, E.; Le Goffic, R.; Vautherot, J.F.; Bernard, J.; Moudjou, M.; et al. PB1-F2 influenza A virus protein adopts a beta-sheet conformation and forms amyloid fibers in membrane environments. J. Biol. Chem. 2010, 285, 13233–13243. [Google Scholar] [CrossRef]
- Vidic, J.; Richard, C.A.; Pechoux, C.; Da Costa, B.; Bertho, N.; Mazerat, S.; Delmas, B.; Chevalier, C. Amyloid Assemblies of Influenza A Virus PB1-F2 Protein Damage Membrane and Induce Cytotoxicity. J. Biol. Chem. 2016, 291, 739–751. [Google Scholar] [CrossRef]
- Kim, D.I.; Jensen, S.C.; Noble, K.A.; Kc, B.; Roux, K.H.; Motamedchaboki, K.; Roux, K.J. An improved smaller biotin ligase for BioID proximity labeling. Mol. Biol. Cell 2016, 27, 1188–1196. [Google Scholar] [CrossRef]
- Mellacheruvu, D.; Wright, Z.; Couzens, A.L.; Lambert, J.P.; St-Denis, N.A.; Li, T.; Miteva, Y.V.; Hauri, S.; Sardiu, M.E.; Low, T.Y.; et al. The CRAPome: A contaminant repository for affinity purification-mass spectrometry data. Nat. Methods 2013, 10, 730–736. [Google Scholar] [CrossRef]
- Naiki, H.; Higuchi, K.; Hosokawa, M.; Takeda, T. Fluorometric determination of amyloid fibrils in vitro using the fluorescent dye, thioflavin T1. Anal. Biochem. 1989, 177, 244–249. [Google Scholar] [CrossRef]
- James, J.; Smith, N.; Ross, C.; Iqbal, M.; Goodbourn, S.; Digard, P.; Barclay, W.S.; Shelton, H. The cellular localization of avian influenza virus PB1-F2 protein alters the magnitude of IFN2 promoter and NFkappaB-dependent promoter antagonism in chicken cells. J. Gen. Virol. 2019, 100, 414–430. [Google Scholar] [CrossRef]
- Chen, C.J.; Chen, G.W.; Wang, C.H.; Huang, C.H.; Wang, Y.C.; Shih, S.R. Differential localization and function of PB1-F2 derived from different strains of influenza A virus. J. Virol. 2010, 84, 10051–10062. [Google Scholar] [CrossRef]
- Watson, J.; Smith, M.; Francavilla, C.; Schwartz, J.-M. SubcellulaRVis simplifies visualization of protein enrichment in subcellular compartments. bioRxiv 2021. [Google Scholar] [CrossRef]
- Chevalier, C.; Le Goffic, R.; Jamme, F.; Leymarie, O.; Refregiers, M.; Delmas, B. Synchrotron Infrared and Deep UV Fluorescent Microspectroscopy Study of PB1-F2 beta-Aggregated Structures in Influenza A Virus-infected Cells. J. Biol. Chem. 2016, 291, 9060–9072. [Google Scholar] [CrossRef]
- Zhou, Y.; Zhou, B.; Pache, L.; Chang, M.; Khodabakhshi, A.H.; Tanaseichuk, O.; Benner, C.; Chanda, S.K. Metascape provides a biologist-oriented resource for the analysis of systems-level datasets. Nat. Commun. 2019, 10, 1523. [Google Scholar] [CrossRef]
- Lin, J.P.; Fan, Y.K.; Liu, H.M. The 14-3-3eta chaperone protein promotes antiviral innate immunity via facilitating MDA5 oligomerization and intracellular redistribution. PLoS Pathog. 2019, 15, e1007582. [Google Scholar] [CrossRef]
- Zamarin, D.; Ortigoza, M.B.; Palese, P. Influenza A virus PB1-F2 protein contributes to viral pathogenesis in mice. J. Virol. 2006, 80, 7976–7983. [Google Scholar] [CrossRef]
- Vidy, A.; Maisonnasse, P.; Da Costa, B.; Delmas, B.; Chevalier, C.; Le Goffic, R. The Influenza Virus Protein PB1-F2 Increases Viral Pathogenesis through Neutrophil Recruitment and NK Cells Inhibition. PLoS ONE 2016, 11, e0165361. [Google Scholar] [CrossRef]
- Varga, Z.T.; Ramos, I.; Hai, R.; Schmolke, M.; Garcia-Sastre, A.; Fernandez-Sesma, A.; Palese, P. The influenza virus protein PB1-F2 inhibits the induction of type I interferon at the level of the MAVS adaptor protein. PLoS Pathog. 2011, 7, e1002067. [Google Scholar] [CrossRef]
- Goldberg, T.; Hecht, M.; Hamp, T.; Karl, T.; Yachdav, G.; Ahmed, N.; Altermann, U.; Angerer, P.; Ansorge, S.; Balasz, K.; et al. LocTree3 prediction of localization. Nucleic Acids Res. 2014, 42, W350–W355. [Google Scholar] [CrossRef]


Disclaimer/Publisher’s Note: The statements, opinions and data contained in all publications are solely those of the individual author(s) and contributor(s) and not of MDPI and/or the editor(s). MDPI and/or the editor(s) disclaim responsibility for any injury to people or property resulting from any ideas, methods, instructions or products referred to in the content. |
© 2023 by the authors. Licensee MDPI, Basel, Switzerland. This article is an open access article distributed under the terms and conditions of the Creative Commons Attribution (CC BY) license (https://creativecommons.org/licenses/by/4.0/).
Share and Cite
Mettier, J.; Prompt, C.; Bruder, E.; Da Costa, B.; Chevalier, C.; Le Goffic, R. Comparison of PB1-F2 Proximity Interactomes Reveals Functional Differences between a Human and an Avian Influenza Virus. Viruses 2023, 15, 328. https://doi.org/10.3390/v15020328
Mettier J, Prompt C, Bruder E, Da Costa B, Chevalier C, Le Goffic R. Comparison of PB1-F2 Proximity Interactomes Reveals Functional Differences between a Human and an Avian Influenza Virus. Viruses. 2023; 15(2):328. https://doi.org/10.3390/v15020328
Chicago/Turabian StyleMettier, Joëlle, Clémentine Prompt, Elise Bruder, Bruno Da Costa, Christophe Chevalier, and Ronan Le Goffic. 2023. "Comparison of PB1-F2 Proximity Interactomes Reveals Functional Differences between a Human and an Avian Influenza Virus" Viruses 15, no. 2: 328. https://doi.org/10.3390/v15020328
APA StyleMettier, J., Prompt, C., Bruder, E., Da Costa, B., Chevalier, C., & Le Goffic, R. (2023). Comparison of PB1-F2 Proximity Interactomes Reveals Functional Differences between a Human and an Avian Influenza Virus. Viruses, 15(2), 328. https://doi.org/10.3390/v15020328