
National Scale Real-Time Surveillance of SARS-CoV-2 Variants Dynamics by Wastewater Monitoring in Israel

 , ,
, ,
Abstract
:1. Introduction
2. Materials and Methods
2.1. Wastewater Sampling and Processing
2.2. Viral RNA Extraction
2.3. Primers and Probes
2.4. RT-qPCR
2.5. Design and Generation of In Vitro Transcribed Standard RNA Templates
2.6. Calculation of the Normalized Viral Load Value in Wastewater Samples
2.7. Whole Genome Sequencing and Bioinformatic Analysis
2.8. Ethical Statement
3. Results
3.1. Development of the Positive/Negative B.1.1.7 Variant Reaction
3.2. Development of RT-qPCR Assay for Detection of SC-2 in Environmental Samples
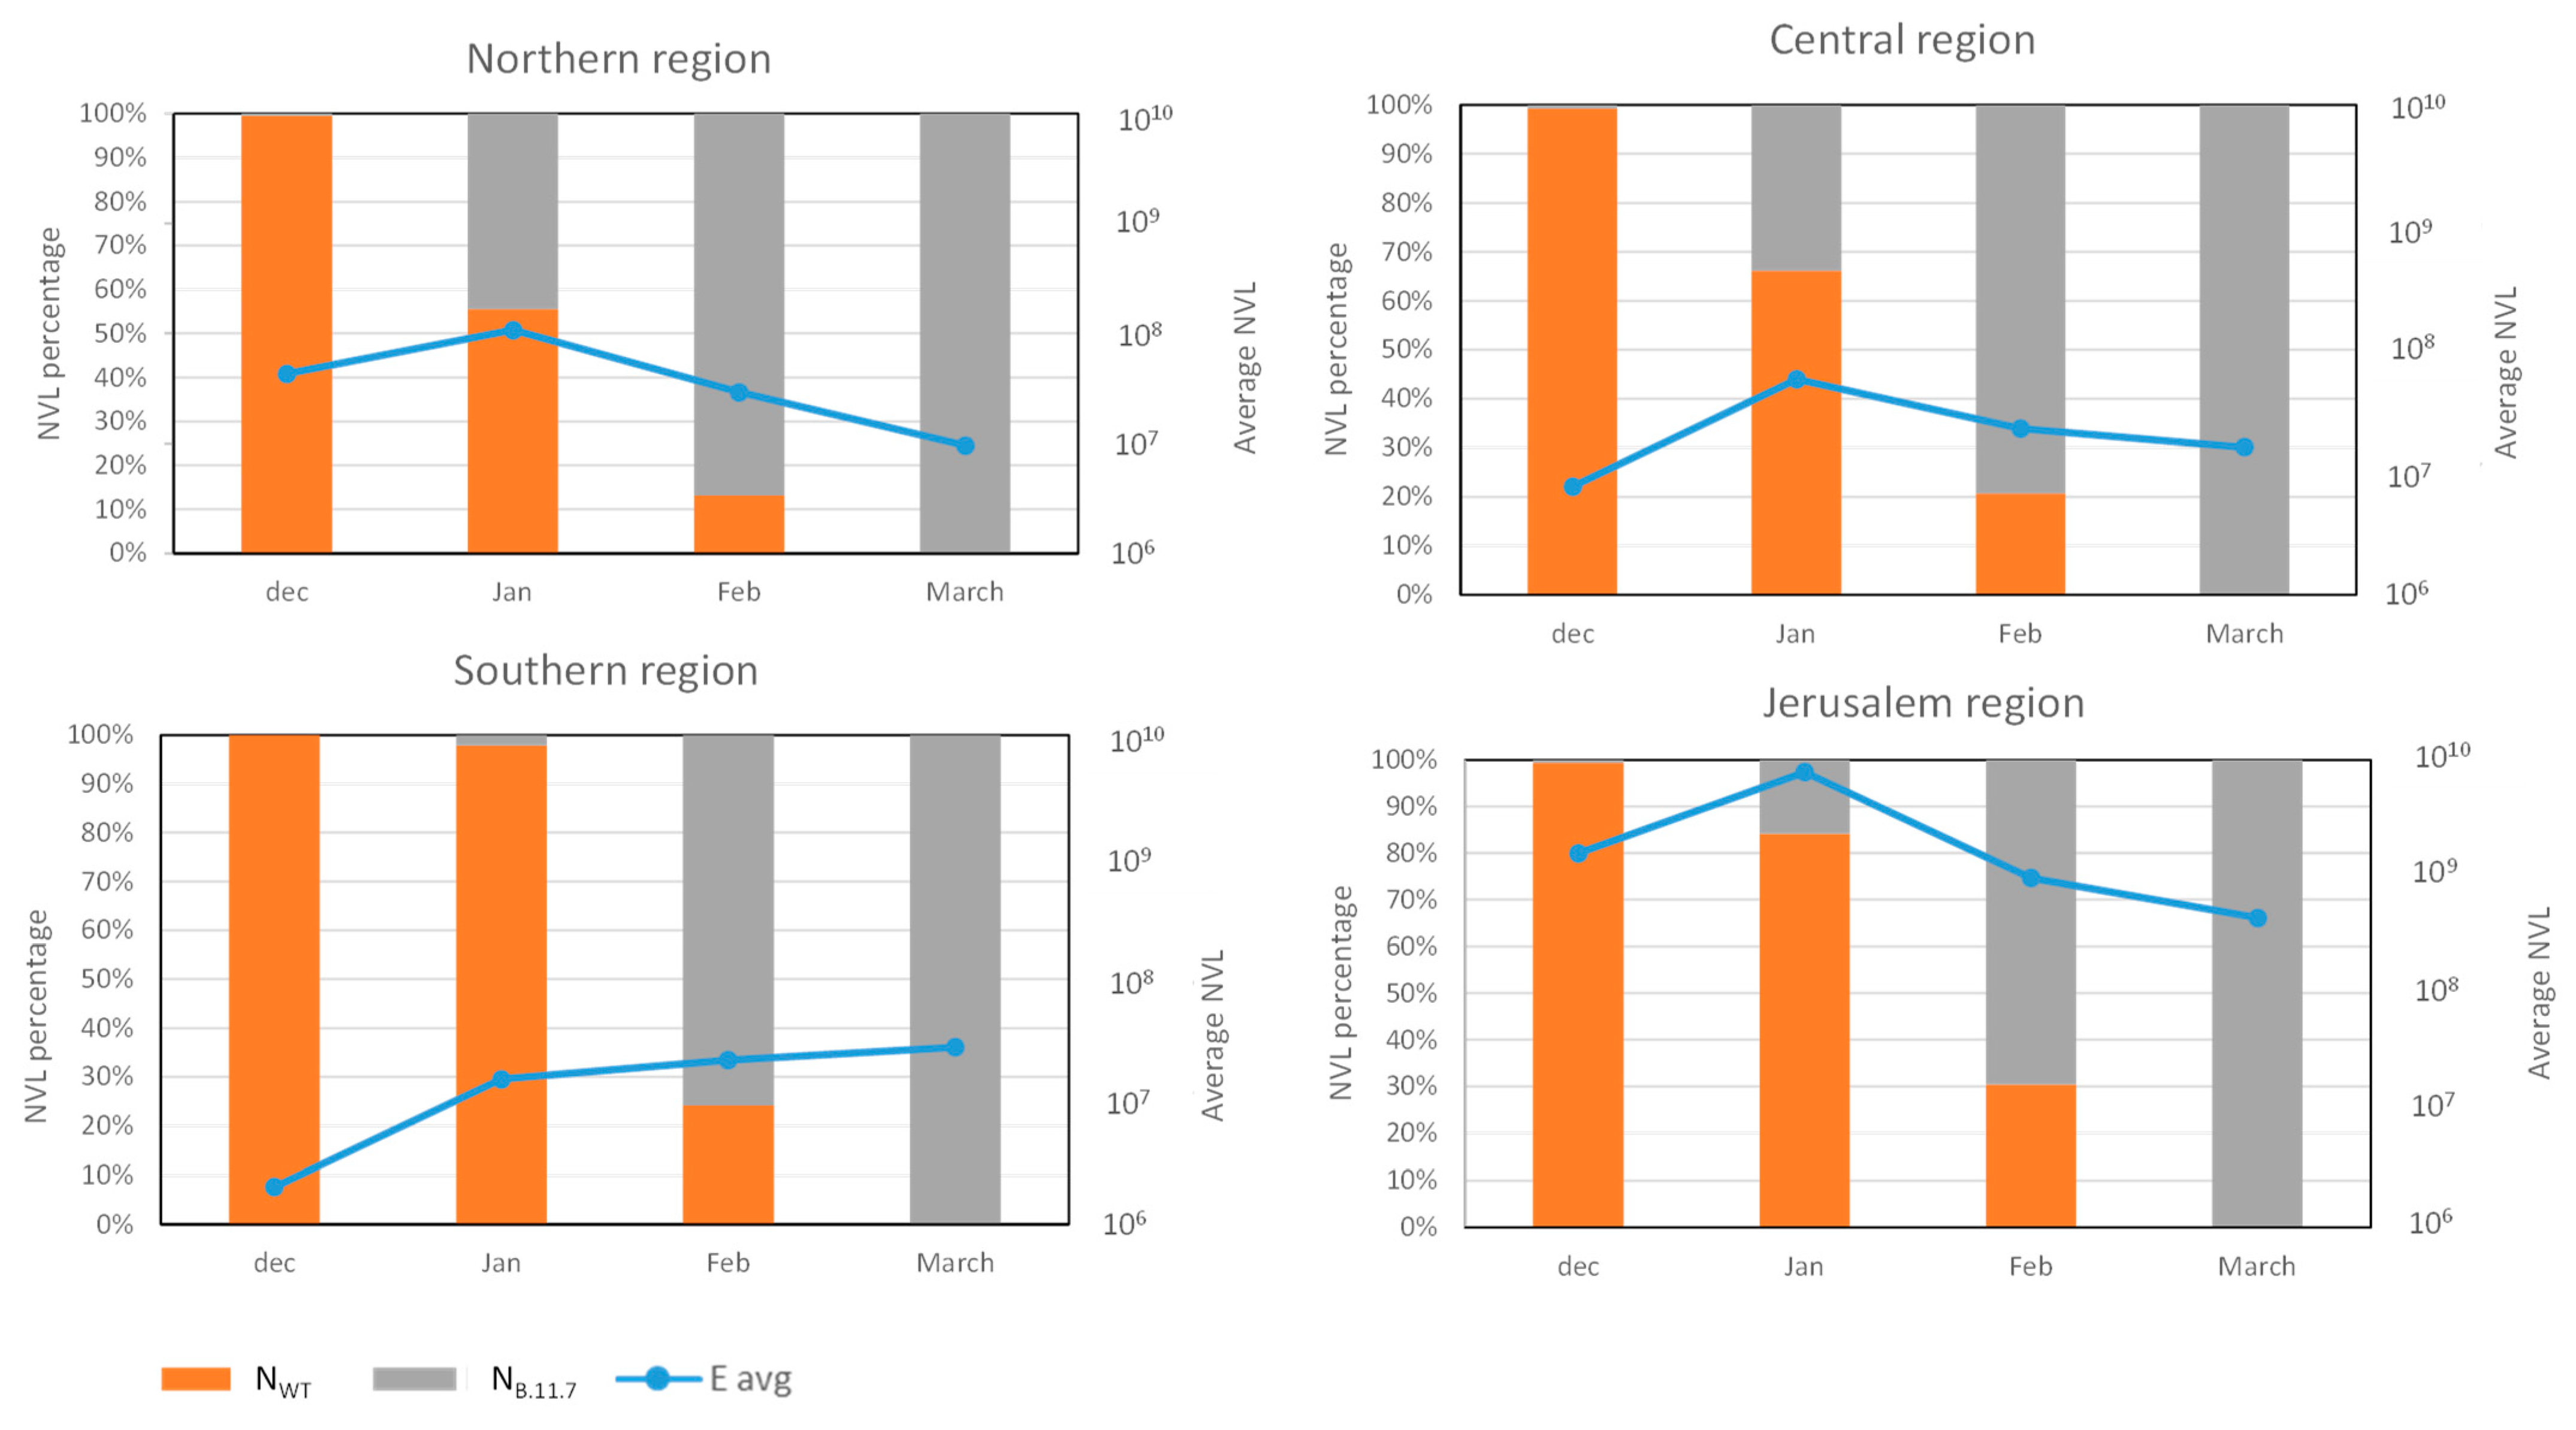
3.3. Analysis of SC-2 Variants Dynamics Using the Differential Assay
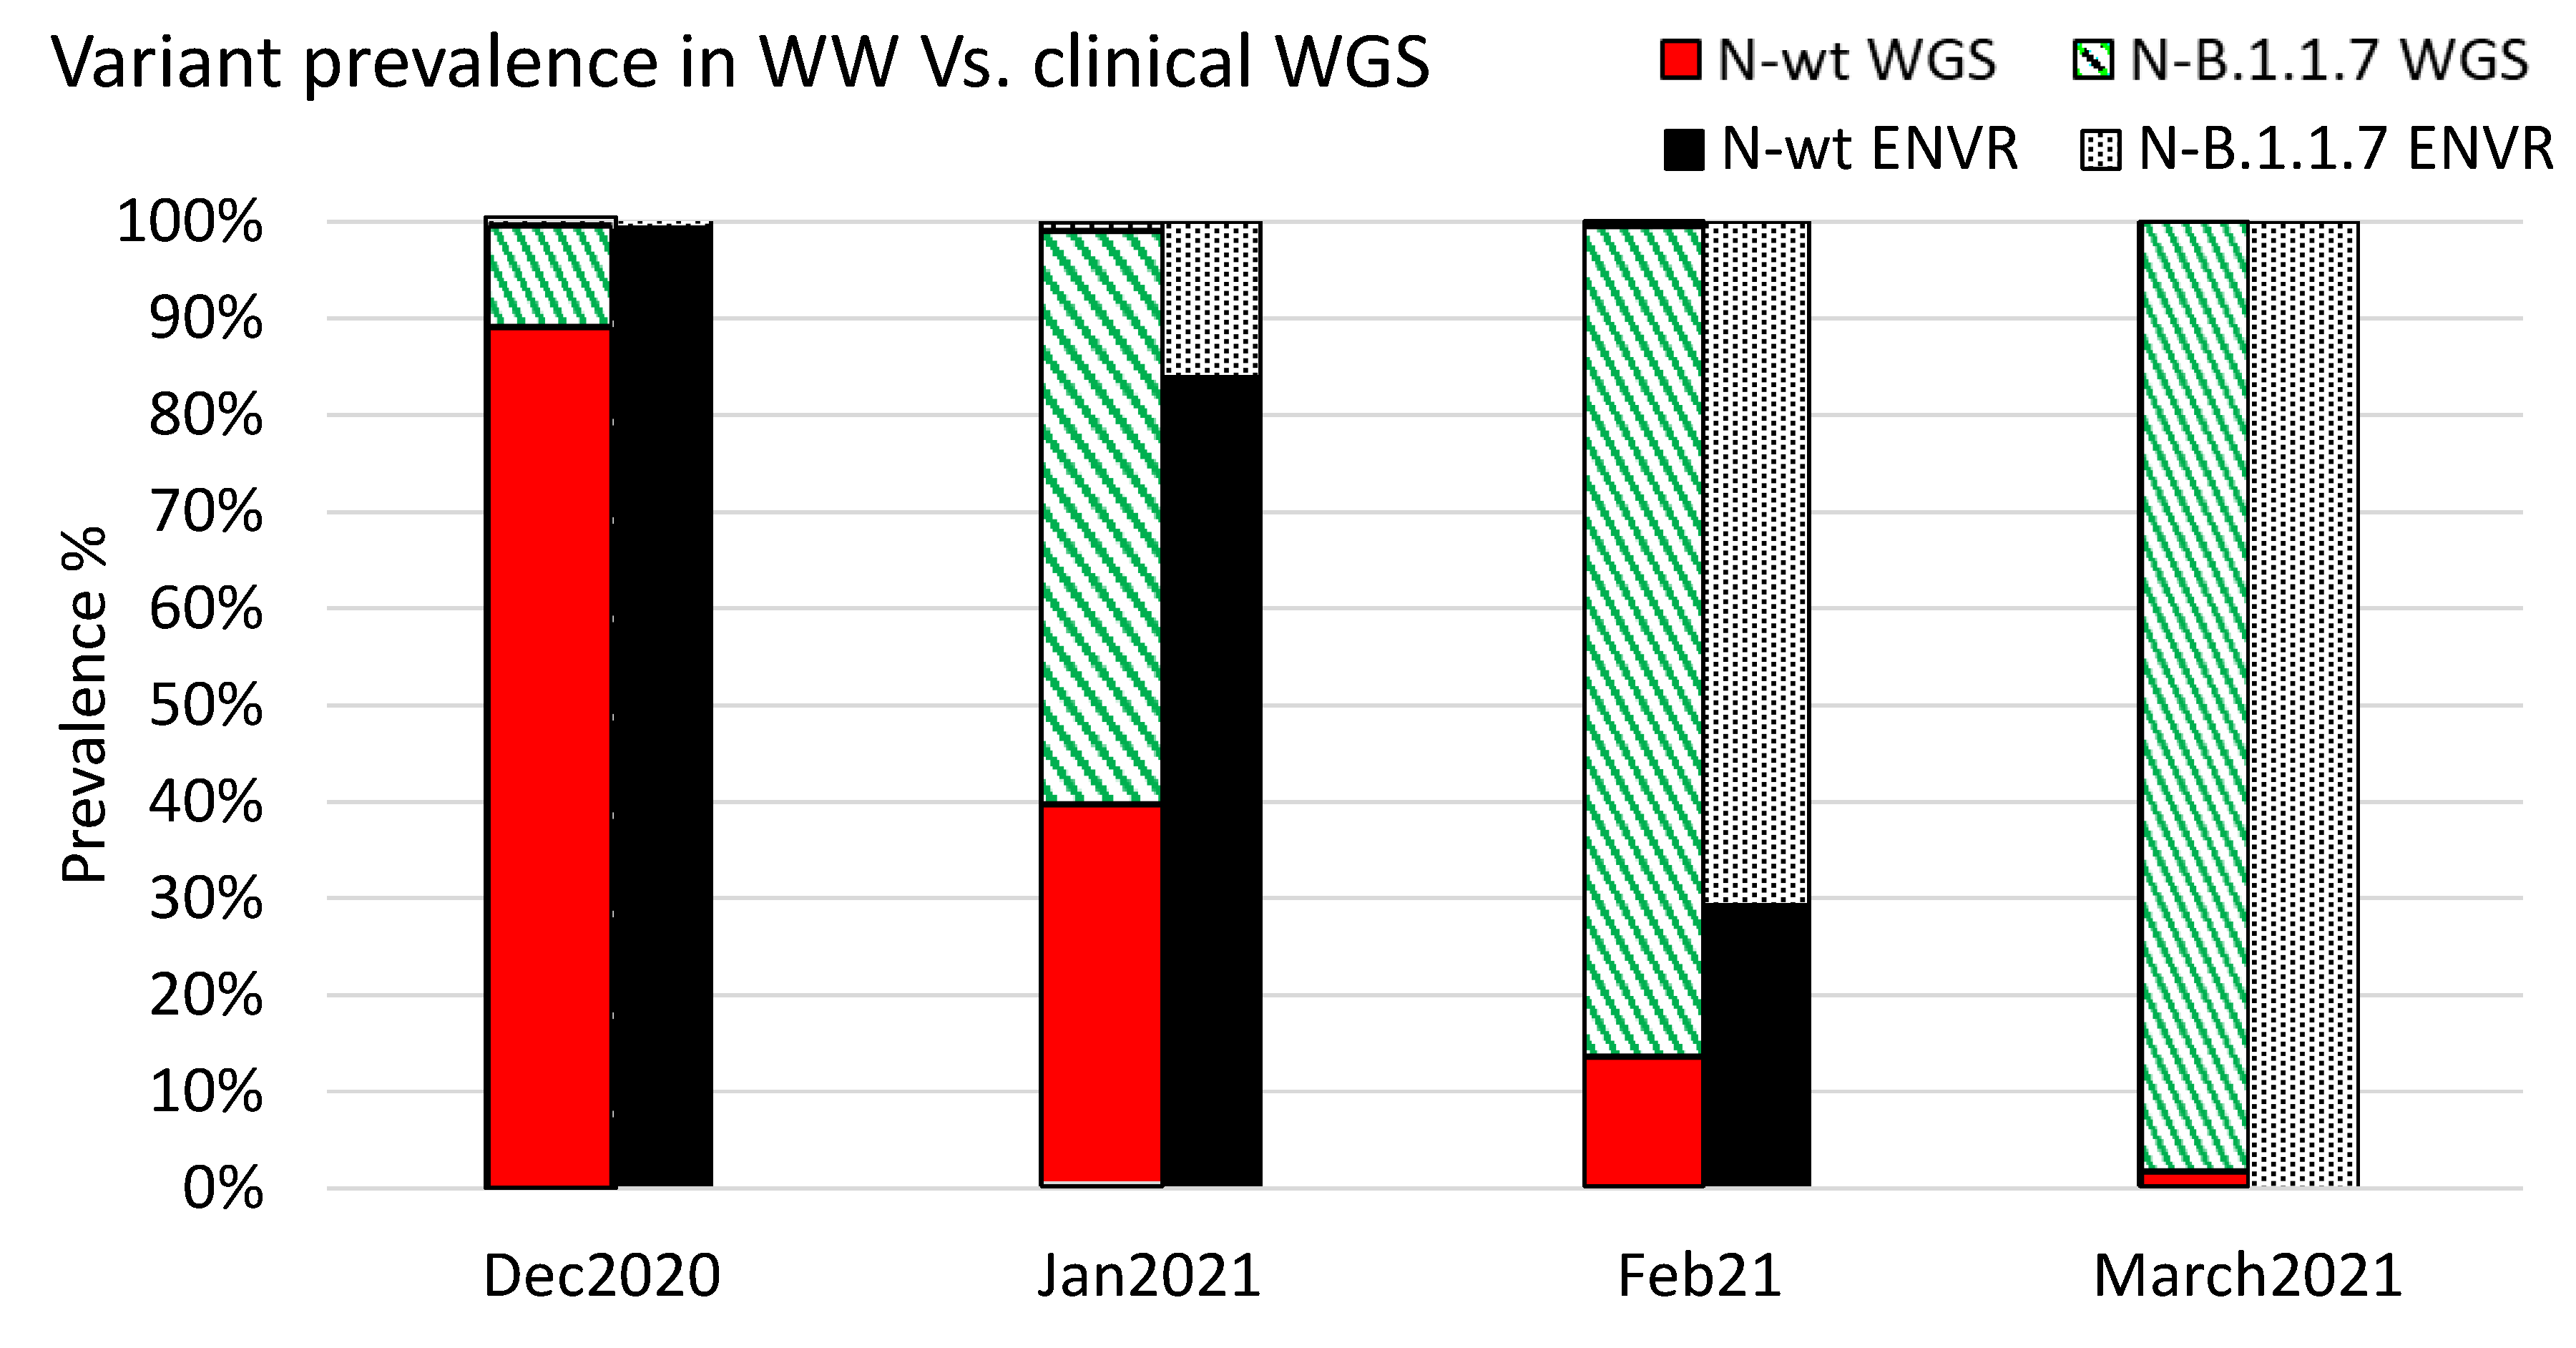
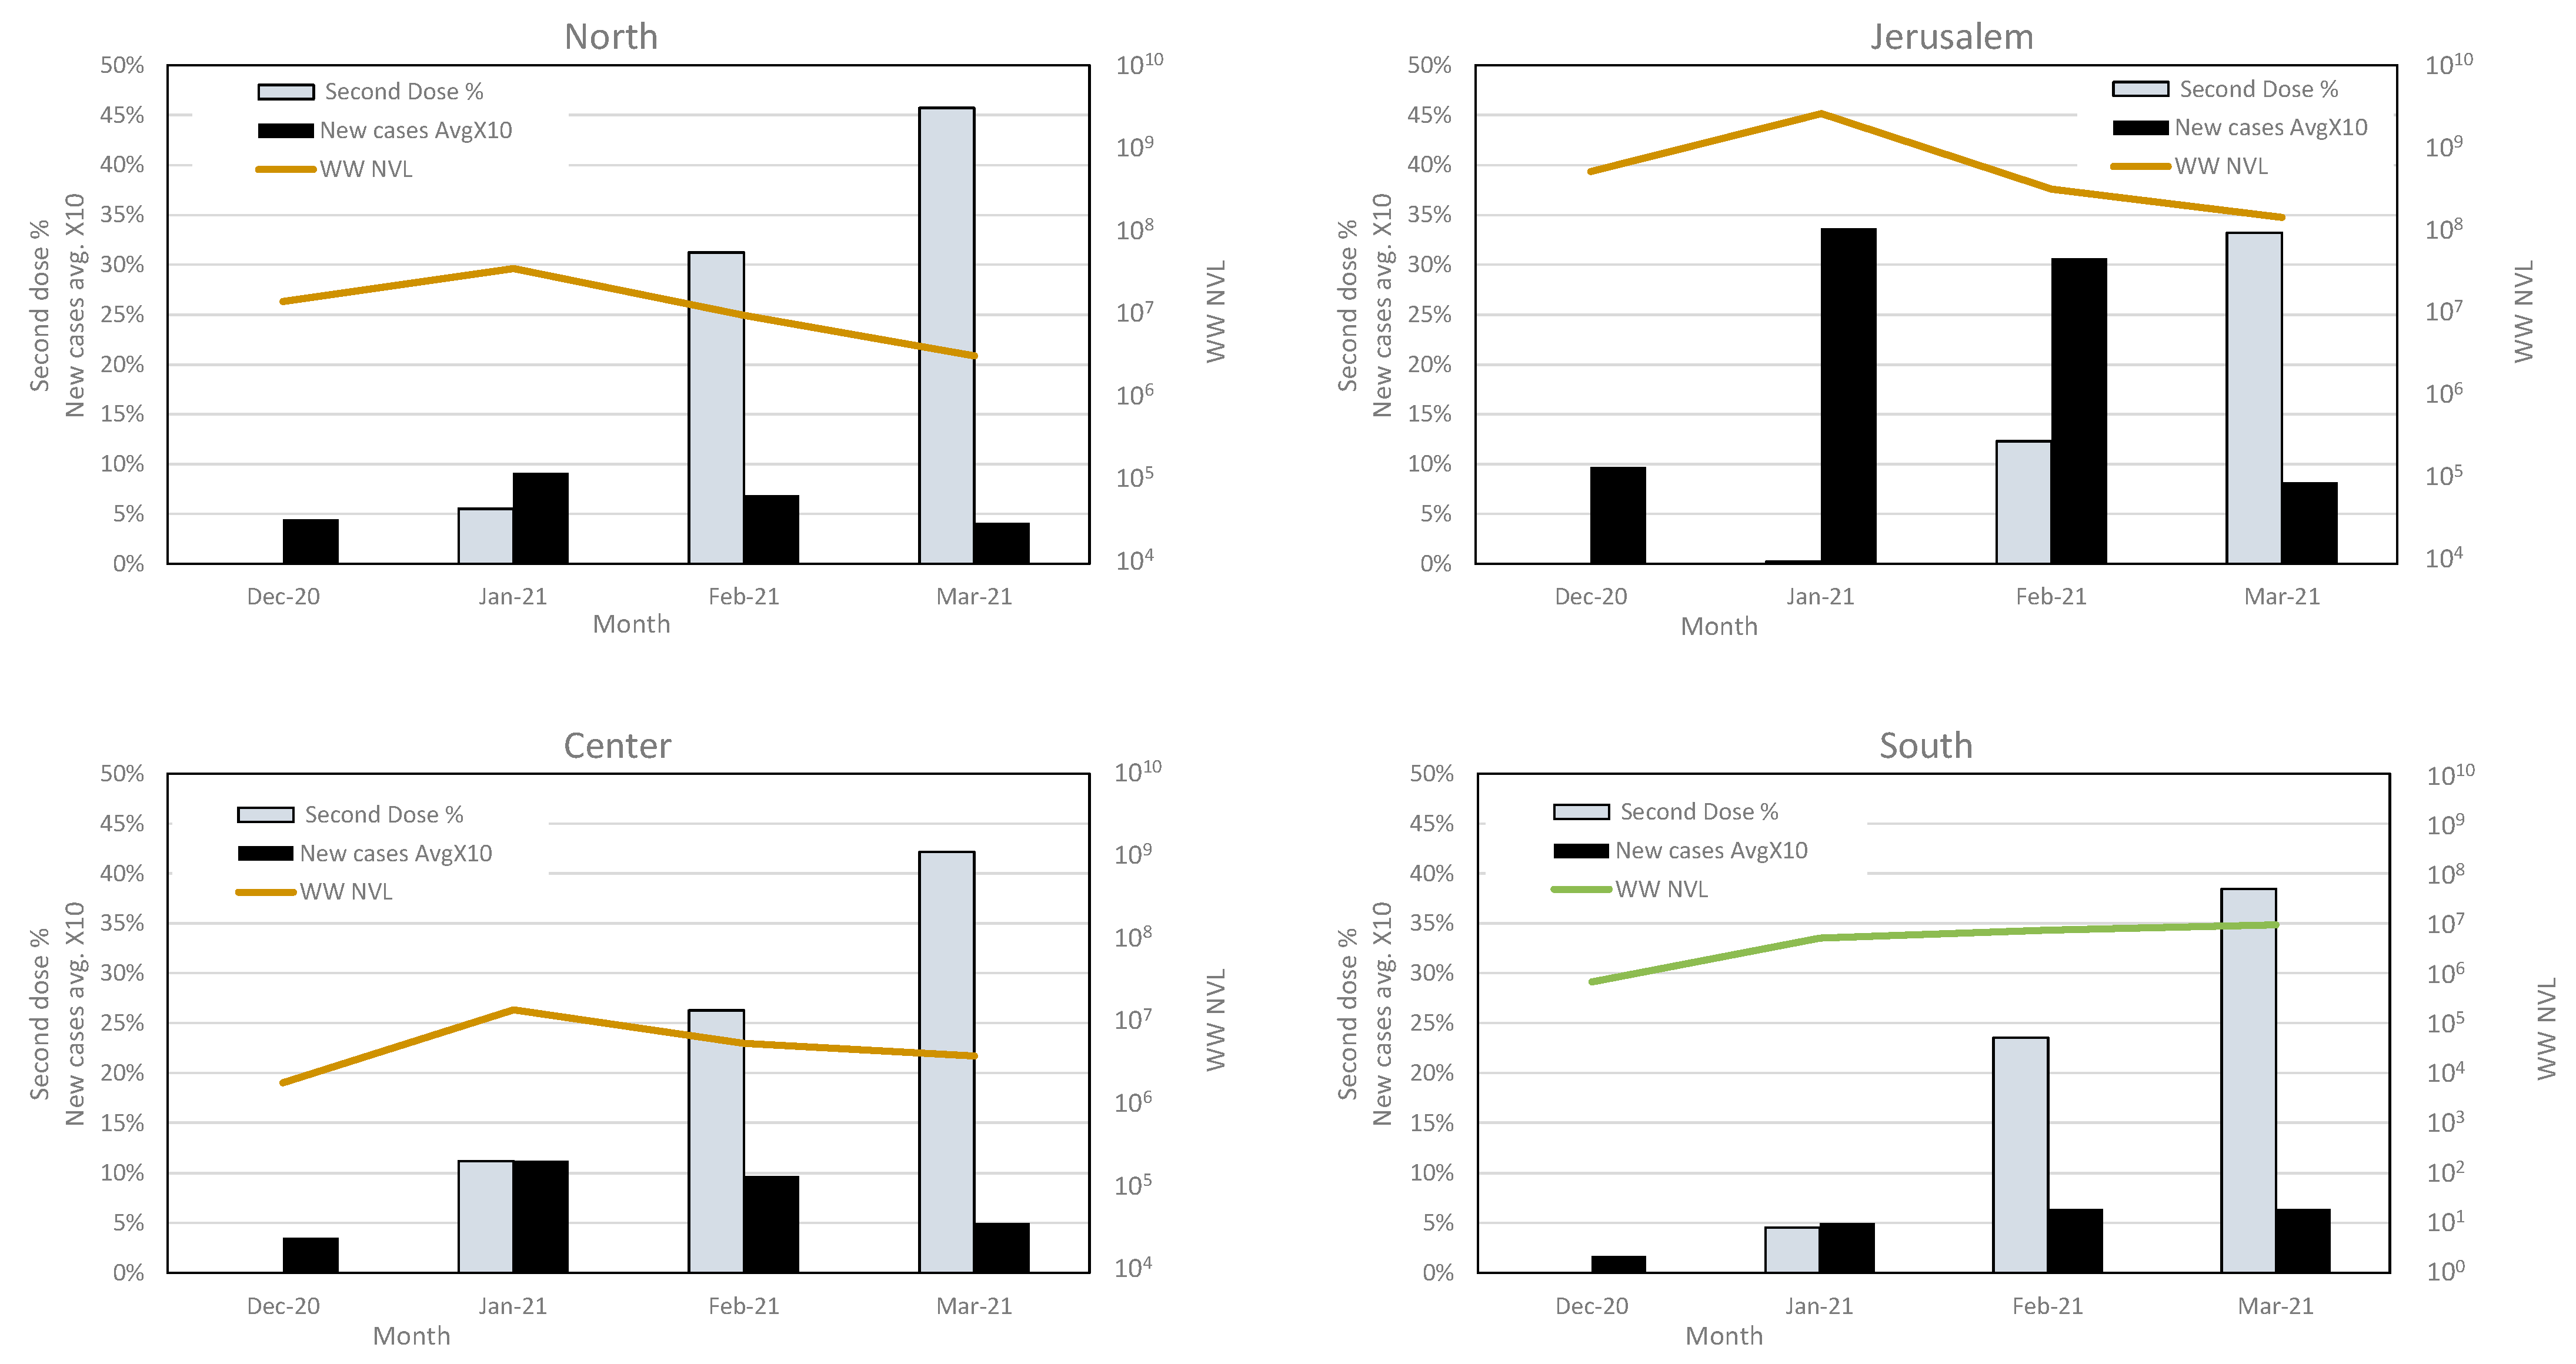
3.4. Variant Dynamics with Respect to Clinical Samples Sequencing and Vaccination Status
4. Discussion
Supplementary Materials
Author Contributions
Funding
Institutional Review Board Statement
Informed Consent Statement
Data Availability Statement
Conflicts of Interest
Ethical Statement
References
- Tisdell, C.A. Economic, social and political issues raised by the COVID-19 pandemic. Econ. Anal. Policy 2020, 68, 17–28. [Google Scholar] [CrossRef] [PubMed]
- Buitrago-Garcia, D.; Egli-Gany, D.; Counotte, M.J.; Hossmann, S.; Imeri, H.; Ipekci, A.M.; Salanti, G.; Low, N. Occurrence and transmission potential of asymptomatic and presymptomatic SARSCoV-2 infections: A living systematic review and meta-analysis. PLoS Med. 2020, 17, e1003346. [Google Scholar] [CrossRef]
- Lu, X.; Wang, L.; Sakthivel, S.K.; Whitaker, B.; Murray, J.; Kamili, S.; Lynch, B.; Malapati, L.; Burke, S.A.; Harcourt, J.; et al. US CDC real-time reverse transcription PCR panel for detection of severe acute respiratory syndrome Coronavirus 2. Emerg. Infect. Dis. 2020, 26, 1654–1665. [Google Scholar] [CrossRef]
- Byambasuren, O.; Cardona, M.; Bell, K.; Clark, J.; McLaws, M.L.; Glasziou, P. Estimating the extent of asymptomatic COVID-19 and its potential for community transmission: Systematic review and meta-analysis. J. Assoc. Med. Microbiol. Infect. Dis. Can. 2020, 5, 223–234. [Google Scholar] [CrossRef]
- Mousazadeh, M.; Ashoori, R.; Paital, B.; Kabdaslı, I.; Frontistis, Z.; Hashemi, M.; Sandoval, M.A.; Sherchan, S.; Das, K.; Emamjomeh, M.M. Wastewater based epidemiology perspective as a faster protocol for detecting coronavirus rna in human populations: A review with specific reference to SARS-Cov-2 virus. Pathogens 2021, 10, 1008. [Google Scholar] [CrossRef]
- Rambaut, A.; Loman, N.; Pybus, O.; Barclay, W.; Barrett, J.; Carabelli, A.; Connor, T.; Peacock, T.; Robertson, D.L.; Volz, E. Preliminary Genomic Characterisation of an Emergent SARS-CoV-2 Lineage in the UK Defined by a Novel Set of Spike Mutations. 2020. Available online: https://virological.org/t/preliminary-genomic-characterisation-of-an-emergent-sars-cov-2-lineage-in-the-uk-defined-by-a-novel-set-of-spike-mutations/563 (accessed on 1 May 2022).
- Parasher, A. COVID-19: Current understanding of its Pathophysiology, Clinical presentation and Treatment. Postgrad. Med. J. 2021, 97, 312–320. [Google Scholar] [CrossRef]
- D’Aoust, P.M.; Graber, T.E.; Mercier, E.; Montpetit, D.; Alexandrov, I.; Neault, N.; Baig, A.T.; Mayne, J.; Zhang, X.; Alain, T.; et al. Catching a resurgence: Increase in SARS-CoV-2 viral RNA identified in wastewater 48 h before COVID-19 clinical tests and 96 h before hospitalizations. Sci. Total Environ. 2021, 770, 145319. [Google Scholar] [CrossRef] [PubMed]
- Nemudryi, A.; Nemudraia, A.; Wiegand, T.; Surya, K.; Buyukyoruk, M.; Cicha, C.; Vanderwood, K.K.; Wilkinson, R.; Wiedenheft, B. Temporal detection and phylogenetic assessment of SARS-CoV-2 in municipal wastewater. Cell Rep. Med. 2020, 1, 100098. [Google Scholar] [CrossRef] [PubMed]
- Peccia, J.; Zulli, A.; Brackney, D.E.; Grubaugh, N.D.; Kaplan, E.H.; Casanovas-massana, A.; Ko, A.I.; Malik, A.A.; Wang, D.; Wang, M.; et al. Measurement of SARS-CoV-2 RNA in wastewater tracks community infection dynamics. Nat. Biotechnol. 2020, 38, 1164–1167. [Google Scholar] [CrossRef] [PubMed]
- Wu, F.; Zhang, J.; Xiao, A.; Gu, X.; Lee, L.; Armas, F.; Kauffman, K. SARS-CoV-2 Titers in Wastewater Are Higher than Expected from clinically confirmed cases. mSystems 2020, 5, e00614-20. [Google Scholar] [CrossRef] [PubMed]
- Balboa, S.; Mauricio-Iglesias, M.; Rodriguez, S.; Martínez-Lamas, L.; Vasallo, F.J.; Regueiro, B.; Lema, J.M. The fate of SARS-Cov-2 in WWTPS points out the sludge line as a suitable spot for detection of COVID-19. Sci. Total Environ. 2021, 772, 145268. [Google Scholar] [CrossRef]
- Jafferali, M.H.; Khatami, K.; Atasoy, M.; Birgersson, M.; Williams, C.; Cetecioglu, Z. Benchmarking virus concentration methods for quantification of SARS-CoV-2 in raw wastewater. Sci. Total Environ. 2021, 755, 142939. [Google Scholar] [CrossRef]
- Bertrand, I.; Challant, J.; Jeulin, H.; Hartard, C.; Mathieu, L.; Lopez, S.; Schvoerer, E.; Courtois, S.; Gantzer, C. Epidemiological surveillance of SARS-CoV-2 by genome quantification in wastewater applied to a city in the northeast of France: Comparison of ultrafiltration- and protein precipitation-based methods. Int. J. Hyg. Environ. Health 2021, 233, 113692. [Google Scholar] [CrossRef]
- Westhaus, S.; Weber, F.A.; Schiwy, S.; Linnemann, V.; Brinkmann, M.; Widera, M.; Greve, C.; Janke, A.; Hollert, H.; Wintgens, T.; et al. Detection of SARS-CoV-2 in raw and treated wastewater in Germany—Suitability for COVID-19 surveillance and potential transmission risks. Sci. Total Environ. 2021, 751, 141750. [Google Scholar] [CrossRef]
- Medema, G.; Heijnen, L.; Italiaander, R.; Brouwer, A. Presence of SARS-Coronavirus-2 RNA in Sewage and Correlation with Reported COVID-19 Prevalence in the Early Stage of the Epidemic in The Netherlands. Environ. Sci. Technol. Lett. 2020, 7, 511–516. [Google Scholar] [CrossRef]
- Kumar, M.; Patel, A.K.; Shah, A.V.; Raval, J.; Rajpara, N.; Joshi, M.; Joshi, C.G. First proof of the capability of wastewater surveillance for COVID-19 in India through detection of genetic material of SARS-CoV-2. Sci. Total Environ. 2020, 746, 141326. [Google Scholar] [CrossRef]
- Sangsanont, J.; Rattanakul, S.; Kongprajug, A.; Chyerochana, N.; Sresung, M.; Sriporatana, N.; Wanlapakorn, N.; Poovorawan, Y.; Mongkolsuk, S.; Sirikanchana, K. SARS-CoV-2 RNA surveillance in large to small centralized wastewater treatment plants preceding the third COVID-19 resurgence in Bangkok, Thailand. Sci. Total Environ. 2021, 809, 151169. [Google Scholar] [CrossRef]
- Ahmed, W.; Bertsch, P.M.; Bivins, A.; Bibby, K.; Farkas, K.; Gathercole, A.; Haramoto, E.; Gyawali, P.; Korajkic, A.; Mcminn, B.R.; et al. Comparison of virus concentration methods for the RT-qPCR-based recovery of murine hepatitis virus, a surrogate for SARS-CoV-2 from untreated wastewater. Sci. Total Environ. 2020, 739, 139960. [Google Scholar] [CrossRef]
- O’Keeffe, J. Wastewater-based epidemiology: Current uses and future opportunities as a public health surveillance tool. Environ. Health Rev. 2021, 64, 44–52. [Google Scholar] [CrossRef]
- Wade, M.J.; Lo Jacomo, A.; Armenise, E.; Brown, M.R.; Bunce, J.T.; Cameron, G.J.; Fang, Z.; Farkas, K.; Gilpin, D.F.; Graham, D.W.; et al. Understanding and managing uncertainty and variability for wastewater monitoring beyond the pandemic: Lessons learned from the United Kingdom national COVID-19 surveillance programmes. J. Hazard. Mater. 2022, 424, 127456. [Google Scholar] [CrossRef]
- Martínez-García, L.; Espinel, M.A.; Abreu, M.; González-Alba, J.M.; Gijón, D.; McGee, A.; Cantón, R.; Galán, J.C.; Aranaz, J. Emergence and spread of b.1.1.7 lineage in primary care and clinical impact in the morbi-mortality among hospitalized patients in madrid, spain. Microorganisms 2021, 9, 1517. [Google Scholar] [CrossRef] [PubMed]
- Khan, M.I.; Khan, Z.A.; Baig, M.H.; Ahmad, I.; Farouk, A.E.A.; Song, Y.G.; Dong, J.J. Comparative genome analysis of novel coronavirus (SARS-CoV-2) from different geographical locations and the effect of mutations on major target proteins: An in silico insight. PLoS ONE 2020, 15, e0238344. [Google Scholar] [CrossRef]
- Andrés, C.; Garcia-Cehic, D.; Gregori, J.; Piñana, M.; Rodriguez-Frias, F.; Guerrero-Murillo, M.; Esperalba, J.; Rando, A.; Goterris, L.; Codina, M.G.; et al. Naturally occurring SARS-CoV-2 gene deletions close to the spike S1/S2 cleavage site in the viral quasispecies of COVID19 patients. Emerg. Microbes Infect. 2020, 9, 1900–1911. [Google Scholar] [CrossRef]
- Vogels, C.B.F.; Breban, M.I.; Ott, I.M.; Alpert, T.; Petrone, M.E.; Watkins, A.E.; Kalinich, C.C.; Earnest, R.; Rothman, J.E.; de Jesus, J.G.; et al. Multiplex qPCR discriminates variants of concern to enhance global surveillance of SARS-CoV-2. PLoS Biol. 2021, 19, e3001236. [Google Scholar] [CrossRef]
- Rossman, H.; Shilo, S.; Meir, T.; Gorfine, M.; Shalit, U.; Segal, E. COVID-19 dynamics after a national immunization program in Israel. Nat. Med. 2021, 27, 1055–1061. [Google Scholar] [CrossRef]
- Erster, O.; Mendelson, E.; Levy, V.; Kabat, A.; Mannasse, B.; Asraf, H.; Azar, R.; Ali, Y.; Shirazi, R.; Bucris, E.; et al. Rapid and High-Throughput Reverse Transcriptase Quantitative PCR (RT-qPCR) Assay for Identification and Differentiation between SARS-CoV-2 Variants B.1.1.7 and B.1.351. Microbiol. Spectr. 2021, 9, e00506-21. [Google Scholar] [CrossRef] [PubMed]
- Dare, R.K.; Fry, A.M.; Chittaganpitch, M.; Sawanpanyalert, P.; Olsen, S.J.; Erdman, D.D. Human coronavirus infections in rural Thailand: A comprehensive study using real-time reverse-transcription polymerase chain reaction assays. J. Infect. Dis. 2007, 196, 1321–1328. [Google Scholar] [CrossRef] [Green Version]
- Corman, V.M.; Eckerle, I.; Bleicker, T.; Zaki, A.; Landt, O.; Eschbach-Bludau, M.; van Boheemen, S.; Gopal, R.; Ballhause, M.; Bestebroer, T.M.; et al. Detection of a novel human coronavirus by real-time reverse-transcription polymerase chain reaction. Eurosurveillance 2012, 17, 20285. [Google Scholar] [CrossRef] [Green Version]
- Yaniv, K.; Shagan, M.; Lewis, Y.E.; Kramarsky-Winter, E.; Weil, M.; Indenbaum, V.; Elul, M.; Erster, O.; Brown, A.S.; Mendelson, E.; et al. City-level SARS-CoV-2 sewage surveillance. Chemosphere 2021, 283, 131194. [Google Scholar] [CrossRef]
- Tran, H.N.; Le, G.T.; Nguyen, D.T.; Juang, R.S.; Rinklebe, J.; Bhatnagar, A.; Lima, E.C.; Iqbal, H.M.N.; Sarmah, A.K.; Chao, H.P. SARS-CoV-2 coronavirus in water and wastewater: A critical review about presence and concern. Environ. Res. 2021, 193, 110265. [Google Scholar] [CrossRef] [PubMed]
- Cluzel, N.; Courbariaux, M.; Wang, S.; Moulin, L.; Wurtzer, S.; Bertrand, I.; Laurent, K.; Monfort, P.; Gantzer, C.; Guyader, S.L.; et al. A nationwide indicator to smooth and normalize heterogeneous SARS-CoV-2 RNA data in wastewater. Environ. Int. 2022, 158, 106998. [Google Scholar] [CrossRef] [PubMed]
- Sam, I.; Chong, Y.M.; Abdullah, A.; Fu, J.Y.L.; Shahnaz Hasan, M.; Jamaluddin, F.H.; Kamarulzaman, A.; Lim, K.K.; Nor, M.A.M.; Pang, Y.K.; et al. Changing predominant SARS-CoV-2 lineages drive successive COVID-19 waves in Malaysia, February 2020 to March 2021. J. Med. Virol. 2021, 94, 1146–1153. [Google Scholar] [CrossRef] [PubMed]
- Fuqua, J.L.; Rouchka, E.C.; Waigel, S.; Sokoloski, K.; Chung, D.; Zacharias, W.; Zhang, M.; Chariker, J.; Talley, D.; Santisteban, I.; et al. A rapid assessment of wastewater for genomic surveillance of SARS-CoV-2 variants at sewershed scale in Louisville, KY. MedRxiv Prepr. Serv. Health Sci. 2021, 1–12. [Google Scholar] [CrossRef]
- Yaniv, K.; Ozer, E.; Shagan, M.; Lakkakula, S.; Plotkin, N.; Bhandarkar, N.S.; Kushmaro, A. Direct RT-qPCR assay for SARS-CoV-2 variants of concern (Alpha, B.1.1.7 and Beta, B.1.351) detection and quantification in wastewater. Environ. Res. 2021, 201, 111653. [Google Scholar] [CrossRef]
- Peterson, S.W.; Lidder, R.; Daigle, J.; Wonitowy, Q.; Dueck, C.; Nagasawa, A.; Mulvey, M.R.; Mangat, C.S. RT-qPCR detection of SARS-CoV-2 mutations S 69–70 del, S N501Y and N D3L associated with variants of concern in Canadian wastewater samples. Sci. Total Environ. 2021, 810, 151283. [Google Scholar] [CrossRef]
- Martin, D.P.; Weaver, S.; Tegally, H.; San, J.E.; Shank, S.D.; Wilkinson, E.; Lucaci, A.G.; Giandhari, J.; Naidoo, S.; Pillay, Y.; et al. The emergence and ongoing convergent evolution of the SARS-CoV-2 N501Y lineages. Cell 2021, 184, 5189–5200. [Google Scholar] [CrossRef]
- Yaniv, K.; Ozer, E.; Lewis, Y.; Kushmaro, A. RT-qPCR assays for SARS-CoV-2 variants of concern in wastewater reveals compromised vaccination-induced immunity. Water Res. J. 2021, 207, 117808. [Google Scholar] [CrossRef]
- Bar-Or, I.; Weil, M.; Indenbaum, V.; Bucris, E.; Bar-Ilan, D.; Elul, M.; Levi, N.; Aguvaev, I.; Cohen, Z.; Shirazi, R.; et al. Detection of SARS-CoV-2 variants by genomic analysis of wastewater samples in Israel. Sci. Total Environ. 2021, 789, 148002. [Google Scholar] [CrossRef]
- Izquierdo-Lara, R.; Elsinga, G.; Heijnen, L.; Oude Munnink, B.B.; Schapendonk, C.M.E.; Nieuwenhuijse, D.; Kon, M.; Lu, L.; Aarestrup, F.M.; Lycett, S.; et al. Monitoring SARS-CoV-2 circulation and diversity through community wastewater sequencing, the netherlands and belgium. Emerg. Infect. Dis. 2021, 27, 1405–1415. [Google Scholar] [CrossRef] [PubMed]
- Erster, O.; Mendelson, E.; Kabat, A.; Levy, V.; Menasheh, B.; Asraf, H.; Sofer, D.; Fleishon, S.; Zuckerman, N.S.; Bar-or, I. Specific detection of SARS-CoV-2 variants B. 1.1.7 (alpha) and B. 1.617.2 (delta) using a one step quantitative PCR assay. MedRxiv 2021, 7, 1–26. [Google Scholar] [CrossRef]

| Primer Name | Sequence (5′->3′) and Modifications |
|---|---|
| Corona-OC-43-F | CGATGAGGCTATTCCGACTAGGT |
| Corona-OC-43-R | CCTTCCTGAGCCTTCAATATAGTAACC |
| Corona-OC-43-P | TEXASRed-TCCGCCTGGCACGGTACTCCCT-BHQ2 |
| E-Sarbeco F1b | GTTAATAGCGTACTTCTTTTTCTTGC |
| E_Sarbeco_R2 | ATATTGCAGCAGTACGCACACA |
| E_Sarbeco_P1 | FAM-6-ACACTAGCCATCCTTACTGCGCTTCG-BHQ1 |
| 28258D3L WT Fwd | AAACGAACAAACTAAAATGTCTGAT |
| 28257 N D3L VOC Fwd | TAAACGAACAAACTAAATGTCTCTA |
| 2019-nCoV_N1-R | TCTGGTTACTGCCAGTTGAATCTG |
| 2019-nCoV_N1-P | Hex-ACCCCGCATTACGTTTGGTGGACC-BHQ1 |
| OC43 pT7 29363F | TAATACGACTCACTATAGGG GGTACTGGTACAGACACAACAGAC 1 |
| OC43 29960 Rev | CCACCAAAATTCTGATTAGGGCCTC |
| T7 nCoV 26067 Fwd | TAATACGACTCACTATAGGG GTACAGACACTGGTGTTGAACATG 1 |
| nCoV 26441 Rev | CTCTAGAAGAATTCAGATTTTTAACACG |
| pT7 nCoV 28225 F | TAATACGACTCACTATAGGG GAAGACTTTTTAGAGTATCATGAC 1 |
| COV19 29577 Rev | CCATCTGCCTTGTGTGGTCTGCATG |
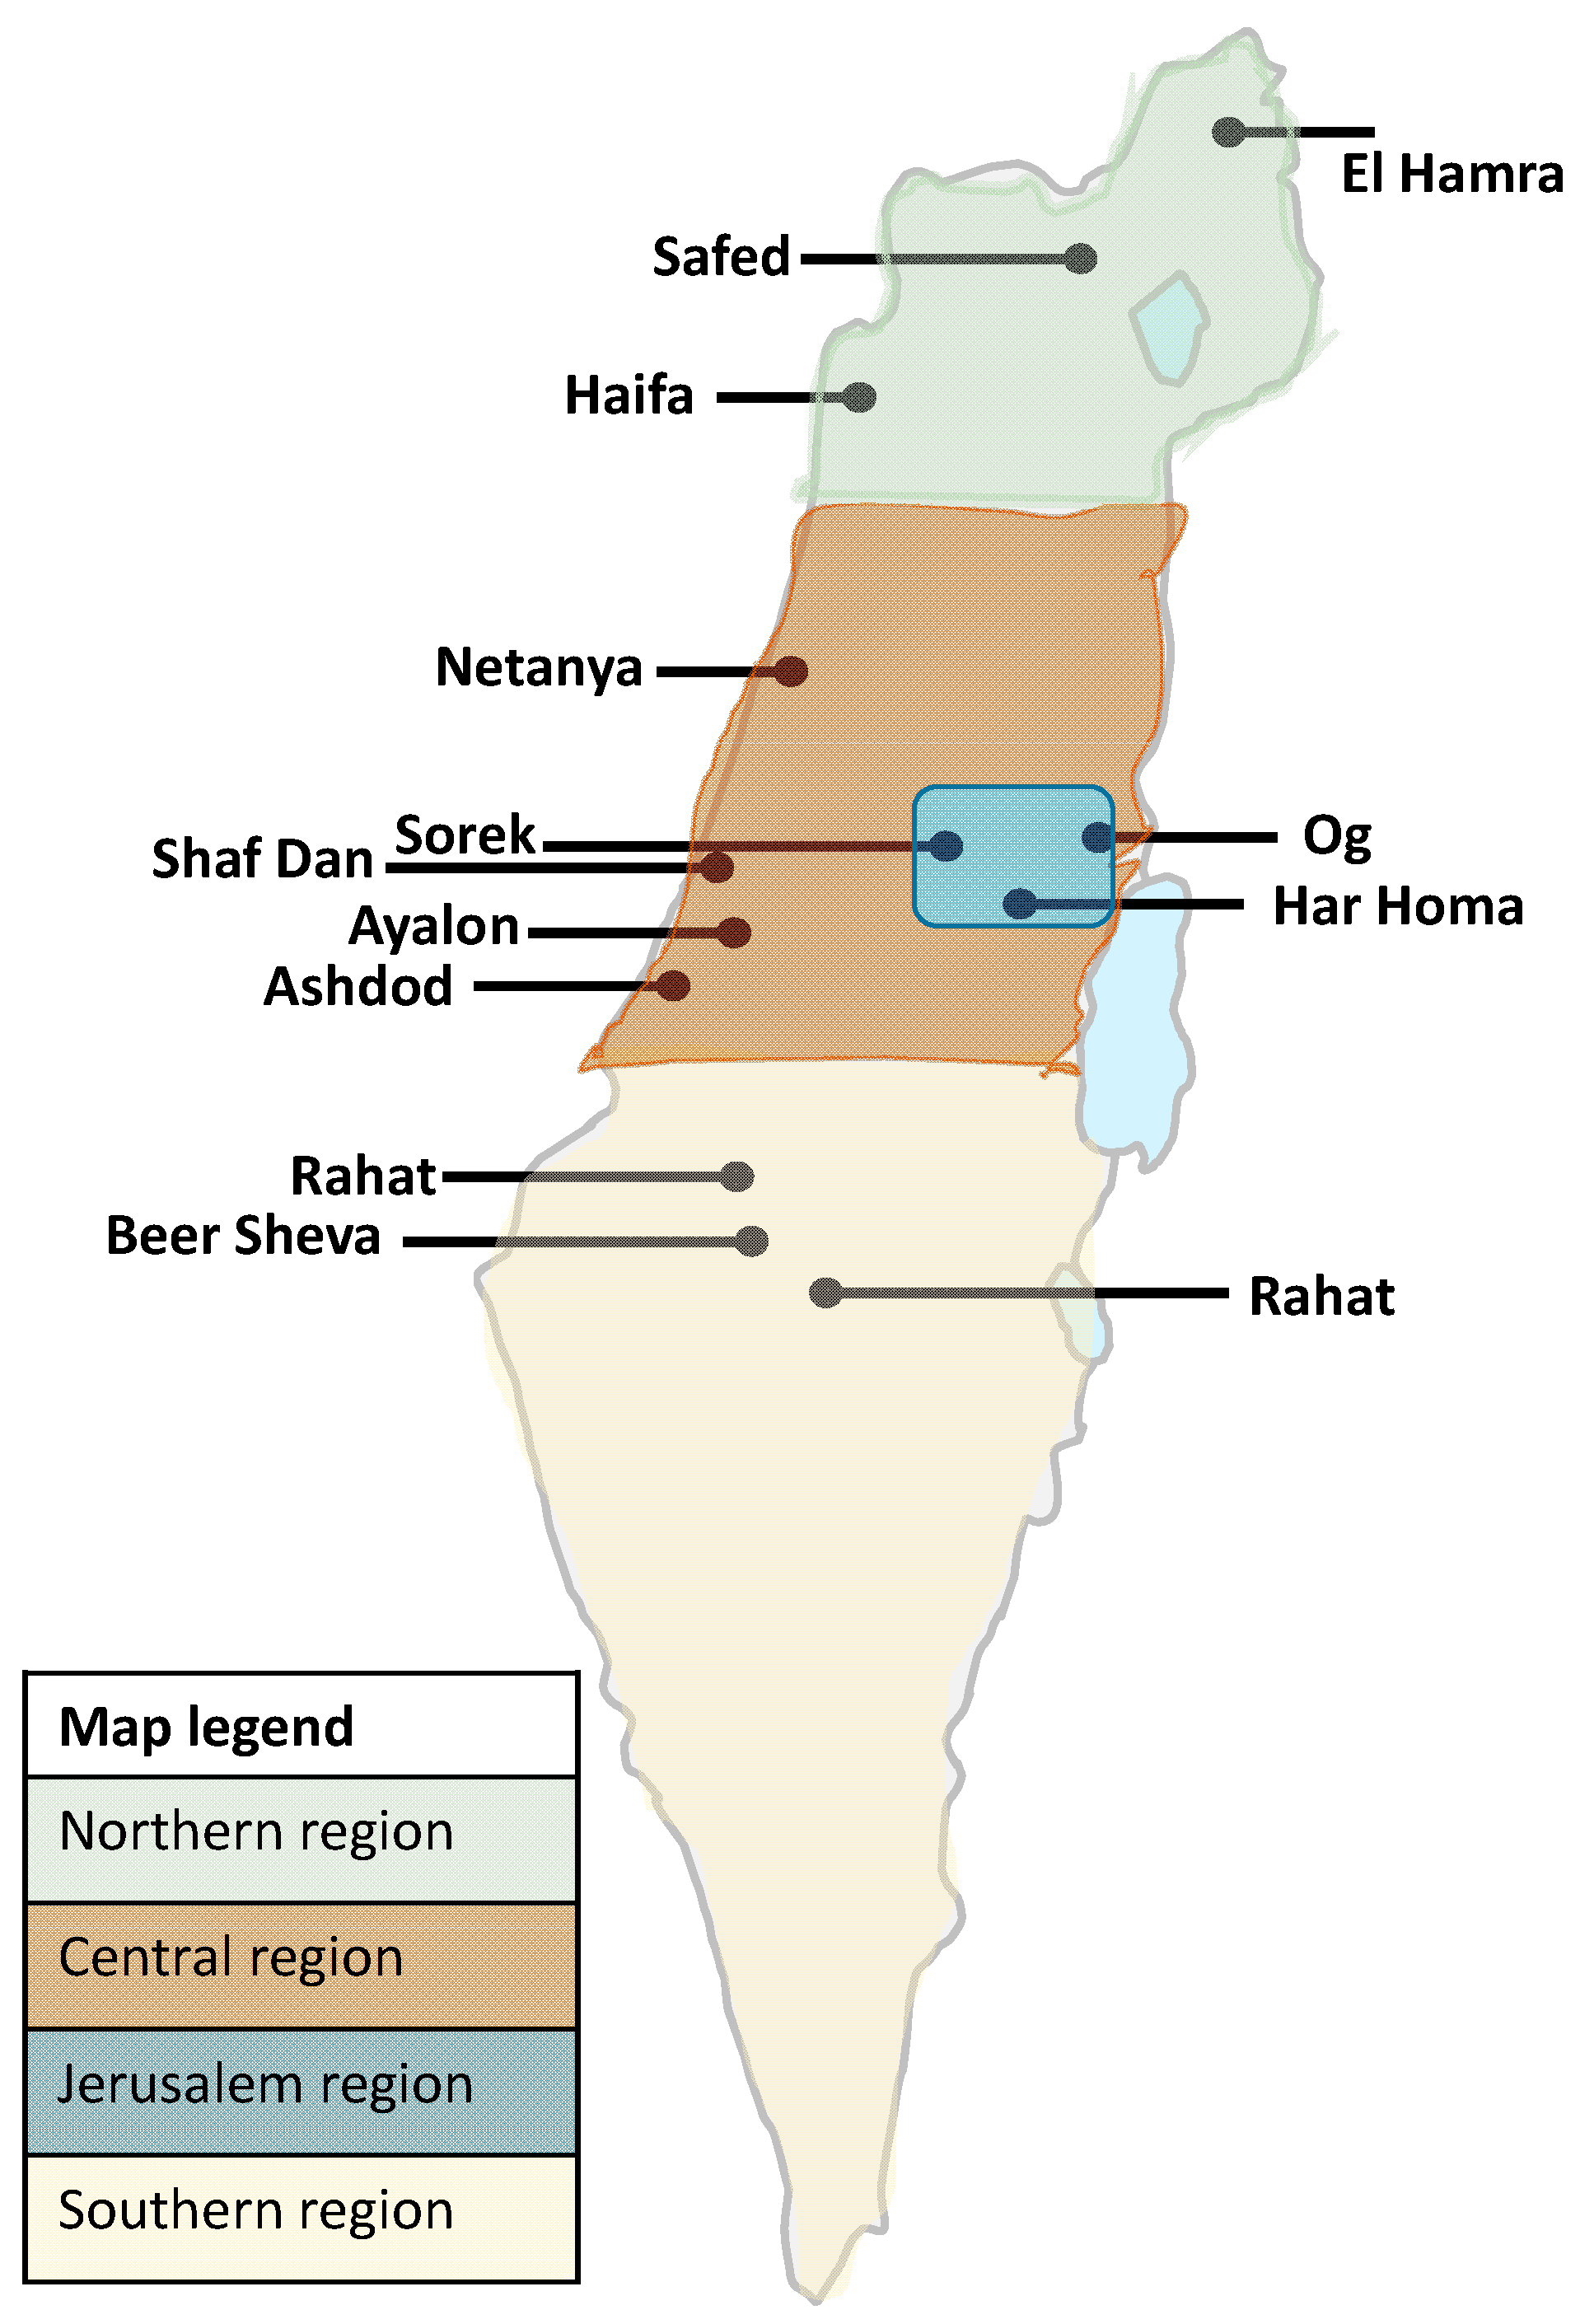
| WWTP Name | Population | Flux (Cubic Meters Per Day) | Region |
|---|---|---|---|
| El Hamra | 21,504 | 2240 | North |
| Haifa | 583,147 | 100,000 | |
| Safed | 36,933 | 4400 | |
| Netanya | 291,981 | 39,000 | Center |
| Shafdan | 2,291,901 | 390,000 | |
| Ayalon | 375,649 | 54,000 | |
| Ashdod | 225,939 | 31,100 | |
| Sorek | 873,267 | 108,167 | Jerusalem district |
| Og | 180,000 | 26,586 | |
| Har Homa | 31,250 | 5000 | |
| Be’er Sheva | 272,448 | 39,500 | South |
| Arara | 19,328 | 1700 | |
| Rahat | 77,335 | 4500 | |
| Total | 5,280,682 | 806,193 | Israel (9,291,000 population) |
| Month | First Dose Percent | |||
|---|---|---|---|---|
| North | Central | Jerusalem | South | |
| December 2020 | 2.30% | 6.50% | 1.30% | 0.00% |
| January 2021 | 27.00% | 28.70% | 13.50% | 19.00% |
| February 2021 | 46.10% | 41.40% | 21.20% | 35.30% |
| March 2021 | 58.30% | 53.50% | 41.90% | 48.50% |
| Second Dose Percent | ||||
| December 2020 | 0.00% | 0.00% | 0.00% | 0.00% |
| January 2021 | 5.50% | 11.20% | 0.20% | 4.50% |
| February 2021 | 31.30% | 26.30% | 12.30% | 23.50% |
| March 2021 | 45.70% | 42.20% | 33.20% | 38.50% |
| AVG 14 Days of New Cases | ||||
| December 2020 | 0.40% | 0.30% | 1.00% | 0.20% |
| January 2021 | 0.90% | 1.10% | 3.40% | 0.50% |
| February 2021 | 0.70% | 1.00% | 3.10% | 0.60% |
| March 2021 | 0.40% | 0.50% | 0.80% | 0.60% |
Publisher’s Note: MDPI stays neutral with regard to jurisdictional claims in published maps and institutional affiliations. |
© 2022 by the authors. Licensee MDPI, Basel, Switzerland. This article is an open access article distributed under the terms and conditions of the Creative Commons Attribution (CC BY) license (https://creativecommons.org/licenses/by/4.0/).
Share and Cite
Bar-Or, I.; Indenbaum, V.; Weil, M.; Elul, M.; Levi, N.; Aguvaev, I.; Cohen, Z.; Levy, V.; Azar, R.; Mannasse, B.; et al. National Scale Real-Time Surveillance of SARS-CoV-2 Variants Dynamics by Wastewater Monitoring in Israel. Viruses 2022, 14, 1229. https://doi.org/10.3390/v14061229
Bar-Or I, Indenbaum V, Weil M, Elul M, Levi N, Aguvaev I, Cohen Z, Levy V, Azar R, Mannasse B, et al. National Scale Real-Time Surveillance of SARS-CoV-2 Variants Dynamics by Wastewater Monitoring in Israel. Viruses. 2022; 14(6):1229. https://doi.org/10.3390/v14061229
Chicago/Turabian StyleBar-Or, Itay, Victoria Indenbaum, Merav Weil, Michal Elul, Nofar Levi, Irina Aguvaev, Zvi Cohen, Virginia Levy, Roberto Azar, Batya Mannasse, and et al. 2022. "National Scale Real-Time Surveillance of SARS-CoV-2 Variants Dynamics by Wastewater Monitoring in Israel" Viruses 14, no. 6: 1229. https://doi.org/10.3390/v14061229
APA StyleBar-Or, I., Indenbaum, V., Weil, M., Elul, M., Levi, N., Aguvaev, I., Cohen, Z., Levy, V., Azar, R., Mannasse, B., Shirazi, R., Bucris, E., Mor, O., Sela Brown, A., Sofer, D., Zuckerman, N. S., Mendelson, E., & Erster, O. (2022). National Scale Real-Time Surveillance of SARS-CoV-2 Variants Dynamics by Wastewater Monitoring in Israel. Viruses, 14(6), 1229. https://doi.org/10.3390/v14061229