
SARS-CoV-2 Disinfection of Air and Surface Contamination by TiO2 Photocatalyst-Mediated Damage to Viral Morphology, RNA, and Protein

 and
and 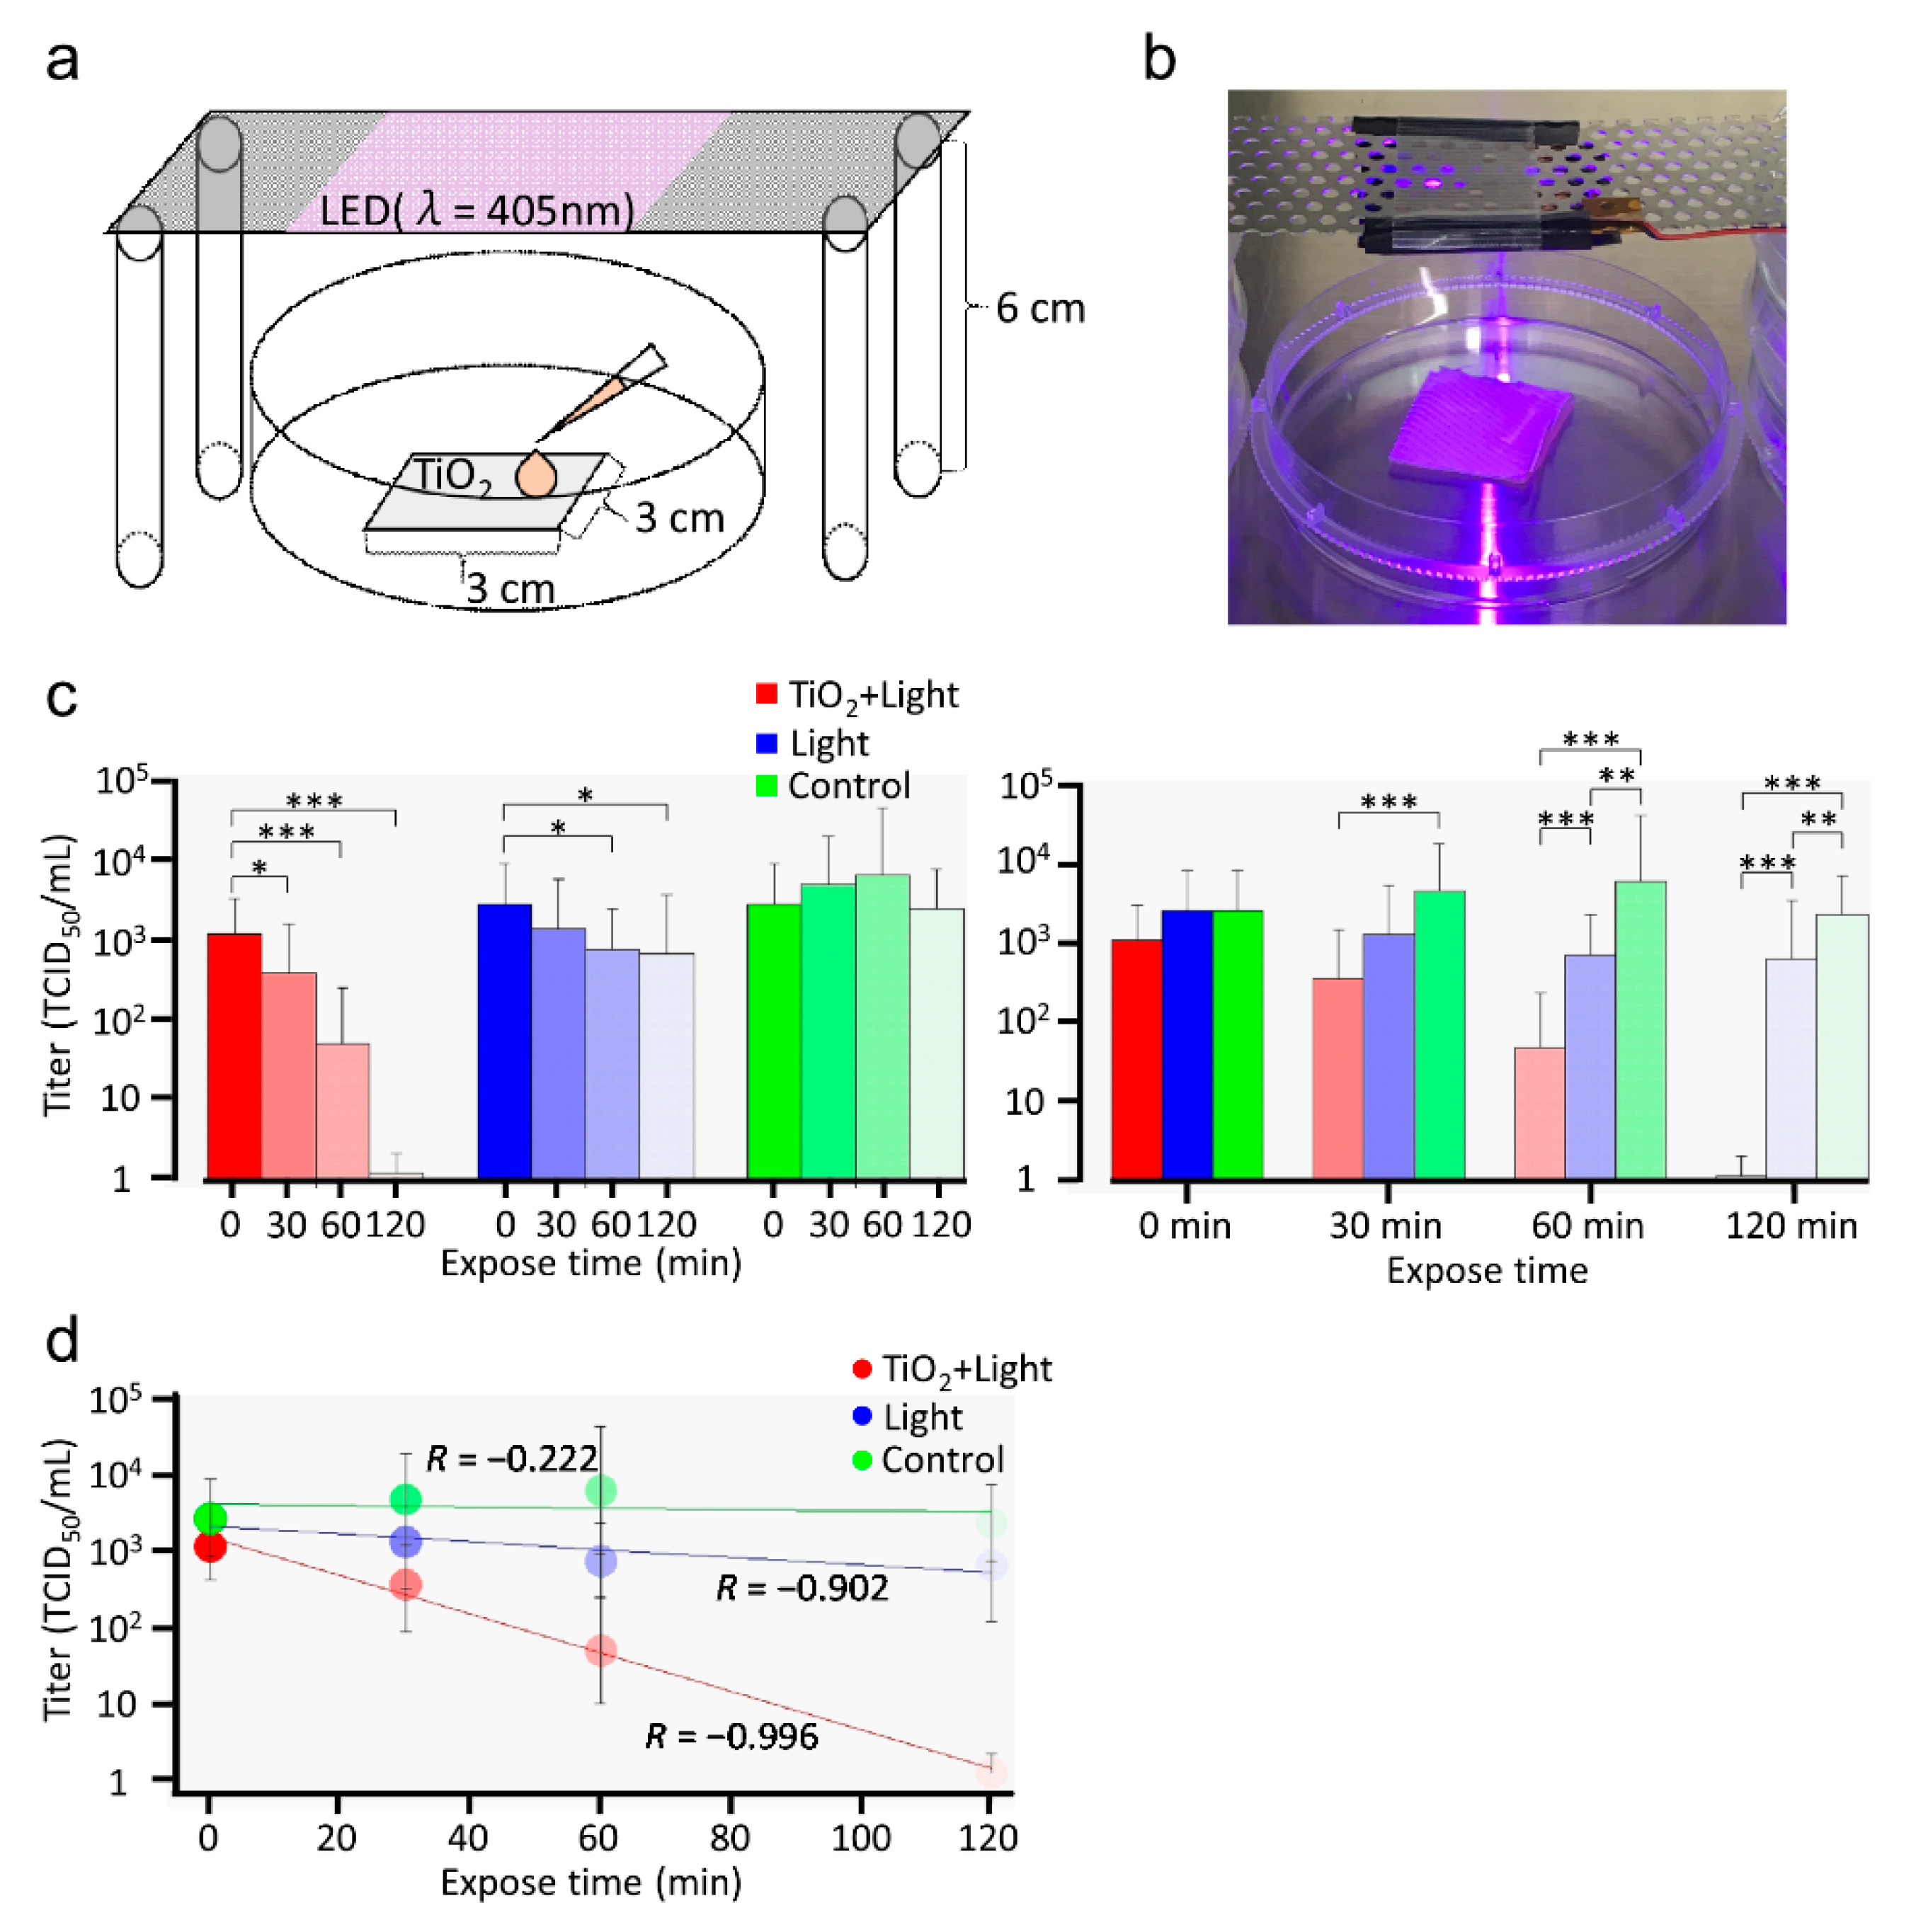
Abstract
1. Introduction
2. Materials and Methods
2.1. Cells and Viruses
2.2. Inactivation of SARS-CoV-2 in Liquid by the LED-TiO2 Photocatalytic Reaction
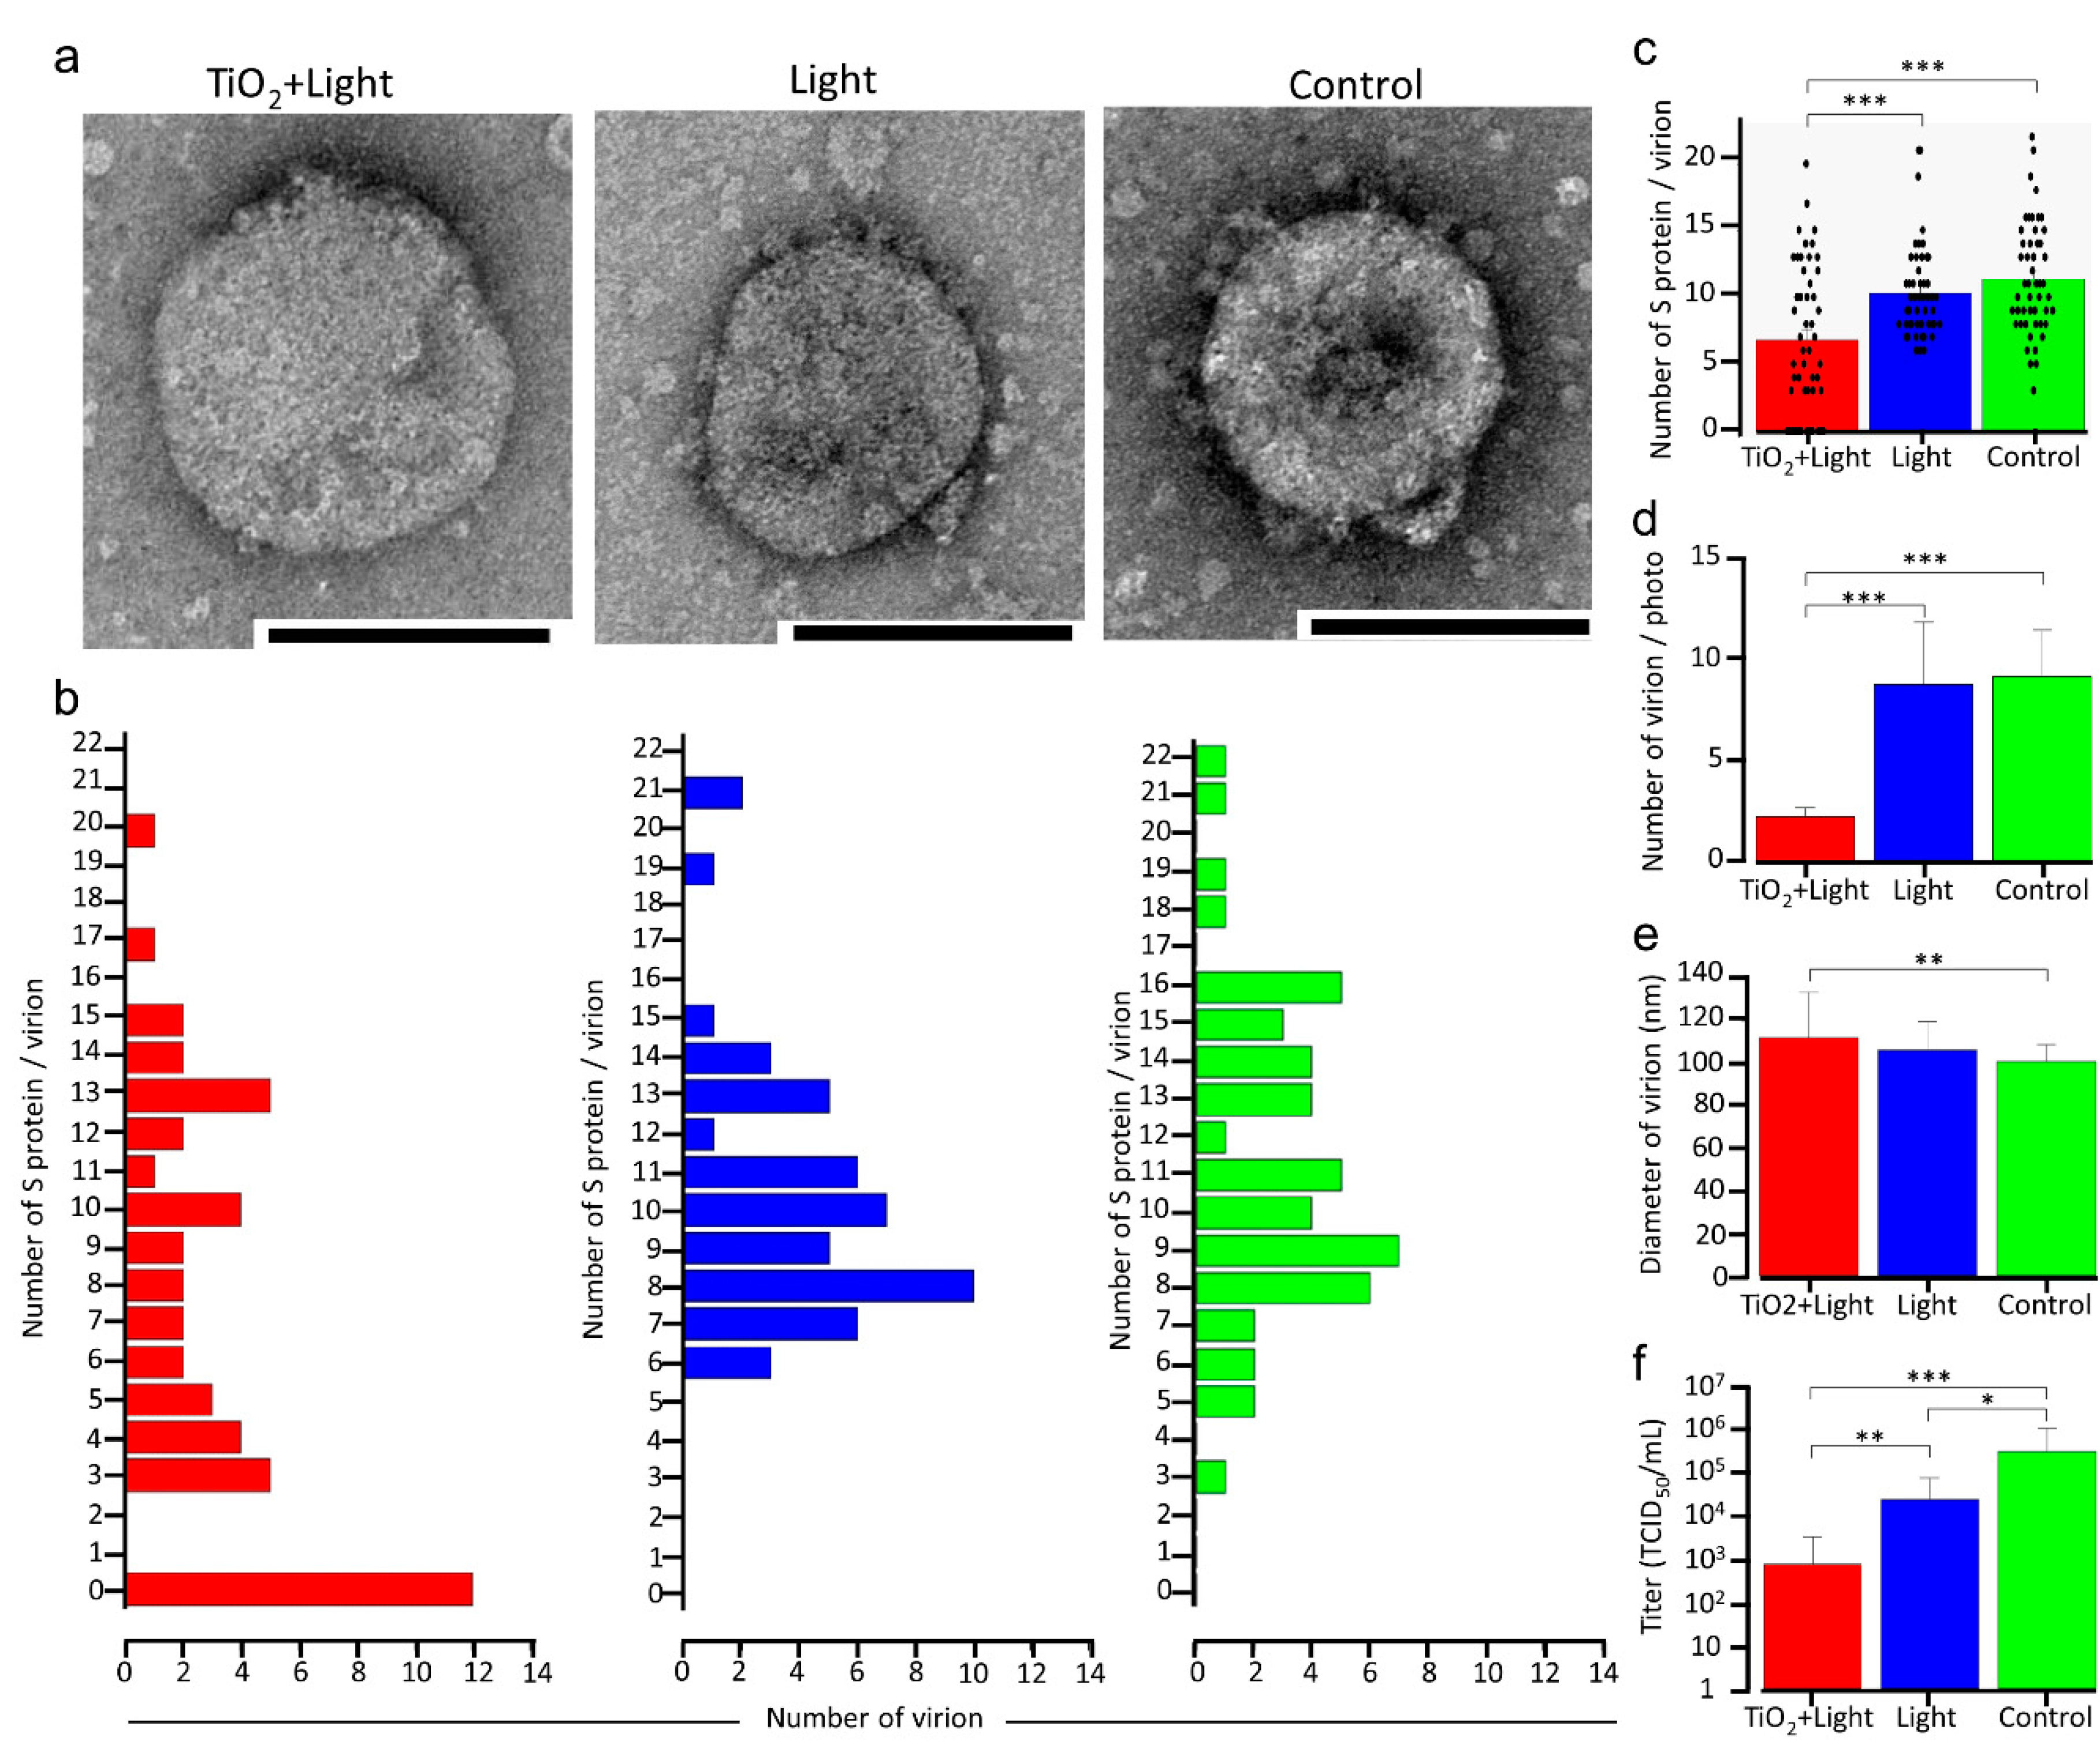
2.3. TEM
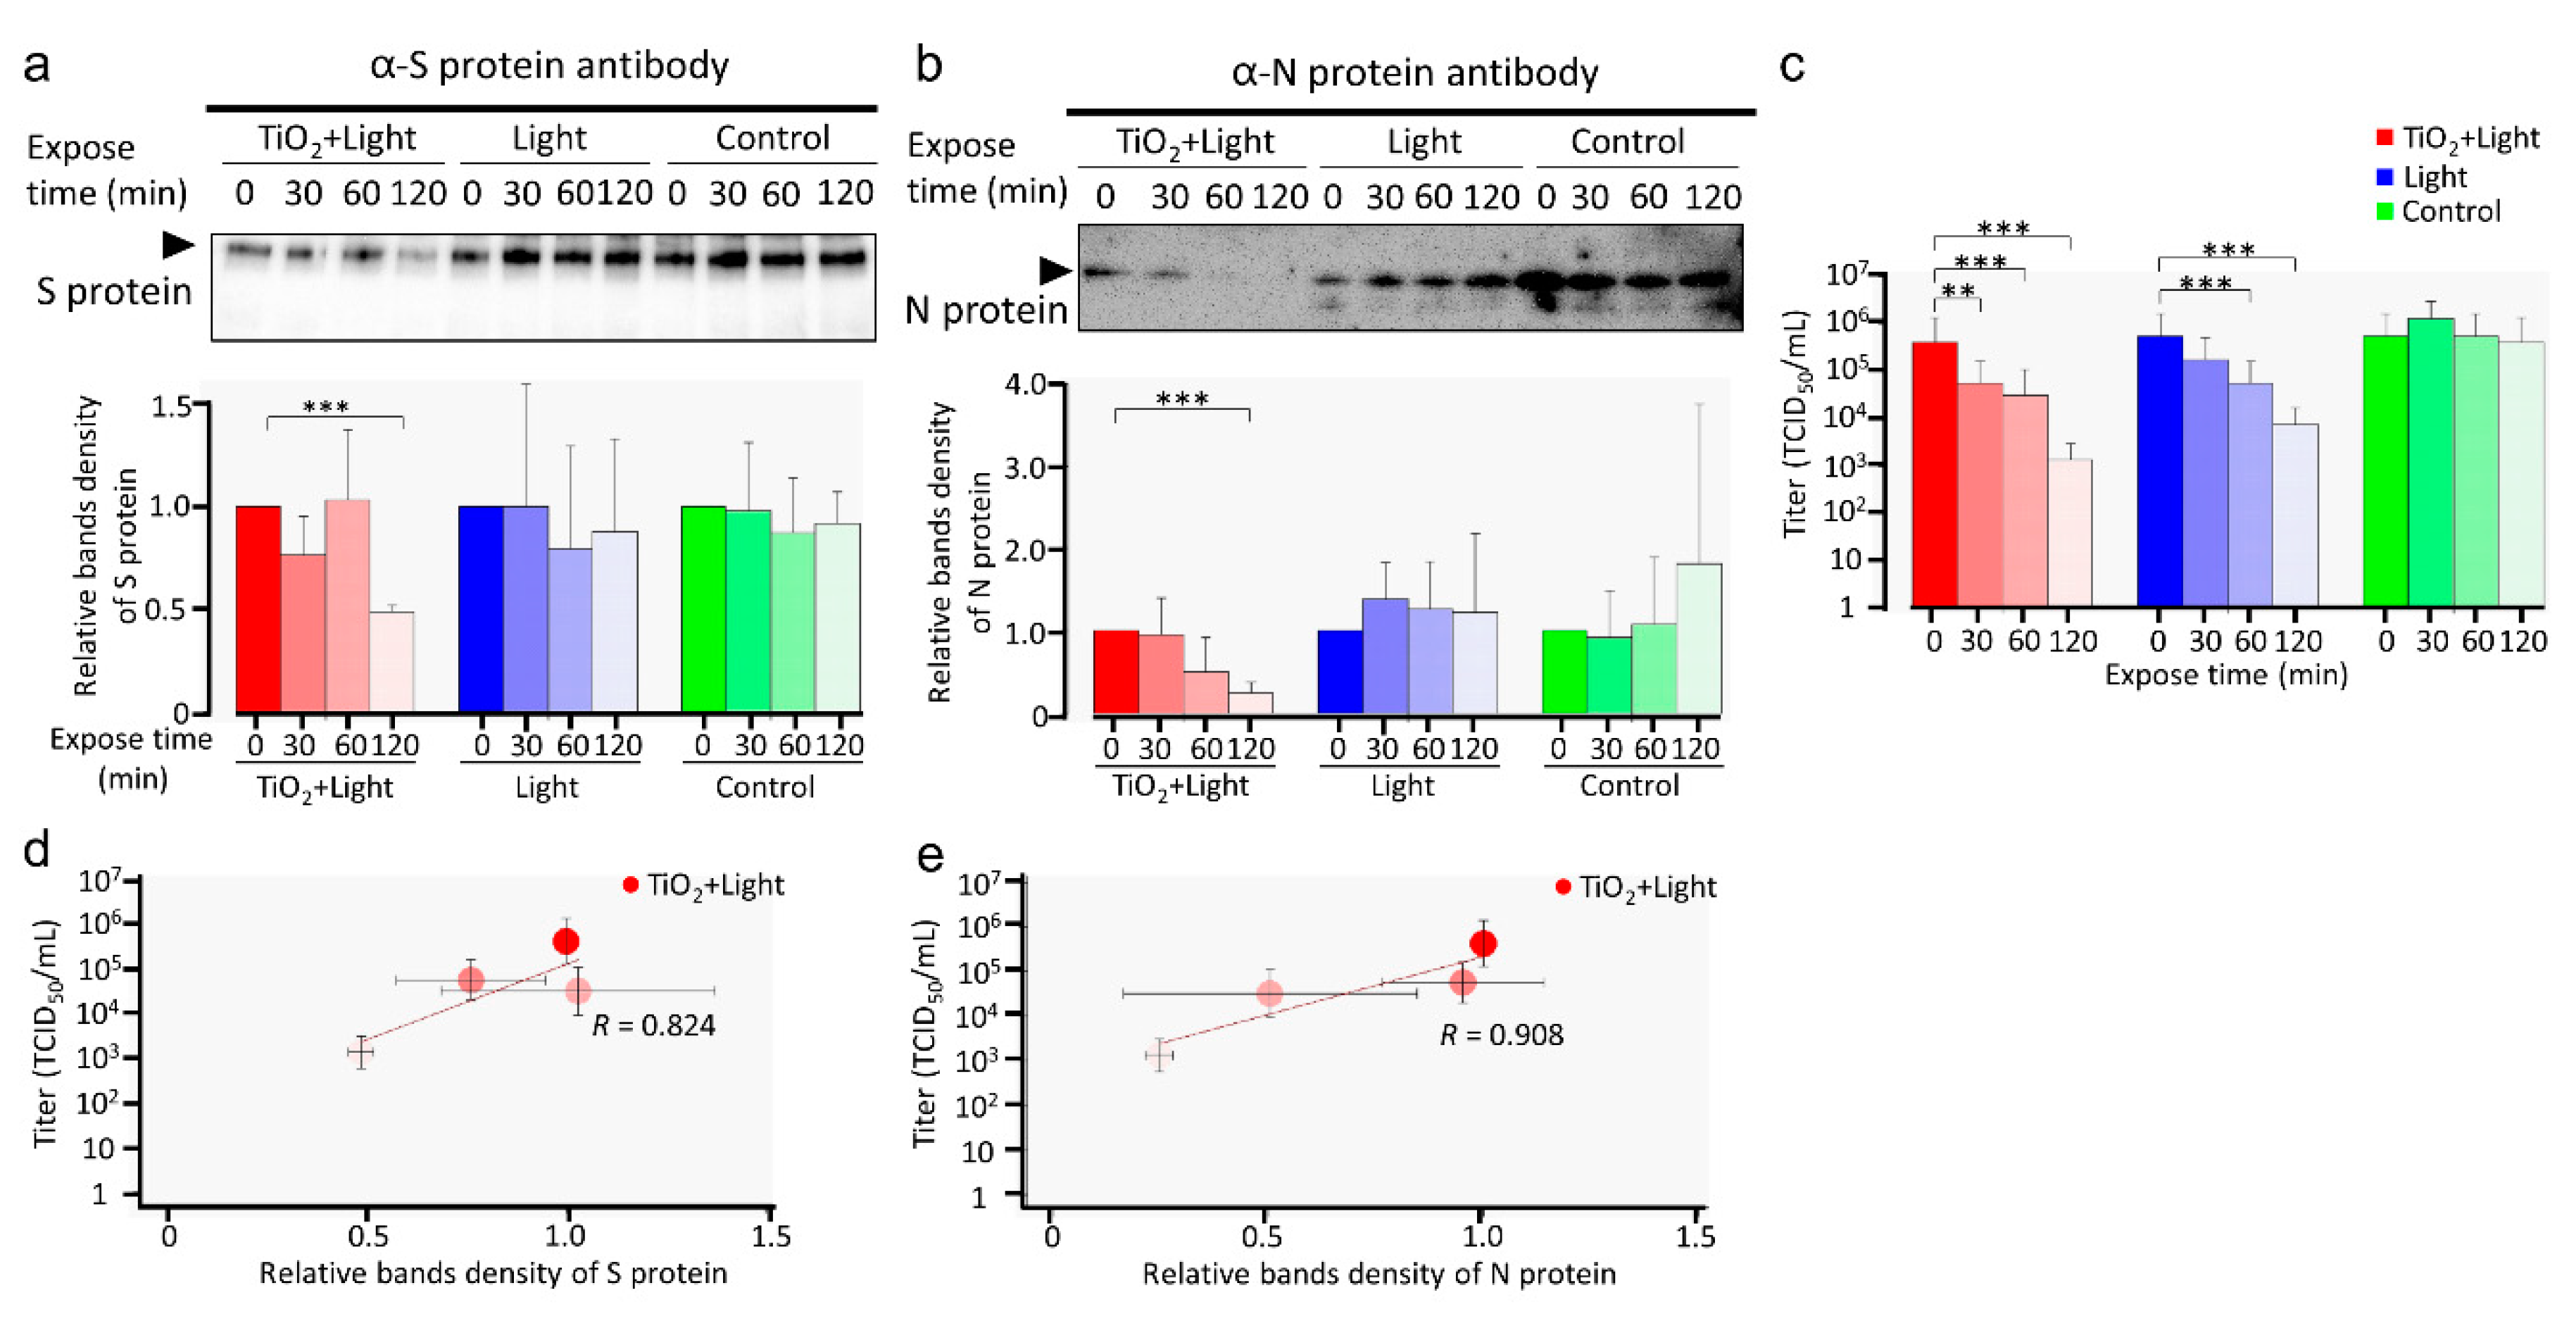
2.4. Western Blotting
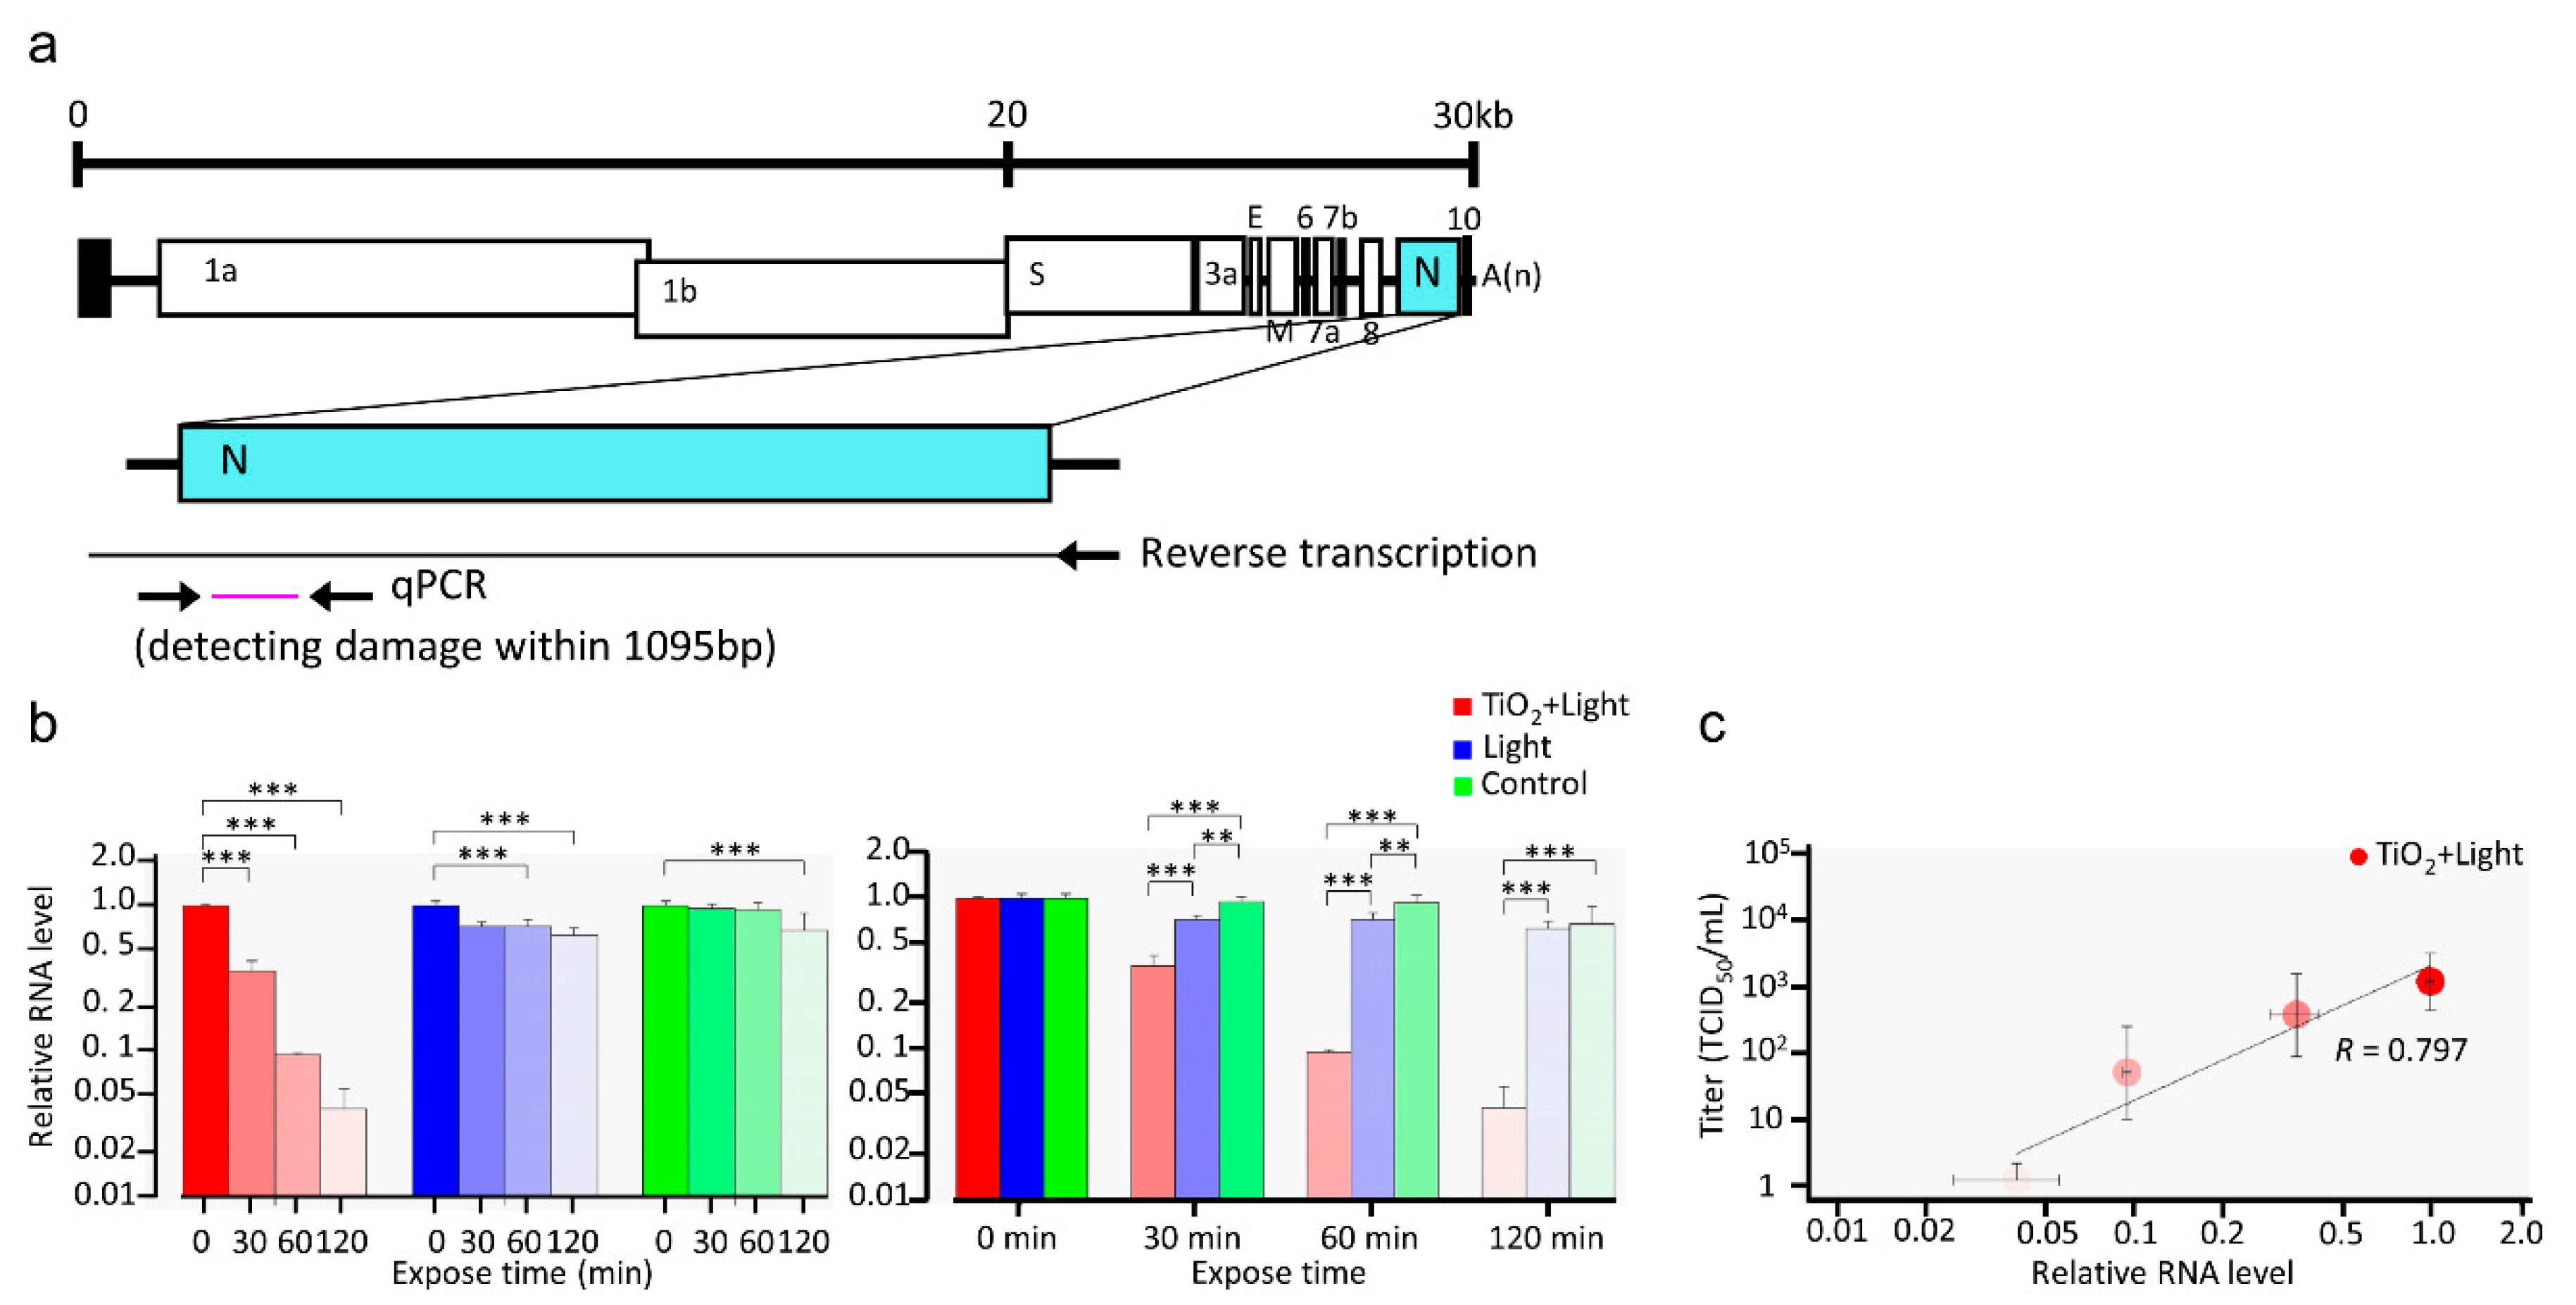
2.5. Reverse Transcription Quantitative PCR (RT-qPCR)
2.6. Inactivation of SARS-CoV-2 in Aerosol by LED-TiO2 Photocatalytic Reaction
2.7. Statistical Analysis
3. Results
3.1. LED-TiO2 Photocatalytic Inactivation of SARS-CoV-2 in Liquid
3.2. Mechanism of LED-TiO2 Photocatalytic Reaction-Induced SARS-CoV-2 Inactivation
3.3. LED-TiO2 Photocatalytic Reaction Inactivated SARS-CoV-2 in Aerosols
4. Discussions
Supplementary Materials
Author Contributions
Funding
Institutional Review Board Statement
Informed Consent Statement
Acknowledgments
Conflicts of Interest
References
- Wu, F.; Zhao, S.; Yu, B.; Chen, Y.M.; Wang, W.; Song, Z.G.; Hu, Y.; Tao, Z.W.; Tian, J.H.; Pei, Y.Y.; et al. A new coronavirus associated with human respiratory disease in China. Nature 2020, 579, 265–269. [Google Scholar] [CrossRef] [PubMed]
- Naqvi, A.A.T.; Fatima, K.; Mohammad, T.; Fatima, U.; Singh, I.K.; Singh, A.; Atif, S.M.; Hariprasad, G.; Hasan, G.M.; Hassan, M.I. Insights into SARS-CoV-2 genome, structure, evolution, pathogenesis and therapies: Structural genomics approach. Biochim. Biophys. Acta Mol. Basis. Dis. 2020, 1866, 165878. [Google Scholar] [CrossRef]
- Schoeman, D.; Fielding, B.C. Coronavirus envelope protein: Current knowledge. Virol. J. 2019, 16, 69. [Google Scholar] [CrossRef] [PubMed]
- Pal, M.; Berhanu, G.; Desalegn, C.; Kandi, V. Severe Acute Respiratory Syndrome Coronavirus-2 (SARS-CoV-2): An Update. Cureus 2020, 12, e7423. [Google Scholar] [CrossRef]
- van Doremalen, N.; Bushmaker, T.; Morris, D.H.; Holbrook, M.G.; Gamble, A.; Williamson, B.N.; Tamin, A.; Harcourt, J.L.; Thornburg, N.J.; Gerber, S.I.; et al. Aerosol and Surface Stability of SARS-CoV-2 as Compared with SARS-CoV-1. N. Engl. J. Med. 2020, 382, 1564–1567. [Google Scholar] [CrossRef] [PubMed]
- Kratzel, A.; Todt, D.; V’kovski, P.; Steiner, S.; Gultom, M.; Thao, T.T.N.; Ebert, N.; Holwerda, M.; Steinmann, J.; Niemeyer, D.; et al. Inactivation of Severe Acute Respiratory Syndrome Coronavirus 2 by WHO-Recommended Hand Rub Formulations and Alcohols. Emerg. Infect. Dis. 2020, 26, 1592–1595. [Google Scholar] [CrossRef] [PubMed]
- Anderson, D.E.; Sivalingam, V.; Kang, A.E.Z.; Ananthanarayanan, A.; Arumugam, H.; Jenkins, T.M.; Hadjiat, Y.; Eggers, M. Povidone-Iodine Demonstrates Rapid In Vitro Virucidal Activity Against SARS-CoV-2, The Virus Causing COVID-19 Disease. Infect. Dis. Ther. 2020, 9, 669–675. [Google Scholar] [CrossRef]
- Chin, A.W.H.; Chu, J.T.S.; Perera, M.R.A.; Hui, K.P.Y.; Yen, H.L.; Chan, M.C.W.; Peiris, M.; Poon, L.L.M. Stability of SARS-CoV-2 in different environmental conditions. Lancet Microbe 2020, 1, e10. [Google Scholar] [CrossRef]
- Ijaz, M.K.; Whitehead, K.; Srinivasan, V.; McKinney, J.; Rubino, J.R.; Ripley, M.; Jones, C.; Nims, R.W.; Charlesworth, B. Microbicidal actives with virucidal efficacy against SARS-CoV-2. Am. J. Infect. Control. 2020, 48, 972–973. [Google Scholar] [CrossRef]
- Saadatpour, F.; Mohammadipanah, F. Physicochemical susceptibility of SARS-CoV-2 to disinfection and physical approach of prophylaxis. Health Sci. Rep. 2020, 3, e213. [Google Scholar] [CrossRef]
- Kowalski, W.J. Ultraviolet Germicidal Irradiation Handbook; Springer: New York, NY, USA, 2009. [Google Scholar]
- Budowsky, E.I.; Bresler, S.E.; Friedman, E.A.; Zheleznova, N.V. Principles of selective inactivation of viral genome. I. UV-induced inactivation of influenza virus. Arch. Virol. 1981, 68, 239–247. [Google Scholar] [CrossRef] [PubMed]
- Lo, C.W.; Matsuura, R.; Iimura, K.; Wada, S.; Shinjo, A.; Benno, Y.; Nakagawa, M.; Takei, M.; Aida, Y. UVC disinfects SARS-CoV-2 by induction of viral genome damage without apparent effects on viral morphology and proteins. Sci. Rep. 2020, submitted. [Google Scholar]
- Heilingloh, C.S.; Aufderhorst, U.W.; Schipper, L.; Dittmer, U.; Witzke, O.; Yang, D.; Zheng, X.; Sutter, K.; Trilling, M.; Alt, M.; et al. Susceptibility of SARS-CoV-2 to UV irradiation. Am. J. Infect. Control. 2020, 48, 1273–1275. [Google Scholar] [CrossRef] [PubMed]
- Zaffina, S.; Camisa, V.; Lembo, M.; Vinci, M.R.; Tucci, M.G.; Borra, M.; Napolitano, A.; Cannatà, V. Accidental exposure to UV radiation produced by germicidal lamp: Case report and risk assessment. Photochem. Photobiol. 2012, 88, 1001–1004. [Google Scholar] [CrossRef]
- Foster, H.A.; Ditta, I.B.; Varghese, S.; Steele, A. Photocatalytic disinfection using titanium dioxide: Spectrum and mechanism of antimicrobial activity. Appl. Microbiol. Biotechnol. 2011, 90, 1847–1868. [Google Scholar] [CrossRef]
- Nakano, R.; Ishiguro, H.; Yao, Y.; Kajioka, J.; Fujishima, A.; Sunada, K.; Minoshima, M.; Hashimoto, K.; Kubota, Y. Photocatalytic inactivation of influenza virus by titanium dioxide thin film. Photochem. Photobiol. Sci. 2012, 11, 1293–1298. [Google Scholar] [CrossRef]
- Tong, Y.; Shi, G.; Hu, G.; Hu, X.; Han, L.; Xie, X.; Xu, Y.; Zhang, R.; Sun, J.; Zhong, J. Photo-catalyzed TiO(2) inactivates pathogenic viruses by attacking viral genome. Chem. Eng. J. 2021, 414, 128788. [Google Scholar] [CrossRef]
- Khaiboullina, S.; Uppal, T.; Dhabarde, N.; Subramanian, V.R.; Verma, S.C. Inactivation of Human Coronavirus by Titania Nanoparticle Coatings and UVC Radiation: Throwing Light on SARS-CoV-2. Viruses 2021, 13, 19. [Google Scholar] [CrossRef]
- Yoshizawa, N.; Ishihara, R.; Omiya, D.; Ishitsuka, M.; Hirano, S.; Suzuki, T. Application of a Photocatalyst as an Inactivator of Bovine Coronavirus. Viruses 2020, 12, 1372. [Google Scholar] [CrossRef]
- Park, D.; Shahbaz, H.M.; Kim, S.H.; Lee, M.; Lee, W.; Oh, J.W.; Lee, D.U.; Park, J. Inactivation efficiency and mechanism of UV-TiO2 photocatalysis against murine norovirus using a solidified agar matrix. Int. J. Food. Microbiol. 2016, 238, 256–264. [Google Scholar] [CrossRef]
- Han, W.; Zhang, B.; Cao, W.; Yang, D.; Taira, I.; Okamoto, Y.; Arai, J.I.; Yan, X. The inactivation effect of photocatalytic titanium apatite filter on SARS virus. Prog. Biochem. Biophys. 2004, 31, 982–985. [Google Scholar]
- Syngouna, V.I.; Chrysikopoulos, C.V. Inactivation of MS2 bacteriophage by titanium dioxide nanoparticles in the presence of quartz sand with and without ambient light. J. Colloid Interface Sci. 2017, 497, 117–125. [Google Scholar] [CrossRef]
- Briggiler Marcó, M.; Negro, A.C.; Alfano, O.M.; Quiberoni, A.D.L. New semi-pilot-scale reactor to study the photocatalytic inactivation of phages contained in aerosol. Environ. Sci. Pollut. Res. Int. 2018, 25, 21385–21392. [Google Scholar] [CrossRef]
- Tao, J.; Luttrell, T.; Batzill, M. A two-dimensional phase of TiO₂ with a reduced bandgap. Nat. Chem. 2011, 3, 296–300. [Google Scholar] [CrossRef]
- Bono, N.; Ponti, F.; Punta, C.; Candiani, G. Effect of UV Irradiation and TiO2-Photocatalysis on Airborne Bacteria and Viruses: An Overview. Materials 2021, 14, 1075. [Google Scholar] [CrossRef]
- Niu, M.; Cheng, D.; Cao, D. SiH/TiO2 and GeH/TiO2 heterojunctions: Promising TiO2-based photocatalysts under visible light. Sci. Rep. 2014, 4, 4810. [Google Scholar] [CrossRef]
- Matsuyama, S.; Nao, N.; Shirato, K.; Kawase, M.; Saito, S.; Takayama, I.; Nagata, N.; Sekizuka, T.; Katoh, H.; Kato, F.; et al. Enhanced isolation of SARS-CoV-2 by TMPRSS2-expressing cells. Proc. Natl. Acad. Sci. USA 2020, 117, 7001–7003. [Google Scholar] [CrossRef]
- Park, G.W.; Cho, M.; Cates, E.L.; Lee, D.; Oh, B.T.; Vinjé, J.; Kim, J.H. Fluorinated TiO₂ as an ambient light-activated virucidal surface coating material for the control of human norovirus. J. Photochem. Photobiol. B 2014, 140, 315–320. [Google Scholar] [CrossRef]
- Shirato, K.; Nao, N.; Katano, H.; Takayama, I.; Saito, S.; Kato, F.; Katoh, H.; Sakata, M.; Nakatsu, Y.; Mori, Y.; et al. Development of Genetic Diagnostic Methods for Detection for Novel Coronavirus 2019(nCoV-2019) in Japan. Jpn. J. Infect. Dis. 2020, 73, 304–307. [Google Scholar] [CrossRef]
- Kiwi, J.; Nadtochenko, V. New Evidence for TiO2 Photocatalysis during Bilayer Lipid Peroxidation. J. Phys. Chem. B 2004, 108, 17675–17684. [Google Scholar] [CrossRef]
- Wu, P.; Imlay, J.A.; Shang, J.K. Mechanism of Escherichia coli inactivation on palladium-modified nitrogen-doped titanium dioxide. Biomaterials 2010, 31, 7526–7533. [Google Scholar] [CrossRef]
- Amézaga-Madrid, P.; Silveyra-Morales, R.; Córdoba-Fierro, L.; Nevárez-Moorillón, G.V.; Miki-Yoshida, M.; Orrantia-Borunda, E.; Solís, F.J. TEM evidence of ultrastructural alteration on Pseudomonas aeruginosa by photocatalytic TiO2 thin films. J. Photochem. Photobiol. B 2003, 70, 45–50. [Google Scholar] [CrossRef]
- Kashige, N.; Kakita, Y.; Nakashima, Y.; Miake, F.; Watanabe, K. Mechanism of the photocatalytic inactivation of Lactobacillus casei phage PL-1 by titania thin film. Curr. Microbiol. 2001, 42, 184–189. [Google Scholar] [CrossRef] [PubMed]
- Riediker, M.; Tsai, D.H. Estimation of Viral Aerosol Emissions from Simulated Individuals with Asymptomatic to Moderate Coronavirus Disease 2019. JAMA Netw. Open 2020, 3, e2013807. [Google Scholar] [CrossRef]
- Sakai, H.; Ito, E.; Cai, R.X.; Yoshioka, T.; Kubota, Y.; Hashimoto, K.; Fujishima, A. Intracellular Ca2+ concentration change of T24 cell under irradiation in the presence of TiO2 ultrafine particles. Biochim. Biophys. Acta 1994, 1201, 259–265. [Google Scholar] [CrossRef]
- Lis, M.; Wizert, A.; Przybylo, M.; Langner, M.; Swiatek, J.; Jungwirth, P.; Cwhiklik, L. The effect of lipidoxidation on the water permeability of phospholipids bilayers. Phys. Chem. Chem. Phys. 2011, 13, 17555–17563. [Google Scholar] [CrossRef]
- Runas, K.A.; Malmstadt, N. Low levels of lipid oxidation radically increase the passive permeability of lipid bilayers. Soft Matter 2015, 11, 499–505. [Google Scholar] [CrossRef]
- Hou, Y.J.; Chiba, S.; Halfmann, P.; Ehre, C.; Kuroda, M.; Dinnon, K.H., 3rd; Leist, S.R.; Schäfer, A.; Nakajima, N.; Takahashi, K.; et al. SARS-CoV-2 D614G variant exhibits efficient replication ex vivo and transmission in vivo. Science 2020, 370, 1464–1468. [Google Scholar]
- Zhang, L.; Jackson, C.B.; Mou, H.; Ojha, A.; Peng, H.; Quinlan, B.D.; Rangarajan, E.S.; Pan, A.; Vanderheiden, A.; Suthar, M.S.; et al. SARS-CoV-2 spike-protein D614G mutation increases virion spike density and infectivity. Nat. Commun. 2020, 11, 6013. [Google Scholar] [CrossRef]


Publisher’s Note: MDPI stays neutral with regard to jurisdictional claims in published maps and institutional affiliations. |
© 2021 by the authors. Licensee MDPI, Basel, Switzerland. This article is an open access article distributed under the terms and conditions of the Creative Commons Attribution (CC BY) license (https://creativecommons.org/licenses/by/4.0/).
Share and Cite
Matsuura, R.; Lo, C.-W.; Wada, S.; Somei, J.; Ochiai, H.; Murakami, T.; Saito, N.; Ogawa, T.; Shinjo, A.; Benno, Y.; et al. SARS-CoV-2 Disinfection of Air and Surface Contamination by TiO2 Photocatalyst-Mediated Damage to Viral Morphology, RNA, and Protein. Viruses 2021, 13, 942. https://doi.org/10.3390/v13050942
Matsuura R, Lo C-W, Wada S, Somei J, Ochiai H, Murakami T, Saito N, Ogawa T, Shinjo A, Benno Y, et al. SARS-CoV-2 Disinfection of Air and Surface Contamination by TiO2 Photocatalyst-Mediated Damage to Viral Morphology, RNA, and Protein. Viruses. 2021; 13(5):942. https://doi.org/10.3390/v13050942
Chicago/Turabian StyleMatsuura, Ryosuke, Chieh-Wen Lo, Satoshi Wada, Junichi Somei, Heihachiro Ochiai, Takeharu Murakami, Norihito Saito, Takayo Ogawa, Atsushi Shinjo, Yoshimi Benno, and et al. 2021. "SARS-CoV-2 Disinfection of Air and Surface Contamination by TiO2 Photocatalyst-Mediated Damage to Viral Morphology, RNA, and Protein" Viruses 13, no. 5: 942. https://doi.org/10.3390/v13050942
APA StyleMatsuura, R., Lo, C.-W., Wada, S., Somei, J., Ochiai, H., Murakami, T., Saito, N., Ogawa, T., Shinjo, A., Benno, Y., Nakagawa, M., Takei, M., & Aida, Y. (2021). SARS-CoV-2 Disinfection of Air and Surface Contamination by TiO2 Photocatalyst-Mediated Damage to Viral Morphology, RNA, and Protein. Viruses, 13(5), 942. https://doi.org/10.3390/v13050942