Article

Identification of Host Factors Associated with the Development of Equine Herpesvirus Myeloencephalopathy by Transcriptomic Analysis of Peripheral Blood Mononuclear Cells from Horses

1
Department of Pathobiology and Diagnostic Investigation, Michigan State University, East Lansing, MI 48824, USA
2
Department of Large Animal Clinical Sciences, Michigan State University, East Lansing, MI 48824, USA
*
Author to whom correspondence should be addressed.
Viruses 2021, 13(3), 356; https://doi.org/10.3390/v13030356
Submission received: 1 February 2021 / Revised: 18 February 2021 / Accepted: 19 February 2021 / Published: 24 February 2021
(This article belongs to the Special Issue Animal Herpesviruses Pathogenesis and Immunity)

Abstract

:
Equine herpesvirus-1 is the cause of respiratory disease, abortion, and equine herpesvirus myeloencephalopathy (EHM) in horses worldwide. EHM affects as many as 14% of infected horses and a cell-associated viremia is thought to be central for EHM pathogenesis. While EHM is infrequent in younger horses, up to 70% of aged horses develop EHM. The aging immune system likely contributes to EHM pathogenesis; however, little is known about the host factors associated with clinical EHM. Here, we used the “old mare model” to induce EHM following EHV-1 infection. Peripheral blood mononuclear cells (PBMCs) of horses prior to infection and during viremia were collected and RNA sequencing with differential gene expression was used to compare the transcriptome of horses that did (EHM group) and did not (non-EHM group) develop clinical EHM. Interestingly, horses exhibiting EHM did not show respiratory disease, while non-EHM horses showed significant respiratory disease starting on day 2 post infection. Multiple immune pathways differed in EHM horses in response to EHV-1. These included an upregulation of IL-6 gene expression, a dysregulation of T-cell activation through AP-1 and responses skewed towards a T-helper 2 phenotype. Further, a dysregulation of coagulation and an upregulation of elements in the progesterone response were observed in EHM horses.

1. Introduction

Equine herpesvirus-1 (EHV-1) affects horses worldwide. It is the cause of upper respiratory disease, late term abortion or the crippling neurologic disease equine herpesvirus myeloencephalopathy (EHM). While respiratory disease can contribute to temporary loss of training, severe disease manifestations such as EHM can have devastating effects on animal welfare and an economic impact [1]. In a recent U.S. outbreak, as many as 14% of infected animals died or were euthanized due to EHM and to date, no vaccine is effective in preventing EHM [2,3]. This means strict biosecurity and quarantines during an outbreak remain the most effective strategy to control losses due to EHM. In order to limit these devastating consequences, the current recommendation is that state animal health officials issue quarantines of premises with EHV-1 confirmed cases for 21 days from the onset of the last case of EHM [4].
Following primary exposure, EHV-1 establishes a latent lifelong infection in the sensory ganglia or peripheral blood mononuclear cells (PBMCs) [5,6,7,8]. Despite this early natural infection and/or vaccination, horses remain susceptible particularly to secondary disease following a repeat exposure or reactivation of latent virus. During an acute infection, EHV-1 replicates in the nasal epithelium and causes upper respiratory disease in younger horses [9]. In the period of 4−14 days following exposure, EHV-1 is detectable in the PBMCs and transported throughout the body during a period of cell-associated viremia [10]. Viremia is a prerequisite event in the pathogenesis of EHM and facilitates the transfer of the virus to the vascular endothelial cells of the central nervous system [11,12]. It has been demonstrated that the duration and magnitude of the viremia contribute to the likelihood of EHM development, which suggests that increasing the exposure of the vascular endothelium to infected PBMCs increases the likelihood of CNS damage [13,14,15,16]. In further support of this, studies have shown that a single nucleotide polymorphism in the DNA polymerase gene of the virus, which encodes an aspartic acid residue at position 752 (genotype D752), has been associated with more neurologic disease during outbreaks than that which encodes an asparagine at this position (genotype N752) [1,17]. Challenge infection experiments in horses have confirmed that infection with the neuropathogenic D752 strain is associated with a higher magnitude and longer duration of EHV-1 viremia when compared to infection with the lower neuropathogenic N752 strain, and this corresponded to the increased likelihood of EHM [13,14,15,16,18].
Clinical EHM is typically observed towards the end of the viremic phase, suggesting that endothelial infection most likely occurs during peak levels of viremia [19]. Following infection of the vascular endothelium it is thought that a vasculitis, thrombosis, and neu-ronal damage develop and lead to clinical neurologic disease. Because of this, dysregulation of the blood−brain barrier (BBB) integrity is considered to be a critical event for clinical neurological disease during EHM. The BBB is comprised of the vascular endothelial cells of the CNS microvasculature and are connected with tight junctions and adherens junctions, forming a protective barrier for neurons [20,21]. The intact BBB protects against neuronal damage resulting from leukocytic infiltration [20]. Due to similarities in the damaging events at the BBB, the pathogenesis of EHM can be compared to that of human ischemic stroke. In human and mouse models of stroke, BBB integrity and permeability can be damaged as a result of an inciting event, such as hypoxia (via thrombosis) [20,22,23,24]. In horses, the coagulation cascade is known to be induced during EHV-1 viremia, and it is thought that this is a contributor to hypoxic BBB damage and neuronal damage resulting from microthrombosis [25,26,27,28]. In addition to ischemic damage via thrombosis, inflammation is another key factor in the development of BBB damage and EHM.
However, while viremia is a key feature of EHV-1 infection, and a large percentage of infected horses become viremic, only a small percentage of infected horses go on to develop clinical EHM. While some viral factors have been identified to increase the neuropathogenic potential of EHV-1 infection, it is clear that there are a number of host factors involved in the response to EHV-1 that correlate with the development of EHM [14]. While significant respiratory disease is more common in younger horses, it has been shown that older animals are more likely to develop EHM [13,19,29,30]. In addition, there is some evidence, that in mares over 20 years of age the incidence of clinical EHM is up to 70% [13,31]. The propensity of older animals to get EHM may be related to immunosenescence, which is a commonly observed feature of aging. In horses as well as humans this immunosenescence involves reduced levels of naïve lymphocytes, an increase in the memory lymphocytes, and the reduction of memory T-cell activation and proliferation following stimulation [32,33]. Additionally, aging is often associated with low levels of chronic inflammation, known as “inflammaging,” which is thought to contribute to the pathogenesis of other inflammatory diseases of older humans and horses [32,33].
In order to identify which host factors are associated with the development of EHM, we thought to utilize the “old mare model” to reliably induce EHM and then compare which host factors are affected in horses with clinical EHM compared to horses that are infected and viremic but do not exhibit clinical EHM. For this, we conducted a challenge infection with a neuropathogenic strain of EHV-1 in both young and old horses in order to ensure enough animals presented with both phenotypes (those that progressed to clin-ical EHM and those that did not). Based on the central role of viremia for systemic host immunity and EHM pathogenesis and in induction of BBB dysfunction, the goal of the study was to use deep RNA sequencing and a repeated measure design to identify the differences in the host and virus transcriptome in PBMCs of horses that did and did not develop clinical EHM following an EHV-1 challenge infection.

2. Materials and Methods

2.1. Animals

Fourteen horses of mixed breeds (5 males, 9 females) were used in this study. The study consisted of two challenge infection experiments that occurred several months apart. One experiment used 2-year-old horses (n = 7; 5 males, 2 females) and the second experiment was performed in aged horses (18–21-year-old; n = 7; 7 females). For both experiments, animals were housed in a building with natural ventilation with multiple horses per pen and nose-to-nose contact between pens. Horses had access to grass hay and water ad libitum for the entirety of the study. All animal maintenance and procedures were performed in compliance with Michigan State University’s Institutional Animal Care and Use Committee, under protocol “PROTO201800015”.

2.2. Virus

The neuropathic strain EHV-1 Ab4 (GenBank Accession No. AY665713.1) was propagated in NBL-6 cells (ATCC CCL-57) with MEM-10 (Minimum Essential Medium Eagle [Sigma-Aldrich, St. Louis, MO, USA] supplemented with 100 IU/mL penicillin, 100 µg/mL streptomycin, 1% GlutaMAX (GIBCO, Life Technologies, Carlsbad, CA, USA), 1 mM sodium pyruvate, 1% nonessential amino acids [M7145, Sigma-Aldrich], and 10% fetal bovine serum). After incubation at 37 °C and 5% CO2 for 3–4 days, the cells were frozen and thawed, and cellular debris removed by centrifugation at 300× g for 10 min. The stock was stored at −80 °C. Prior to inoculation in horses, the stock was thawed and sonicated for three cycles of 30 s at 50% amplification.

2.3. Experimental Design and Sample Collection

Prior to inclusion in the study, the serum was screened for virus neutralizing antibodies for EHV-1. The 2-year-old horses had pre-challenge titers ≤1:8 for EHV-1 and the aged horses had pre-challenge titers of ≤1:32 for EHV-1. Horses were inoculated with in-tranasal instillation of 5 × 10⁷ pfu of EHV-1 Ab4. Physical examinations were conducted prior to challenge infection (CH) and daily following CH and included the evaluation of nasal discharge, ocular discharge, cough, and rectal body temperature as well as a neuro-logical exam using the simplified version of the Mayhew scale, as described by Allen [13]. Peripheral blood mononuclear cells (PBMCs) were isolated from horses prior to CH and daily for 10 days post CH. One hundred mL whole blood was collected in heparinized syringes via jugular venipuncture and immediately transported to the laboratory for processing. PBMCs were separated by density gradient centrifugation over Histopaque-1077 (Sigma-Aldrich, St. Louis, MO, USA) as previously described and cell pellets of 6 × 10⁷ were stored at −80 °C until RNA isolation [34]. An additional aliquot of 1 × 10⁷ PBMCs was used for quantification of viremia using qPCR as previously described [14]. The day post CH for peak viral load in PBMCs was determined for each horse and RNA for RNA sequencing analysis was isolated from PBMCs from each horse pre CH, as well as on the day of peak viremia. Statistical analysis was performed using a 2-way ANOVA with significance of p < 0.05.

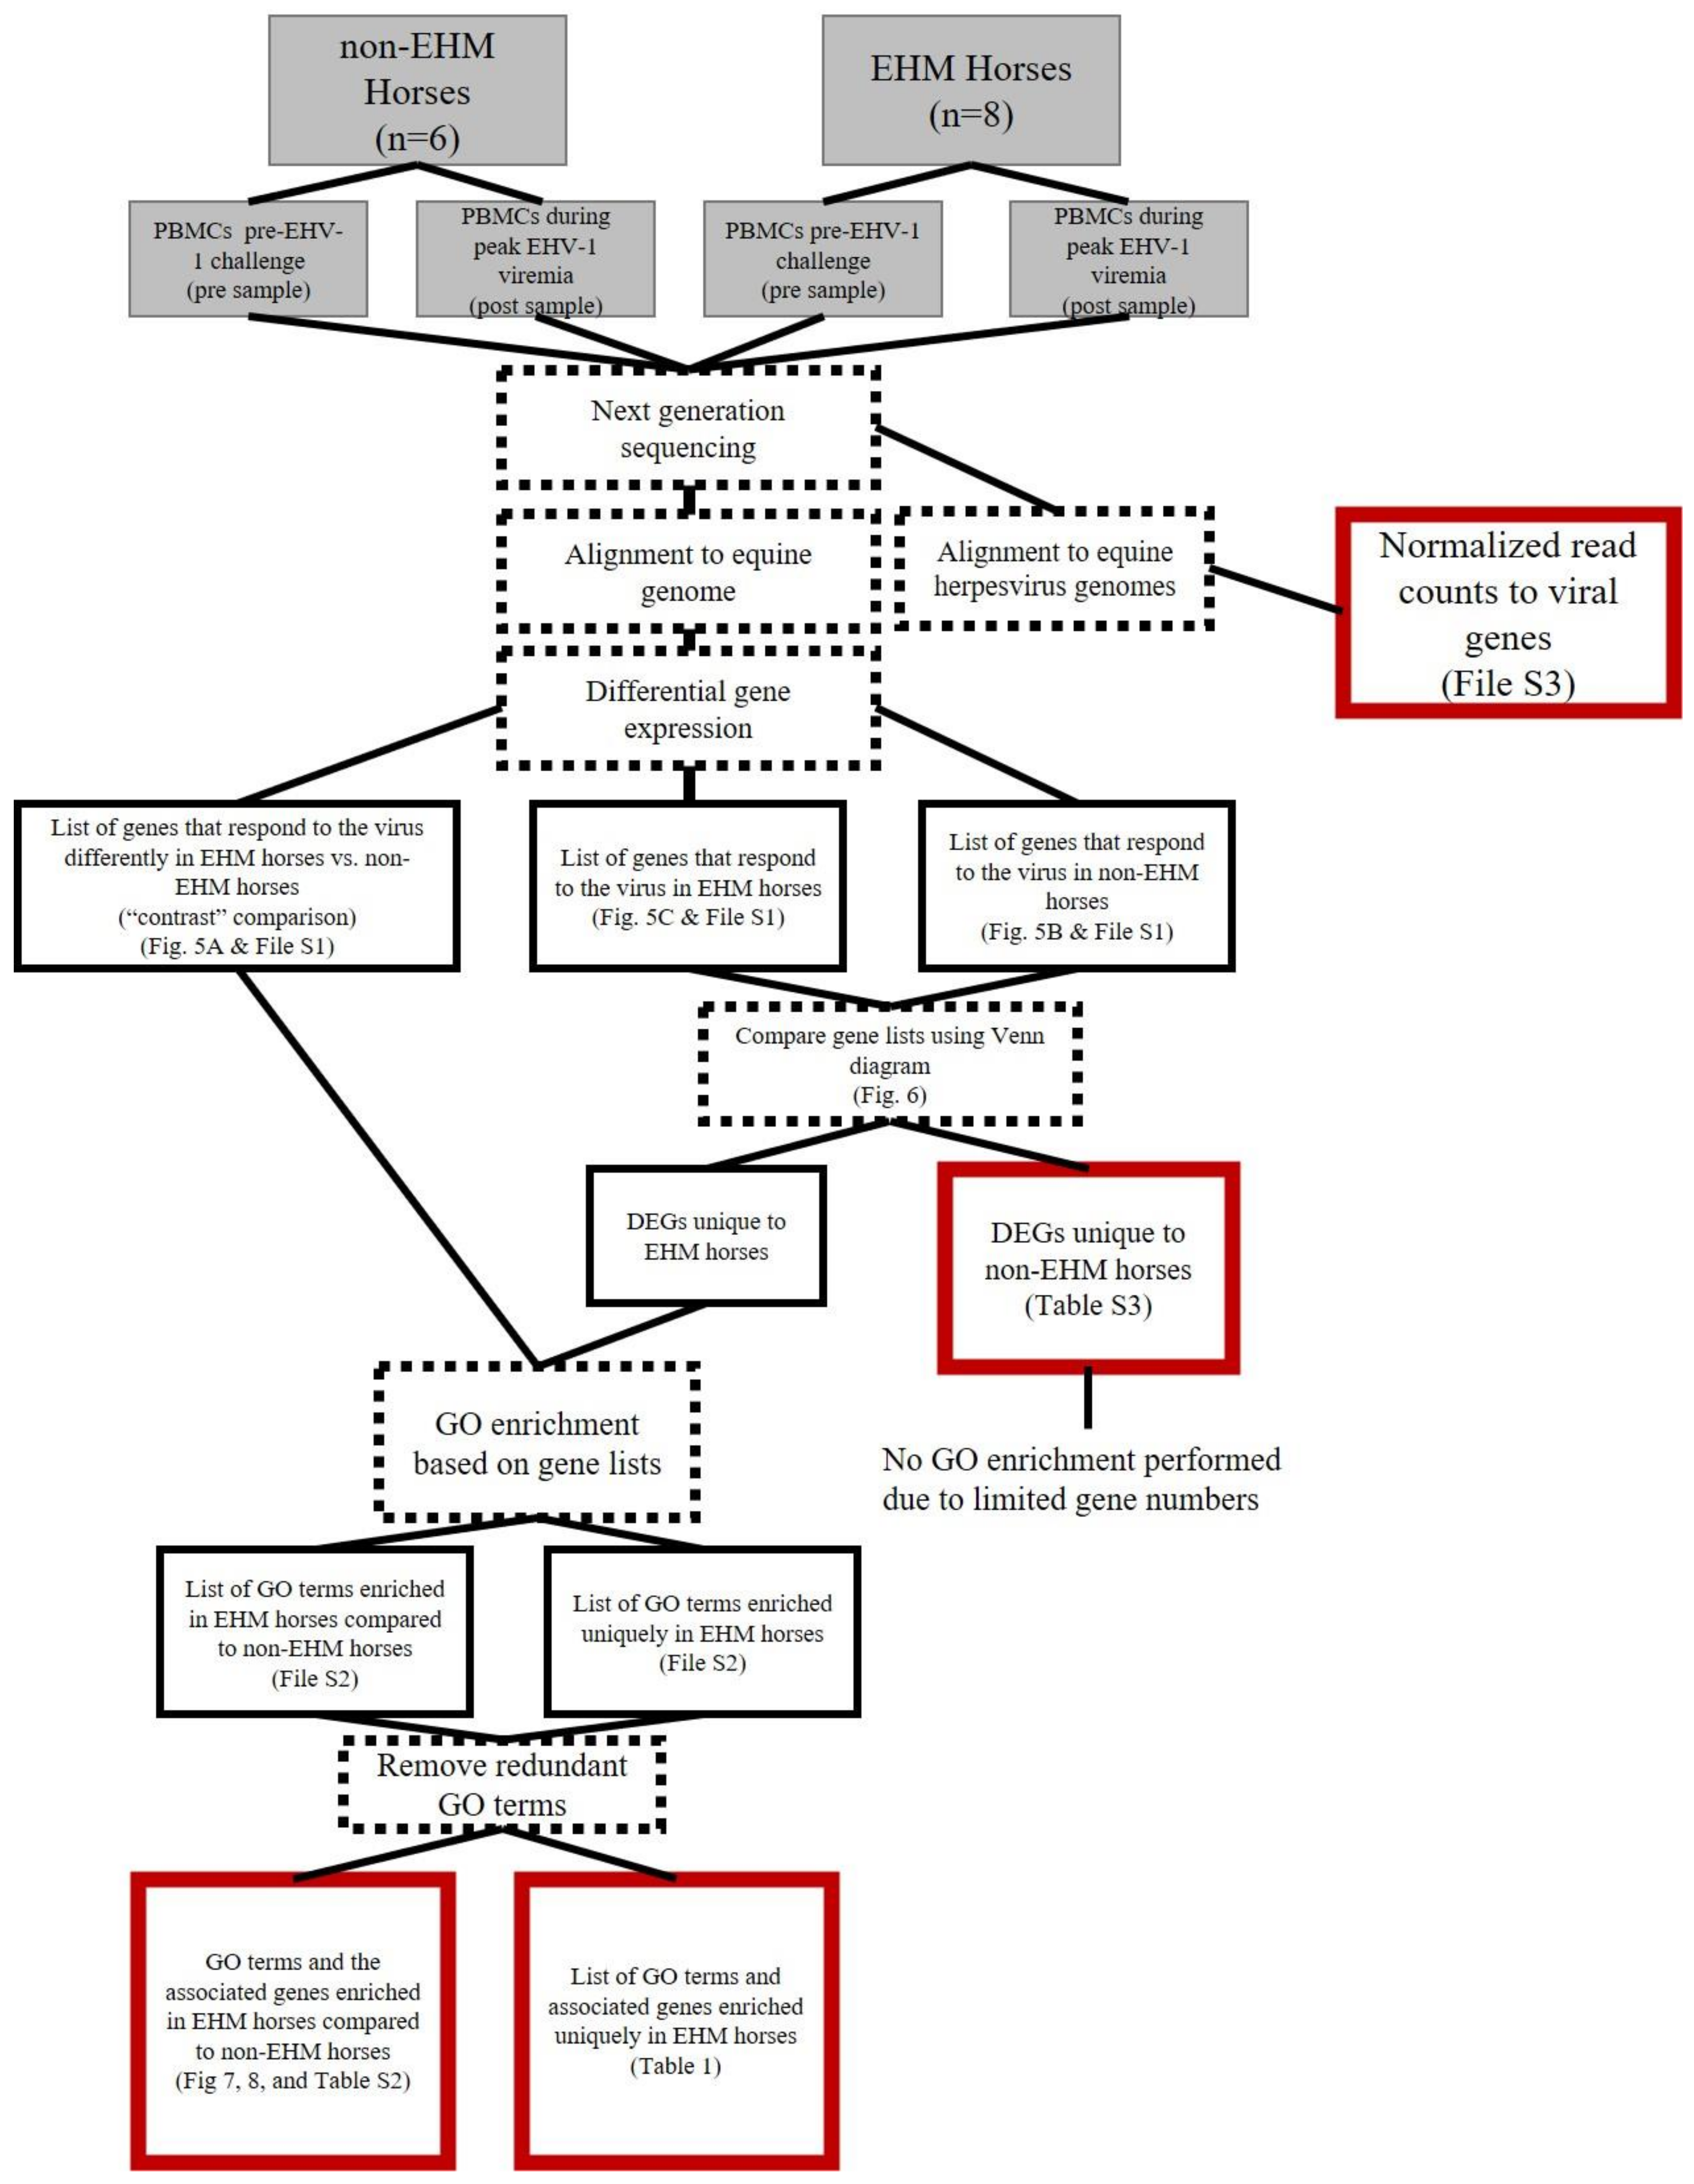
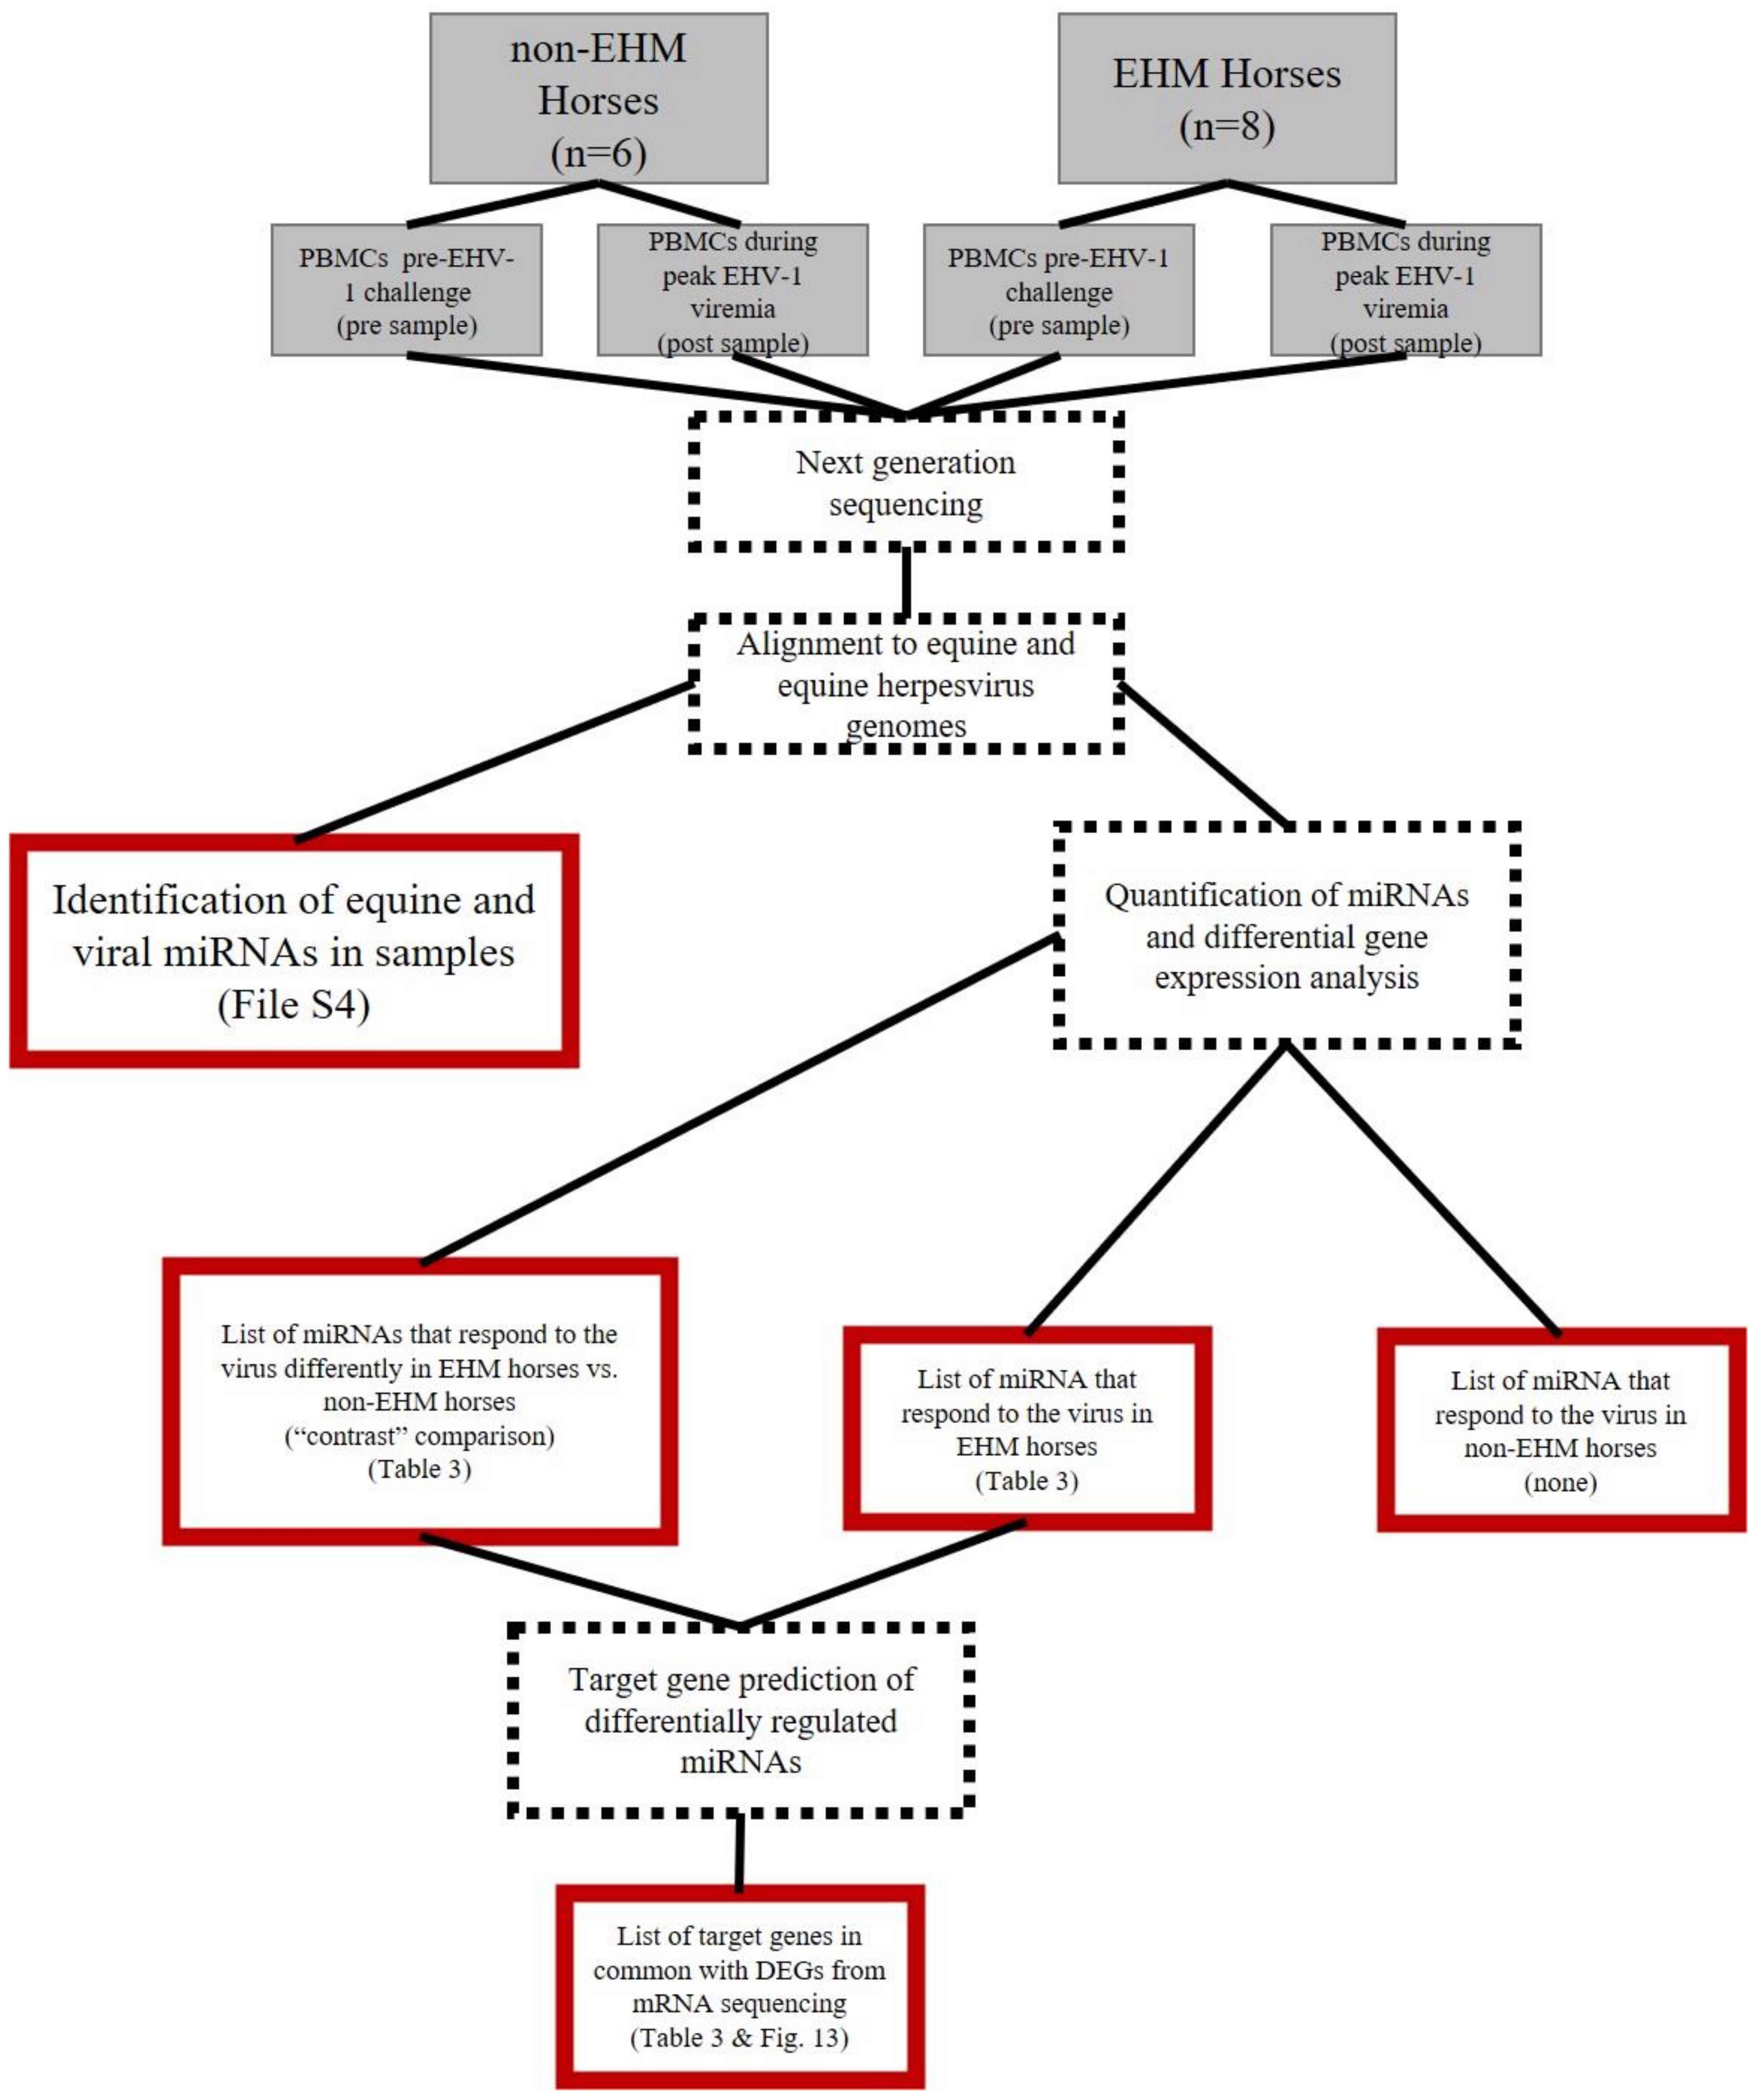
2.4. RNA Isolation, Library Preparation, and Sequencing

Cell pellets were lysed and homogenized using TRIzol Reagent (Thermo Fisher Scientific Waltham, MA, USA) following the manufacturer’s instructions. The aqueous phase was then collected, washed with 100% ethanol and total RNA was isolated using the miRNeasy Mini Kit (Qiagen Inc., Hilden, Germany) according to the manufacturer’s instructions. To eliminate genomic DNA contamination, deoxyribonuclease treatment (Qiagen) was applied to each sample according to the manufacturer’s recommendation. The concentration of RNA was determined using fluorometric quantification with the Qubit 1.0 (Thermo Fisher). RNA quality was evaluated using the Agilent 2100 Bioanalyzer (Agilent Technologies, Inc., Santa Clara, CA, USA) with the RNA 6000 Pico Assay and samples with a RIN score >6.70 were submitted for sequencing. Library preparation and next generation sequencing were performed at Michigan State University’s Genomics Research and Technology Support Facility. Stranded mRNA cDNA library preparation was performed using the Illumina TruSeq stranded mRNA kit (Illumina Inc., San Diego, CA, USA) with IDT for Illumina Unique Dual Index adapters according to manufacturers’ recommendations. MicroRNA (miRNA) cDNA libraries were prepared using the Illumina TruSeq Small RNA Library Preparation Kit (Illumina Inc.) following manufacturer’s recommendations. Completed libraries were quality controlled and quantified using a combination of Qubit dsDNA HS (Thermo Fisher) and Agilent 4200 TapeStation HS DNA1000 (Agilent Technologies) assays. The stranded mRNA cDNA libraries were divided into 5 pools for multi-plexed sequencing; four of these pools contained 8 libraries and the fifth pool contained 7. Pools were quantified using the Kapa Biosystems Illumina Library Quantification qPCR kit (Roche, Basel, Switzerland). Each pool was load-ed onto one lane of an Illumina HiSeq 4000 flow cell (Illumina Inc.) and sequencing was performed in a 2 × 150 bp paired end using HiSeq 4000 SBS reagents. (Illumina Inc.) The miRNA cDNA libraries were divided into two pools and the pools quantified using the Kapa Biosystems Illumina Library Quantification qPCR kit (Roche). Each pool was loaded onto one lane of an Illumina HiSeq 4000 flow cell (Illumina Inc.) and sequencing was performed in a 1 × 50 bp single read format using HiSeq 4000 SBS reagents (Illumina Inc.). Base calling was done by Illumina Real Time Analysis v2.7.7 (Illumina Inc.) and output of RTA was demultiplexed and converted to FastQ format with Illumina Bcl2fastq v2.19.1 (Illumina Inc.). All raw sequencing reads are available in the NCBI sequence read archive (SRA, NCBI, Bethesda, MD, 20894 USA) under BioProject ascension number PRJNA705083.

2.5. Genome Guided mRNA Alignment

Read quality was assessed before and after quality and adaptor trimming using FastQC software (version 0.11.7, [35]). Illumina adapters were trimmed from files using Trimmomatic (version 0.38, [36]) with the additional options for quality trimming: LEADING:2, TRAILING:2, SLIDINGWINDOW:4:2, and MINLEN:25. Reads were mapped to the Equus caballus genome (assembly EquCab3.0, ENSEMBL release-95) using HISAT2 (version 2.1.0, [37]). The accepted hits.BAM files were sorted by name using SAMtools (version 1.5, [38]), and read counts generated using htseq-count ([39]) (built in with Python version 3.6.4) with the following options: —format = bam, —stranded = reverse, and —order = name.

2.6. Host and Viral miRNA Identification and Quantification

Read quality was assessed before and after quality and adaptor trimming using FastQC software v0.11.7 [35]. Raw reads were trimmed using cutadapt (version 1.16, [40]). Options included trimming the Illumina adaptor sequence (option -a TGGAATTCTCGGGTGCCAAGG), reads shorter than 15 bp dis-carded (option -m 15), and the 3′ end trimmed with a quality score cutoff of 20 (option -q 20). After trimming, miRDeep2 (version 2.0.0.8, [41]) was used to identify all miRNAs present in the samples, including putative novel miRNAs, as well as known miRNAs. For this, reads from all samples were first pooled. Next, a combined reference genome was created from combining the horse (EquCab3.0; down-loaded from ENSEMBL release-95) with the genome of the four most common equine herpesviruses (EHV-1 NCBI RefSeq NC_001491.2, EHV-2 NCBI RefSeq NC_001650.2, EHV-4 NCBI RefSeq NC_001844.1, and EHV-5 NCBI RefSeq NC_026421.1) and indexed using the bowtie-build function of Bowtie (version 1.2.2., [42]) The mapper.pl function of miRDeep2 was used on the pooled reads to the reference genome to create a .fasta file with processed reads and a .arf file with mapped reads. Next, miRDeep2.pl function was performed on these outputs using equine miRNAs as the main reference. Since the equine miRNA database is still very incomplete, mouse and human known miRNAs were used as related species lists. Known equine, mouse, and human miRNAs were downloaded from the miRbase database (release 22.1, [43]). Novel RNAs with a miRDeep score < 1 were removed for subsequent analysis.
In order to perform differential gene expression analysis, the miRNAs were quantified in each sample. For this the quantifier.pl tool from the miRDeep2 package was used. All novel and known mature and precursor miRNAs from the miRDeep2 step above were used as input reference sequences. Quantifier.pl was run with the processed reads .fasta file as input and the -k option was used to consider precursor-mature mappings that have different ids. Predicted target genes of all differentially expressed miRNAs were iden-tified using the miRDB target search tool [44].

2.7. Differential Gene Expression Analysis

An overview of the data analysis pipeline is described in Figure 1 (mRNA) and Figure 2 (miRNA). A repeated measure study design was used to assess differential gene expression in response to EHV-1 CH both between groups (EHM vs. non-EHM) and with-in groups (pre vs. post CH). The between group, “contrast” comparison was performed which compared the response (pre vs. post) in the EHM group to the response (pre vs. post) in the non-EHM group in order to identify differences between the EHM and non-EHM horses that contribute to or protect from EHM. To expand on this and identify additional potential contributing or protective mechanisms, we also performed the within group comparison. For this, we determined which genes were up- or downregulated (pre vs. post CH) uniquely in either non-EHM (protective from disease) or EHM horses (contributing to disease).
Differential expression analyses for both mRNAs and miRNAs were performed using the edgeR package (version 3.24.3, [45]), in R (version 3.5.3). We analyzed differences between groups (the “contrast” comparison of EHM vs. non-EHM) and within groups (prior to and after EHV-1 CH for each group) using a repeated measure type design as described in Section 3.5 of the EdgeR manual (last revised 2020, [46]). For this, the model matrix was designed as: ~group + group:horse + group:timepoint, where “group” indicated normal or EHM, “horse” were individual horses, and “timepoint” referred to pre- or post EHV-1 CH. Preprocessing of the data were performed as recommended in the edgeR user manual and included filtering to eliminate low expressed genes (filterByExpr function), TMM normalization (calcNormFactors function), and dispersion estimations (estimateDisp function). We then fit a genewise general linear model (GLM) using the glmFit function, and then performed likelihood ratio testing (LRT) for comparisons using the glmLRT function. Three LRT comparisons were made as explained above: genes that respond differently to the virus in EHM horses compared to how they respond in normal horses (contrast comparison between groups), genes responding to the virus in EHM horses (within group), and genes responding to the virus in non-EHM horses (within group). Benjamini−Hochberg adjustment was used on the p values and statistical significance was set at an FDR < 0.05 and log fold change >|1|. PANTHER and UniProtKB databases were used to identify families and functions of proteins associated with orthologous human genes [47,48].

2.8. Gene Ontology (GO) Enrichment Analysis

Enrichment analysis for gene ontology (GO) terms was performed on the gene lists derived from the differential expression analysis in order to meaningfully interpret and consolidate the up- or downregulated gene lists and identify relevant functions associ-ated with these genes. GO is a system of classification for genes based on their biological functions, and genes can be classified to any number of GO terms. Overrepresentation analysis identifies which of the GO terms are statistically more likely (or “over-represented”) based on the proportion of genes in the data set compared to the proportion of all genes in that species that are classified to a certain term.
Horse ENSEMBL IDs were converted to gene symbol based on the annotations in the EquCab3.0 GTF file (ENSEMBL release-95). GO enrichment analysis for biological processes was performed using the enrichGO function from the clusterProfiler package [49]. The database used was the human “org.Hs.eg.db”, and the background consisted of all genes present in our samples [50]. p values were adjusted using the Benjamini−Hochberg correction and statistical significance set at p < 0.05. After generating lists of enriched GO terms, redundant terms were removed using REVIGO [51]. Enriched GO terms, along with their associated adjusted p value were provided as input, and the allowed similarity was small (0.5). The default settings were used, which included selecting the whole UniProt database to determine GO term sizes and using the SimRel semantic similarity measure for the analysis.

2.9. In Silico Cell Sorting

Cell fractions were imputed using CIBERSORTx [52]. The included LM22 (22 immune cell types) was used as the signature matrix file. The mixture file included the CPM values for each gene from all of our samples, identified with gene symbol, and CPM values of redundant genes were merged together. B-mode batch correction was performed, and quantile normalization was disabled (recommend for RNA-seq data). Permutations for significance analysis was set at 100. The run was performed in relative mode (default). The data was determined to be non-normally distributed as determined by Shapiro−Wilk testing. Therefore, a Wilcoxon signed rank test was used to compare the paired data for each group.

2.10. Whole Blood Cytokine RT-qPCR

In order to validate changes in cytokine mRNA expression between groups, RNA was isolated from whole blood collected via jugular venipuncture into PAXgene RNA Blood Tubes (BD Biosciences, San Jose, CA, USA). Samples were collected prior to the EHV-1 CH and on day 7 post CH. RNA was isolated following the manufacturer’s instructions. RNA was reverse transcribed using the High-Capacity cDNA Reverse Transcription Kit with RNAse inhibitor (Applied Biosystems, Waltham, MA, USA). Real time PCR was performed using the SmartChip Real-Time PCR System (Takara Bio Inc., Kasatsu, Shiga, Japan) following the manufacturer’s recommendations. The reactions consisted of template cDNA, TaqMan Gene Expression Master Mix (Applied Biosystems) and TaqMan Gene Expression assays for equine target genes (Thermo Fisher, Waltham, MA, USA). Target genes included CCL5, CXCL10, IRF7, IRF9, MMP9, THBS1, GUSB, ACTB, and YWHAZ. The negative delta delta Cq (-ddCq) was calculated following the Livak and Schmittgen method [53]. For this, three housekeeping genes (GUSB, ACTB, and YWHAZ) were averaged to normalize the gene of interest and the average of pre CH values for each group were used as calibrators. Statistical differences between -ddCq values between non-EHM and EHM groups were determined for each gene of interest using a Wilcoxon rank sum test in R and significance set at p < 0.05.

3. Results

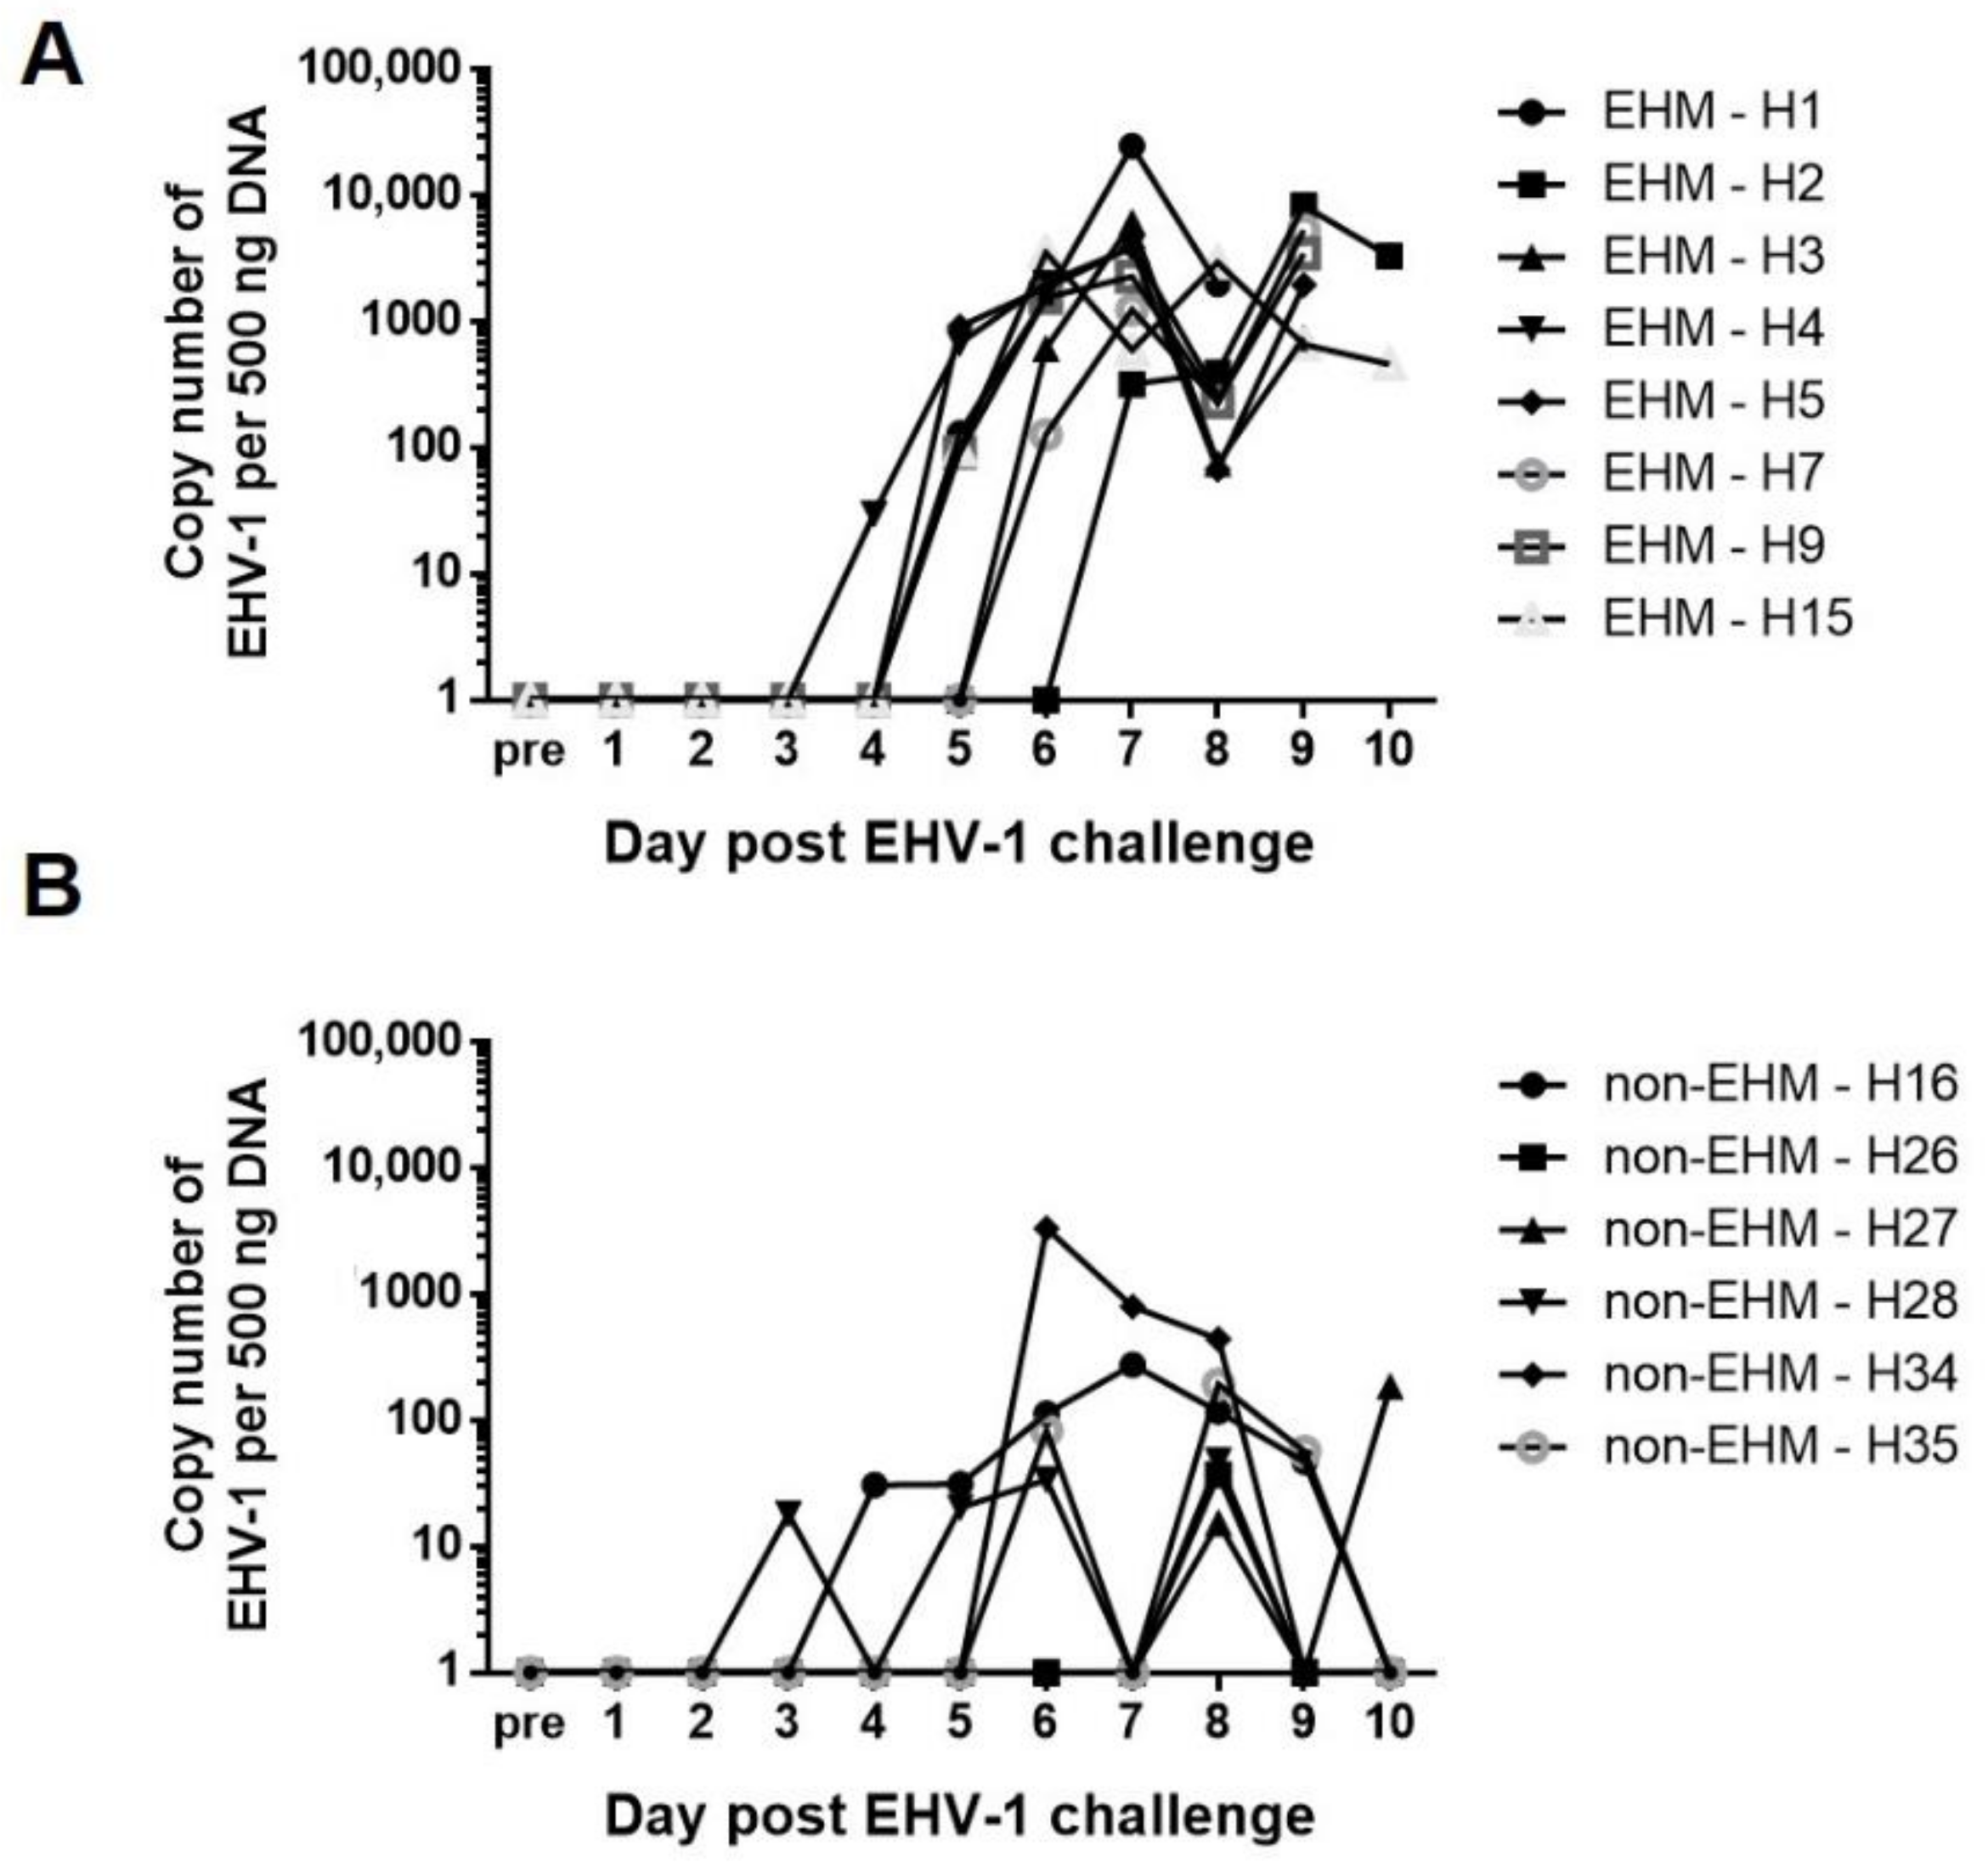
3.1. Clinical Disease and Viremia Differed between EHM and Non-EHM Horses in Response to EHV-1 Challenge Infection

The clinical data presented in this section were collected as part of a separate study by our laboratory, but are being summarized here to provide the clinical context to the transcriptomic analysis presented in the current paper [54]. All horses were free from clinical signs of respiratory disease, had normal body temperatures, and were negative for EHV-1 genome in nasal swab and PBMC samples when tested by real-time PCR prior to CH with EHV-1. All horses developed fevers and shed virus in nasal secretions following EHV-1 inoculation, indicating successful challenge infection. The EHM group consisted of all seven of the horses from the aged horse group and one horse from the young group; all horses that developed EHM were female. Neurological symptoms in the EHM group appeared as early as 6 days post CH and all seven old horses developed severe ataxia/paralysis and were humanely euthanized on day 9 or 10 post CH. The one horse from the young horse group developed moderate ataxia and recovered from neurological symptoms by the end of the study. The non-EHM group consisted of the remaining young horses and did not develop neurological clinical signs (1 female and 5 males).
The fever response to EHV-1 infection is often characterized by a primary fever (corresponding to peak nasal viral shedding) and a secondary fever (corresponding to peak viremia) [10,55]. Looking at the body temperatures, all non-EHM horses showed a pri-mary fever immediately following CH (days 1–4), while all but one EHM horse did not develop a primary fever. Additionally, non-EHM horses developed more severe clinical respiratory disease (nasal discharge and cough) compared to EHM horses, which showed only very mild symptoms. Finally, non-EHM horses showed significantly more nasal viral shedding when compared to EHM horses. In contrast, EHM horses developed significantly greater viremia levels when compared to non-EHM horses. To select post CH samples for RNA sequencing, the day of peak viremia was identified for each horse and occurred days 6–10 post CH (Figure 3A,B).

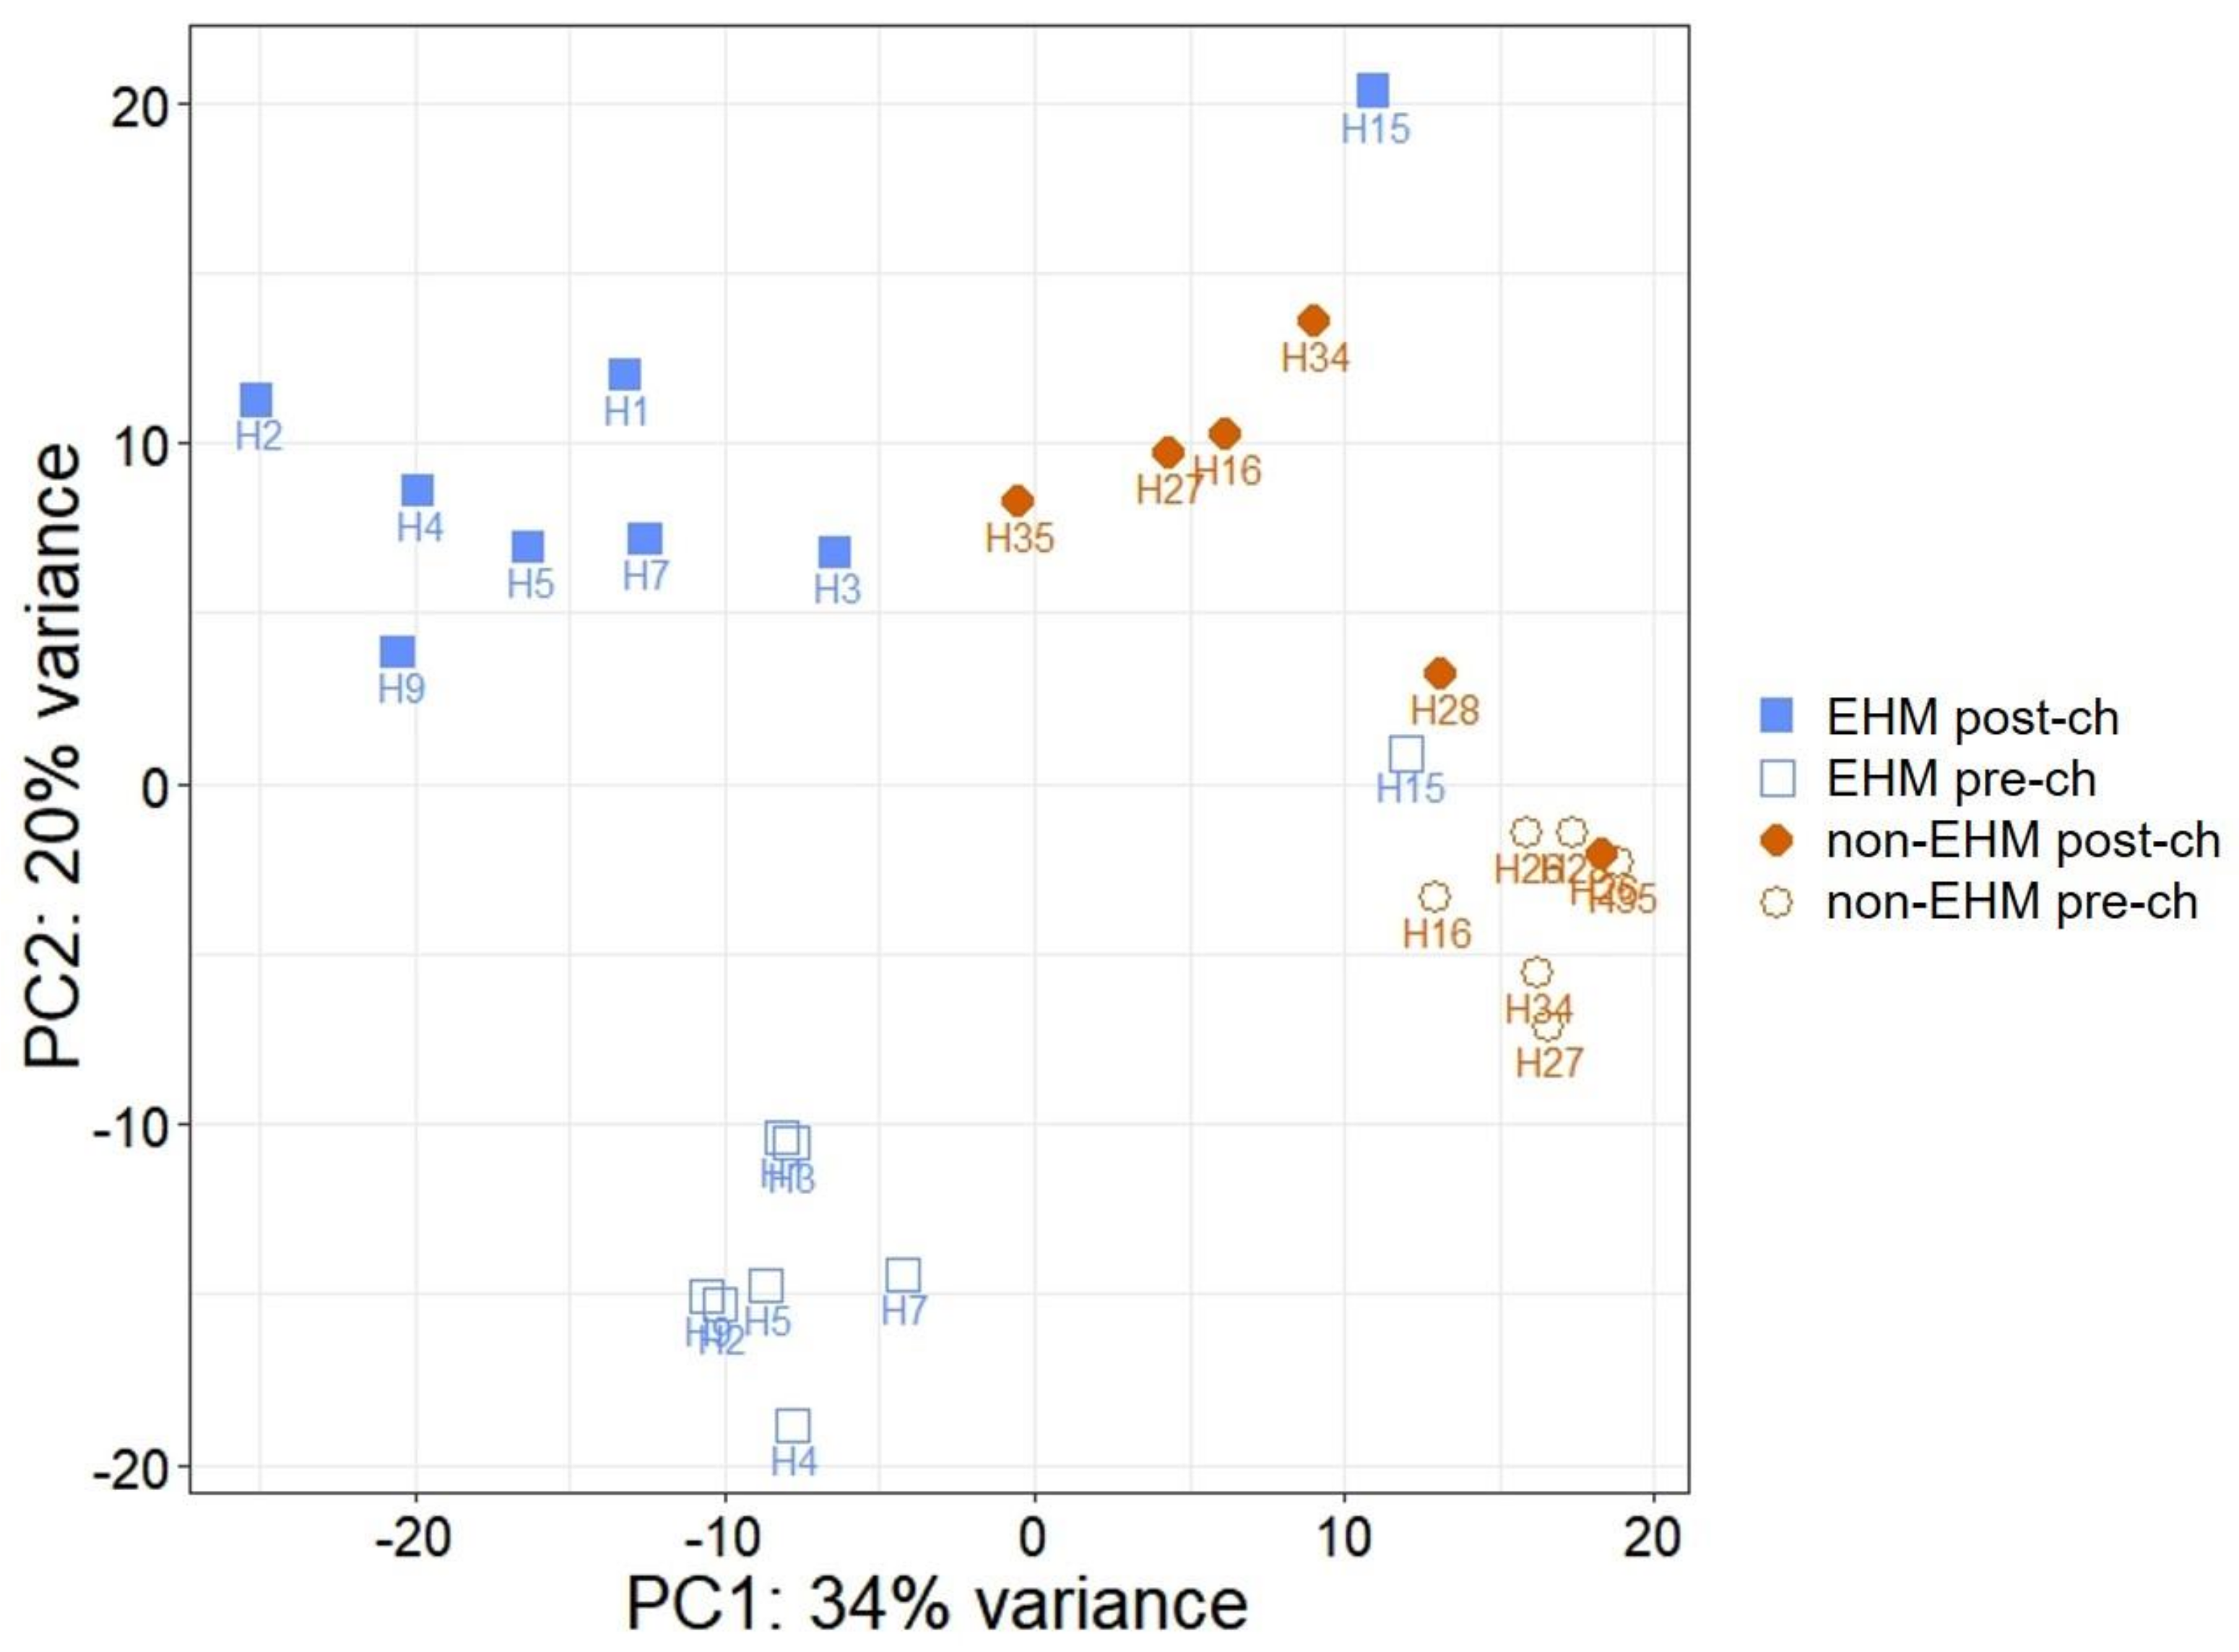
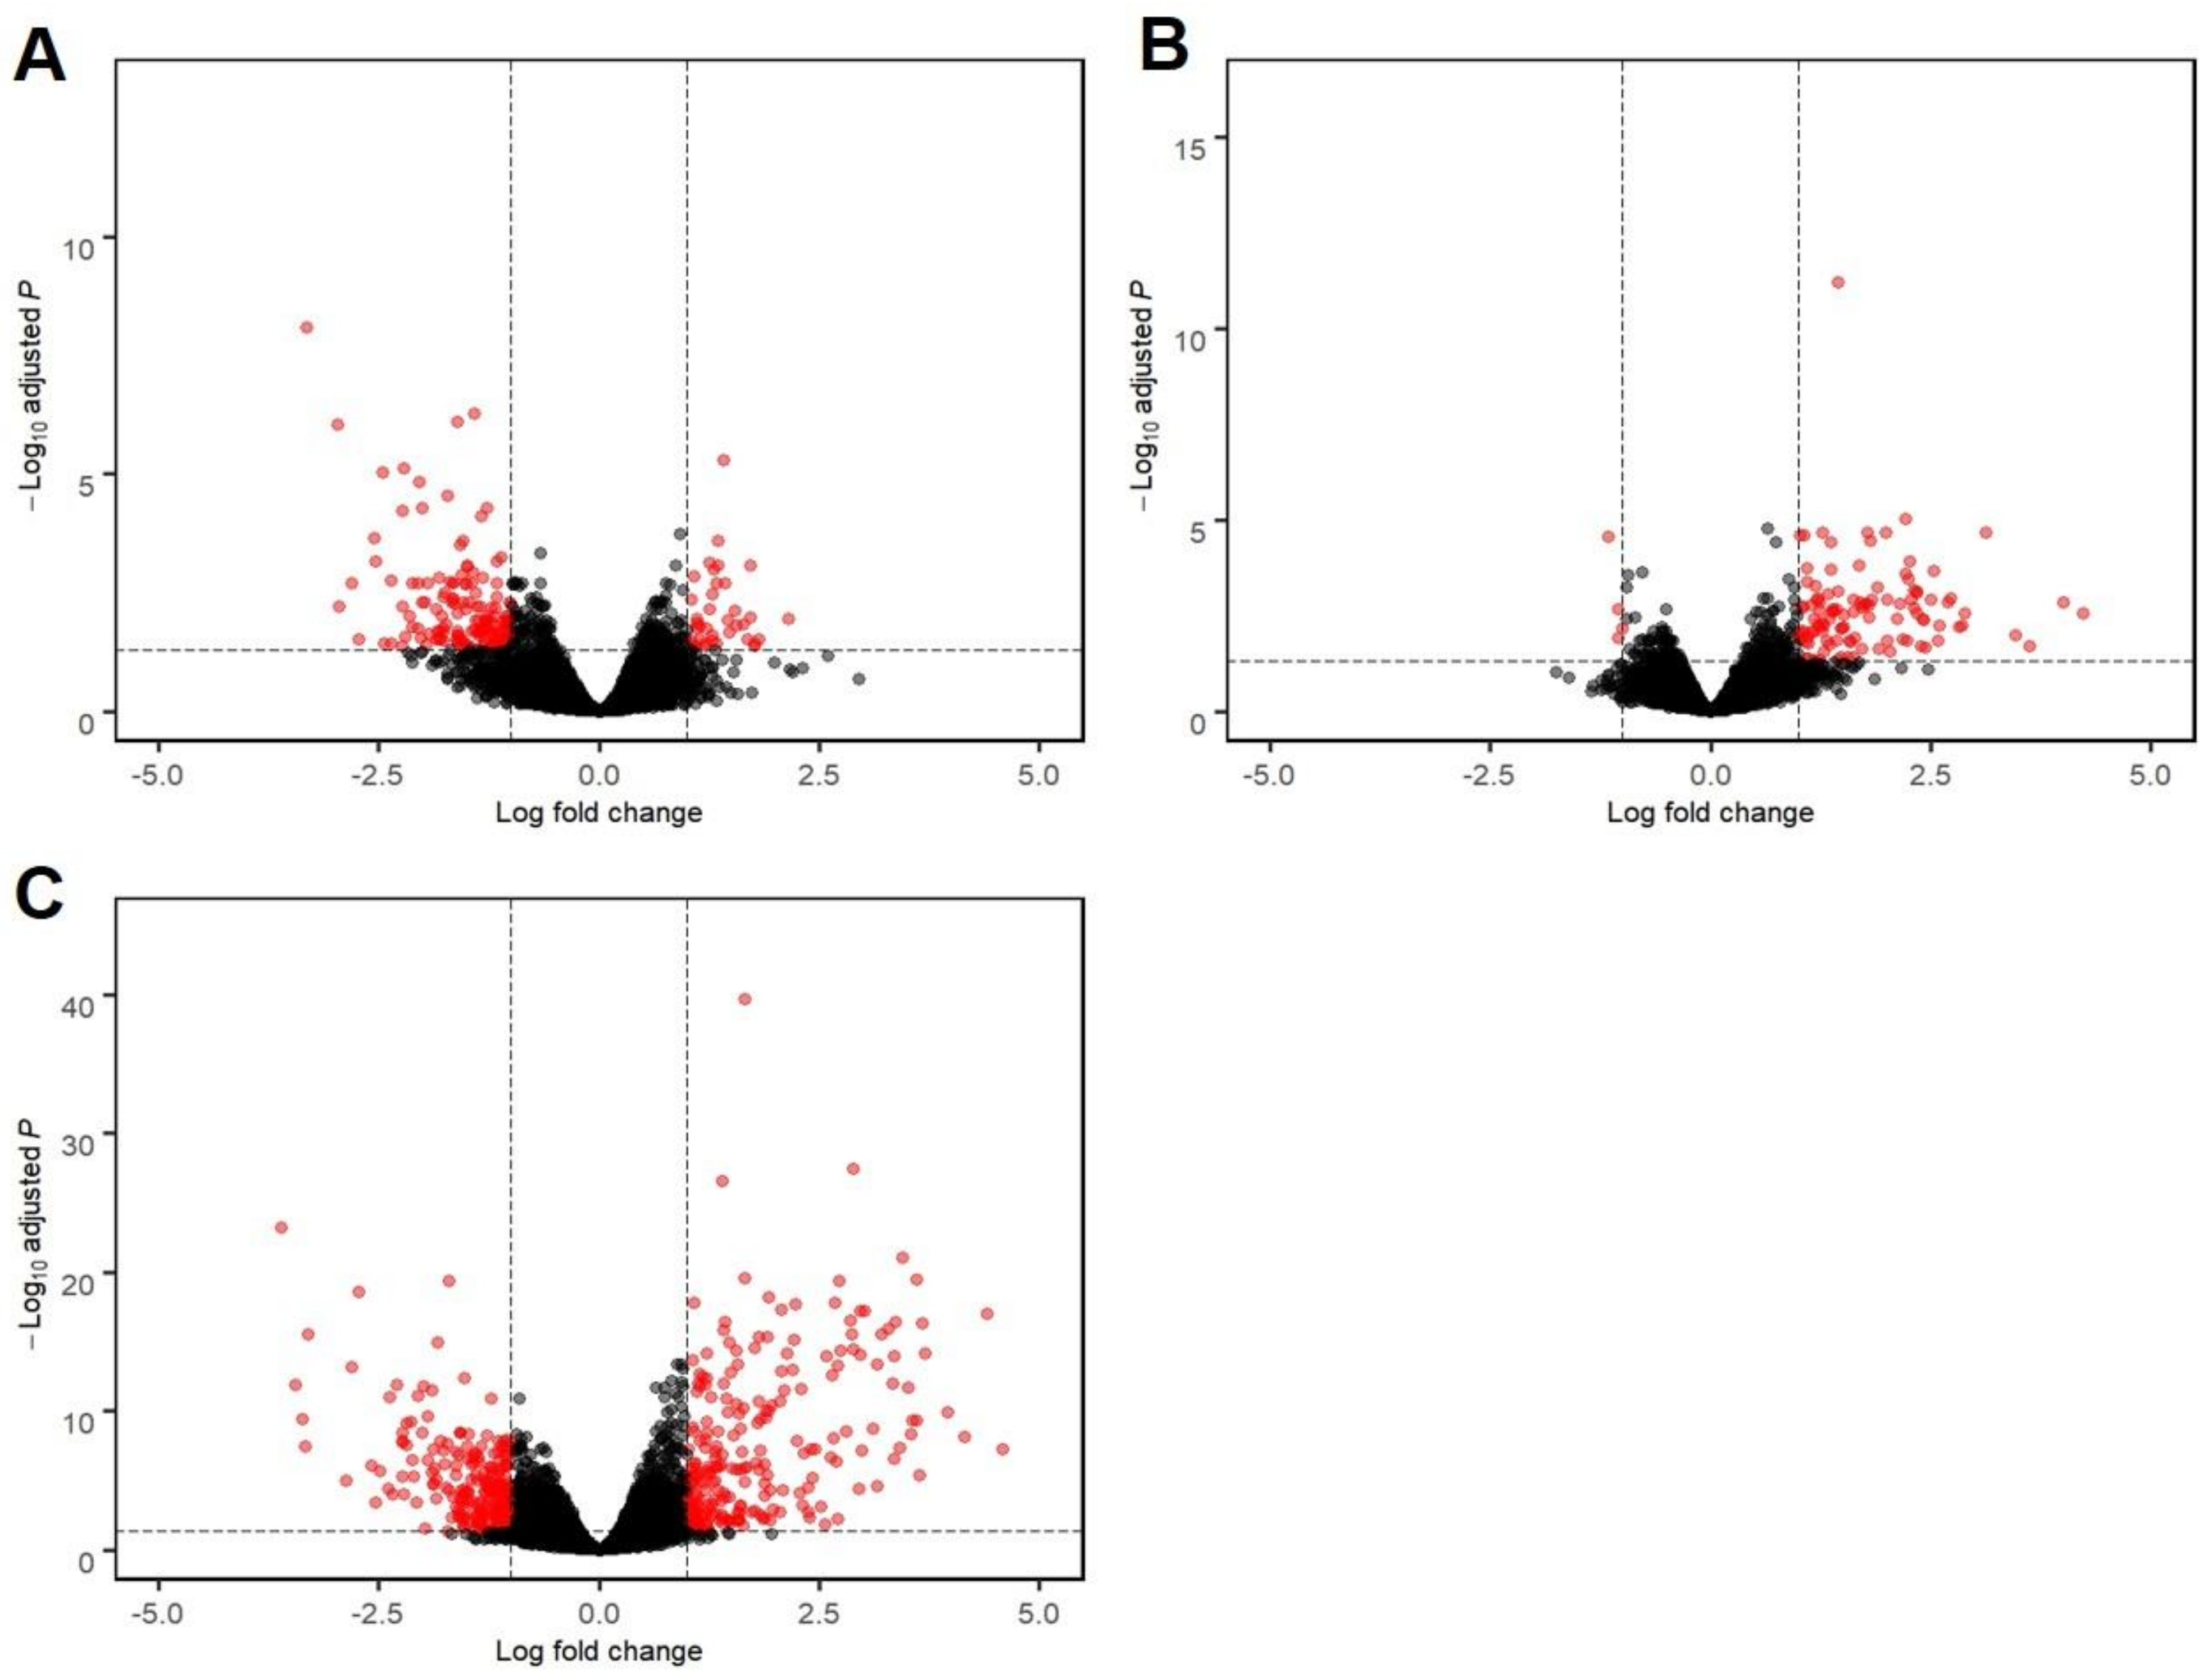
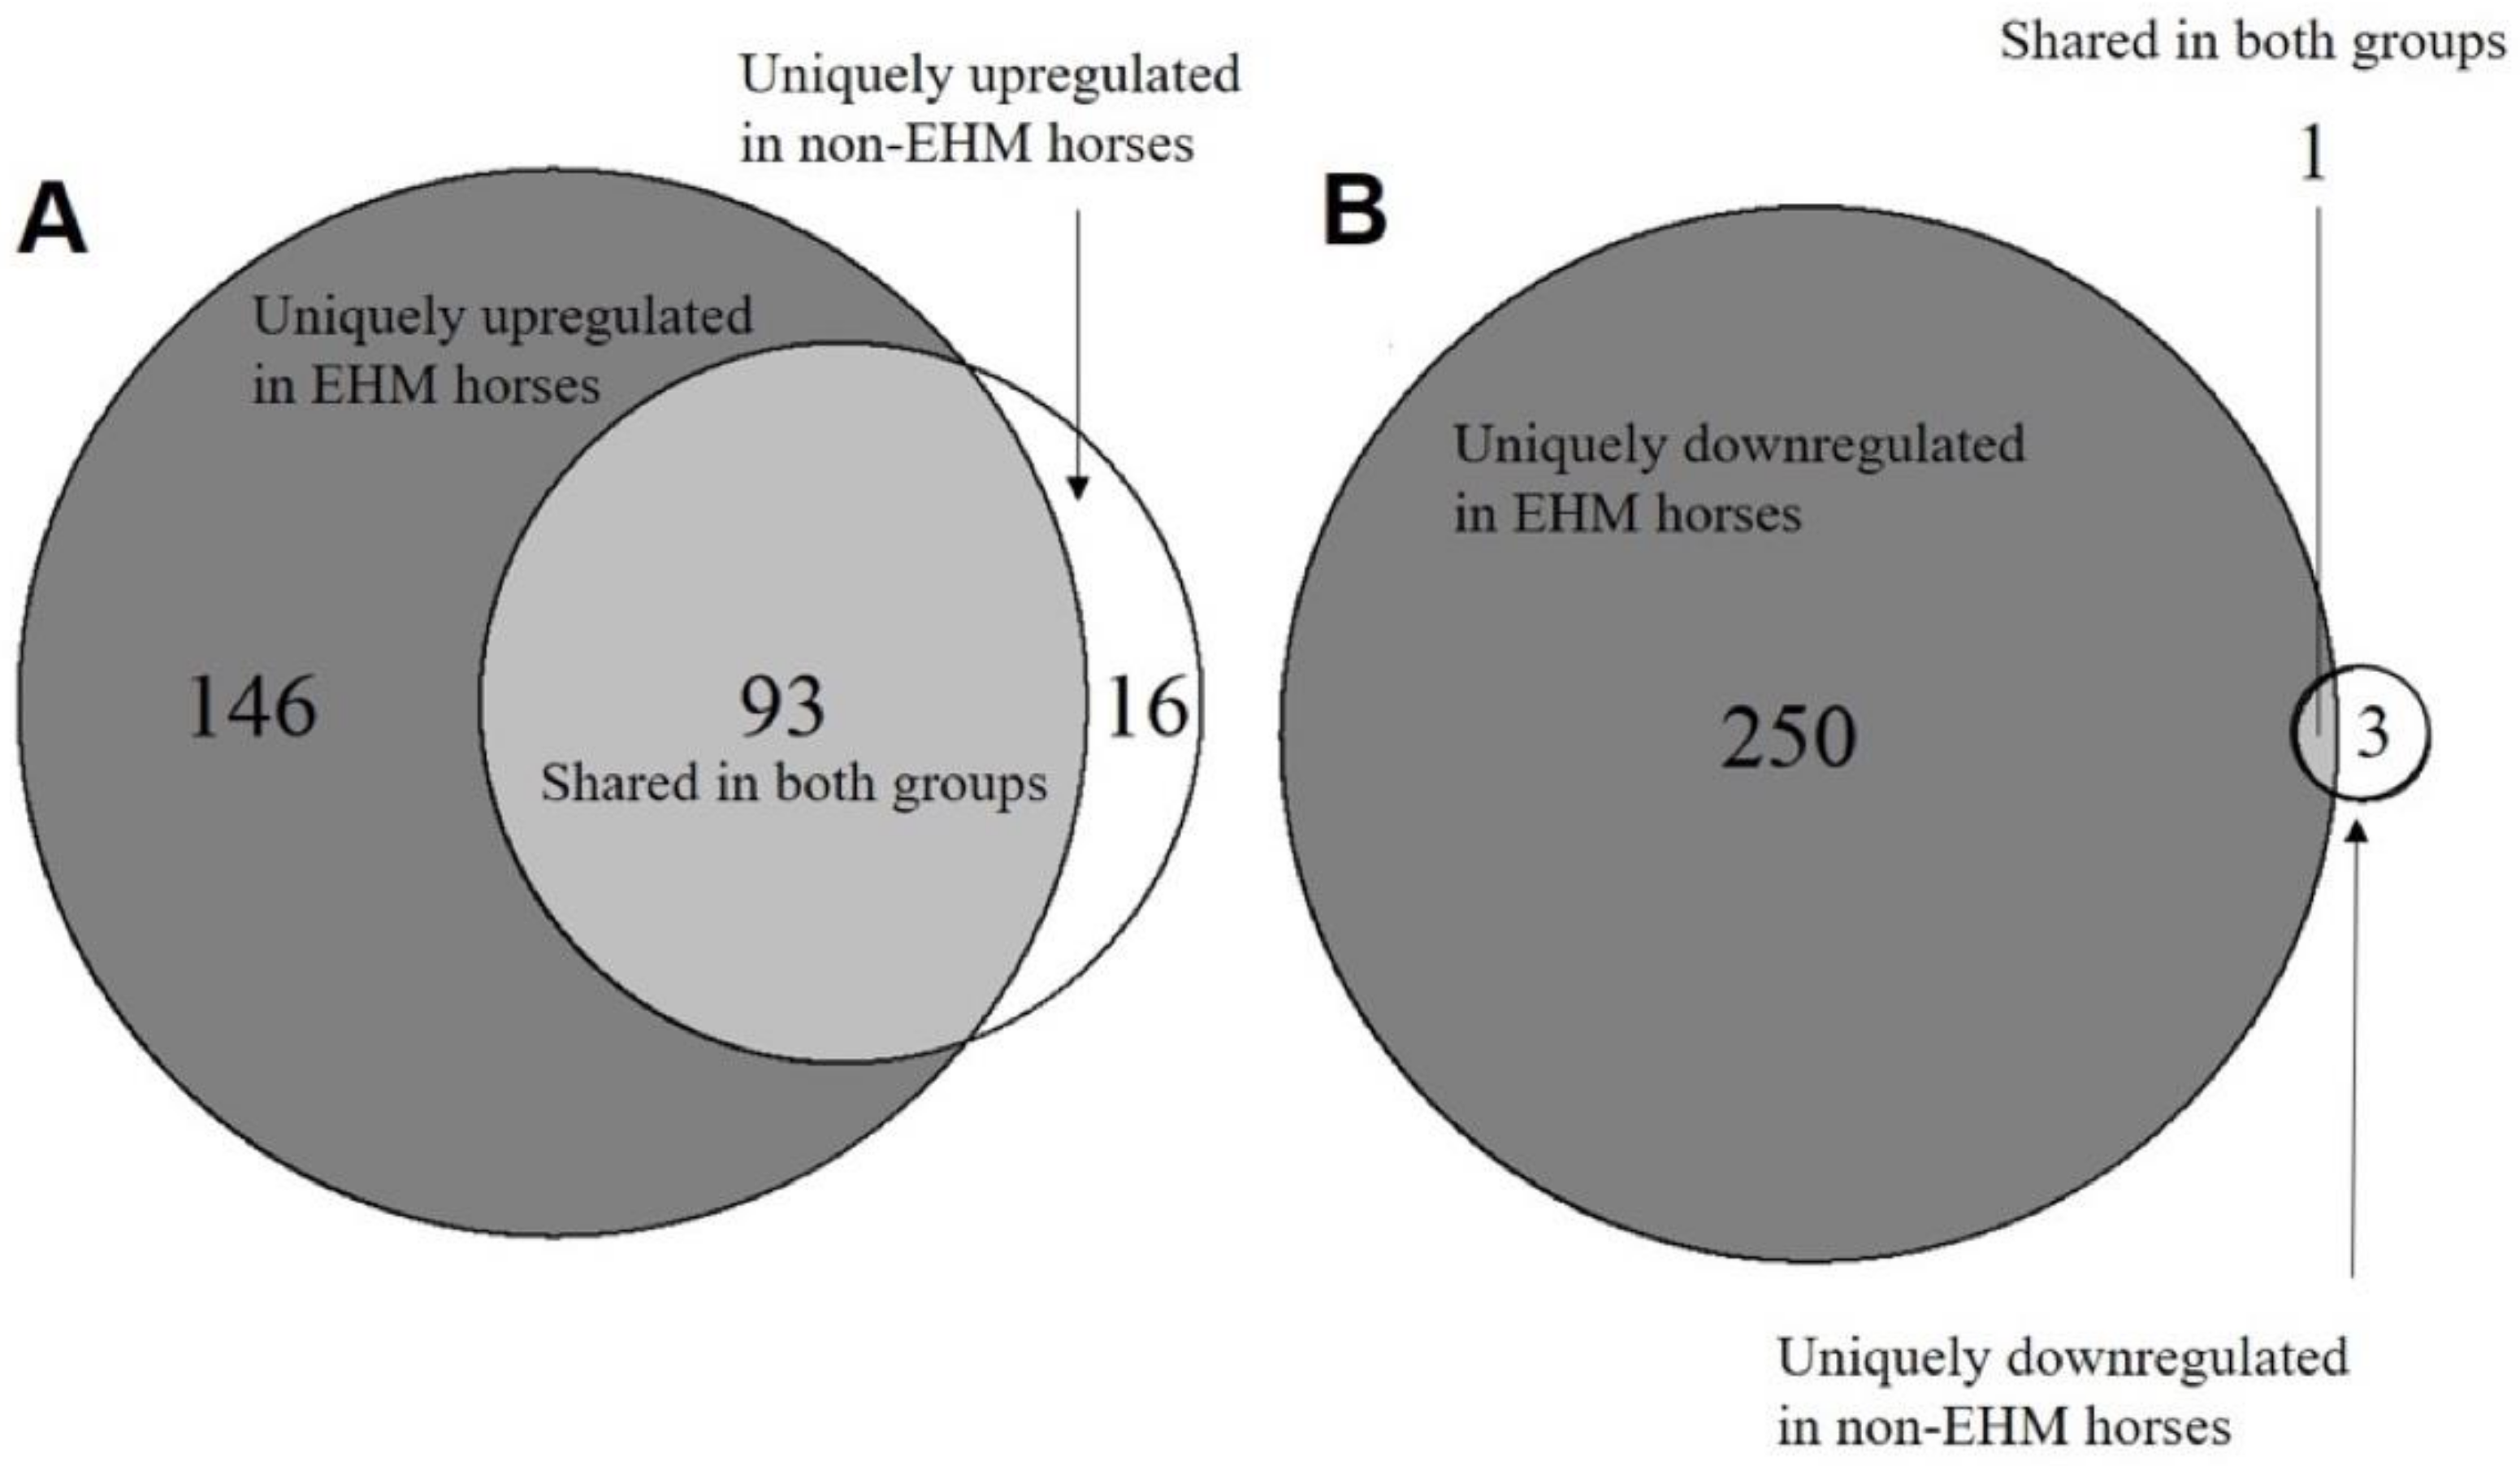
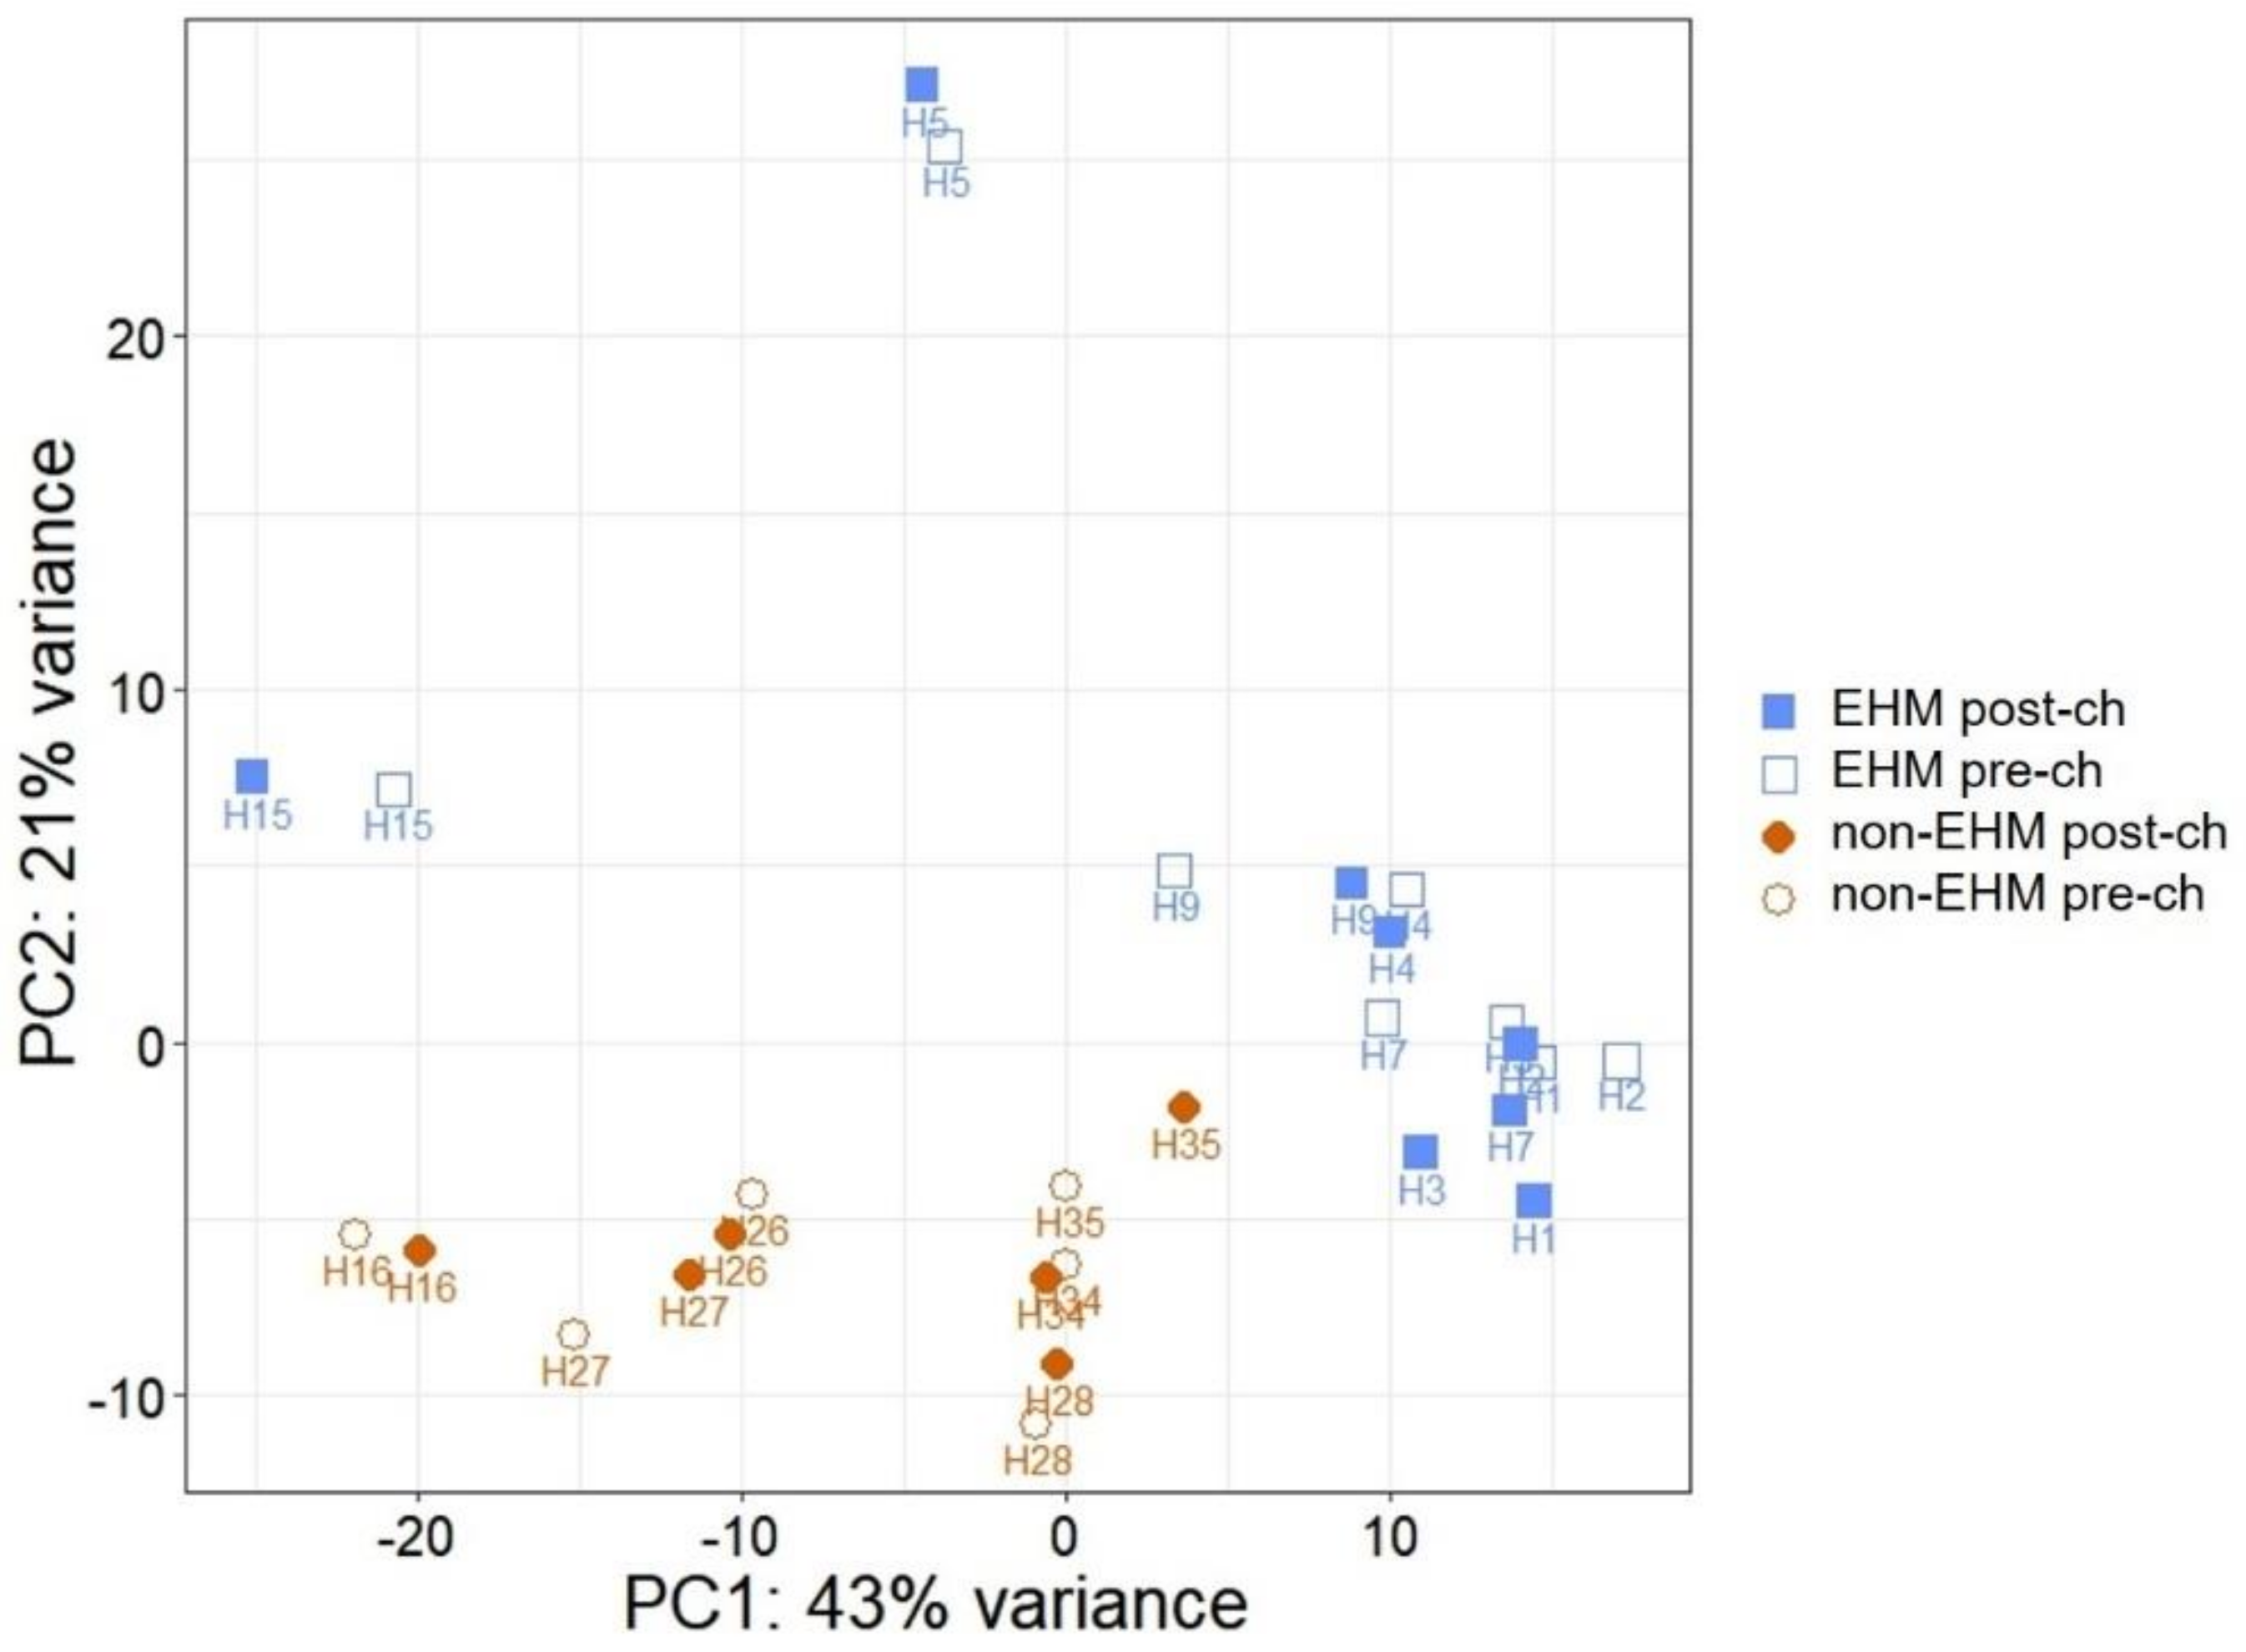
3.2. mRNA Sequencing Revealed Differential Host Gene Expression between EHM and Non-EHM Horses

After paired-end sequencing, there was an average of 43,730,408 reads per sample, and 85.2% of total reads uniquely mapped to the EquCab3.0 genome (Table S1). Principal component analysis of the regularized log transformed read-count data showed a clustering of samples, with a few exceptions, based on timepoint (pre CH vs. post CH) and group (EHM vs. non-EHM) (Figure 4).
A repeated measure study design was used to assess differential gene expression in response to EHV-1 CH both between groups and within groups. The between group comparison (contrast comparison) identified the differentially expressed genes between the response to the virus in EHM vs. non-EHM horses. This was performed in order to identify the potential host factors or biological responses that contributed to EHM pathogenesis. We then supported these findings by identifying additional genes that were uniquely found to be differentially regulated in either EHM or non-EHM horses in response to infection, but not in both groups. For this, we identified the within group responses by determining the response to CH (pre vs. post CH) in the EHM and non-EHM groups and then selecting which of these genes were unique to each group (unique to EHM or unique to non-EHM). Significance was set at FDR < 0.05 and log fold change >|1|.
For the between group comparison (contrast), there were 181 DEGs (37 upregulated and 144 downregulated in EHM horses, compared to non-EHM horses) (Figure 5A, File S1).
For the within group response for non-EHM horses, there were a total of 113 DEGs (109 upregulated during infection and 4 downregulated during infection) (Figure 5B, File S1). When looking at the within group response for the EHM horses, there were a total of 490 DEGs (239 upregulated during infection and 251 downregulated during infection) (Figure 5C, File S1).
In order to identify genes that were uniquely upregulated and downregulated in either group during EHV-1 infection, we used a Venn diagram (Figure 6). There were 93 commonly upregulated and 1 commonly downregulated gene shared between EHM and non-EHM horses. There were 146 uniquely upregulated and 250 uniquely downregulated genes in EHM horses (potential risk factors) and 16 uniquely upregulated and 3 uniquely downregulated in non-EHM horses (potentially protective factors) (Figure 6A,B).

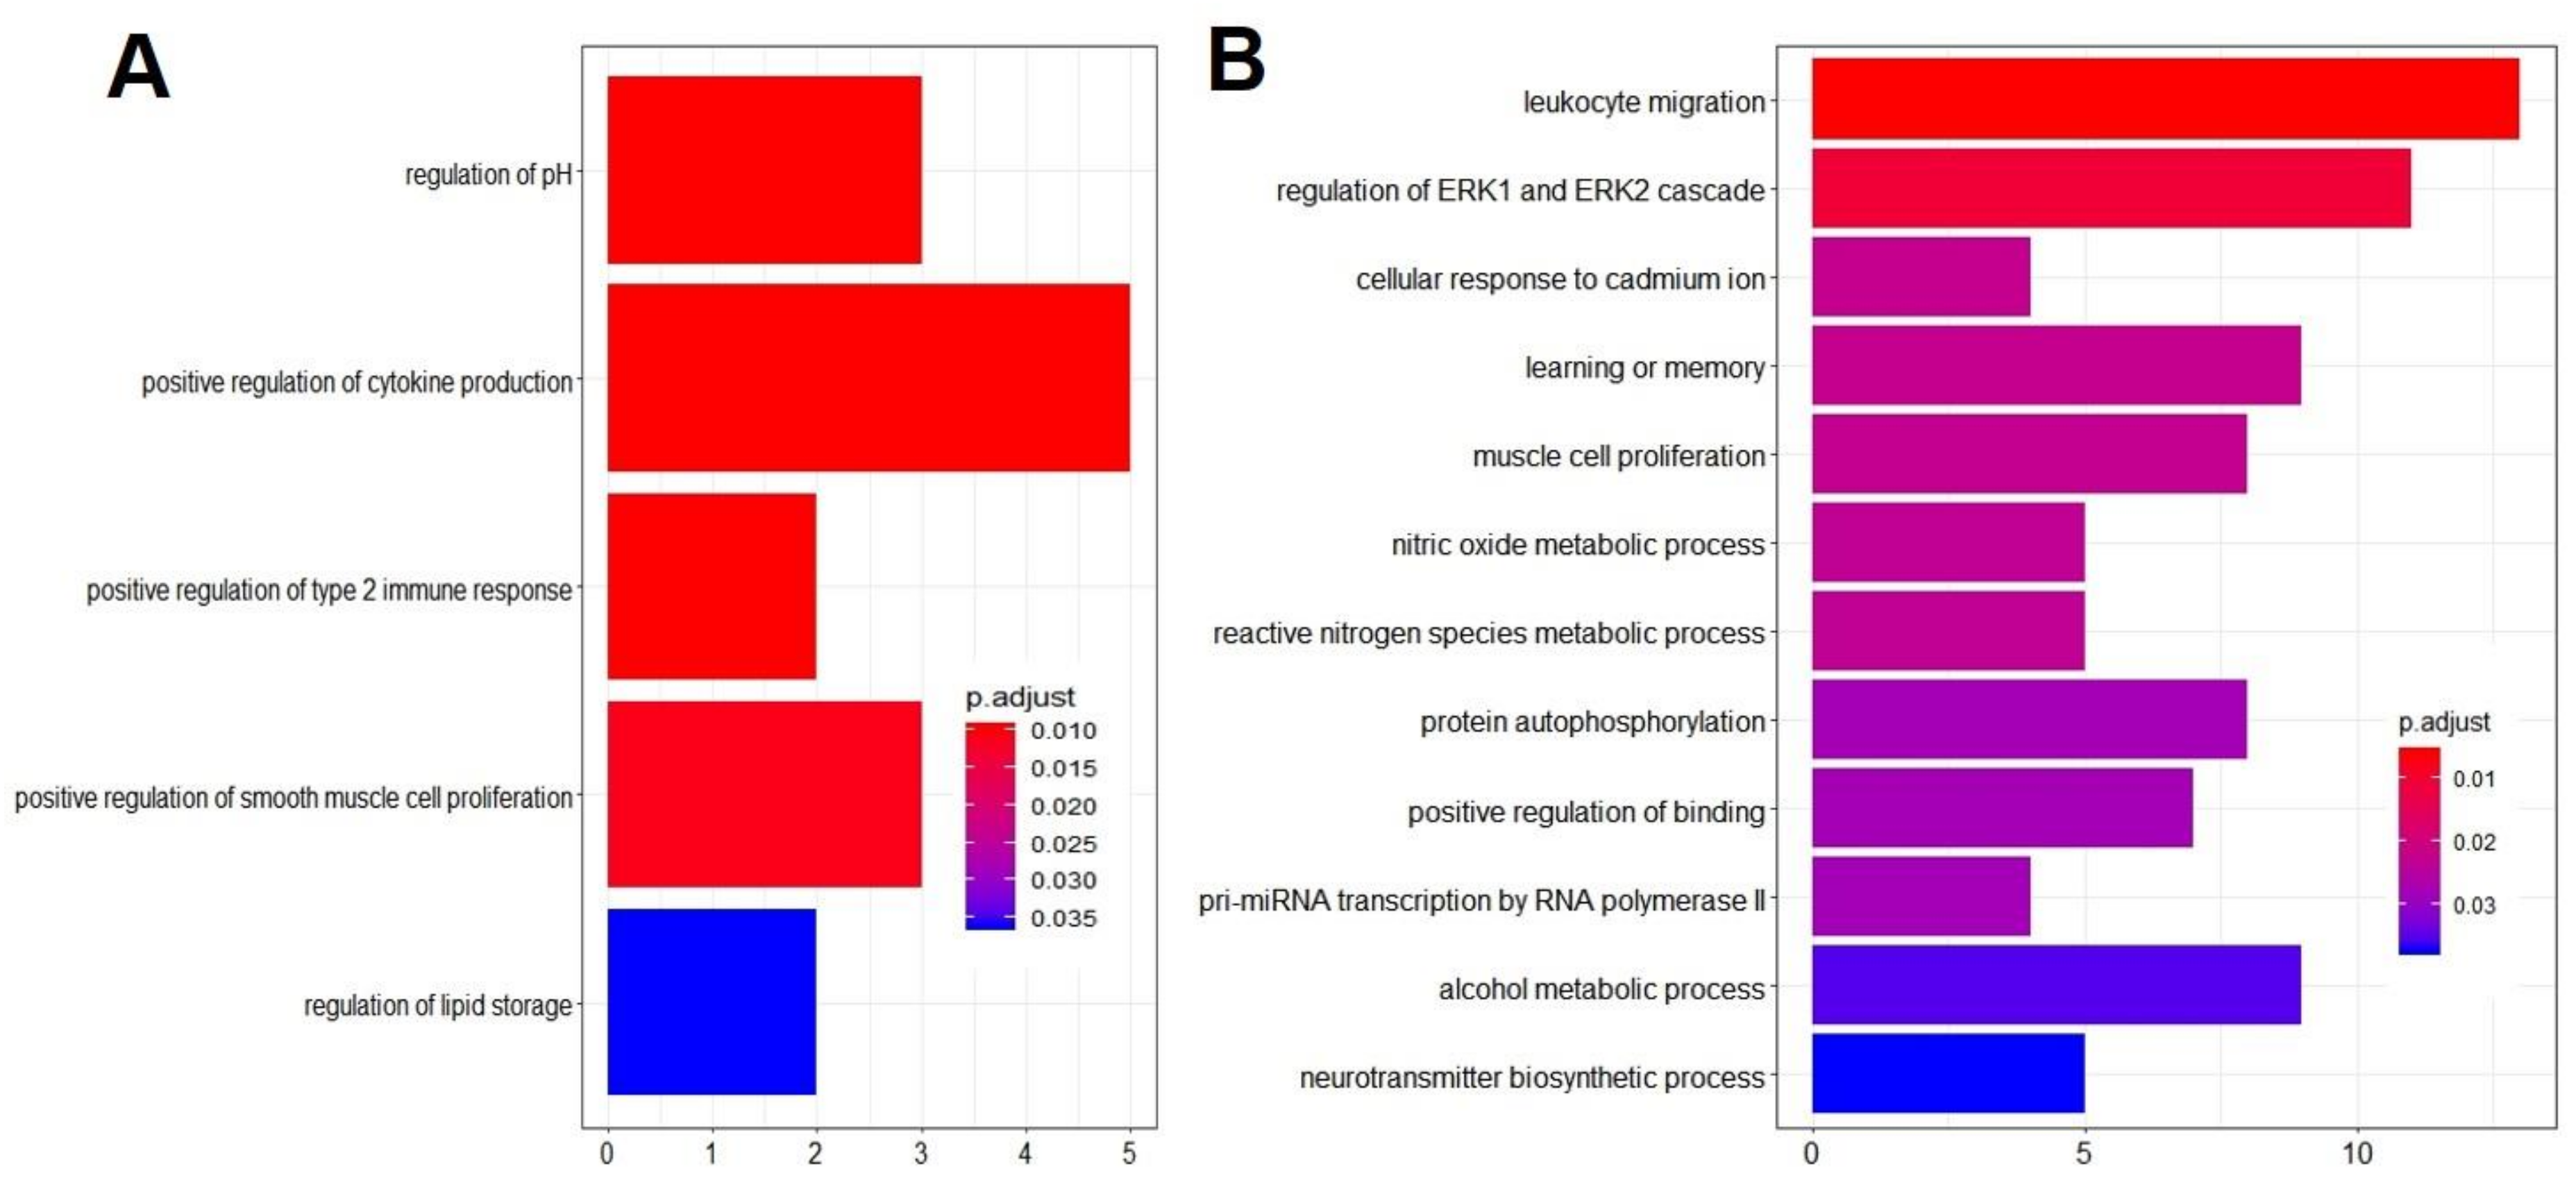
3.3. Gene Ontology Overrepresentation Analysis Identified Enriched Biological Processes in EHM Horses

A list of all enriched GO terms for the between group contrast comparison and also for the within group comparison unique to EHM horses can be seen in File S2. Due to the limited number of uniquely regulated genes in non-EHM horses, GO overrepresentation analysis did not result in any enriched terms. After removing redundant GO terms using REVIGO analysis, for the between group contrast comparison, there were five enriched biological processes (with eight associated genes) from upregulated genes in EHM horses compared to non-EHM horses (Figure 7A and Figure 8A, Table S2), and 12 enriched biological processes from the downregulated genes (with 36 associated genes) (Table S2, Figure 7B and Figure 8B).
When looking at the genes differentially regulated in response to CH uniquely in EHM horses, a total of 12 biological processes were enriched (with 39 associated genes) and 7 biological processes downregulated (with 41 associated genes) (Table 1).
For the between group contrast comparison, the gene associated with the most biological processes upregulated in EHM horses compared to non-EHM horses was IL6, which was involved in 4/5 enriched biological processes (Figure 9A). IL6 encodes the interleukin-6 (IL-6) protein, which is implicated in several diseases involving immune mediated damage of the vascular endothelium and serves as an important biomarker in human stroke [56,57]. Additional upregulated responses included positive regulation of T-helper type 2 immune response (IL6, RSAD2), positive regulation of cytokine production (NOX1, RSAD2, IL1RL1, IL6, LPL) and regulation of cellular pH (NOX1, SLC4A9, SLC9B1) and upregulation of the interferon stimulated gene (RSAD2; Figure 9B). As seen in the between group contrast comparison, the gene involved with the most enriched process uniquely upregulated within EHM horses was also IL6. Additionally, upregulated functions and the associated genes were largely related to the defense response to virus and the type 1 interferon response pathway (CYBB, ACOD1, ZBP1, IRF9, TGM2, NR1H3, IL15, IRF7, CCL8, ISG20, NMI, CD180, ISG15, TIMP1, ADAR, AIM2, EIF2AK2, CXCL10, RTP4, IL6, TRIM56, LPL, TLR3, LAG3, SLPI) (Figure 9A,C).
For the processes that were downregulated in the between group contrast comparison, JUN and FOS, the genes which encode the subunits for the AP-1 transcription factor (also important for T-cell activation) were downregulated (Figure 9D,E). FOS (en-coding c-fos protein) and JUN (encoding c-jun protein) are protooncogenes well known for their role in cell proliferation [58]. The downregulation of FOS and JUN corresponded to the many other genes (KLF4, INSR, JUN, PDGFB, FGFR1, CCL5, EPHA4, NLRP12, DUSP1, ATF3, DUSP6) we observed downregulated that are known to be related to either positive or negative regulation of the mitogen-activated protein kinase cascades (such as the extracellular signal related kinase cascade) which are important in T-cell activation and proliferation [59]. Furthermore, a key proinflammatory cytokine gene expressed by activated T-cells, IFNG, was downregulated in EHM horses (Figure 9F). Other functions downregulated included leukocyte migration (IFNG, KLRK1, TREM1, PLCB1, NLRP12, CCL5, MMP9, CD244, PDGFB, SLC7A11, DUSP1, CX3CR1, DAPK2, TBX21), regulation of apoptosis (ACER2, IFNG, KLRK1, JUN, NLRP12, CCL5, PLK2, ATF3, FGFR1, MMP9, KLF4, SLC7A11, DUSP1, CX3CR1, DAPK2, GSN, DUSP6), regulation of transcription (JUN, ATF3, KLF4, EGR2, FOS, TBX21), regulation of cell adhesion (KLF4, IFNG, INSR, CX3CR1, CCL5, EPHA4, PLCB1, DUSP1, SLC7A11, ACER2), vascular endothelial cell growth and proliferation (PDGFB, FGFR1, SLC7A11), oxidative stress (MMP9, SLC7A11), and NK cell activation (KLRK1, CD244, TBX21). Additional downregulated functions were identified when evaluating the within group comparison for EHM horses including those associated with fibrinogen complex formation (THBS1, FN1), and additional JUN/FOS genes (JUND and FOSB).
Due to the limited number of uniquely regulated genes in non-EHM horses which may predict protective functions, GO overrepresentation analysis did not result in any enriched terms. Instead, we investigated the individual functions of the differentially expressed genes (Table S3). These genes had different functions and included: upregulated (BFSP2, NFE2, HEY1, CILP, SCD, CISH, TCF7L1, DUSP6, FAM111B, FRMD4A, LZTS1, SHISA5) and downregulated (CGA, SYTL2, WWTR1) genes. General functions of the upregulated genes include positive or negative regulation of signal transduction (CISH, TCF7L1, DUSP6), regulation of cell growth (LZTS1), scaffolding (FRMD4A, CILP), repression of transcription (HEY1), and a transcription factor subunit for NF-E2 (NFE2). Functions of the downregulated genes include hormone signaling (CGA), cytotoxic granule exocytosis in lymphocytes (SYTL2), and negative regulation of cell proliferation (WWTR1).

3.4. In Silico Cell Sorting Identified Differences in Cell Population Fractions between EHM and Non-EHM Horses in Response to EHV-1 Challenge

Results of the in silico cell sorting are shown in Table 2. The most abundant cell type identified in all groups was naïve B-cells with 23–37% of the cell population identifying with this fraction. In EHM horses, we observed a higher percent (~8%) of CD8+ T-cells pre-infection than in non-EHM horses (~2%). Additionally, in EHM horses, there was an increase in percentage of M1 and M2 macrophages, resting dendritic cells, and eosinophils following infection with EHV-1, but a decrease in percentage of CD8+ T-cells, regulator T-cells, resting NK cells, M0 macrophages, and activated mast cells. In the non-EHM horses, there was an increase in plasma cells and CD4+ activated memory T-cells and a decrease in naïve B-cells and follicular helper T-cells. In both groups, there was an increase in percentages of γδ T-cells and activated dendritic cells (Table 2).

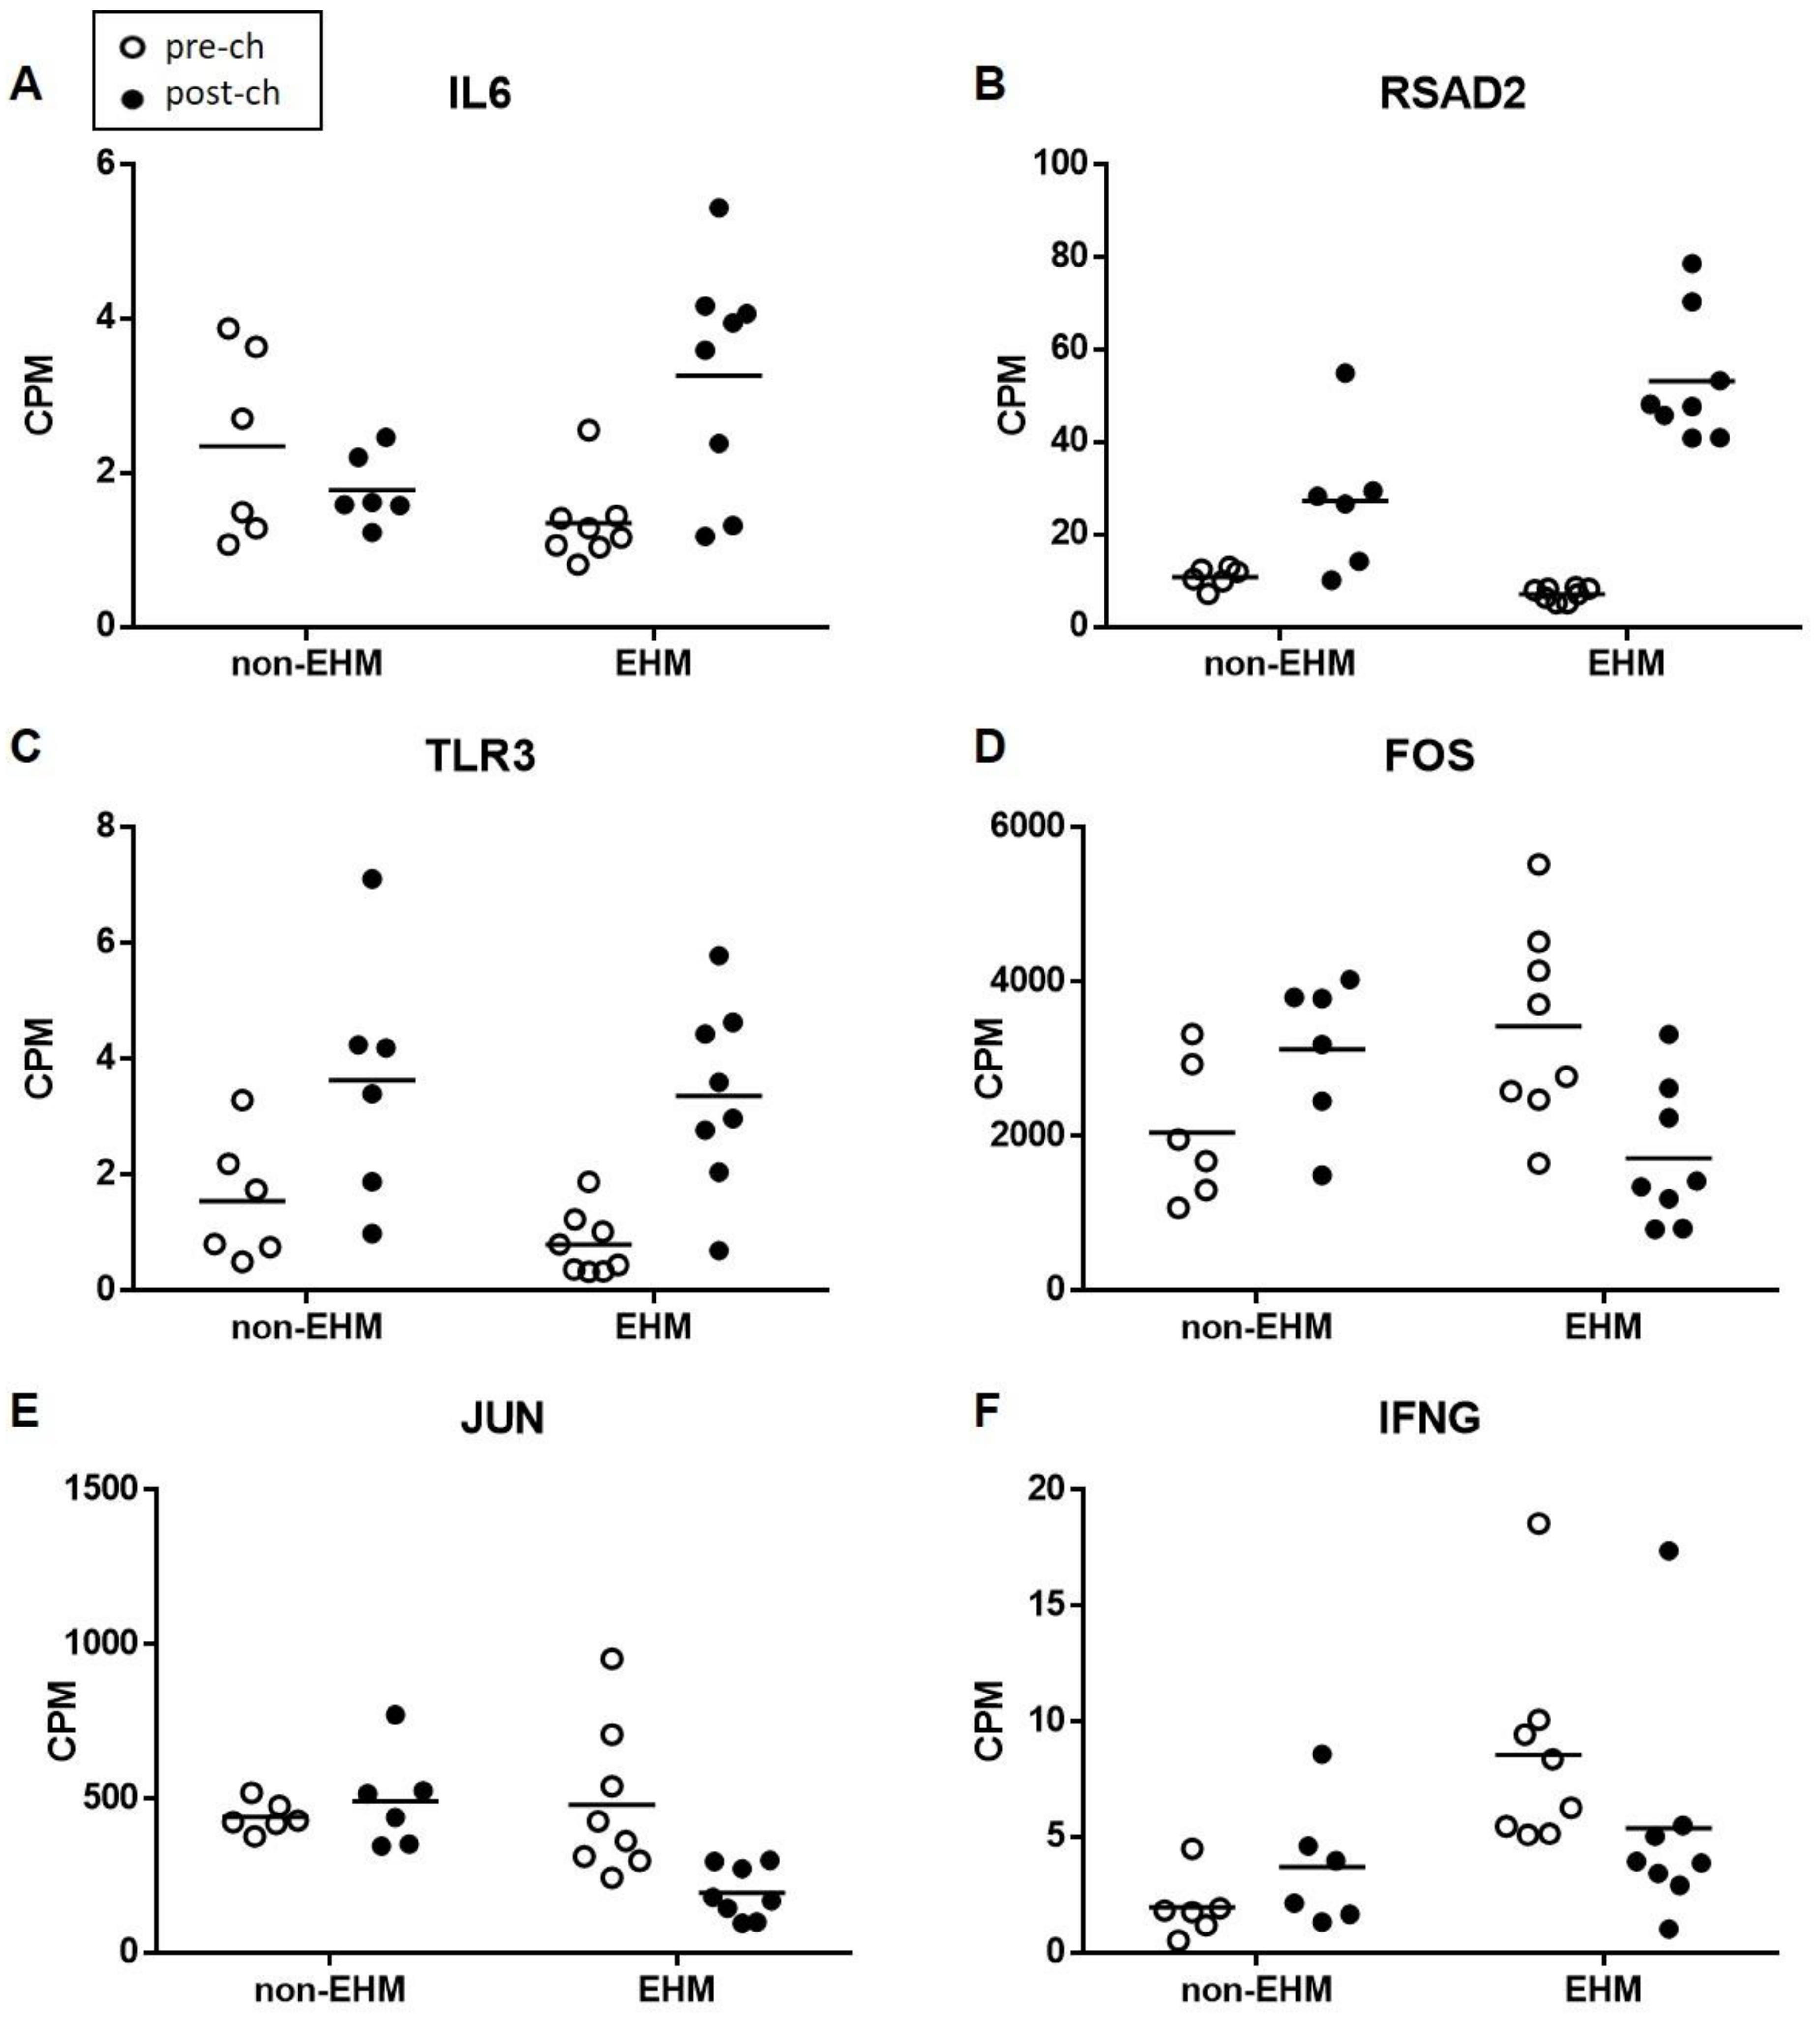
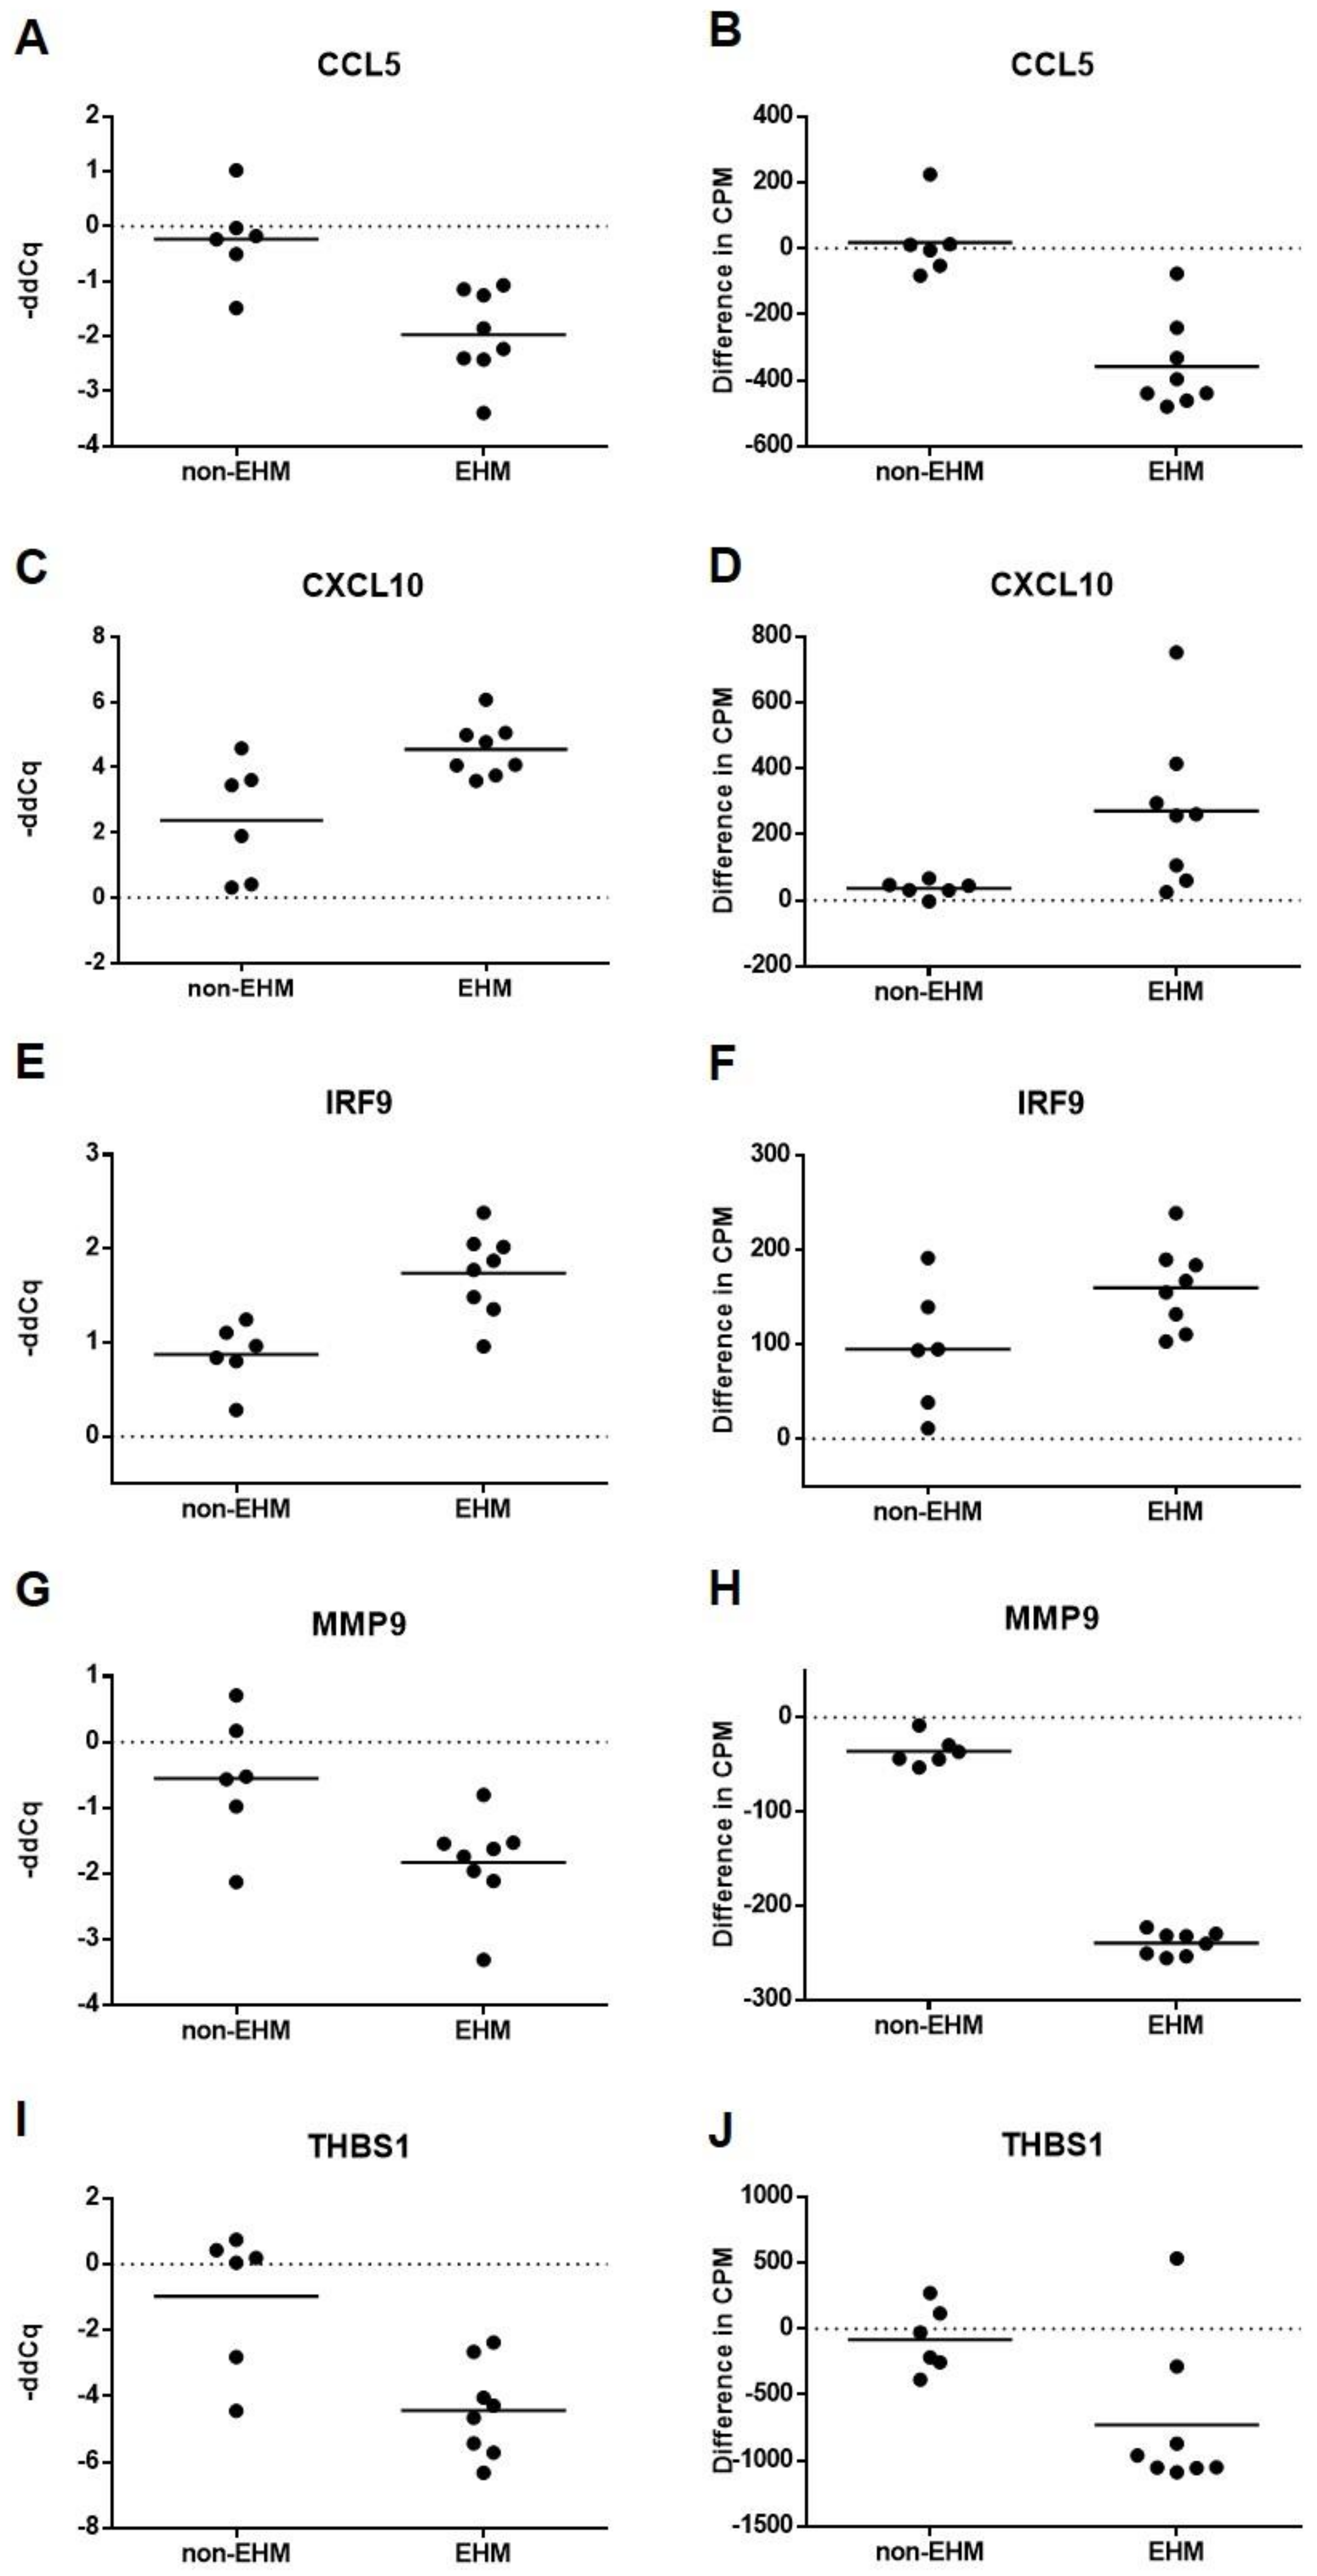
3.5. Whole Blood Cytokine RT-qPCR Confirmed Differential Expression of Select Genes between EHM and Non-EHM Horses

In order to validate the differential gene expression results of our RNA sequencing analysis, RT-qPCR cytokine gene expression for select genes was determined from whole blood RNA collected pre CH and day 7 post CH. In agreement with RNA sequencing differential gene expression results from PBMCs, RT-pPCR from whole blood showed CCL5, MMP9, and THBS1 were significantly downregulated in the EHM group when compared to non-EHM horses (Figure 10A,G,I). In agreement with RNA sequencing data, CXCL10 and IRF9 expressions were also significantly upregulated in the EHM group when compared to non-EHM horses (Figure 10C,E). IRF7 was upregulated in EHM horses when compared to non-EHM horses, though this was not significant (p = 0.14). For a convenient comparison, the normalized count data obtained from the RNA sequencing analysis from PBMCs for these genes have been expressed as delta-CPM (post CH CPM value—group average of pre CH CPM) and can be seen in Figure 10.

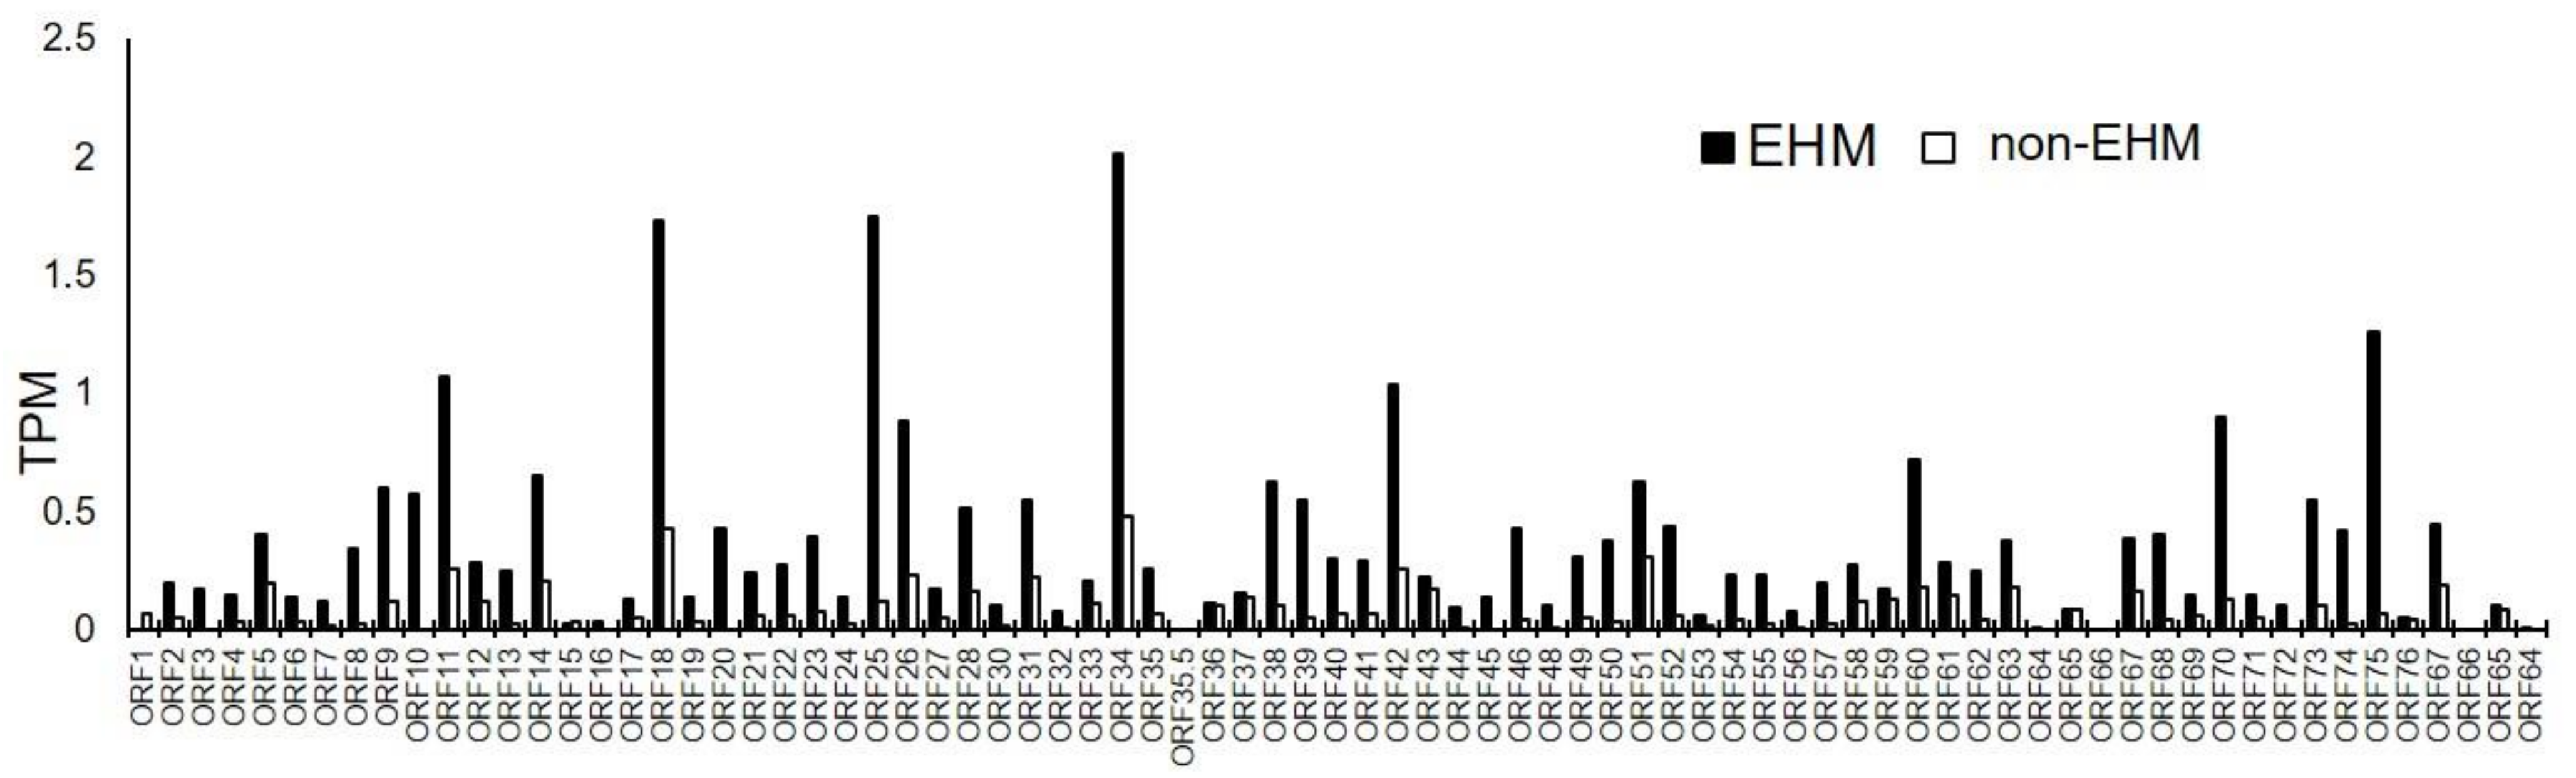
3.6. Viral mRNA Sequencing Identified EHV-1, EHV-2, and EHV-5 Transcripts in PBMCs Prior to and after EHV-1 Challenge Infection

Normalized read counts expressed as transcripts per million (TPM) for EHV-1, EHV-2, and EHV-5 are found in File S3. No reads mapped to the EHV-4 genome. There was a low level of transcription of a single EHV-1 gene in two of the EHM horses prior to the EHV-1 CH (File S3). As expected, during EHV-1 viremia post CH EHV-1 transcripts were present in all samples. The most abundant EHV-1 genes expressed in EHM horses during peak viremia were ORF34, ORF25, ORF18, and ORF75 (Figure 11). The products of these genes include a protein involved in the early step of virus egress (ORF34) and a capsid protein (ORF25), a DNA polymerase processivity factor (ORF18) and a membrane protein presumed to be involved in the virulence of certain EHV-1 strains (ORF75) [60,61]. The most abundant EHV-1 genes induced in non-EHM horses during viremia were ORF34, ORF18, ORF51, and ORF42 (Figure 11). ORF51 encodes the pUL11 protein which appears to have differing roles in viral replication depending on the strain; however, it has been shown to be essential for replication of strain Ab4 in cell culture [62,63]. ORF42 encodes a capsid protein [60]. Additionally, transcription of the equine gammaherpesvirus (EHV-2 and EHV-5) genes were present in PBMCs prior to and post EHV-1 CH in both non-EHM and EHM groups (File S3). EHV-2 transcripts were identified in 1/8 and 2/8 EHM horses pre and post EHV-1 CH, respectively, and 3/6 and 4/6 non-EHM horses pre and post EHV-1 CH, respectively. EHV-5 transcripts were identified in 2/8 and 3/8 EHM horses pre and post EHV-1 CH, respectively, and 4/6 and 3/6 non-EHM horses pre and post EHV-1 CH, respectively (File S3).

3.7. Host, EHV-2, and EHV-5 miRNAs Were Identified in PBMCs of Horses

MiRDeep2, a software tool for miRNA mapping and identification, identified 285 known mature equine miRNAs amongst the pooled samples. Furthermore, we identified 962 total novel miRNAs with a miRDeep2 score > 1 (File S4). Of these novel miRNAs, 860 mapped to the equine genome, 52 mapped to the EHV-2 genome, and 50 mapped to the EHV-5 genome. For EHV-2, the miRNAs clustered around three general regions on the genome: 38–44 kb and 176–182 kb on the plus strand, and 125–127 kb on the minus strand. For EHV-5, the miRNAs clustered around two general regions: 36–43 kb on the plus strand and 125–127 kb on the minus strand (File S4). Interestingly, no miRNAs were identified that mapped to either of the equine alpha herpesviruses, EHV-1 or EHV-4 (File S4).

3.8. Host miRNAs Were Differentially Expressed between EHM and Non-EHM Horses in Response to EHV-1 Challenge Infection

Novel miRNAs with a miRDeep2 cutoff > 1 were added to the list of known miRNAs for quantification in each sample and quantification was performed to identify differentially expressed miRNAs in horses pre and post EHV-1 infection. There was an average of 14,122,680 reads per sample with an average mapping of 59.7% (Table S4). Principal component analysis plot analysis of these counts indicated that samples clustered based on group (EHM vs. non-EHM), rather than within horses as a result of infection (Figure 12).
Thus, it was not surprising to have limited numbers of miRNAs differentially ex-pressed as a result of EHV-1 infection. For the contrast comparison looking at the differences in response to infection between EHM and non-EHM groups, two miRNAs were upregulated and seven miRNAs were downregulated in EHM horses compared to non-EHM horses (Table 3). For the within group comparisons, there were no miRNAs differentially expressed in non-EHM horses pre vs. post EHV-1 CH. In contrast, in the within group comparison for EHM horses, there were five miRNAs uniquely upregulated and five miRNAs uniquely downregulated in response to EHV-1 CH (Table 3).
All of the upregulated genes for both the contrast and within group comparisons identified as novel miRNAs. These included one with the murine ortholog mmu-miR-7059-5p which has been shown to be involved with the downregulation of immunoregulatory genes and pathways [64]. Another miRNA upregulated in EHM horses included one with the human ortholog hsa-miR-7108-3p, which has been shown to be upregulated in the serum of human stroke patients compared to controls [65].
Most of the downregulated genes in EHM horses were known equine miRNAs, though not much is currently understood about their biological function in horses. In addition, while miRNAs may play a role in many biological processes, current knowledge of the functions for specific miRNAs is limited to those that have been elucidated from experimental investigation for particular diseases of interest. Thus, there is much unknown regarding the function of many miRNAs, particularly in horses. The human or murine orthologs of most of our downregulated miRNAs (hsa-miR-199a-3p [66,67], hsa-miR-34a-5p [67,68], hsa-miR-542-5p [69,70], hsa-miR-10a-5p [71], hsa-miR-328-3p [72,73], and hsa-miR-138-5p [74]) have been shown to be involved in cell cycle control, apoptosis, or cancer, with the majority having a tumor suppressor function. In horses, many of these (eca-miR-138, eca-miR-328, eca-miR-10b, eca-miR-34, and eca-miR-199) have also been identified in the male reproductive tract and are presumed to be involved in cell motility and viability of equine spermatozoa [75]. Additionally, eca-miR-34c has been shown to also be downregulated in equine ocular squamous cell carcinoma tissue, and it is presumed that the downregulation promotes tumorigenesis by providing a metabolic advantage through fatty acid synthesis [76]. We also found eca-miR-146a/eca-miR-146a downregulated in EHM horses compared to non-EHM horses. In humans, hsa-miR-146a-5p targets factors to reduce p38/JNK mediated inflammation in adipocytes [77], and in horses eca-miR-146a has been identified in the male reproductive tract [75]. Finally, eca-miR-328 and eca-miR-483 have been previously shown to be differentially expressed in the serum of certain breeds, which is interesting considering pony breeds are less likely to acquire EHM compared to other breeds [1,78]. In the serum of ponies, eca-miR-328 was shown to be downregulated and eca-miR-483 upregulated compared to the warmblood breed horses [78]. In our study, both of these miRNAs were downregulated in EHM horses compared to non-EHM horses.
Target gene prediction of the differentially expressed miRNAs identified a number of genes that were also identified as differentially expressed genes from mRNA sequencing in the contrast (between group) comparison and/or the within group comparison unique to EHM horses in response to infection (Figure 13, Table 3).
For the predicted target genes of upregulated miRNAs we identified 20 genes common with differentially expressed genes in the contrast (between group) comparison and 51 genes that were common with the differentially expressed genes unique to EHM horses (within group comparison). For the predicted genes of upregulated miRNA, we identified 39 genes common with differentially expressed genes in the contrast comparison and 87 genes that were common with the differentially expressed genes unique to EHM horses. In addition, while there was no miRNA differentially expressed in non-EHM horses, a few of the miRNAs differentially expressed in EHM horses targeted genes that were differentially regulated in non-EHM horses (SCD, CILP, LZTS1, SHISA5, TCF7L1).
Common predicted target genes of upregulated miRNAs included genes known to be involved in the regulation of the mitogen-activated protein kinase cascades (such as the extracellular signal-related kinase cascade) (MAPK13, FOSB, JUND, CREB5, ATF3), which are important in T-cell activation and proliferation [59] as well as genes important in the interferon response (ADAR, OAS21). In addition, there were a number of common predicted target genes with a role in cell migration and cell-to-cell junction assembly (NTNG2, NEO1, JAM2, F11R, PARDG6, PTPRF, NFASC, SDC3, PLEKHG5, HIC1), as well as genes with semaphoring and ephrin receptor activity (PLXNP1, SE-MA6C, SEMA4C, SRGAP1), which are known to play a role in immune pathologies and neurodegenerative diseases [79].
Common predicted target genes of downregulated miRNAs also included JUN and FOS genes known to be involved in the regulation of the mitogen-activated protein kinase cascades similar to what was observed for the differentially upregulated miRNAs (DUSP1, FOSB, JUND, CREB5, FOS). In addition, common predicted targets included genes related to the fibronectin III superfamily (EPHA4, FN1, PTPRF, INSR, INSRR, NFASC). These genes are thought to be important for cell adhesion, cytoskeletal reorganization, cell migration and hemostasis. Finally, common predicted targets included kruppel-like-transcription factors (KLF6, KLF4 and ZBTB16), which have recently been shown to be involved in DMSO-induced reactivation from latency for bovine herpesvirus-1 [80].

4. Discussion

In this experiment we utilized the “old mare model” (female horses > 18 years old) to reliably induce EHM and to compare infection with EHV-1 between EHM and non-EHM “protected” horses. This approach was based on the fact that EHM typically only occurs sporadically in EHV-1 infected horses and is challenging to induce experimentally [19]. However, EHM has been shown to occur in >70% of experimentally infected aged horses and is more likely to occur in mares [13,31]. The increased propensity of older horses to develop EHM following EHV-1 infection is presumed to be a result of differing host immunity. Our goal was to take advantage of this phenomenon and use RNA sequencing to analyze the transcriptomic profile of PBMCs in horses that did and did not develop EHM to elucidate potential host mechanisms involved in the pathogenesis of EHM.
Evaluating this comparison, we found an upregulation of the gene encoding the interleukin-6 (IL-6) protein in PBMCs of EHM horses when compared to non-EHM horses. Excessive IL-6 production is a key feature of the condition known as “cytokine storm” and is considered to be a major contributor to vascular damage during disorders such as sepsis or systemic inflammatory response syndrome [57]. In PBMCs, monocytes and T-cells are the likely sources of IL-6 during an infection [81]. IL-6 is also widely known for its role in immunopathology of several diseases including stroke [56]. Ischemic stroke in humans shares many characteristics with the pathogenesis of EHM, namely the damage to the blood−brain barrier (BBB) resulting in leukocytic inflammation and damage to the CNS. Serum IL-6 routinely predicts the severity of the CNS lesions as well as the clinical outcome in ischemic stroke patients [56,82,83,84,85]. IL-6 is thought to contribute to BBB damage in multiple ways. More specifically, IL-6 can act on endothelial cells to increase their expression of adhesion factors, which contribute to leukocyte adhesion, infiltration, and damage to the BBB [86]. Furthermore, IL-6 also plays a role in promoting thrombosis, another critical feature of BBB damage and neuropathology [87]. In horses, IL-6 has been implicated in equine diseases including equine metabolic syndrome and osteoarthritis, both of which tend to occur in older animals [88,89]. Due to its relevance in vascular damage and immune mediated disease, in addition to the upregulation we observed in the present study, IL-6 may be a candidate for use as a biomarker to predict EHM severity in EHV-1 infected horses.
Consistent with the fact that IL-6 is known to play a role in thrombosis and neu-ropathology [87], we also identified a number of genes related to fibrin clot formation and changes in vascular permeability to be significantly downregulated in EHM horses. Physiologically, hemostasis is tightly regulated by the body, as dysfunction in either timely coagulation or fibrinolysis can result in pathogenic hemorrhage or clotting disorders [90]. In horses, the coagulation cascade is known to be induced during EHV-1 viremia, and it is thought that this is a major contributor to endothelial damage and the immunopathology that leads to EHM [25,26,27,28]. In this study, we found two genes related to fibrin clot formation (THBS1 and FN1) as well as MMP9, which is associated with increasing permeability of blood vessels, to be downregulated in PBMCs of EHM horses compared to non-EHM horses. Previously, we also found upregulation of genes encoding proteins involved in coagulation during EHV-1 viremia in PBMCs [91]. In humans, decreases of THBS1 expression by endothelial cells infected with hantavirus is linked to hemorrhagic disease, and elevated serum levels have been seen in stroke patients [92,93]. Elevated levels of FN1 and MMP9 predicts endothelial damage and hemorrhage after stroke in response to thrombolytic therapy [94]. While it is unclear what precise role the downregulation of these genes in PBMCs have in the pathogenesis of EHM, our results further support a role of hemostasis (dys)regulation in EHM.
We also observed an upregulation of several interferon stimulated genes (ISGs) in EHM horses. These genes tend typically to be related to the innate immune response to viruses. Many of these ISGs were upregulated in both EHM and non-EHM horses, which is in agreement with our previous observations [91]. However, EHM horses appeared to have more significantly upregulated genes related to the antiviral defense and type 1 interferon response than the non-EHM group, such as the pattern recognition receptor, TLR3, the interferon regulatory factors IRF7 and IRF9, and interferon stimulated genes, such as RSAD2. An early and rapid induction of interferons has been shown to be critical for protection from viral diseases and we have previously demonstrated significantly lower amounts of IFNα protein in the nasal secretions of horses that went on to develop EHM when compared to horses that did not develop EHM at 24 h after EHV-1 CH infection [14]. Confirming this observation, the EHM horses in this study also exhibited significantly lower IFNα secretion in the nasal secretion at 24 and 48 h post infection when compared to the non-EHM horses [54]. In viral infection, the timing of type 1 interferon pathway induction in relation to peak viral replication can dictate the severity of downstream immunopathology and disease, because delayed interferon responses to increased viral titers contribute to immunopathology, presumably through an exaggerated proinflammatory cytokine response and leukocytic activation [95,96,97]. The present study does not provide information on the timing of the interferon response or whether there is a delay in induction of interferon response in PBMCs resulting from the lower interferon levels in the nasal secretions and the reduced nasal shedding early on in EHM horses. There also is no information on how this contributes to the propensity for the development of high-er viremia and EHM. However, the higher viremia levels in EHM horses likely explain the increased defense response genes observed in this group and could contribute to the downstream immunopathology of the CNS vasculature. Future work should focus on the expression patterns of the interferon associated genes over time.
While IL-6 and associated inflammatory factors likely play a major role in the immunopathology of the CNS, our results suggest that the dysregulation of the development of an appropriate T-cell response also appears to be involved in the likelihood of developing EHM. In the current study, FOS, the gene encoding the c-fos protein and the direct product of the ERK cascade, was downregulated as well as the gene encoding the other AP-1 subunit, JUN. Many genes associated with or influenced by the MAPK/ERK cascades also appeared to be differentially regulated in EHM horses and in addition many of the differentially regulated miRNAs identified in EHM horses have predicted target genes associated with or influenced by the MAPK/ERK cascades. Previously, in vitro experiments have shown that EHV-1 infection of PBMCs stimulates the MAPK pathway in infected cells, and thus enhances cell adhesion and viral trans-fer with the vascular endothelial cells [98,99]. In our study, we focused on the entire PBMC population, not only infected cells. The differential expression of MAPK pathways in the PBMCs of EHM horses points to the importance of this pathway in the pathogenesis of EHM from an immunological perspective. Taken together with the literature on immunosenescence, our gene expression data support the idea that impairment of T-cell activation and cellular immunity plays an important role in EHM pathogenesis. Increased age has been identified as a risk factor for the development of EHM [13,29]. This was confirmed in our study where EHM developed in 7/7 aged horses and only 1/7 young horses. Immunosenescence is a well-known phenomenon affecting aged individuals, with T-cells being considered the most affected immune cell population [100,101]. One of the key features of immunosenescence is the resistance of T-cells to activate and proliferate upon antigenic stimulation [32]. Ligand/receptor binding (such as T-cell receptor stimulation by antigen) triggers a variety of signal transduction pathways, which ultimately result in transcription factor production. Interleukin-2 (IL-2) expression is the hallmark feature of T-cell activation and proliferation. The binding of several transcription factors to the IL-2 promotor, including the transcription factor AP-1 are required for full activation of IL-2 production [59]. The signal transduction pathway responsible for AP-1 production is the mitogen activated protein kinase (MAPK) cascade. This cascade involves the production of extracellular signal-related kinase (ERK), which then enters the nucleus to facilitate transcription of the FOS gene and phosphorylation of the c-fos protein. The c-fos and c-jun proteins form the subunits of AP-1, the transcription factor involved in IL-2 production [59]. Activity of AP-1 has been shown to be impaired in aged mice, and this is related to a decrease in FOS expression [102]. In humans, age-related impairments in AP-1 activity have also been shown to be associated with decreased IL-2 production in T-cells [103]. Aging is known to reduce MAPK activation and the ERK1/ERK2 cascade [103,104,105]. Further, impairment of the activation of the ERK pathway is known to be associated with decreased IL-2 production by T-cells in response to stimulation in aged humans [106]. Finally, age-related immunosenescence is also known to be associated with a decreased lymphoproliferative response in humans [107]. In horses, it has been shown that PBMCs from aged horses exhibit a reduced lymphoproliferative response in vitro when exposed to mitogens compared to younger horses [108,109,110]. In our study, there was a significant upregulation of CD4+ memory cell activation in non-EHM horses, which is a response we did not observe in EHM horses. Furthermore, we have previously shown that lymphopenia, as well as decreased T-cell responses are part of the immune response to EHV-1 infection, even in horses that do not develop EHM [34,111,112]. Consistent with this, our data indicate there is a downregulation of AP-1 production (through FOS/JUN downregulation) in horses that develop EHM when compared to non-EHM horses, most likely through dysregulation of MAPK/ERK cascades.
In persistent viral infections (as occur with many herpesviruses), reactivation is suppressed by constant immune surveillance. It has been suggested for human herpesviruses that this chronic antigenic stimulation contributes to immunosenescence, specifically in CD4+ and CD8+ memory T-cells [113]. This is thought to be because after a lifetime of replication, the memory cell population enters a late stage of effector differentiation and senescence [32,114]. It appears different herpesviruses may affect this in different ways. For example, varicella-zoster virus specific CD4+ T-cells are shown to decline with age, while human cytomegalovirus specific T-cell clones can grow to become a prominent proportion of the memory T-cells [32,115,116]. Nevertheless, frequent antigenic stimulation throughout the life of the horse likely influences the EHV-1-specific T-cell population in aged horses, though more work is needed to verify this.
In addition to the dysregulation of MAPK cascades, JUN/FOS expression, and the presumed decrease in T-cell activation, we also observed an apparent skew towards a T-helper type 2 (Th2) immune response in the EHM horses when compared to the non-EHM group. The T-helper type 1 (Th1) cytokine genes IFNG and TBX21 were downregulated in EHM horses. Though many phenotypes of CD4+ T-cells have been identified, the classic dichotomy dictates that CD4+ T-cells express a repertoire of cytokines that fit either a Th1 (proinflammatory) or Th2 (anti-inflammatory) upon activation. Th1 immunity contributes to the effective clearance of viral infections and encourages CTL responses, which are the only known correlate of protection from EHV-1 [13,117,118]. In further support of a transition to a Th2 immune response and its contribution to EHM, the horses that developed EHM in our study showed higher levels of IL-10 in nasal secretions and CSF and lower IFNα and IL-17 in nasal secretions when compared to non-EHM horses [54]. Furthermore, EHM horses induced a greater EHV-1 IgG(T) antibody subisotype response following EHV-1 CH compared to non-EHM horses [54]. This subisotype has been associated with a Th2 immune response in horses [119]. The observed skew from Th1 to Th2 immunity in horses that develop EHM indicates that proper Th1 mediated immune responses are important protective features against EHV-1 infection and EHM and a shift to Th2 responses may predispose horses to clinical EHM. Further supporting the skew toward a Th2 response in horses that are effected by EHM is previous data from our laboratory showing that young horses with clinical EHM also showed decreased IFNα but elevated IL-10 in nasal secretions [14].
We also saw some differential expression of chemokines in EHM horses compared to non-EHM horses. CXCL10 is best known for its T-cell chemotactic activity and its receptor can be found on Th1 cells, CD8+ cytotoxic lymphocytes, and NK cells [120]. We observed an upregulation of CXCL10 in EHM horses, but not in non-EHM horses. This is in contrast to our previous study where we found a statistically significant in-crease in CXCL10 expression in PBMCs following EHV-1 CH [91]. Additionally, infection of PBMCs in vitro has been shown to increase CXCL10 expression [121]. Thus, it was surprising to see that CXCL10 was only significantly upregulated in the EHM horses in this study. However, upon further examination, it was apparent that CXCL10 was upregulated in the non-EHM horses in this study as well, but this difference was not statistically significant (FDR = 0.16, log fold change = 1.5). Additionally, we saw that CCL5 was downregulated in EHM horses. Known as “regulated upon activation normal T-cell expressed and secreted” or “RANTES”, CCL5 acts as a chemotactic agent for monocytes, T-cells, NK cells, dendritic cells, eosinophils, and basophils [122]. Aging may have an impact on the sensitivity of PBMCs to secrete CCL5 following stimulation. In human PBMCs, T-cells from the elderly produced more CCL5, while NK cells produced less when compared to PBMCs from younger people [123]. While the role of the downregulation of CCL5 from PBMCs is unknown in EHM pathogenesis, it likely reflects differences in cell populations, activation status, and responsiveness between these two groups.
In addition to host transcripts, we were able to identify viral transcription in the PBMCs using RNA sequencing analysis. EHV-1 transcription was detected in all samples post EHV-1 CH, but no noticeable differences in gene expression between EHM and non-EHM horses were observed. We found very little EHV-1 transcription in PBMCs prior to EHV-1 CH, and only two pre-CH samples (0/6 non-EHM horses and 2/8 EHM horses) were positive for EHV-1 transcripts. This is in contrast to our previous study, where we found low-level transcription in five out of seven horses prior to EHV-1 CH, which likely indicated latent infection [91]. It is possible that the previously described horses were latently infected with EHV-1, while the majority of the horses in the present study were not. However, this is unlikely as most horses are exposed to EHV-1 at a young age, often before 1 year of age [124,125,126,127]. Another explanation could be differences in the sensitivities of the two analyses. However, while the RNA quality was slightly better in our previous study, the depth of sequencing and mapping quality was comparable between the two studies. Notably, the EHV-1 transcription profile analysis can only reflect the circulating latently infected PBMC pool at the moment of sampling. Latently infected PBMCs may recirculate between lymphatic tissue and the blood circulation, which could therefore explain the different findings prior to CH. Another explanation is that there is a difference in the “depth” of latency in PBMCs between the different herds in these experiments. Alpha herpesviruses may exhibit several gene expression profiles during latency and “deeper” latency is characterized by lower transcription and decreased likelihood of reactivation [128,129,130,131]. It is possible different factors between the herds contributed to modulation of EHV-1 depth of latency in the PBMCs. We additionally identified transcripts from the gamma herpesviruses EHV-2 and EHV-5 in several samples both pre and post EHV-1 CH with no apparent effect of EHV-1 CH, which is what we observed previously [91]. We did observe that EHV-2 transcripts were more prevalent in the non-EHM group—which may indicate that younger horses are more likely to have active transcription of EHV-2.
Small RNA sequencing and analysis identified several known and novel host and viral miRNAs expressed in the PBMC samples of these horses. Interestingly, and in agreement with our previous findings [91], no miRNAs mapped to the EHV-1 or EHV-4 genomes, even during peak EHV-1 viremia. In agreement with our previous study, several miRNAs were also identified for the equine gamma herpesviruses, EHV-2 and EHV-5. The gamma herpesviruses are known for their persistence in lymphocytes [132,133]. Given our findings, it is presumed that miRNA expression plays a role in the maintenance of latent lymphocytic infection of gamma herpesviruses. The lack of EHV-1 miRNAs indicate that EHV-1 likely does not make use of miRNA expression during lymphocytic infection during peak viremia. We also identified numerous equine (host) miRNAs expressed by the PBMCs; however, very few of these were differentially expressed as a result of EHV-1 CH. Of the few miRNAs altered during EHV-1 infection, the majority were downregulated in EHM horses during infection. The human and murine orthologs of these miRNAs have routinely been associated with cancer, presumably due to their role in regulation of the cell cycle [66,67,68,69,70,71,72,73,74]. Most notably, predicted target genes of the identified differentially regulated miRNAs in our study directly targeted a large number of genes that were also shown to be differentially regulated in EHM horses in response to infection. Not surprisingly many of the targeted genes were involved with the regulation of MAPK/ERK cascades, stimulation of interferons, hemostasis, cytoskeletal reorganization and cell migration and thus further support our RNA expression data.
For this study, we used the “old mare model” in order to reliably induce EHM in horses using EHV-1 CH infection. It has been well established that aged female horses are significantly more likely to develop EHM during acute EHV-1 infection, and we also observed this in our study where all aged (but only one young) horses developed EHM, all of which were female [13,19,29]. It is known that factors associated with age and sex play a role in the development of EHM [1,13]. It is also known that EHV-1 associated abortions are rare when infection occurs in early pregnancy, but more frequent when it occurs in late pregnancy. It is presumed that changes to the hormonal microenvironment of the pregnant uterus predisposes this site to vasculitis and thrombosis at different stages of pregnancy [134]. In our study, we observed genes associated with the response to progesterone upregulated in EHM horses following EHV-1 CH. It was not within the scope of this study to tease out specific differences between ages and sexes of horses, but rather to reliably induce EHM. More work is needed to study factors in young and male horses that develop EHM. Additionally, focusing on more timepoints looking at early immune events in the PBMCs and the respiratory tract on day 1 or 2 following infection could help to further elucidate host factors important for protection from EHM.
In summary, the features we found to be associated with EHM such as elevated IL-6 expression and decreased T-cell activation through reduced AP-1 production can be explained with the phenomena associated with the aging immune system. Regardless, these mechanisms are also likely involved in EHM development in younger horses and were observed in the young horse exhibiting EHM in our study as well. Further host mechanisms identified to be associated with EHM included factors involved in coagulation, cell adhesion, and the response to progesterone. Future studies should follow up on these factors identified as risk factors (or protective factors) for EHM in cohorts of horses of all age groups and of both sexes as well as in different breeds. In conclusion, this study provides an unbiased insight into differences in systemic responses during peak viremia of horses with and without EHM during EHV-1 infection and identifies inhibition of IL-6, regulation of hemostasis, mechanisms to activate T-cells, and shifting immune responses toward Th1 cell-mediated immunity as interesting targets for protection from EHM.

Supplementary Materials

Supplementary materials can be found at https://www.mdpi.com/1999-4915/13/3/356/s1. Table S1: Mapping summary statistics of mRNA sequencing; Table S2: Enriched GO terms for the contrast comparison between EHM and non-EHM horses; Table S3: Differentially expressed genes unique to non-EHM horses; Table S4: Mapping summary statistics of miRNA sequencing; File S1: Differentially expressed host genes; File S2: Go terms associated with EHM; File S3: Viral genes File S4: Equine and viral miRNA.

Author Contributions

Conceptualization, G.S.H., L.M.Z., P.S.D.W.; experiment and sample collection, all authors; computational data analysis, L.M.Z.; writing—original draft preparation, L.M.Z. and G.S.H.; writing—review and editing, all authors.; funding acquisition, G.S.H. and P.S.D.W. All authors have read and agreed to the published version of the manuscript.

Funding

This research was funded by the Grayson Jockey Club Research Foundation.

Institutional Review Board Statement

The study was conducted according to the guidelines of the Declaration of Helsinki, and approved by Michigan State University’s Institutional Review Board under protocol “PROTO201800015”.

Informed Consent Statement

Not applicable.

Data Availability Statement

The raw data presented in this study are openly available and have been in deposited under SRA BioProject number PRJNA705083.

Acknowledgments

The authors would like to thank the following colleagues and facilities for their help with this study. Amanda Wiel assisted with the experiment. Tristan Foster and the Veterinary Research Farm at Michigan State University managed the animal facilities. Emily Crisovan and the Genomics Research and Technology Support Facility at Michigan State University assist-ed with technical advice and performed the library preparation and next generation sequencing. The Institute for Cyber-Enabled Research at Michigan State University provided the computational resources.

Conflicts of Interest

The authors declare no conflict of interest. The funders had no role in the design of the study; in the collec-tion, analyses, or interpretation of data; in the writing of the manuscript, or in the decision to publish the results.

References

  1. Lunn, D.P.; Davis-Poynter, N.; Flaminio, M.J.B.F.; Horohov, D.W.; Osterrieder, K.; Pusterla, N.; Townsend, H.G.G. Equine herpesvirus-1 consensus statement. J. Vet. Intern. Med. 2009, 23, 450–461. [Google Scholar] [CrossRef] [PubMed]
  2. USDA; APHIS. Equine Herpesvirus (EHV-1)—FINAL Situation Report. Available online: https://www.aphis.usda.gov/vs/nahss/equine/ehv/ehv_2011_final_sitrep_062311.pdf (accessed on 24 October 2018).
  3. USDA; APHIS; VS; CEAH. Equine Herpesvirus Myeloencephalopathy: A Potentially Emerging Disease. Available online: https://www.aphis.usda.gov/animal_health/emergingissues/downloads/ehv1final.pdf (accessed on 24 October 2018).
  4. USAHA. Equine Herpesvirus Myeloencephalopathy Incident Guidelines for State Animal Health Officials. Available online: http://www.usaha.org/upload/Publication/TopSpecific/EHM_Guidance_Document_Revised_Fe.pdf (accessed on 24 October 2018).
  5. Pusterla, N.; Mapes, S.; Wilson, W.D. Prevalence of equine herpesvirus type 1 in trigeminal ganglia and submandibular lymph nodes of equids examined postmortem. Vet. Rec. 2010, 167, 376–378. [Google Scholar] [CrossRef]
  6. Allen, G.P. Antemortem detection of latent infection with neuropathogenic strains of equine herpesvirus-1 in horses. Am. J. Vet. Res. 2006, 67, 1401–1405. [Google Scholar] [CrossRef] [PubMed]
  7. Allen, G.P.; Bolin, D.C.; Bryant, U.; Carter, C.N.; Giles, R.C.; Harrison, L.R.; Hong, C.B.; Jackson, C.B.; Poonacha, K.; Wharton, R.; et al. Prevalence of latent, neuropathogenic equine herpesvirus-1 in the Thoroughbred broodmare population of central Kentucky. Equine Vet. J. 2008, 40, 105–110. [Google Scholar] [CrossRef]
  8. Slater, J.D.; Borchers, K.; Thackray, A.M.; Field, H.J. The trigeminal ganglion is a location for equine herpesvirus 1 latency and reactivation in the horse. J. Gen. Virol. 1994, 75, 2007–2016. [Google Scholar] [CrossRef]
  9. Kydd, J.H.; Townsend, H.G.G.; Hannant, D. The equine immune response to equine herpesvirus-1: The virus and its vaccines. Vet. Immunol. Immunopathol. 2006, 111, 15–30. [Google Scholar] [CrossRef]
  10. Hussey, S.B.; Clark, R.; Lunn, K.F.; Breathnach, C.; Soboll, G.; Whalley, J.M.; Lunn, D.P. Detection and quantification of equine herpesvirus-1 viremia and nasal shedding by real-time polymerase chain reaction. J. Vet. Diagn. Investig. 2006, 18, 335–342. [Google Scholar] [CrossRef] [Green Version]
  11. Patel, J.R.; Edington, N.; Mumford, J.A. Variation in cellular tropism between isolates of Equine herpesvirus-1 in foals. Arch. Virol. 1982, 74, 41–51. [Google Scholar] [CrossRef] [PubMed]
  12. Osterrieder, N.; Van de Walle, G.R. Pathogenic potential of equine alphaherpesviruses: The importance of the mononuclear cell compartment in disease outcome. Vet. Microbiol. 2010, 143, 21–28. [Google Scholar] [CrossRef] [PubMed]
  13. Allen, G.P. Risk factors for development of neurologic disease after experimental exposure to equine herpesvirus-1 in horses. Am. J. Vet. Res. 2008, 69, 1595–1600. [Google Scholar] [CrossRef] [PubMed]
  14. Holz, C.L.; Nelli, R.K.; Eilidh Wilson, M.; Zarski, L.M.; Azab, W.; Baumgardner, R.; Osterrieder, N.; Pease, A.; Zhang, L.; Hession, S.; et al. Viral genes and cellular markers associated with neurological complications during herpesvirus infections. J. Gen. Virol. 2017, 98. [Google Scholar] [CrossRef]
  15. Goodman, L.B.; Loregian, A.; Perkins, G.A.; Nugent, J.; Buckles, E.L.; Mercorelli, B.; Kydd, J.H.; Palù, G.; Smith, K.C.; Osterrieder, N.; et al. A point mutation in a herpesvirus polymerase determines neuropathogenicity. PLoS Pathog. 2007, 3, e160. [Google Scholar] [CrossRef]
  16. Van de Walle, G.R.; Goupil, R.; Wishon, C.; Damiani, A.; Perkins, G.A.; Osterrieder, N. A Single-Nucleotide Polymorphism in a Herpesvirus DNA Polymerase is Sufficient to Cause Lethal Neurological Disease. J. Infect. Dis. 2009, 200, 20–25. [Google Scholar] [CrossRef] [Green Version]
  17. Nugent, J.; Birch-Machin, I.; Smith, K.C.; Mumford, J.A.; Swann, Z.; Newton, J.R.; Bowden, R.J.; Allen, G.P.; Davis-Poynter, N. Analysis of equid herpesvirus 1 strain variation reveals a point mutation of the DNA polymerase strongly associated with neuropathogenic versus nonneuropathogenic disease outbreaks. J. Virol. 2006, 80, 4047–4060. [Google Scholar] [CrossRef] [Green Version]
  18. Allen, G.P.; Breathnach, C.C. Quantification by real-time PCR of the magnitude and duration of leucocyte-associated viraemia in horses infected with neuropathogenic vs. non-neuropathogenic strains of EHV-1. Equine Vet. J. 2006, 38, 252–257. [Google Scholar] [CrossRef]
  19. Pusterla, N.; Hussey, G.S. Equine Herpesvirus 1 Myeloencephalopathy. Vet. Clin. N. Am. Equine Pract. 2014, 30, 489–506. [Google Scholar] [CrossRef] [PubMed]
  20. Hawkins, B.T.; Davis, T.P. The blood-brain barrier/neurovascular unit in health and disease. Pharmacol. Rev. 2005, 57, 173–185. [Google Scholar] [CrossRef] [PubMed]
  21. Bazzoni, G.; Dejana, E. Endothelial Cell-to-Cell Junctions: Molecular Organization and Role in Vascular Homeostasis. Physiol. Rev. 2004, 84, 869–901. [Google Scholar] [CrossRef] [PubMed] [Green Version]
  22. Abbruscato, T.J.; Davis, T.P. Combination of Hypoxia/Aglycemia Compromises In Vitro Blood-Brain Barrier Integrity. J. Pharmacol. Exp. Ther. 1999, 289, 668–675. [Google Scholar]
  23. Fischer, S.; Clauss, M.; Wiesnet, M.; Renz, D.; Schaper, W.; Karliczek, G.F. Hypoxia induces permeability in brain microvessel endothelial cells via VEGF and NO. Am. J. Physiol. Physiol. 1999, 276, C812–C820. [Google Scholar] [CrossRef]
  24. Mark, K.S.; Davis, T.P. Cerebral microvascular changes in permeability and tight junctions induced by hypoxia-reoxygenation. Am. J. Physiol. Circ. Physiol. 2002, 282, H1485–H1494. [Google Scholar] [CrossRef] [PubMed] [Green Version]
  25. Yeo, W.M.; Osterrieder, N.; Stokol, T. Equine herpesvirus type 1 infection induces procoagulant activity in equine monocytes. Vet. Res. 2013, 44, 16. [Google Scholar] [CrossRef] [PubMed] [Green Version]
  26. Stokol, T.; Yeo, W.M.; Burnett, D.; DeAngelis, N.; Huang, T.; Osterrieder, N.; Catalfamo, J. Equid Herpesvirus Type 1 Activates Platelets. PLoS ONE 2015, 10, e0122640. [Google Scholar] [CrossRef] [PubMed]
  27. Goehring, L.S.; Hussey, G.S.; Diez, M.G.; Benedict, K.; Maxwell, L.K.; Morley, P.S.; van Oldruitenborgh-Oosterbaan, M.M.S.; Lunn, D.P. Plasma D-Dimer Concentrations during Experimental EHV-1 Infection of Horses. J. Vet. Intern. Med. 2013, 27, 1535–1542. [Google Scholar] [CrossRef] [PubMed] [Green Version]
  28. Wilson, M.E.; Holz, C.L.; Kopec, A.K.; Dau, J.J.; Luyendyk, J.P.; Soboll Hussey, G. Coagulation parameters following equine herpesvirus type 1 infection in horses. Equine Vet. J. 2019, 51, 102–107. [Google Scholar] [CrossRef] [PubMed]
  29. Henninger, R.W.; Reed, S.M.; Saville, W.J.; Allen, G.P.; Hass, G.F.; Kohn, C.W.; Sofaly, C. Outbreak of Neurologic Disease Caused by Equine Herpesvirus-1 at a University Equestrian Center. J. Vet. Intern. Med. 2008, 21, 157–165. [Google Scholar] [CrossRef]
  30. Slater, J. Equine Herpesviruses, 2nd ed.; Sellon, D.C., Long, M.T., Saunders, W.B., Eds.; Elsevier: St. Louis, MO, USA, 2014; Chapter 14; pp. 151–168. ISBN 978-1-4557-0891-8. [Google Scholar]
  31. Maxwell, L.K.; Bentz, B.G.; Gilliam, L.L.; Ritchey, J.W.; Pusterla, N.; Eberle, R.; Holbrook, T.C.; McFarlane, D.; Rezabek, G.B.; Meinkoth, J.; et al. Efficacy of the early administration of valacyclovir hydrochloride for the treatment of neuropathogenic equine herpesvirus type-1 infection in horses. Am. J. Vet. Res. 2017, 78, 1126–1139. [Google Scholar] [CrossRef]
  32. Aiello, A.; Farzaneh, F.; Candore, G.; Caruso, C.; Davinelli, S.; Gambino, C.M.; Ligotti, M.E.; Zareian, N.; Accardi, G. Immunosenescence and its Hallmarks: How to Oppose Aging Strategically? A Review of Potential Options for Therapeutic Intervention. Front. Immunol. 2019, 10, 2247. [Google Scholar] [CrossRef] [Green Version]
  33. Hansen, S.; Baptiste, K.E.; Fjeldborg, J.; Horohov, D.W. A review of the equine age-related changes in the immune system: Comparisons between human and equine aging, with focus on lung-specific immune-aging. Ageing Res. Rev. 2015, 20, 11–23. [Google Scholar] [CrossRef]
  34. Hussey, G.S.; Hussey, S.B.; Wagner, B.; Horohov, D.W.; Van de Walle, G.R.; Osterrieder, N.; Goehring, L.S.; Rao, S.; Lunn, D.P. Evaluation of immune responses following infection of ponies with an EHV-1 ORF1/2 deletion mutant. Vet. Res. 2011, 42. [Google Scholar] [CrossRef] [Green Version]
  35. Andrews, S. FastQC: A Quality Control Tool for High Throughput Sequence Data. Available online: http://www.bioinformatics.babraham.ac.uk/projects/fastqc/ (accessed on 10 June 2020).
  36. Bolger, A.M.; Lohse, M.; Usadel, B. Trimmomatic: A flexible trimmer for Illumina sequence data. Bioinformatics 2014, 30, 2114–2120. [Google Scholar] [CrossRef] [PubMed] [Green Version]
  37. Pertea, M.; Kim, D.; Pertea, G.M.; Leek, J.T.; Salzberg, S.L. Transcript-level expression analysis of RNA-seq experiments with HISAT, StringTie and Ballgown. Nat. Protoc. 2016, 11, 1650. [Google Scholar] [CrossRef]
  38. Li, H.; Handsaker, B.; Wysoker, A.; Fennell, T.; Ruan, J.; Homer, N.; Marth, G.; Abecasis, G.; Durbin, R.; Subgroup. 1000 Genome Project Data Processing S: The Sequence Alignment/Map format and SAMtools. Bioinformatics 2009, 25, 2078–2079. [Google Scholar] [CrossRef] [Green Version]
  39. Anders, S.; Pyl, P.T.; Huber, W. HTSeq—A Python framework to work with high-throughput sequencing data. Bioinformatics 2014, 31, 166–169. [Google Scholar] [CrossRef]
  40. Martin, M. Cutadapt removes adapter sequences from high-throughput sequencing reads. EMBnet J. Next Gener. Seq. Data Anal. 2011, 17. [Google Scholar] [CrossRef]
  41. Friedländer, M.R.; Mackowiak, S.D.; Li, N.; Chen, W.; Rajewsky, N. miRDeep2 accurately identifies known and hundreds of novel microRNA genes in seven animal clades. Nucleic Acids Res. 2011, 40, 37–52. [Google Scholar] [CrossRef] [PubMed]
  42. Langmead, B.; Trapnell, C.; Pop, M.; Salzberg, S.L. Ultrafast and memory-efficient alignment of short DNA sequences to the human genome. Genome Biol. 2009, 10, R25. [Google Scholar] [CrossRef] [PubMed] [Green Version]
  43. Griffiths-Jones, S.; Saini, H.K.; van Dongen, S.; Enright, A.J. miRBase: Tools for microRNA genomics. Nucleic Acids Res. 2007, 36, D154–D158. [Google Scholar] [CrossRef] [PubMed] [Green Version]
  44. Chen, Y.; Wang, X. miRDB: An online database for prediction of functional microRNA targets. Nucleic Acids Res. 2020, 48, D127–D131. [Google Scholar] [CrossRef] [Green Version]
  45. Robinson, M.D.; McCarthy, D.J.; Smyth, G.K. edgeR: A Bioconductor package for differential expression analysis of digital gene expression data. Bioinformatics 2009, 26, 139–140. [Google Scholar] [CrossRef] [Green Version]
  46. Chen, Y.; McCarthy, D.; Ritchie, M.; Robinson, M.; Smyth, G. edgeR: Differential Analysis of Sequence Read Count Data, User’s Guide. Available online: https://www.bioconductor.org/packages/release/bioc/vignettes/edgeR/inst/doc/edgeRUsersGuide.pdf (accessed on 10 June 2020).
  47. Thomas, P.D.; Campbell, M.J.; Kejariwal, A.; Mi, H.; Karlak, B.; Daverman, R.; Diemer, K.; Muruganujan, A.; Narechania, A. PANTHER: A library of protein families and subfamilies indexed by function. Genome Res. 2003, 13, 2129–2141. [Google Scholar] [CrossRef] [Green Version]
  48. The UniProt Consortium. UniProt: A worldwide hub of protein knowledge. Nucleic Acids Res. 2018, 47, D506–D515. [Google Scholar] [CrossRef] [Green Version]
  49. Yu, G.; Wang, L.-G.; Han, Y.; He, Q.-Y. clusterProfiler: An R Package for Comparing Biological Themes Among Gene Clusters. OMICS J. Integr. Biol. 2012, 16, 284–287. [Google Scholar] [CrossRef] [PubMed]
  50. Carlson, M. org.Hs.eg.db: Genome Wide Annotation for Human; R Foundation: London, UK, 2019. [Google Scholar]
  51. Supek, F.; Bošnjak, M.; Škunca, N.; Šmuc, T. REVIGO Summarizes and Visualizes Long Lists of Gene Ontology Terms. PLoS ONE 2011, 6, e21800. [Google Scholar] [CrossRef] [PubMed] [Green Version]
  52. Newman, A.M.; Steen, C.B.; Liu, C.L.; Gentles, A.J.; Chaudhuri, A.A.; Scherer, F.; Khodadoust, M.S.; Esfahani, M.S.; Luca, B.A.; Steiner, D.; et al. Determining cell type abundance and expression from bulk tissues with digital cytometry. Nat. Biotechnol. 2019, 37, 773–782. [Google Scholar] [CrossRef] [PubMed]
  53. Livak, K.J.; Schmittgen, T.D. Analysis of Relative Gene Expression Data Using Real-Time Quantitative PCR and the 2−ΔΔCT Method. Methods 2001, 25, 402–408. [Google Scholar] [CrossRef] [PubMed]
  54. Giessler, K.S.; Goehring, L.S.; Jacobs, S.; McCauley, A.; Esser, M.M.; Lee, Y.; Zarski, L.M.; Soboll Hussey, G. Use of the old horse model to identify host factors contributing to EHM pathogenesis. In Proceedings of the Conference of Research Workers in Animal Disease Conference Proceedings, Chicago, IL, USA, 4–8 December 2020; p. 367. [Google Scholar]
  55. Goehring, L.S.; van Maanen, C.; Berendsen, M.; Cullinane, A.; de Groot, R.J.; Rottier, P.J.M.; Wesselingh, J.J.C.M.; Sloet van Oldruitenborgh-Oosterbaan, M.M. Experimental infection with neuropathogenic equid herpesvirus type 1 (EHV-1) in adult horses. Vet. J. 2010, 186, 180–187. [Google Scholar] [CrossRef]
  56. Shaafi, S.; Sharifipour, E.; Rahmanifar, R.; Hejazi, S.; Andalib, S.; Nikanfar, M.; Baradarn, B.; Mehdizadeh, R. Interleukin-6, a reliable prognostic factor for ischemic stroke. Iran. J. Neurol. 2014, 13, 70–76. [Google Scholar]
  57. Tanaka, T.; Narazaki, M.; Kishimoto, T. Immunotherapeutic implications of IL-6 blockade for cytokine storm. Immunotherapy 2016, 8, 959–970. [Google Scholar] [CrossRef]
  58. Angel, P.; Karin, M. The role of Jun, Fos and the AP-1 complex in cell-proliferation and transformation. Biochim. Biophys. Acta Rev. Cancer 1991, 1072, 129–157. [Google Scholar] [CrossRef]
  59. Owen, J.A.; Punt, J.; Stranford, S.A.; Jones, P.P.; Kuby, J. Receptors and signaling: B and T-cell receptors. In Kuby Immunology; W.H. Freeman and Company: New York, NY, USA, 2013; Chapter 3; pp. 65–104. [Google Scholar]
  60. Shakya, A.K.; O’Callaghan, D.J.; Kim, S.K. Comparative Genomic Sequencing and Pathogenic Properties of Equine Herpesvirus 1 KyA and RacL11. Front. Vet. Sci. 2017, 4, 211. [Google Scholar] [CrossRef] [Green Version]
  61. Matsumura, T.; Kondo, T.; Sugita, S.; Damiani, A.M.; O’Callaghan, D.J.; Imagawa, H. An Equine Herpesvirus Type 1 Recombinant with a Deletion in the gE and gI Genes Is Avirulent in Young Horses. Virology 1998, 242, 68–79. [Google Scholar] [CrossRef] [Green Version]
  62. Badr, Y.; Okada, A.; Abo-Sakaya, R.; Beshir, E.; Ohya, K.; Fukushi, H. Equine herpesvirus type 1 ORF51 encoding UL11 as an essential gene for replication in cultured cells. Arch. Virol. 2018, 163, 599–607. [Google Scholar] [CrossRef] [PubMed]
  63. Schimmer, C.; Neubauer, A. The equine herpesvirus 1 UL11 gene product localizes to the trans-golgi network and is involved in cell-to-cell spread. Virology 2003, 308, 23–36. [Google Scholar] [CrossRef] [Green Version]
  64. Meng, P.; Tang, X.; Jiang, X.; Tang, Q.; Bai, L.; Xia, Y.; Zou, Z.; Qin, X.; Cao, X.; Chen, C.; et al. Maternal exposure to traffic pollutant causes impairment of spermatogenesis and alterations of genome-wide mRNA and microRNA expression in F2 male mice. Environ. Toxicol. Pharmacol. 2018, 64, 1–10. [Google Scholar] [CrossRef] [PubMed]
  65. Gui, Y.; Xu, Z.; Jin, T.; Zhang, L.; Chen, L.; Hong, B.; Xie, F.; Lv, W.; Hu, X. Using Extracellular Circulating microRNAs to Classify the Etiological Subtypes of Ischemic Stroke. Transl. Stroke Res. 2019, 10, 352–361. [Google Scholar] [CrossRef]
  66. Pak, J.H.; Kim, I.K.; Kim, S.M.; Maeng, S.; Song, K.J.; Na, B.-K.; Kim, T.-S. Induction of cancer-related microRNA expression profiling using excretory-secretory products of Clonorchis sinensis. Parasitol. Res. 2014, 113, 4447–4455. [Google Scholar] [CrossRef]
  67. Soliman, B.; Salem, A.; Ghazy, M.; Abu-Shahba, N.; El Hefnawi, M. Bioinformatics functional analysis of let-7a, miR-34a, and miR-199a/b reveals novel insights into immune system pathways and cancer hallmarks for hepatocellular carcinoma. Tumour Biol. J. Int. Soc. Oncodevelopmental Biol. Med. 2018, 40. [Google Scholar] [CrossRef] [Green Version]
  68. Hermeking, H. The miR-34 family in cancer and apoptosis. Cell Death Differ. 2010, 17, 193–199. [Google Scholar] [CrossRef]
  69. Wang, Y.; Huang, J.-W.; Castella, M.; Huntsman, D.G.; Taniguchi, T. p53 is Positively Regulated by miR-542-3p. Cancer Res. 2014, 74, 3218–3227. [Google Scholar] [CrossRef] [Green Version]
  70. Bray, I.; Tivnan, A.; Bryan, K.; Foley, N.H.; Watters, K.M.; Tracey, L.; Davidoff, A.M.; Stallings, R.L. MicroRNA-542-5p as a novel tumor suppressor in neuroblastoma. Cancer Lett. 2011, 303, 56–64. [Google Scholar] [CrossRef] [Green Version]
  71. Zhi, Y.; Xie, X.; Wang, R.; Wang, B.; Gu, W.; Ling, Y.; Dong, W.; Zhi, F.; Liu, Y. Serum level of miR-10-5p as a prognostic biomarker for acute myeloid leukemia. Int. J. Hematol. 2015, 102, 296–303. [Google Scholar] [CrossRef] [PubMed]
  72. Ulivi, P.; Foschi, G.; Mengozzi, M.; Scarpi, E.; Silvestrini, R.; Amadori, D.; Zoli, W. Peripheral blood miR-328 expression as a potential biomarker for the early diagnosis of NSCLC. Int. J. Mol. Sci. 2013, 14, 10332–10342. [Google Scholar] [CrossRef] [PubMed] [Green Version]
  73. Xu, X.T.; Xu, Q.; Tong, J.L.; Zhu, M.M.; Nie, F.; Chen, X.; Xiao, S.D.; Ran, Z.H. MicroRNA expression profiling identifies miR-328 regulates cancer stem cell-like SP cells in colorectal cancer. Br. J. Cancer 2012, 106, 1320–1330. [Google Scholar] [CrossRef] [PubMed] [Green Version]
  74. Sha, H.-H.; Wang, D.-D.; Chen, D.; Liu, S.-W.; Wang, Z.; Yan, D.-L.; Dong, S.-C.; Feng, J.-F. MiR-138: A promising therapeutic target for cancer. Tumour Biol. J. Int. Soc. Oncodevelopmental Biol. Med. 2017, 39. [Google Scholar] [CrossRef] [Green Version]
  75. Twenter, H.; Klohonatz, K.; Davis, K.; Bass, L.; Coleman, S.J.; Bouma, G.J.; Bruemmer, J.E. Transfer of MicroRNAs From Epididymal Epithelium to Equine Spermatozoa. J. Equine Vet. Sci. 2020, 87, 102841. [Google Scholar] [CrossRef]
  76. Bogedale, K.; Jagannathan, V.; Gerber, V.; Unger, L. Differentially expressed microRNAs, including a large microRNA cluster on chromosome 24, are associated with equine sarcoid and squamous cell carcinoma. Vet. Comp. Oncol. 2019, 17, 155–164. [Google Scholar] [CrossRef]
  77. Roos, J.; Enlund, E.; Funcke, J.-B.; Tews, D.; Holzmann, K.; Debatin, K.-M.; Wabitsch, M.; Fischer-Posovszky, P. miR-146a-mediated suppression of the inflammatory response in human adipocytes. Sci. Rep. 2016, 6, 38339. [Google Scholar] [CrossRef] [PubMed] [Green Version]
  78. Pacholewska, A.; Mach, N.; Mata, X.; Vaiman, A.; Schibler, L.; Barrey, E.; Gerber, V. Novel equine tissue miRNAs and breed-related miRNA expressed in serum. BMC Genom. 2016, 17, 831. [Google Scholar] [CrossRef] [Green Version]
  79. Fard, D.; Tamagnone, L. Semaphorins in health and disease. Cytokine Growth Factor Rev. 2020. [Google Scholar] [CrossRef]
  80. El-Mayet, F.S.; Sawant, L.; Thunuguntla, P.; Zhao, J.; Jones, C. Two Pioneer Transcription Factors, Krüppel-Like Transcription Factor 4 and Glucocorticoid Receptor, Cooperatively Transactivate the Bovine Herpesvirus 1 ICP0 Early Promoter and Stimulate Productive Infection. J. Virol. 2020, 94. [Google Scholar] [CrossRef]
  81. Stanisic, D.I.; Cutts, J.; Eriksson, E.; Fowkes, F.J.I.; Rosanas-Urgell, A.; Siba, P.; Laman, M.; Davis, T.M.E.; Manning, L.; Mueller, I.; et al. γδ T cells and CD14+ monocytes are predominant cellular sources of cytokines and chemokines associated with severe malaria. J. Infect. Dis. 2014, 210, 295–305. [Google Scholar] [CrossRef] [Green Version]
  82. Smith, C.J.; Emsley, H.C.A.; Gavin, C.M.; Georgiou, R.F.; Vail, A.; Barberan, E.M.; del Zoppo, G.J.; Hallenbeck, J.M.; Rothwell, N.J.; Hopkins, S.J.; et al. Peak plasma interleukin-6 and other peripheral markers of inflammation in the first week of ischaemic stroke correlate with brain infarct volume, stroke severity and long-term outcome. BMC Neurol. 2004, 4, 2. [Google Scholar] [CrossRef] [PubMed]
  83. Nakase, T.; Yamazaki, T.; Ogura, N.; Suzuki, A.; Nagata, K. The impact of inflammation on the pathogenesis and prognosis of ischemic stroke. J. Neurol. Sci. 2008, 271, 104–109. [Google Scholar] [CrossRef] [PubMed]
  84. Fassbender, K.; Rossol, S.; Kammer, T.; Daffertshofer, M.; Wirth, S.; Dollman, M.; Hennerici, M. Proinflammatory cytokines in serum of patients with acute cerebral ischemia: Kinetics of secretion and relation to the extent of brain damage and outcome of disease. J. Neurol. Sci. 1994, 122, 135–139. [Google Scholar] [CrossRef]
  85. Vila, N.; Castillo, J.; Dávalos, A.; Chamorro, Á. Proinflammatory cytokines and early neurological worsening in ischemic stroke. Stroke 2000, 31, 2325–2329. [Google Scholar] [CrossRef] [Green Version]
  86. Watson, C.; Whittaker, S.; Smith, N.; Vora, A.J.; Dumonde, D.C.; Brown, K.A. IL-6 acts on endothelial cells to preferentially increase their adherence for lymphocytes. Clin. Exp. Immunol. 1996, 105, 112–119. [Google Scholar] [CrossRef] [PubMed]
  87. Tang, Y.H.; Vital, S.; Russell, J.; Seifert, H.; Granger, D.N. Interleukin-6 mediates enhanced thrombus development in cerebral arterioles following a brief period of focal brain ischemia. Exp. Neurol. 2015, 271, 351–357. [Google Scholar] [CrossRef] [Green Version]
  88. Basinska, K.; Marycz, K.; Śmieszek, A.; Nicpoń, J. The production and distribution of IL-6 and TNF-α in subcutaneous adipose tissue and their correlation with serum concentrations in Welsh ponies with equine metabolic syndrome. J. Vet. Sci. 2015, 16, 113–120. [Google Scholar] [CrossRef] [Green Version]
  89. Coppelman, E.B. The Use of Biomarkers to Determine the Severity of Osteoarthritis in the Tarsus of an Older Horse Population. Ph.D. Thesis, University of Minnesota, Minneapolis, MN, USA, December 2017. [Google Scholar]
  90. Adams, R.L.C.; Bird, R.J. Review article: Coagulation cascade and therapeutics update: Relevance to nephrology, Part 1: Overview of coagulation, thrombophilias and history of anticoagulants. Nephrology (Carlton) 2009, 14, 462–470. [Google Scholar] [CrossRef]
  91. Zarski, L.M.; Weber, P.S.D.; Lee, Y.; Hussey, G.S. Transcriptomic Profiling of Equine and Viral Genes in Peripheral Blood Mononuclear Cells in Horses during Equine Herpesvirus 1 Infection. Pathogens 2021, 10, 43. [Google Scholar] [CrossRef]
  92. Cevik, O.; Baykal, A.T.; Sener, A. Platelets Proteomic Profiles of Acute Ischemic Stroke Patients. PLoS ONE 2016, 11, e0158287. [Google Scholar] [CrossRef] [Green Version]
  93. Khaiboullina, S.F.; Morzunov, S.P.; Jeor, S.C.S.; Rizvanov, A.A.; Lombardi, V.C. Hantavirus Infection Suppresses Thrombospondin-1 Expression in Cultured Endothelial Cells in a Strain-Specific Manner. Front. Microbiol. 2016, 7, 1077. [Google Scholar] [CrossRef] [PubMed] [Green Version]
  94. Mar, C.; Tomás, S.; Mónica, M.; María, G.; Juan, A.; Florentino, N.; David, B.; de la Ossa, N.P.; Joaquín, S.; José, V.; et al. Serum Cellular Fibronectin and Matrix Metalloproteinase-9 as Screening Biomarkers for the Prediction of Parenchymal Hematoma After Thrombolytic Therapy in Acute Ischemic Stroke. Stroke 2007, 38, 1855–1859. [Google Scholar] [CrossRef] [Green Version]
  95. Channappanavar, R.; Fehr, A.R.; Zheng, J.; Wohlford-Lenane, C.; Abrahante, J.E.; Mack, M.; Sompallae, R.; McCray, P.B., Jr.; Meyerholz, D.K.; Perlman, S. IFN-I response timing relative to virus replication determines MERS coronavirus infection outcomes. J. Clin. Investig. 2019, 129, 3625–3639. [Google Scholar] [CrossRef]
  96. Channappanavar, R.; Fehr, A.R.; Vijay, R.; Mack, M.; Zhao, J.; Meyerholz, D.K.; Perlman, S. Dysregulated Type I Interferon and Inflammatory Monocyte-Macrophage Responses Cause Lethal Pneumonia in SARS-CoV-Infected Mice. Cell Host Microbe 2016, 19, 181–193. [Google Scholar] [CrossRef] [Green Version]
  97. Acharya, D.; Liu, G.; Gack, M.U. Dysregulation of type I interferon responses in COVID-19. Nat. Rev. Immunol. 2020, 20, 397–398. [Google Scholar] [CrossRef] [PubMed]
  98. Pavulraj, S.; Kamel, M.; Stephanowitz, H.; Liu, F.; Plendl, J.; Osterrieder, N.; Azab, W. Equine Herpesvirus Type 1 Modulates Cytokine and Chemokine Profiles of Mononuclear Cells for Efficient Dissemination to Target Organs. Viruses 2020, 12, 999. [Google Scholar] [CrossRef]
  99. Laval, K.; Favoreel, H.W.; Poelaert, K.C.K.; Van Cleemput, J.; Nauwynck, H.J. Equine herpesvirus type 1 enhances viral replication in CD172a+ monocytic cells upon adhesion to endothelial cells. J. Virol. 2015, 89, 10912–10923. [Google Scholar] [CrossRef] [PubMed] [Green Version]
  100. Linton, P.J.; Dorshkind, K. Age-related changes in lymphocyte development and function. Nat. Immunol. 2004, 5, 133–139. [Google Scholar] [CrossRef]
  101. Walford, R.L. The Immunologic Theory of Aging. Immunol. Rev. 1969, 2, 171. [Google Scholar] [CrossRef]
  102. Sikora, E.; Kamińska, B.; Radziszewska, E.; Kaczmarek, L. Loss of transcription factor AP-1 DNA binding activity during lymphocyte aging in vivo. FEBS Lett. 1992, 312, 179–182. [Google Scholar] [CrossRef] [Green Version]
  103. Whisler, R.L.; Newhouse, Y.G.; Bagenstose, S.E. Age-related reductions in the activation of mitogen-activated protein kinases p44mapk/ERK1 and p42mapk/ERK2 in human T cells stimulated via ligation of the T cell receptor complex. Cell. Immunol. 1996, 168, 201–210. [Google Scholar] [CrossRef] [PubMed]
  104. Hutter, D.; Yo, Y.; Chen, W.; Liu, P.; Holbrook, N.J.; Roth, G.S.; Liu, Y. Age-related decline in Ras/ERK mitogen-activated protein kinase cascade is linked to a reduced association between Shc and EGF receptor. J. Gerontol. A Biol. Sci. Med. Sci. 2000, 55, B125–B134. [Google Scholar] [CrossRef] [Green Version]
  105. Gorgas, G.; Butch, E.R.; Guan, K.-L.; Miller, R.A. Diminished activation of the MAP kinase pathway in CD3-stimulated T lymphocytes from old mice. Mech. Ageing Dev. 1997, 94, 71–83. [Google Scholar] [CrossRef]
  106. Liu, B.; Carle, K.W.; Whisler, R.L. Reductions in the activation of ERK and JNK are associated with decreased IL-2 production in T cells from elderly humans stimulated by the TCR/CD3 complex and costimulatory signals. Cell. Immunol. 1997, 182, 79–88. [Google Scholar] [CrossRef]
  107. Douziech, N.; Seres, I.; Larbi, A.; Szikszay, E.; Roy, P.M.; Arcand, M.; Dupuis, G.; Fulop, T.J. Modulation of human lymphocyte proliferative response with aging. Exp. Gerontol. 2002, 37, 369–387. [Google Scholar] [CrossRef]
  108. Adams, A.A.; Breathnach, C.C.; Katepalli, M.P.; Kohler, K.; Horohov, D.W. Advanced age in horses affects divisional history of T cells and inflammatory cytokine production. Mech. Ageing Dev. 2008, 129, 656–664. [Google Scholar] [CrossRef]
  109. Horohov, D.W.; Kydd, J.H.; Hannant, D. The effect of aging on T cell responses in the horse. Dev. Comp. Immunol. 2002, 26, 121–128. [Google Scholar] [CrossRef]
  110. Katepalli, M.P.; Adams, A.A.; Lear, T.L.; Horohov, D.W. The effect of age and telomere length on immune function in the horse. Dev. Comp. Immunol. 2008, 32, 1409–1415. [Google Scholar] [CrossRef]
  111. Lunn, D.P.; Holmes, M.A.; Gibson, J.; Field, H.J.; Kydd, J.H.; Duffus, W.P.H. Haematological changes and equine lymphocyte subpopulation kinetics during primary infection and attempted re-infection of specific pathogen free foals with EHV-1. Equine Vet. J. 1991, 23, 35–40. [Google Scholar] [CrossRef]
  112. McCulloch, J.; Williamson, S.A.; Powis, S.J.; Edington, N. The effect of EHV-1 infection upon circulating leucocyte populations in the natural equine host. Vet. Microbiol. 1993, 37, 147–161. [Google Scholar] [CrossRef]
  113. Fulop, T.; Larbi, A.; Pawelec, G. Human T Cell Aging and the Impact of Persistent Viral Infections. Front. Immunol. 2013, 4, 271. [Google Scholar] [CrossRef] [PubMed] [Green Version]
  114. Lanna, A.; Henson, S.M.; Escors, D.; Akbar, A.N. The kinase p38 activated by the metabolic regulator AMPK and scaffold TAB1 drives the senescence of human T cells. Nat. Immunol. 2014, 15, 965–972. [Google Scholar] [CrossRef] [PubMed] [Green Version]
  115. Gilden, D.; Nagel, M.A.; Cohrs, R.J. Varicella-zoster. Handb. Clin. Neurol. 2014, 123, 265–283. [Google Scholar] [CrossRef] [Green Version]
  116. Goronzy, J.J.; Weyand, C.M. Understanding immunosenescence to improve responses to vaccines. Nat. Immunol. 2013, 14, 428–436. [Google Scholar] [CrossRef] [PubMed] [Green Version]
  117. O’Neill, T.; Kydd, J.H.; Allen, G.P.; Wattrang, E.; Mumford, J.A.; Hannant, D. Determination of equid herpesvirus 1-specific, CD8+, cytotoxic T lymphocyte precursor frequencies in ponies. Vet. Immunol. Immunopathol. 1999, 70, 43–54. [Google Scholar] [CrossRef]
  118. Kydd, J.H.; Wattrang, E.; Hannant, D. Pre-infection frequencies of equine herpesvirus-1 specific, cytotoxic T lymphocytes correlate with protection against abortion following experimental infection of pregnant mares. Vet. Immunol. Immunopathol. 2003, 96, 207–217. [Google Scholar] [CrossRef]
  119. Perkins, G.A.; Wagner, B. The development of equine immunity: Current knowledge on immunology in the young horse. Equine Vet. J. 2015, 47, 267–274. [Google Scholar] [CrossRef]
  120. Groom, J.R.; Luster, A.D. CXCR3 ligands: Redundant, collaborative and antagonistic functions. Immunol. Cell Biol. 2011, 89, 207–215. [Google Scholar] [CrossRef] [Green Version]
  121. Wimer, C.L.; Damiani, A.; Osterrieder, N.; Wagner, B. Equine herpesvirus type-1 modulates CCL2, CCL3, CCL5, CXCL9, and CXCL10 chemokine expression. Vet. Immunol. Immunopathol. 2011, 140, 266–274. [Google Scholar] [CrossRef]
  122. Adams, D.H.; Rlloyd, A. Chemokines: Leucocyte recruitment and activation cytokines. Lancet 1997, 349, 490–495. [Google Scholar] [CrossRef]
  123. Mariani, E.; Pulsatelli, L.; Neri, S.; Dolzani, P.; Meneghetti, A.; Silvestri, T.; Ravaglia, G.; Forti, P.; Cattini, L.; Facchini, A. RANTES and MIP-1α production by T lymphocytes, monocytes and NK cells from nonagenarian subjects. Exp. Gerontol. 2002, 37, 219–226. [Google Scholar] [CrossRef]
  124. Gilkerson, J.R.; Whalley, J.M.; Drummer, H.E.; Studdert, M.J.; Love, D.N. Epidemiological studies of equine herpesvirus 1 (EHV-1) in Thoroughbred foals: A review of studies conducted in the Hunter Valley of New South Wales between 1995 and 1997. Vet. Microbiol. 1999, 68, 15–25. [Google Scholar] [CrossRef]
  125. Gilkerson, J.R.; Whalley, J.M.; Drummer, H.E.; Studdert, M.J.; Love, D.N. Epidemiology of EHV-1 and EHV-4 in the mare and foal populations on a Hunter Valley stud farm: Are mares the source of EHV-1 for unweaned foals. Vet. Microbiol. 1999, 68, 27–34. [Google Scholar] [CrossRef]
  126. Foote, C.E.; Love, D.N.; Gilkerson, J.R.; Whaley, J.M. Detection of EHV-1 and EHV-4 DNA in unweaned Thoroughbred foals from vaccinated mares on a large stud farm. Equine Vet. J. 2010, 36, 341–345. [Google Scholar] [CrossRef] [PubMed]
  127. Mumford, J.A.; Rossdale, P.D.; Jessett, D.M.; Gann, S.J.; Ousey, J. Serological and virological investigations of an equid herpesvirus 1 (EHV-1) abortion storm on a stud farm in 1985. J. Reprod. Fertil. Suppl. 1987, 35, 509–518. [Google Scholar] [PubMed]
  128. Giessler, K.S.; Samoilowa, S.; Hussey, G.S.; Kiupel, M.; Matiasek, K.; Sledge, D.J.; Liesche, F.; Schlegel, J.; Fux, R.; Goehring, L.S. Viral load and cell tropism during early latent Equid Herpesvirus 1 infection differ over time in lymphoid and neural tissue samples from experimentally infected horses. Front. Vet. Sci. 2020, 7. [Google Scholar] [CrossRef]
  129. Kennedy, P.G.E.; Rovnak, J.; Badani, H.; Cohrs, R.J. A comparison of herpes simplex virus type 1 and varicella-zoster virus latency and reactivation. J. Gen. Virol. 2015, 96, 1581–1602. [Google Scholar] [CrossRef]
  130. Hoshino, Y.; Pesnicak, L.; Cohen, J.I.; Straus, S.E. Rates of reactivation of latent herpes simplex virus from mouse trigeminal ganglia ex vivo correlate directly with viral load and inversely with number of infiltrating CD8+ T cells. J. Virol. 2007, 81, 8157–8164. [Google Scholar] [CrossRef] [Green Version]
  131. Walker, J.; Leib, D.A. Protection from primary infection and establishment of latency by vaccination with a herpes simplex virus type 1 recombinant deficient in the virion host shutoff (vhs) function. Vaccine 1998, 16, 1–5. [Google Scholar] [CrossRef]
  132. Akkutay, A.Z.; Osterrieder, N.; Damiani, A.; Tischer, B.K.; Borchers, K.; Alkan, F. Prevalence of equine gammaherpesviruses on breeding farms in Turkey and development of a TaqMan MGB real-time PCR to detect equine herpesvirus 5 (EHV-5). Arch. Virol. 2014, 159, 2989–2995. [Google Scholar] [CrossRef] [PubMed]
  133. Bell, S.A.; Balasuriya, U.B.R.; Gardner, I.A.; Barry, P.A.; Wilson, W.D.; Ferraro, G.L.; MacLachlan, N.J. Temporal detection of equine herpesvirus infections of a cohort of mares and their foals. Vet. Microbiol. 2006, 116, 249–257. [Google Scholar] [CrossRef]
  134. Smith, K.C.; Mumford, J.A.; Lakhani, K. A comparison of equid herpesvirus-1 (EHV-1) vascular lesions in the early versus late pregnant equine uterus. J. Comp. Pathol. 1996, 114, 231–247. [Google Scholar] [CrossRef]
Figure 1. Summary of mRNA sequencing data analysis. RNA was extracted from PBMCs from horses prior to and during EHV-1 CH. The gray boxes represent experimental design. The dashed outline boxes are data analysis processes (actions). Black and red boxes represent output. The red outline indicates final output used for interpretation.
Viruses 13 00356 g001
Figure 2. Summary of miRNA sequencing data analysis. RNA was extracted from PBMCs from horses prior to and during EHV-1 CH. The gray boxes represent experimental design. The dashed outline boxes are data analysis processes (actions). Black and red boxes represent output. The red outline indicates final output used for interpretation.
Viruses 13 00356 g002
Figure 3. Viremia in (A) EHM and (B) non-EHM horses. Data is expressed as EHV-1 copy number per 500 ng template DNA as determined by qPCR. This data was obtained in conjunction with another study [54]. Day of peak viremia was determined for each horse and PBMCs from that day were used for each horse’s post-EHV-1 CH sample.
Viruses 13 00356 g003
Figure 4. Principle component analysis (PCA) plot. Principle component analysis was performed on the read count data obtained after mRNA sequencing. Brown closed diamonds indicate samples from non-EHM horses post EHV-1 CH, brown open circles indicate samples from non-EHM horses prior to EHV-1 CH, blue closed squares indicate samples from EHM horses post EHV-1 CH, and blue open squares indicate samples from EHM horses prior to EHV-1 CH.
Viruses 13 00356 g004
Figure 5. Volcano plots of differentially expressed genes. (A) Genes differentially expressed between EHM and non-EHM horses. Genes with a positive log fold change represent genes upregulated in EHM horses compared to non-EHM horses, while genes with a negative log fold change represent genes downregulated in EHM horses compared to non-EHM horses. (B) Genes differentially expressed within non-EHM horses. Genes with a positive log fold change represent genes upregulated in non-EHM horses post CH compared to pre CH, while genes with a negative log fold change represent genes downregulated. (C) Genes differentially expressed within EHM horses. Genes with a positive log fold change represent genes upregulated in EHM horses post CH compared to pre CH, while genes with a negative log fold change represent downregulated genes. p values are expressed on the y-axis, with more significantly differentially expressed genes towards the top of the plot. Genes highlighted in red passed the threshold of significance set at adjusted p-value < 0.05 and log fold change >|1|.
Viruses 13 00356 g005
Figure 6. Venn diagrams of up- and downregulated genes in response to EHV-1 challenge. The within group comparisons for EHM and non-EHM horses were compared using a Venn diagram to determine genes uniquely (A) upregulated and (B) downregulated for each group.
Viruses 13 00356 g006
Figure 7. GO terms for biological processes overrepresented in EHM horses compared to non-EHM horses. (A) Upregulated biological processes and (B) downregulated biological processes. GO term enrichment analysis was performed using the enrichgo function of the clusterprofiler package in R. The resulting terms were filtered for redundancy using REVIGO. The nonredundant enriched GO terms are visualized here. The most significantly enriched terms are at the top and listed in decreasing significance (increasing p.adjust). The number of genes from our gene list are indicated on the x-axis.
Viruses 13 00356 g007
Figure 8. Net plot of the most significantly enriched GO terms and associated genes. (A) Upregulated biological process and (B) downregulated biological processes. The nonredundant GO terms are listed here with the associated genes from our gene list. Tan nodes represent the GO term and gray nodes represent genes. The size of the GO term nodes indicates the number of genes from our list associated with that term. The biological processes and the associated genes cluster based on similarity.
Viruses 13 00356 g008
Figure 9. Normalized read counts (cpm) of selected genes in PBMCs of horses. (A) IL6 (B) RSAD2 (C) TLR3 (D) FOS (E) JUN (F) IFNG. All differences in responses are statistically significant at p < 0.05.
Viruses 13 00356 g009
Figure 10. Gene expression as determined by RT-qPCR and RNA sequencing. RT-qPCR data from whole blood is expressed as the negative delta-delta-Cq value for (A) CCL5, (C) CXCL10, (E) IRF9, (G) MMP9, and (I) THBS1, where the average pre CH data for each group used as a calibrator and values above zero represent an upregulation and below zero represent a downregulation. RNA sequencing data from PBMCs are shown for comparison and expressed as delta-CPM (post CH CPM value—group average of pre CH CPM) for (B) CCL5, (D) CXCL10, (F) IRF9, (H) MMP9, and (J) THBS1. Differences between groups were statistically significant as described in the methods for all genes visualized here.
Viruses 13 00356 g010
Figure 11. Normalized counts of viral genes post EHV-1 challenge. Data represents the average transcripts per million (TPM). The gray line is non-EHM horses and the black line is EHM horses.
Viruses 13 00356 g011
Figure 12. Micro RNA expression analyses. Principal component analysis (PCA) plot for miRNA read counts. Principal component analysis was performed on the read count data obtained after miRNA sequencing. Brown closed diamonds indicate samples from non-EHM horses post EHV-1 CH, brown open circles indicate samples from non-EHM horses prior to EHV-1 CH, blue closed squares indicate samples from EHM horses post EHV-1 CH, and blue open squares indicate sam-ples from EHM horses prior to EHV-1 CH.
Viruses 13 00356 g012
Figure 13. Venn diagrams highlighting genes identified as miRNA targets that were common to those differentially regulated in response to EHV-1 infection. (A) Predicted target genes of differ-entially upregulated miRNA that are common with differentially expressed genes unique to EHM horses (within group comparison) and/or differentially expressed genes in the contrast (between group comparison). (B) Predicted target genes of differentially downregulated miRNA that are common with differentially expressed genes unique to EHM horses (within group comparison) and/or differentially expressed genes in the contrast (between group) comparison.
Viruses 13 00356 g013
Table 1. Enriched GO terms based on differentially expressed genes in EHM horses. GO term enrichment was performed on the gene list of within group up- and down-regulated genes unique to EHM horses.
IDDescriptionGene RatioBg Ratiop Valuep.adjustq ValuegeneIDCount
Upregulated
GO:0051607defense response to virus13/92175/13,9911.1 × 10−102.1 × 10−071.8 × 10−07EIF2AK2/TRIM56/ADAR/CXCL10/IRF9/RTP4/ISG15/AIM2/IRF7/TLR3/IL6/ISG20/IL1513
GO:0032479regulation of type I interferon production8/92104/13,9913.9 × 10−071.3 × 10−041.1 × 10−04TRIM56/UBA7/NMI/ISG15/IRF7/ACOD1/
TLR3/ZBP1
8
GO:0042107cytokine metabolic process7/92101/13,9914.4 × 10−066.8 × 10−045.9 × 10−04LAG3/NMI/IGF2BP3/IRF7/TLR3/IL6/CYBB7
GO:0043900regulation of multi-organism process11/92313/13,9916.3 × 10−069.0 × 10−047.9 × 10−04EIF2AK2/ADAR/PPID/ISG15/CD180/AIM2/
ACOD1/ISG20/IL15/SLPI/TIMP1
11
GO:0048771tissue remodeling7/92150/13,9915.8 × 10−054.5 × 10−033.9 × 10−03TGM2/CD38/SNX10/IL6/IL15/VDR/TIMP17
GO:0032570response to progesterone4/9238/13,9911.1 × 10−046.7 × 10−035.9 × 10−03CD38/ACOD1/NR1H3/RAMP24
GO:0010883regulation of lipid storage4/9241/13,9911.5 × 10−047.9 × 10−036.9 × 10−03IL6/LPL/NR1H3/MSR14
GO:0015012heparan sulfate proteoglycan biosynthetic process3/9223/13,9914.4 × 10−041.8 × 10−021.6 × 10−02EXT1/TCF7L2/EXTL23
GO:0010743regulation of macrophage derived foam cell differentiation3/9225/13,9915.7 × 10−042.1 × 10−021.9 × 10−02LPL/NR1H3/MSR13
GO:0070661leukocyte proliferation7/92231/13,9918.1 × 10−042.6 × 10−022.2 × 10−02TNFSF13B/CD38/CD180/IL6/GAPT/IL15/CCL87
GO:0090077foam cell differentiation3/9230/13,9919.8 × 10−042.8 × 10−022.4 × 10−02LPL/NR1H3/MSR13
GO:0097050type B pancreatic cell apoptotic process2/9210/13,9911.9 × 10−034.7 × 10−024.1 × 10−02IL6/TCF7L22
Downregulated
GO:0030335positive regulation of cell migration20/181441/13,9911.1 × 10−068.4 × 10−047.6 × 10−04DAPK2/MMP9/DOCK5/FGFR1/CASS4/CCL5/FN1/HSPA5/THBS1/JUN/INSR/ADAM8/PDGFB/PDGFD/SEMA6C/SEMA4C/TNFSF14/GATA2/RHOB/GPNMB20
GO:0031952regulation of protein autophosphorylation6/18143/13,9911.8 × 10−058.9 × 10−038.0 × 10−03NLRP12/JUN/PDGFB/PDGFD/ERRFI1/GPNMB6
GO:0046777protein autophosphorylation12/181220/13,9912.9 × 10−051.3 × 10−021.1 × 10−02DAPK2/PTK6/FGFR1/NLRP12/JUN/INSR/
PDGFB/PDGFD/ERRFI1/INSRR/BMX/GPNMB
12
GO:0070371ERK1 and ERK2 cascade13/181292/13,9911.1 × 10−043.0 × 10−022.7 × 10−02FGFR1/CCL5/FN1/NLRP12/FBLN1/JUN/INSR/PDGFB/PDGFD/ERRFI1/INSRR/ZFP36L2/
GPNMB
13
GO:0032103positive regulation of response to external stimulus12/181260/13,9911.5 × 10−043.6 × 10−023.3 × 10−02DAPK2/FGFR1/CCL5/FAM19A3/NLRP12/
THBS1/MAPK13/ADAM8/PDGFB/PDGFD/
NPY/TNFSF14
12
GO:0010035response to inorganic substance17/181491/13,9912.2 × 10−044.6 × 10−024.2 × 10−02EEF1A2/MMP9/HSPA5/THBS1/MAPK13/JUN/SELENOP/PDGFD/PTCH1/GSN/FOSB/FOS/
SLC40A1/CHP2/JUND/RHOB/IL1A
17
GO:0071248cellular response to metal ion9/181161/13,9912.5 × 10−044.6 × 10−024.2 × 10−02MMP9/HSPA5/JUN/GSN/FOSB/FOS/SLC40A1/CHP2/JUND9
Table 2. Average fraction of cell populations.
EHM Pre Challenge (% of Total Cell Population)EHM Post Challenge (% of Total Cell Population)Non-EHM Pre Challenge (% of Total Cell Population)Non-EHM Post Challenge (% of Total Cell Population)
B cells naïve23.03 ± 1.8424.75 ± 3.2337.03 ± 1.5332.55 ± 1.14 **
B cells memory0.60 ± 0.600.41 ± 0.410.03 ± 0.030.00 ± 0.00
Plasma cells0.27 ± 0.120.46 ± 0.290.28 ± 0.150.74 ± 0.06 *
T cells CD87.92 ± 1.562.36 ± 1.59 *2.18 ± 0.792.21 ± 1.03
T cells CD4 naive1.64 ± 0.664.60 ± 2.056.21 ± 2.2510.26 ± 1.62
T cells CD4 memory resting0.77 ± 0.551.34 ± 0.770.02 ± 0.020.00 ± 0.00
T cells CD4 memory activated7.88 ± 0.869.55 ± 1.620.55 ± 0.261.71 ± 0.52 *
T cells follicular helper16.62 ± 1.5814.86 ± 1.8423.27 ± 0.8019.43 ± 1.44 *
T cells regulatory (Tregs)1.82 ± 0.620.16 ± 0.16 **1.48 ± 0.490.41 ± 0.41
T cells gamma delta0.88 ± 0.332.84 ± 0.66 *0.79 ± 0.322.67 ± 0.82 *
NK cells resting6.43 ± 1.102.75 ± 1.08 **2.24 ± 0.820.86 ± 0.35
NK cells activated0.13 ± 0.130.34 ± 0.220.63 ± 0.420.53 ± 0.26
Monocytes12.71 ± 2.7513.85 ± 3.727.27 ± 0.5711.85 ± 2.22
Macrophages M02.99 ± 0.910.00 ± 0.00 **1.77 ± 1.010.15 ± 0.15
Macrophages M10.00 ± 0.000.98 ± 0.30 **0.00 ± 0.000.00 ± 0.00
Macrophages M26.34 ± 0.578.54 ± 0.80 *4.22 ± 0.845.54 ± 0.93
Dendritic cells resting0.04 ± 0.040.86 ± 0.37 *0.37 ± 0.290.35 ± 0.30
Dendritic cells activated2.92 ± 0.484.88 ± 0.89 *4.24 ± 0.325.99 ± 0.42 *
Mast cells resting0.33 ± 0.330.23 ± 0.220.00 ± 0.000.00 ± 0.00
Mast cells activated4.51 ± 0.781.80 ± 0.99 *5.43 ± 2.042.32 ± 1.80
Eosinophils1.63 ± 0.773.83 ± 0.58 **1.74 ± 0.601.56 ± 0.50
Neutrophils0.54 ± 0.230.60 ± 0.240.25 ± 0.250.86 ± 0.56
Table 2. Average fractions of cell populations in PBMCs. Cell population fractions for each sample were estimated using CIBERSORTx [52] and the reference gene signature “LM22” included with the software, which is based on the transcriptome of human PBMC samples with predetermined cell populations. Wilcox signed-rank test was performed on the paired samples for each group * indicates a significant difference at p ≤ 0.1, and ** indicates p ≤ 0.05 in cell fraction between pre CH and post CH samples for each group (EHM and non-EHM).
Table 3. Differentially expressed miRNAs.
mirBase IDMouse or Human OrthologueMature SequencelogFCFDRPredicted Differentially Expressed Target Genes in Contrast ComparisonPredicted Differentially Expressed Target Genes Unique in EHM Horses
Upregulated in EHM vs non-EHM horses: contrast comparison (between groups)
Novel (id: 764)unknownCCCGCCCGGCCCGGCCGCC2.630.04NDND
Novelmmu-miR-7059-5pGCCGGGGAGCCCGGCGGGC2.010.03ADAM22, CREB5, FADS2, INSR, KLF6, OAS2, ORAI2ADAM22, ARL4D, CREB5, F11R, FADS2, HIC1, IER5, INSR, JAM2, JUND, KLF6, LAYN, ORAI2, PARD6G, PSD3, PSMB9, SOBP, SRGAP1, TBXA2R
Downregulated in EHM vs non-EHM horses: contrast comparison (between groups)
Novelmmu-miR-669k-5pTGTGCATGTGTGCATGTAGGCAG−1.30.05ADAM22, CMPK2, CREB5, DUSP1, EPHA4, INSR, KCNC4, KCNQ4, LONRF3, MEGF9, NHSL2, NUDT4, OAS2, PAQR8, PLCB1, SCD, SLC16A14, SLC18B1, SLC7A11, STARD13, TET1 ADAM22, AGAP1, AKAP7, BAIAP3, CORO2A, CREB5, ELOVL7, EMP1, FOSB, HSPA2, HSPA5, HTRA1, INSR, INSRR, JAM2, KCNQ4, LONRF3, MEFV, MEGF9, NFASC, NHSL2, NUDT4, PLCB1, PARD6G, PLEKHA6, PSD3, PTPRF, QPCT, SDC3, SLC18B1, SLC7A11, ADAM22, CMPK2, CREB5, XCR1, DUSP1, SRGAP1, STARD13,TAP1,TOR1B, TMEM26,
eca-miR-199a/b-5phsa-miR-199a-3pACAGTAGTCTGCACATTGGTT−1.330.008ACER2, FOS, FRY, SCD SLC7A11, LONRF3, PLCB1, ACER2, TLE2, FRY, FOS, SCD, PTPRF, CXXC5, LONRF3, PLCB1, SLC7A11, FN1
eca-miR-34chsa-miR-34a-5pAGGCAGTGTAGTTAGCTGATTGC−1.30.008ADAM22, CREB5, DIXDC1, FRMD4A, KLF4, LONRF3, MAP1AADAM22, CERS4, CREB5, DIXDC1, DLL1, FOSB, LONRF3, PSD3, RGMB, SEMA4C, TRANK1, VAT1, VWA5B2
Novelhsa-miR-542-5pTCGGGGATTCAGGTGGCTGTTC−1.240.008BCORL1, GPR137C, INSR, KLF6, ORAI2, OSM, PTCH1, TEX35, ZNF862ADAM33, ADAMTS2, FOSB, GFI1, IER5, INSR, JUND, KLF6, KLRB1, LTBP4, NECAB3, NPDC1, ORAI2, PARP12, PLEKHG5, PTCH1, RGS16, RHOB, SDC3, SRGAP1, TCF7L2, TMEM151B, TNFSF14, ZBTB16, ZFP36L2, ZNF827
eca-miR-10bhsa-miR-10a-5pTACCCTGTAGAACCGAATTTGT−1.200.035STARD13, EPHA4NFASC, SOBP, STARD13, ZBTB16, ZNF827
eca-miR-328hsa-miR-328-3pCTGGCCCTCTCTGCCCTTCCGT−1.130.01NHSL2CHP2, HIC1, LHFPL2, MFSD2A, NHSL2, PLEKHA6, PTPRF, TCF7L2
eca-miR-146ahsa-miR-146a-5pTGAGAACTGAATTCCATGGGTT−1.050.001BCORL1, SGIP1CDS1, CNTFR, LAYN, MYBL1,SCN3B, VAT1
Uniquely upregulated in EHM horses (within group)
Novel (id: 764)unknownCCCGCCCGGCCCGGCCGCC2.310.001NDND
Novel (id: 983)unknownCCGCCCGCCGCCGCCGCC1.740.01NDND
Novel (id: 187)unknownCCCGCCCGCCGCCGCCGCC1.730.01NDND
Novelhsa-miR-7108-3pCCCCGCCCGCCGCCGCCG1.70.01ATF3, CD7, DBP, INSR, LIPE, MAPK13, NEO1, NLRP12, ORAI2, OSCAR, OSM, PDGFB, PTCH1, SEMA6C, ZNF862ADAR, ARL4D, AXIN2, CD180, CD7, EMP1, FOSB, GATA2, GPNMB, HIC1, HSH2D, IER3, INSR, JUND, LAMTOR2, LIPE, MAPK13, MICAL2, MSR1, NEO1, NFASC, NLRP12, NPTX1, NTNG2, ORAI2, PDGFB, PLEKHG5, PLXND1, PSMB9, PTCH1, PTPRF, SDC3, SEMA4C, SEMA6C, SOBP, TNFSF14, VAT1, ZBTB16, ZDHHC1
Novelmmu-miR-7059-5pGCCGGGGAGCCCGGCGGGC1.60.002ADAM22, CREB5, FADS2, INSR, KLF6, OAS2, ORAI2ADAM22, ARL4D, CREB5, F11R, FADS2, HIC1, IER5, INSR, JAM2, JUND, KLF6, LAYN, ORAI2, PARD6G, PSD3, PSMB9, SOBP, SRGAP1, TBXA2R
Uniquely downregulated in EHM horses (within group)
eca-miR-483unknownCACTCCTCTCCTCCCGTCTTCT−1.8<0.001NDND
eca-miR-146ahsa-miR-146a-5pTGAGAACTGAATTCCATGGGTT−1.49<0.001BCORL1, SGIP1CDS1, CNTFR, LAYN, MYBL1,SCN3B, VAT1
eca-miR-34chsa-miR-34a-5pAGGCAGTGTAGTTAGCTGATTGC−1.34<0.001ADAM22, CREB5, DIXDC1, FRMD4A, KLF4, LONRF3, MAP1AADAM22, CERS4, CREB5, DIXDC1, DLL1, FOSB, LONRF3, PSD3, RGMB, SEMA4C, TRANK1, VAT1, VWA5B2
eca-miR-138hsa-miR-138-5pAGCTGGTGTTGTGAATCAGGCCG−1.31<0.001LONRF3, DAPK2, FRMD4A, FRMPD3AHDC1, DAPK2, EXT1, FOSB, LONRF3, NPTX1, SCN3B, SDC3, SEMA4C, SOBP, ZFP36L2
eca-miR-199b-5phsa-miR-199a-3pACAGTAGTCTGCACATTGGTT−1.03<0.001ACER2, FOS, FRY, SCD LONRF3, PLCB1, SLC7A11ACER2, TLE2, FRY, FOS, SCD, PTPRF, CXXC5, LONRF3, PLCB1, SLC7A11, FN1
Table 3. Differentially expressed (FDR < 0.05 and log 2-fold change >|1|) miRNAs are shown here. The top lists indicate miRNAs identified in the between group (contrast) comparison. Up-regulated/downregulated terms are those based on the genes upregulated/downregulated in EHM horses compared to Non-EHM horses. The bottom lists indicate the miRNAs uniquely differentially expressed within the EHM group (pre vs. post CH). Upregulated/downregulated refers to genes upregulated/downregulated during viremia compared to pre CH. There were no differentially expressed miRNAs in the non-EHM horses pre vs. post CH. ID numbers next to novel miRNAs indicate the arbitrary ID given to those without corresponding equine, murine, or human IDs. Predicted target genes that were also differentially regulated in the contrast comparison or uniquely regulated in EHM horses are indicated in red when significantly upregulated and in black when significantly downregulated. A summary of predicted target genes of differentially up- and downregulated miRNAs are shown and how they overlap with differentially expressed genes unique to EHM horses in response to EHV-1 CH (within group comparison) and between groups (contrast comparison) are shown in Figure 13.
Publisher’s Note: MDPI stays neutral with regard to jurisdictional claims in published maps and institutional affiliations.

