
Peripheral Blood Immune Profiling of Convalescent Plasma Donors Reveals Alterations in Specific Immune Subpopulations Even at 2 Months Post SARS-CoV-2 Infection

 ,
,  , ,
, ,  ,
,  , and
, and 
Abstract
1. Introduction
2. Materials and Methods
2.1. Donors, Clinical Characteristics, and Detection of Anti-SARS-CoV-2 Antibodies
2.2. Blood Sample Collection and Staining
2.3. Sample Preparation for Flow Cytometry Analysis
2.4. Flow Cytometry Gating Strategy
2.5. Statistical Analysis
3. Results
4. Discussion
5. Conclusions
Supplementary Materials
Author Contributions
Funding
Institutional Review Board Statement
Informed Consent Statement
Acknowledgments
Conflicts of Interest
References
- Gavriatopoulou, M.; Korompoki, E.; Fotiou, D.; Ntanasis-Stathopoulos, I.; Psaltopoulou, T.; Kastritis, E.; Terpos, E.; Dimopoulos, M.A. Organ-specific manifestations of COVID-19 infection. Clin. Exp. Med. 2020, 20, 493–506. [Google Scholar] [CrossRef] [PubMed]
- Smart, L.; Fawkes, N.; Goggin, P.; Pennick, G.; Rainsford, K.D.; Charlesworth, B.; Shah, N. A narrative review of the potential pharmacological influence and safety of ibuprofen on coronavirus disease 19 (COVID-19), ACE2, and the immune system: A dichotomy of expectation and reality. Inflammopharmacology 2020, 28, 1141–1152. [Google Scholar] [CrossRef] [PubMed]
- Felsenstein, S.; Herbert, J.A.; McNamara, P.S.; Hedrich, C.M. COVID-19: Immunology and treatment options. Clin. Immunol. 2020, 215, 108448. [Google Scholar] [CrossRef] [PubMed]
- Jafarzadeh, A.; Chauhan, P.; Saha, B.; Jafarzadeh, S.; Nemati, M. Contribution of monocytes and macrophages to the local tissue inflammation and cytokine storm in COVID-19: Lessons from SARS and MERS, and potential therapeutic interventions. Life Sci. 2020, 257, 118102. [Google Scholar] [CrossRef] [PubMed]
- Vankadari, N.; Wilce, J.A. Emerging WuHan (COVID-19) coronavirus: Glycan shield and structure prediction of spike glycoprotein and its interaction with human CD26. Emerg. Microbes Infect. 2020, 9, 601–604. [Google Scholar] [CrossRef]
- Zheng, M.; Gao, Y.; Wang, G.; Song, G.; Liu, S.; Sun, D.; Xu, Y.; Tian, Z. Functional exhaustion of antiviral lymphocytes in COVID-19 patients. Cell. Mol. Immunol. 2020, 17, 533–535. [Google Scholar] [CrossRef]
- Zheng, H.Y.; Zhang, M.; Yang, C.X.; Zhang, N.; Wang, X.C.; Yang, X.P.; Dong, X.Q.; Zheng, Y.T. Elevated exhaustion levels and reduced functional diversity of T cells in peripheral blood may predict severe progression in COVID-19 patients. Cell. Mol. Immunol. 2020, 17, 541–543. [Google Scholar] [CrossRef]
- Mathew, D.; Giles, J.R.; Baxter, A.E.; Oldridge, D.A.; Greenplate, A.R.; Wu, J.E.; Alanio, C.; Kuri-Cervantes, L.; Pampena, M.B.; D’Andrea, K.; et al. Deep immune profiling of COVID-19 patients reveals distinct immunotypes with therapeutic implications. Science 2020, 369. [Google Scholar] [CrossRef]
- Bordoni, V.; Sacchi, A.; Cimini, E.; Notari, S.; Grassi, G.; Tartaglia, E.; Casetti, R.; Giancola, L.; Bevilacqua, N.; Maeurer, M.; et al. An inflammatory profile correlates with decreased frequency of cytotoxic cells in COVID-19. Clin. Infect. Dis. 2020, 71, 2272–2275. [Google Scholar] [CrossRef]
- Wilk, A.J.; Rustagi, A.; Zhao, N.Q.; Roque, J.; Martinez-Colon, G.J.; McKechnie, J.L.; Ivison, G.T.; Ranganath, T.; Vergara, R.; Hollis, T.; et al. A single-cell atlas of the peripheral immune response in patients with severe COVID-19. Nat. Med. 2020, 26, 1070–1076. [Google Scholar] [CrossRef]
- Garcia, L.F. Immune Response, Inflammation, and the Clinical Spectrum of COVID-19. Front. Immunol. 2020, 11, 1441. [Google Scholar] [CrossRef] [PubMed]
- Sanders, J.M.; Monogue, M.L.; Jodlowski, T.Z.; Cutrell, J.B. Pharmacologic Treatments for Coronavirus Disease 2019 (COVID-19): A Review. JAMA 2020, 323, 1824–1836. [Google Scholar] [CrossRef] [PubMed]
- Gavriatopoulou, M.; Ntanasis-Stathopoulos, I.; Korompoki, E.; Fotiou, D.; Migkou, M.; Tzanninis, I.G.; Psaltopoulou, T.; Kastritis, E.; Terpos, E.; Dimopoulos, M.A. Emerging treatment strategies for COVID-19 infection. Clin. Exp. Med. 2020, 30, 1–13. [Google Scholar] [CrossRef] [PubMed]
- Psaltopoulou, T.; Sergentanis, T.N.; Pappa, V.; Politou, M.; Terpos, E.; Tsiodras, S.; Pavlakis, G.N.; Dimopoulos, M.A. The Emerging Role of Convalescent Plasma in the Treatment of COVID-19. Hemasphere 2020, 4, e409. [Google Scholar] [CrossRef]
- Rojas, M.; Rodriguez, Y.; Monsalve, D.M.; Acosta-Ampudia, Y.; Camacho, B.; Gallo, J.E.; Rojas-Villarraga, A.; Ramirez-Santana, C.; Diaz-Coronado, J.C.; Manrique, R.; et al. Convalescent plasma in Covid-19: Possible mechanisms of action. Autoimmun. Rev. 2020, 19, 102554. [Google Scholar] [CrossRef] [PubMed]
- Cantore, I.; Valente, P. Convalescent plasma from COVID 19 patients enhances intensive care unit survival rate. A preliminary report. Transfus. Apher. Sci. 2020, 59, 102848. [Google Scholar] [CrossRef]
- Joyner, M.J.; Bruno, K.A.; Klassen, S.A.; Kunze, K.L.; Johnson, P.W.; Lesser, E.R.; Wiggins, C.C.; Senefeld, J.W.; Klompas, A.M.; Hodge, D.O.; et al. Safety Update: COVID-19 Convalescent Plasma in 20,000 Hospitalized Patients. Mayo Clin. Proc. 2020, 95, 1888–1897. [Google Scholar] [CrossRef]
- Simonovich, V.A.; Burgos Pratx, L.D.; Scibona, P.; Beruto, M.V.; Vallone, M.G.; Vazquez, C.; Savoy, N.; Giunta, D.H.; Perez, L.G.; Sanchez, M.D.L.; et al. A Randomized Trial of Convalescent Plasma in Covid-19 Severe Pneumonia. N. Engl. J. Med. 2020. [Google Scholar] [CrossRef]
- Pallotto, C.; Suardi, L.R.; Esperti, S.; Tarquini, R.; Grifoni, E.; Meini, S.; Valoriani, A.; Di Martino, S.; Cei, F.; Sisti, E.; et al. Increased CD4/CD8 ratio as a risk factor for critical illness in coronavirus disease 2019 (COVID-19): A retrospective multicentre study. Infect. Dis. 2020, 52, 675–677. [Google Scholar] [CrossRef]
- Bouadma, L.; Wiedemann, A.; Patrier, J.; Surenaud, M.; Wicky, P.H.; Foucat, E.; Diehl, J.L.; Hejblum, B.P.; Sinnah, F.; de Montmollin, E.; et al. Immune Alterations in a Patient with SARS-CoV-2-Related Acute Respiratory Distress Syndrome. J. Clin. Immunol. 2020, 40, 1082–1092. [Google Scholar] [CrossRef]
- Swadling, L.; Maini, M.K. T cells in COVID-19—United in diversity. Nat. Immunol. 2020, 21, 1307–1308. [Google Scholar] [CrossRef] [PubMed]
- van Eeden, C.; Khan, L.; Osman, M.S.; Cohen Tervaert, J.W. Natural Killer Cell Dysfunction and Its Role in COVID-19. Int. J. Mol. Sci. 2020, 21, 6351. [Google Scholar] [CrossRef] [PubMed]
- Zhang, J.Y.; Wang, X.M.; Xing, X.; Xu, Z.; Zhang, C.; Song, J.W.; Fan, X.; Xia, P.; Fu, J.L.; Wang, S.Y.; et al. Single-cell landscape of immunological responses in patients with COVID-19. Nat. Immunol. 2020, 21, 1107–1118. [Google Scholar] [CrossRef] [PubMed]
- Peruzzi, B.; Bencini, S.; Capone, M.; Mazzoni, A.; Maggi, L.; Salvati, L.; Vanni, A.; Orazzini, C.; Nozzoli, C.; Morettini, A.; et al. Quantitative and qualitative alterations of circulating myeloid cells and plasmacytoid DC in SARS-CoV-2 infection. Immunology 2020, 161, 345–353. [Google Scholar] [CrossRef] [PubMed]
- Ibarrondo, F.J.; Fulcher, J.A.; Goodman-Meza, D.; Elliott, J.; Hofmann, C.; Hausner, M.A.; Ferbas, K.G.; Tobin, N.H.; Aldrovandi, G.M.; Yang, O.O. Rapid Decay of Anti-SARS-CoV-2 Antibodies in Persons with Mild Covid-19. N. Engl. J. Med. 2020, 383, 1085–1087. [Google Scholar] [CrossRef] [PubMed]
- Terpos, E.; Mentis, A.; Dimopoulos, M.A. Loss of Anti-SARS-CoV-2 Antibodies in Mild Covid-19. N. Engl. J. Med. 2020, 383, 1695. [Google Scholar] [CrossRef]
- Terpos, E.; Politou, M.; Sergentanis, T.N.; Mentis, A.; Rosati, M.; Stellas, D.; Bear, J.; Hu, X.; Felber, B.K.; Pappa, V.; et al. Anti-SARS-CoV-2 Antibody Responses in Convalescent Plasma Donors Are Increased in Hospitalized Patients; Subanalyses of a Phase 2 Clinical Study. Microorganisms 2020, 8, 1885. [Google Scholar] [CrossRef]
- Laing, A.G.; Lorenc, A.; Del Molino Del Barrio, I.; Das, A.; Fish, M.; Monin, L.; Munoz-Ruiz, M.; McKenzie, D.R.; Hayday, T.S.; Francos-Quijorna, I.; et al. A dynamic COVID-19 immune signature includes associations with poor prognosis. Nat. Med. 2020, 26, 1623–1635. [Google Scholar] [CrossRef]
- Li, D.; Chen, Y.; Liu, H.; Jia, Y.; Li, F.; Wang, W.; Wu, J.; Wan, Z.; Cao, Y.; Zeng, R. Immune dysfunction leads to mortality and organ injury in patients with COVID-19 in China: Insights from ERS-COVID-19 study. Signal Transduct. Target. Ther. 2020, 5, 62. [Google Scholar] [CrossRef] [PubMed]
- Wang, F.; Nie, J.; Wang, H.; Zhao, Q.; Xiong, Y.; Deng, L.; Song, S.; Ma, Z.; Mo, P.; Zhang, Y. Characteristics of Peripheral Lymphocyte Subset Alteration in COVID-19 Pneumonia. J. Infect. Dis. 2020, 221, 1762–1769. [Google Scholar] [CrossRef] [PubMed]
- Masselli, E.; Vaccarezza, M.; Carubbi, C.; Pozzi, G.; Presta, V.; Mirandola, P.; Vitale, M. NK cells: A double edge sword against SARS-CoV-2. Adv. Biol. Regul. 2020, 77, 100737. [Google Scholar] [CrossRef] [PubMed]
- Ma, A.; Cheng, J.; Yang, J.; Dong, M.; Liao, X.; Kang, Y. Neutrophil-to-lymphocyte ratio as a predictive biomarker for moderate-severe ARDS in severe COVID-19 patients. Crit. Care 2020, 24, 288. [Google Scholar] [CrossRef] [PubMed]
- Yan, X.; Li, F.; Wang, X.; Yan, J.; Zhu, F.; Tang, S.; Deng, Y.; Wang, H.; Chen, R.; Yu, Z.; et al. Neutrophil to lymphocyte ratio as prognostic and predictive factor in patients with coronavirus disease 2019: A retrospective cross-sectional study. J. Med. Virol. 2020. [Google Scholar] [CrossRef] [PubMed]
- Vitte, J.; Diallo, A.B.; Boumaza, A.; Lopez, A.; Michel, M.; Allardet-Servent, J.; Mezouar, S.; Sereme, Y.; Busnel, J.M.; Miloud, T.; et al. A Granulocytic Signature Identifies COVID-19 and Its Severity. J. Infect. Dis. 2020, 222, 1985–1996. [Google Scholar] [CrossRef] [PubMed]
- Pilione, M.R.; Agosto, L.M.; Kennett, M.J.; Harvill, E.T. CD11b is required for the resolution of inflammation induced by Bordetella bronchiseptica respiratory infection. Cell Microbiol. 2006, 8, 758–768. [Google Scholar] [CrossRef] [PubMed]
- Liu, Y.; Qi, G.; Bellanti, J.A.; Moser, R.; Ryffel, B.; Zheng, S.G. Regulatory T cells: A potential weapon to combat COVID-19? MedComm 2020. [Google Scholar] [CrossRef] [PubMed]
- Zhou, Y.Z.; Binqing, F.; Xiaohu, Z.; Dongsheng, W.; Chang, C.Z.; Yingjie, Q.; Rui, S.; Zhigang, T.; Xiaoling, X.; Haiming, W. Pathogenic T-cells and inflammatory monocytes incite inflammatory storms in severe COVID-19 patients. Nat. Sci. Rev. 2020, 7, 998–1002. [Google Scholar] [CrossRef]
- Chen, N.; Zhou, M.; Dong, X.; Qu, J.; Gong, F.; Han, Y.; Qiu, Y.; Wang, J.; Liu, Y.; Wei, Y.; et al. Epidemiological and clinical characteristics of 99 cases of 2019 novel coronavirus pneumonia in Wuhan, China: A descriptive study. Lancet 2020, 395, 507–513. [Google Scholar] [CrossRef]
- Terpos, E.; Ntanasis-Stathopoulos, I.; Elalamy, I.; Kastritis, E.; Sergentanis, T.N.; Politou, M.; Psaltopoulou, T.; Gerotziafas, G.; Dimopoulos, M.A. Hematological findings and complications of COVID-19. Am. J. Hematol. 2020, 95, 834–847. [Google Scholar] [CrossRef]
- Huang, C.; Wang, Y.; Li, X.; Ren, L.; Zhao, J.; Hu, Y.; Zhang, L.; Fan, G.; Xu, J.; Gu, X.; et al. Clinical features of patients infected with 2019 novel coronavirus in Wuhan, China. Lancet 2020, 395, 497–506. [Google Scholar] [CrossRef]
- Wang, F.; Hou, H.; Luo, Y.; Tang, G.; Wu, S.; Huang, M.; Liu, W.; Zhu, Y.; Lin, Q.; Mao, L.; et al. The laboratory tests and host immunity of COVID-19 patients with different severity of illness. JCI Insight 2020, 5. [Google Scholar] [CrossRef] [PubMed]
- Gladstone, D.E.; Kim, B.S.; Mooney, K.; Karaba, A.H.; D’Alessio, F.R. Regulatory T Cells for Treating Patients With COVID-19 and Acute Respiratory Distress Syndrome: Two Case Reports. Ann. Intern. Med. 2020, 173, 852–853. [Google Scholar] [CrossRef] [PubMed]
- Jabeen, R.; Kaplan, M.H. The symphony of the ninth: The development and function of Th9 cells. Curr. Opin. Immunol. 2012, 24, 303–307. [Google Scholar] [CrossRef] [PubMed]


| Controls (n = 10) | PCR+ Ab− Donors (n = 12) | PCR+ Ab+ Non-Hospitalized CP Donors (n = 38) | PCR+ Ab+ Hospitalized CP Donors (n = 24) | Active COVID-19 Patients (n = 11) | |
|---|---|---|---|---|---|
| Male gender (percentage) | 6 (60%) | 5 (41.7%) | 19 (50%) | 16 (66.7%) | 8 (72.7%) |
| Age in years, mean (range) | 44.4 (16–82) | 41.7 (30–60) | 43.1 (18–72) | 58.6 (37–78) | 60.5 (40–82) |
| Symptoms ≥ 2 (percentage) | 0 | 8 (66.7%) | 31 (81.6%) | 22 (91.7%) | 5 (50%) |
| IgA, mean | 0.55 | 0.64 | 5.55 | 3.34 | N/A |
| IgG, mean | 0.29 | 0.46 | 7.32 | 4.90 | N/A |
| Immunesubset | Phenotype |
|---|---|
| White blood cells (WBCs) | CD45+ |
| CD3+ T cells | CD45+ CD3+ SSClow |
| CD8+ cytotoxic T cells | CD45+ CD3+ CD8+ SSClow |
| CD8+ regulatory T cells (CD8+ Tregs) | CD45+ CD3+ CD8+ CD25high SSClow |
| CD4+ helper T cells | CD45+ CD3+ CD4+ SSClow |
| CD4+ regulatory T cells (CD4+ Tregs) | CD45+ CD3+ CD4+ CD25high SSClow |
| Th1-type | CD45+ CD3+ CD4+ CD183+ SSClow |
| Th2-type | CD45+ CD3+ CD4+ CD194+ SSClow |
| Th17-type | CD45+ CD3+ CD4+ CD194+ CD196+ SSClow |
| Th9-type | CD45+ CD3+ CD4+ CD196+ SSClow |
| B cells | CD45+ CD3- CD16− CD56− SSClow |
| Mature NK cells | CD45+ CD3- CD56+ CD16+ SSClow |
| Immature NK cells | CD45+ CD3− CD56bright CD16− SSClow |
| Memory-like NK cells | CD45+ CD3− CD56− CD16+ SSClow |
| CD56+ CD16− NKT cells | CD45+ CD3+ CD56+ CD16− SSClow |
| CD56− CD16+ NKT cells | CD45+ CD3+ CD56− CD16+ SSClow |
| Classical monocytes | CD45+ CD14+ CD16− SSCint |
| Intermediate monocytes | CD45+ CD14+ CD16+ SSCint |
| Non-classical monocytes | CD45+ CD14− CD16+ SSCint |
| CD11b+ activated granulocytes | CD45+ CD11b+ SSChigh |
| CD11b− granulocytes | CD45+ CD11b− SSChigh |
| Immune Subset/ Ratio (% of Parent Population) | Controls a | PCR+Ab− Donors a | PCR+Ab+ Non-Hospitalized CP Donors a | PCR+Ab+ Hospitalized CP Donors a | Active COVID-19 Patients a | p Value b |
|---|---|---|---|---|---|---|
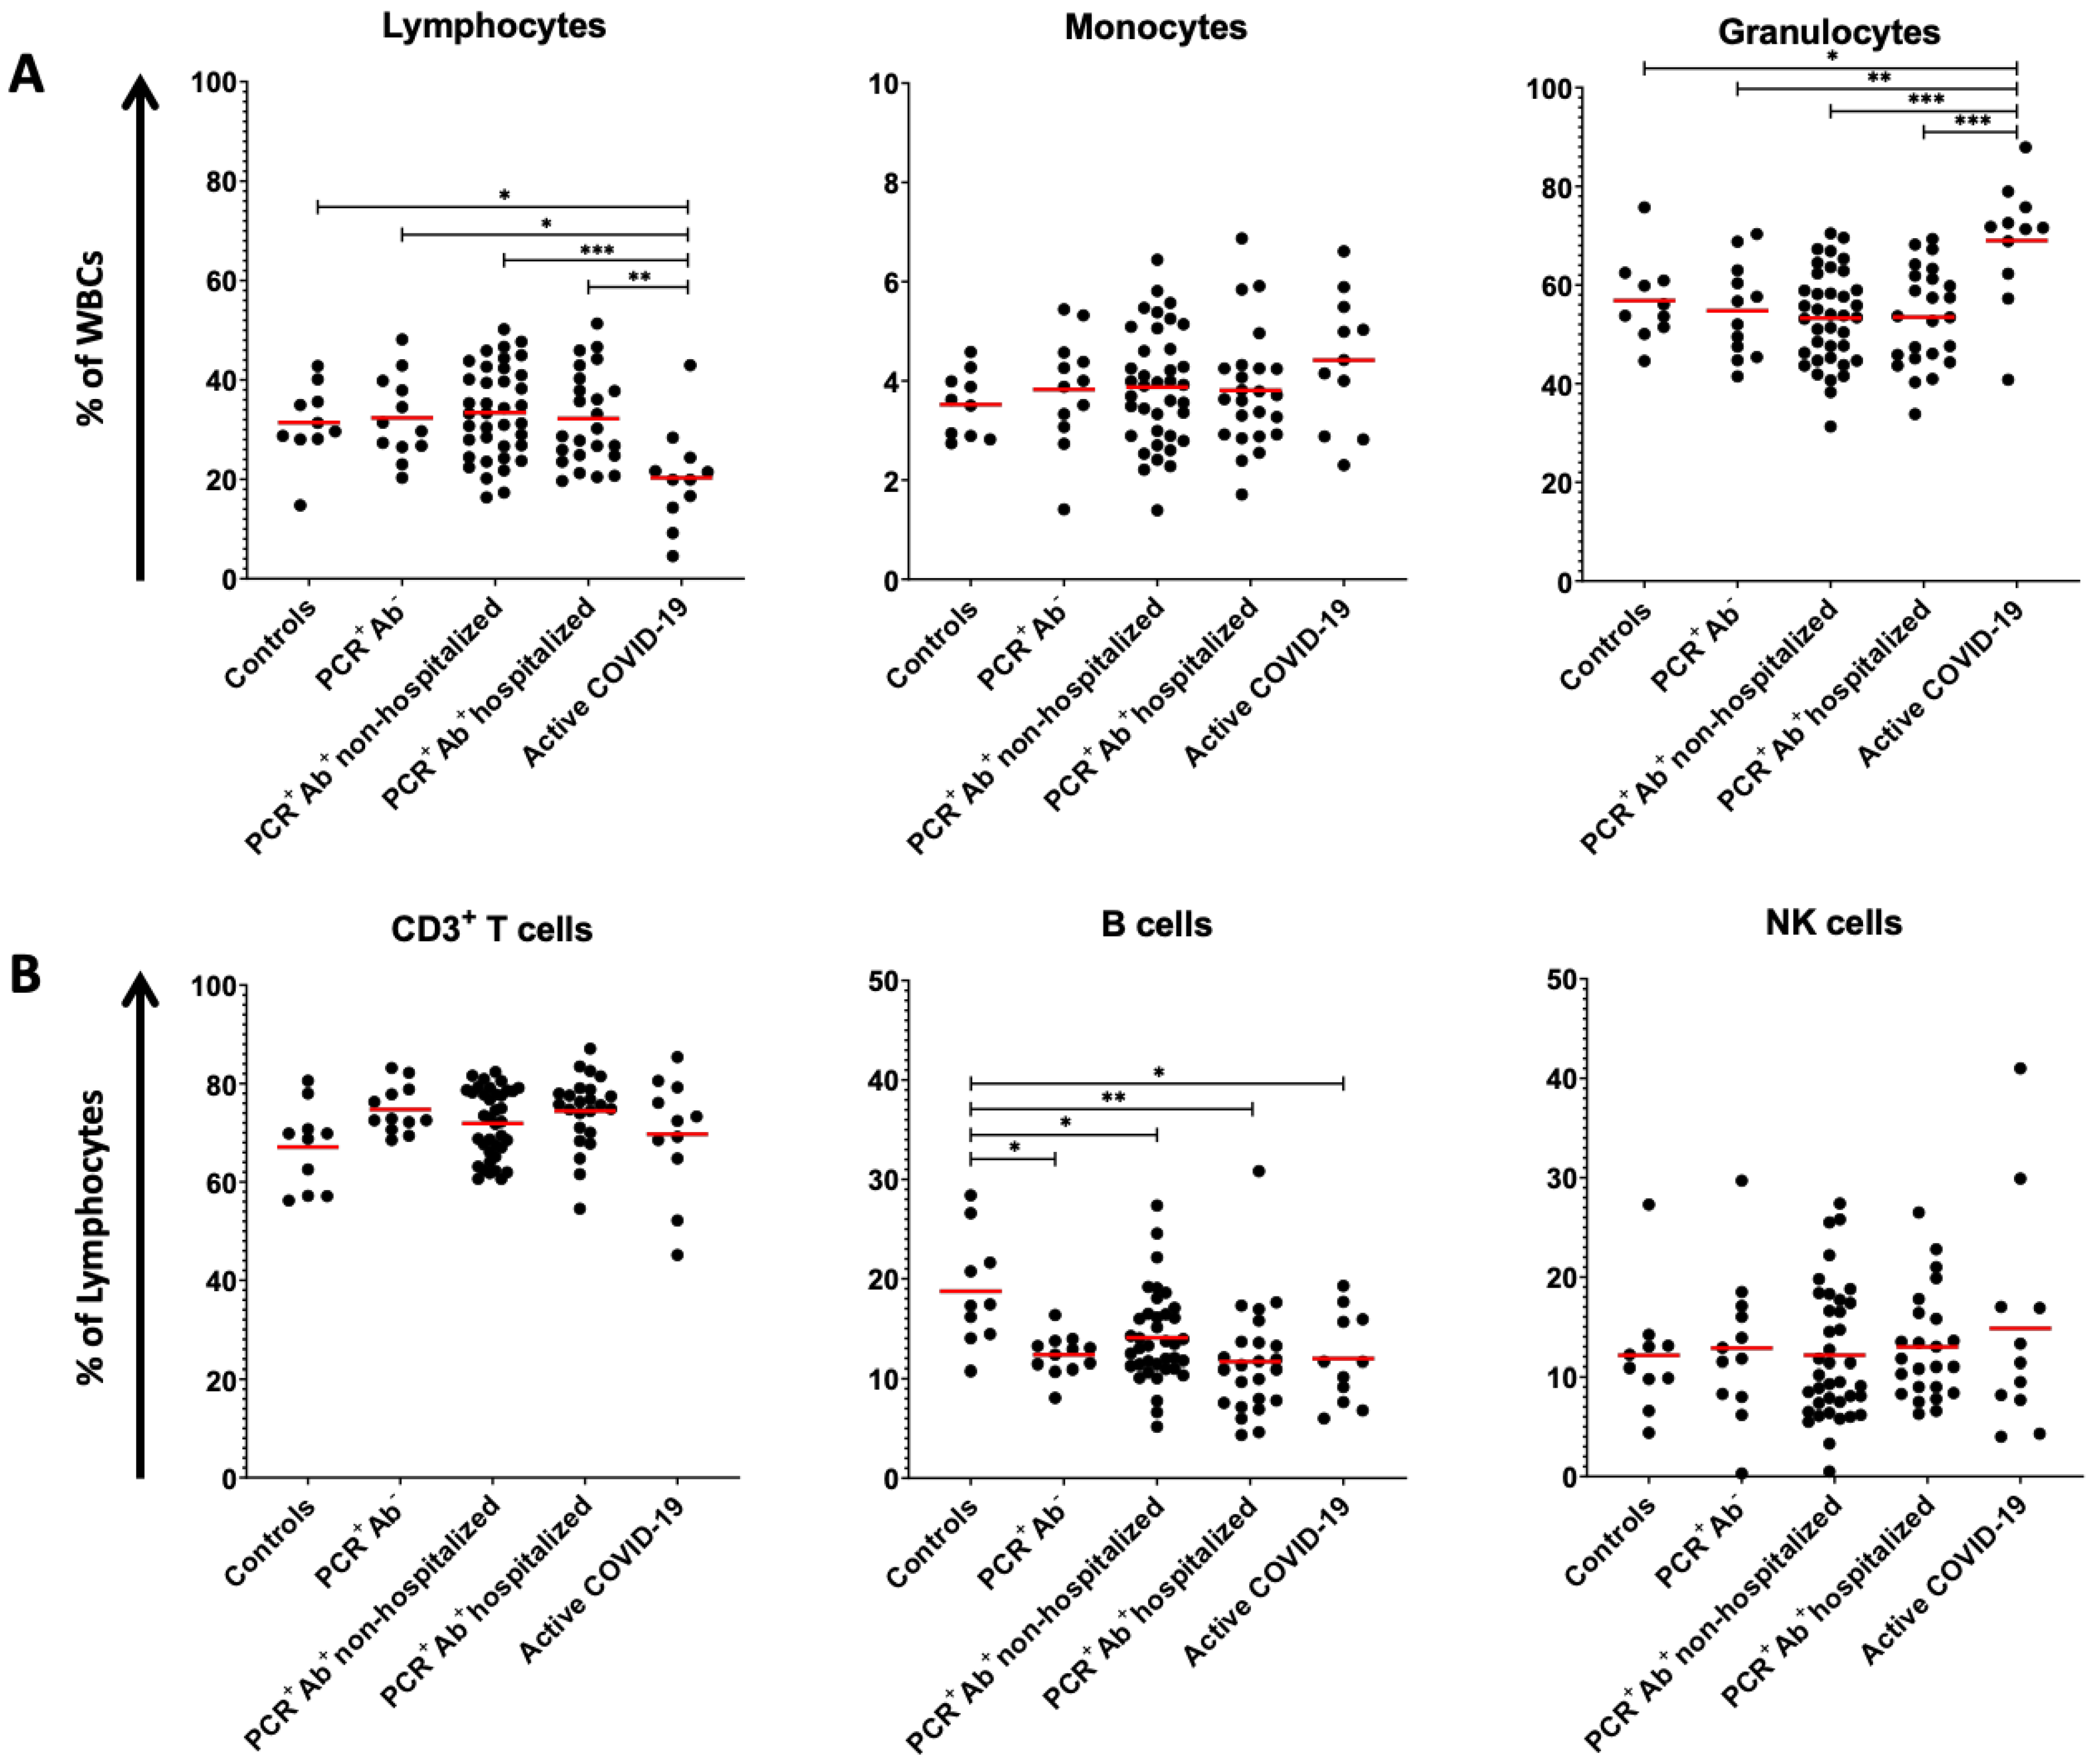
| Lymphocytes (% of WBCs) | 31.41 ± 7.78 ** | 32.35 ± 8.44 ** | 33.40 ± 9.12 ** | 32.21 ± 9.42 ** | 20.31 ± 10.10 * | 0.002 |
| CD3+ T cells (% of lymphocytes) | 67.07 ± 8.61 | 74.73 ± 4.85 | 71.88 ± 6.97 | 74.39 ± 7.24 | 69.69 ± 12.05 | 0.198 |
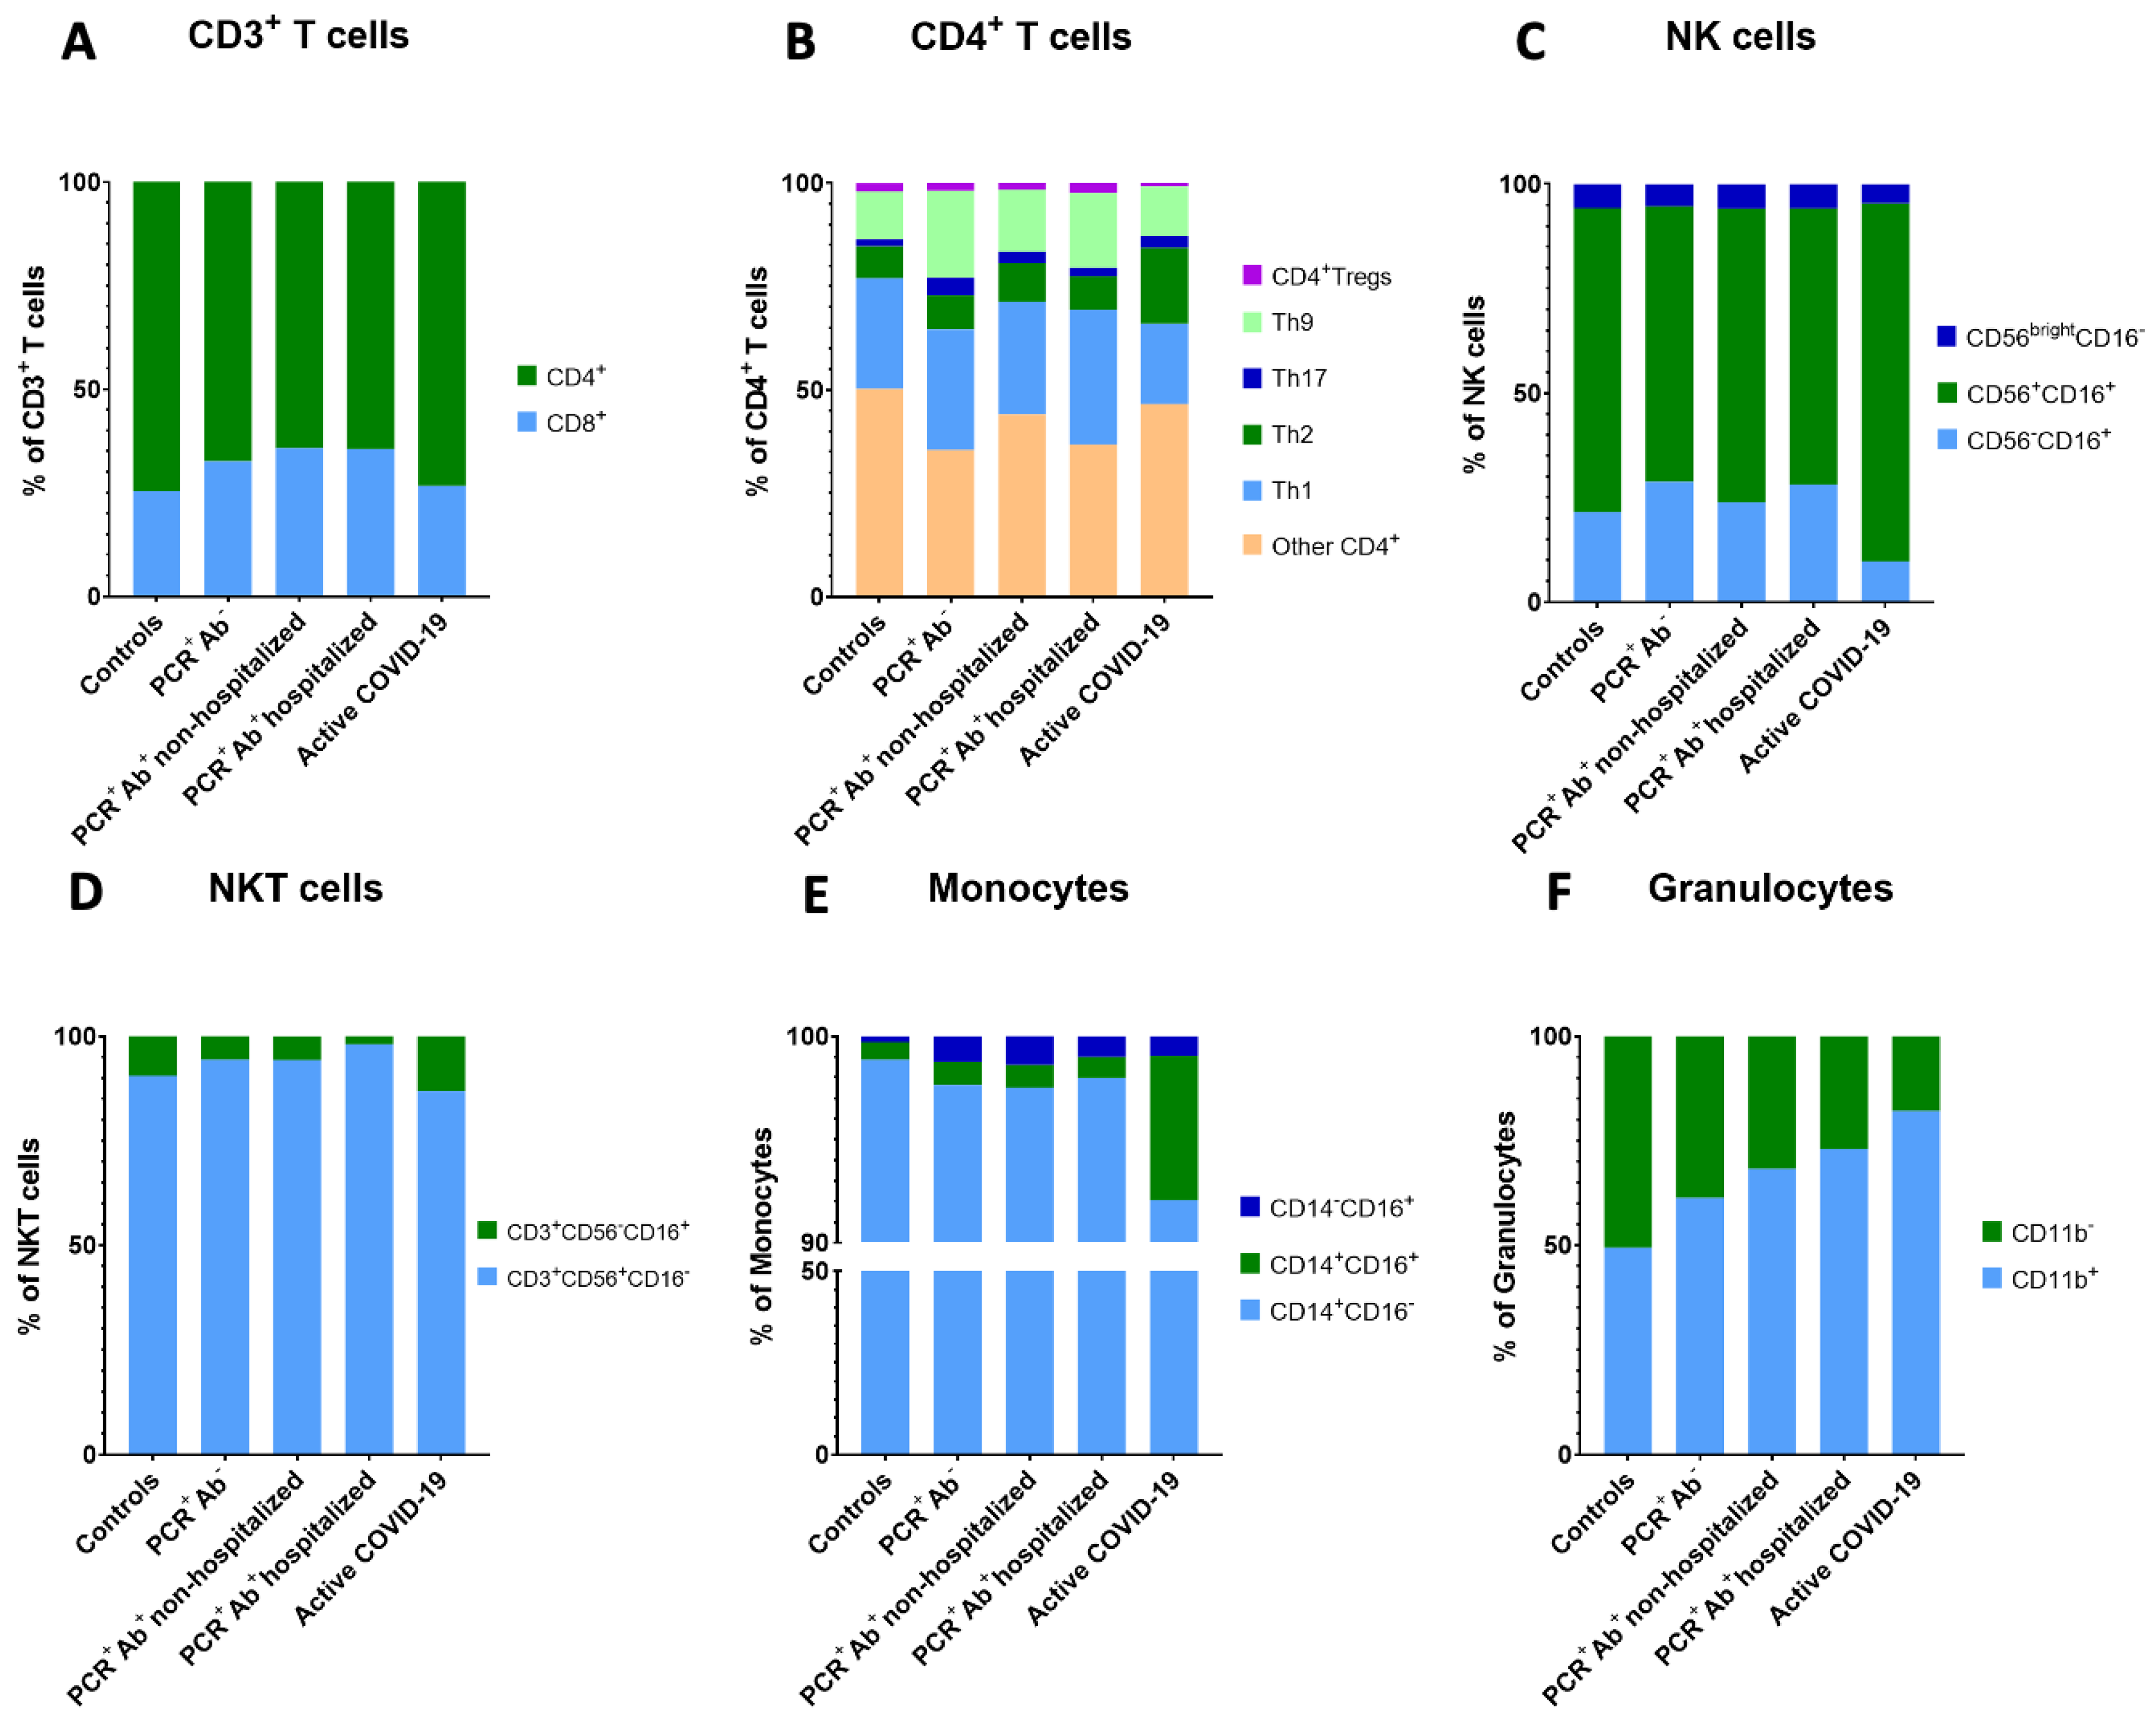
| CD8+ T cells (% of CD3+ T cells) | 24.38 ± 8.51 | 31.02 ± 7.27 | 33.49 ± 10.11 | 33.49± 10.60 | 25.66 ± 11.87 | 0.030 |
| CD8+ Tregs (% of CD8+ T cells) | 7.29 ± 8.24 | 6.07 ± 4.97 | 4.67 ± 6.21 | 2.35 ± 3.13 | 4.23 ± 3.16 | 0.199 |
| CD4+ T cells (% of CD3+ T cells) | 71.36 ± 11.28 ** | 64.11 ± 7.64 | 60.11 ± 10.15 * | 60.75 ± 11.39 | 70.51 ± 13.21 ** | 0.006 |
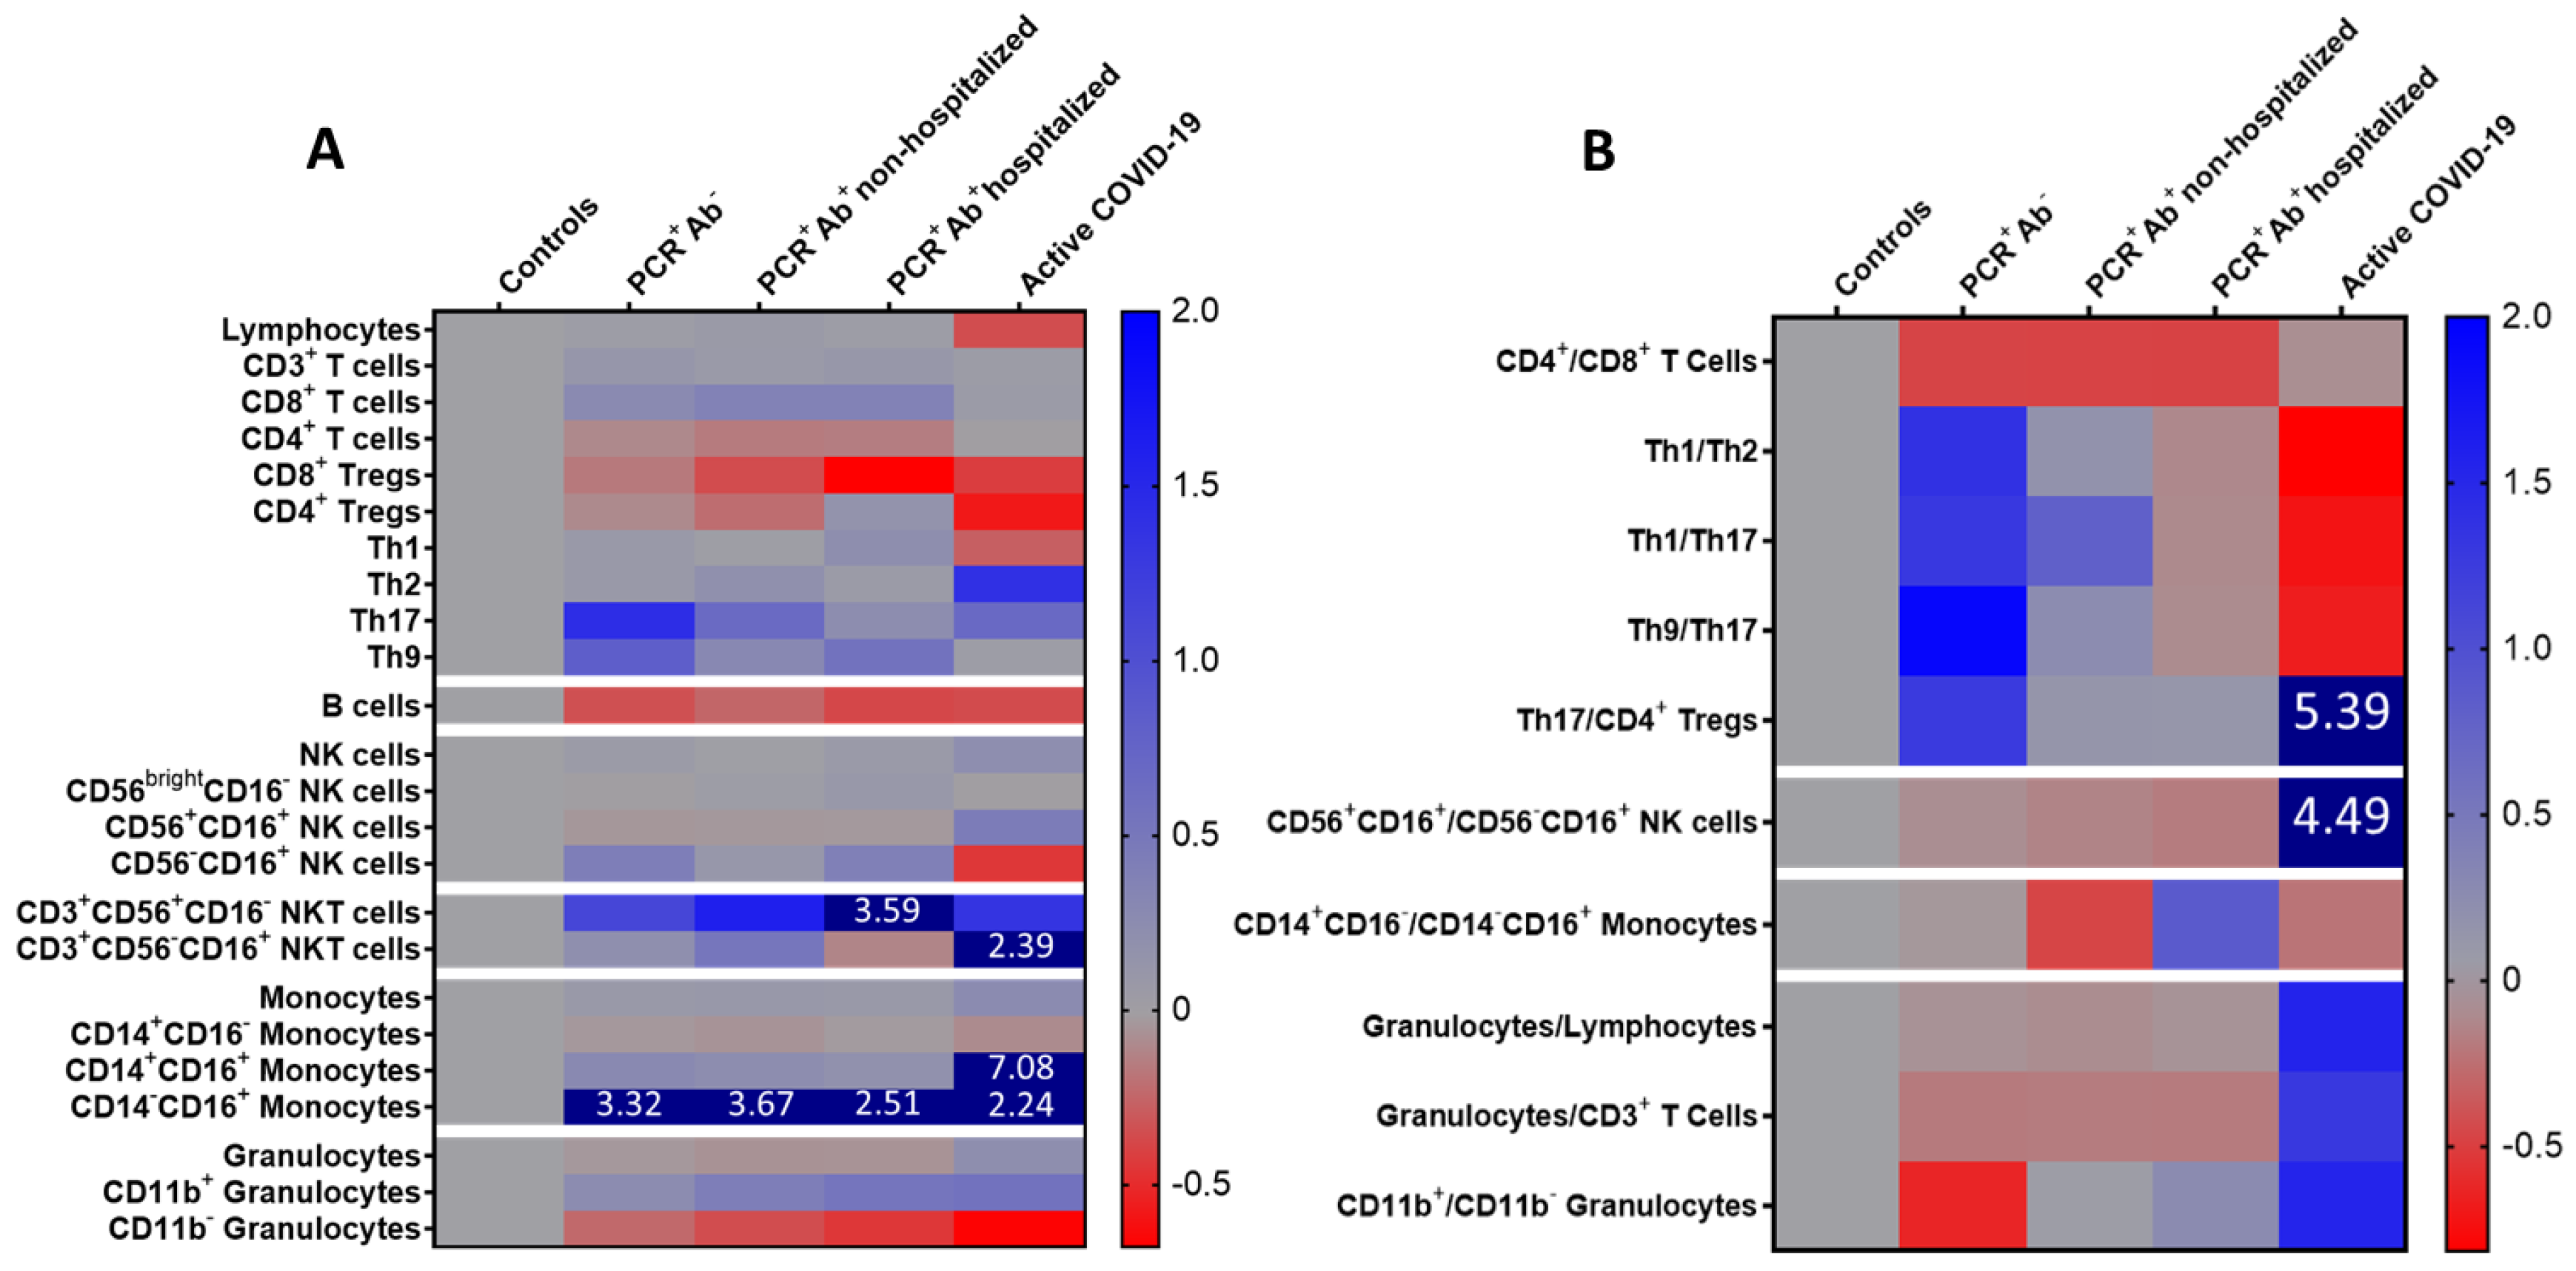
| CD4+ Tregs (% of CD4+ T cells) | 2.05 ± 0.90 ** | 1.84 ± 0.90 | 1.59 ± 0.69 | 2.37 ± 1.30** | 0.86 ± 0.63 * | <0.001 |
| Th1 (% of CD4+ T cells) | 26.77 ± 7.96 | 29.06 ± 8.18 ** | 27.31 ± 7.55 ** | 32.51 ± 8.55 ** | 19.40 ± 5.74* | <0.001 |
| Th2 (% of CD4+ T cells) | 7.67 ± 3.60 ** | 8.27 ± 8.91 ** | 9.16 ± 7.61 ** | 8.07 ± 4.71 ** | 18.32 ± 6.10 * | 0.001 |
| Th17 (% of CD4+ T cells) | 1.73 ± 0.96 | 4.22 ± 6.58 | 2.88 ± 4.58 | 2.14 ± 1.49 | 2.92 ± 2.72 | 0.925 |
| Th9 (% of CD4+ T cells) | 11.57 ± 4.10 | 21.08 ± 12.63 | 15.00 ± 10.53 | 18.10 ± 12.66 | 11.89 ± 8.47 | 0.130 |
| B cells (% of lymphocytes) | 18.74 ± 5.60 * | 12.35 ± 2.06 ** | 14.07 ± 4.56 ** | 11.66 ± 5.60 ** | 11.97 ± 4.55 ** | 0.002 |
| NK cells (% of lymphocytes) | 12.14 ± 6.13 | 12.85 ± 7.35 | 12.15 ± 6.59 | 12.98 ± 5.41 | 14.84 ± 11.34 | 0.930 |
| Immature NK cells (% of NK cells) | 0.69 ± 0.32 | 0.68 ± 0.28 | 0.71 ± 0.62 | 0.75 ± 0.55 | 0.68 ± 0.41 | 0.913 |
| Mature NK cells (% of NK cells) | 8.84 ± 5.05 | 8.47 ± 5.25 | 8.54 ± 5.33 | 8.57 ± 5.00 | 12.71 ± 10.47 | 0.803 |
| Memory-like NK cells (% of NK cells) | 2.61 ± 1.20 | 3.70 ± 3.40 | 2.90 ± 1.38 ** | 3.65 ± 1.66 ** | 1.44 ± 1.66 * | 0.003 |
| CD3+CD56+CD16− NKT cells (% of CD3+ cells) | 1.80 ± 2.05 * | 3.82 ± 2.28 | 4.70 ± 3.71 ** | 8.29 ± 6.53 ** | 4.22 ± 4.68 | <0.001 |
| CD3+CD56-CD16+ NKT cells (% of CD3+ cells) | 0.19 ± 0.13 | 0.23 ± 0.31 | 0.29 ± 0.38 | 0.17 ± 0.18 | 0.64± 1.14 | 0.767 |
| Monocytes (% of WBCs) | 3.52 ± 0.66 | 3.82 ± 1.12 | 3.87 ± 1.16 | 3.81 ± 1.19 | 4.41 ± 1.36 | 0.481 |
| Classical monocytes (% of monocytes) | 95.04 ± 3.14 | 91.63 ± 11.23 | 89.80 ± 13.21 | 92.73 ± 6.00 | 86.25 ± 9.16 | 0.046 |
| Intermediate monocytes (% of monocytes) | 0.81 ± 0.64 ** | 1.04 ± 0.88 ** | 1.00 ± 0.89 ** | 0.96 ± 0.91 ** | 6.57 ± 6.68 * | <0.001 |
| Non-classical monocytes (% of monocytes) | 0.27 ± 0.24 | 1.18 ± 2.40 | 1.28 ± 2.08 | 0.96 ± 1.38 | 0.88 ± 1.30 | 0.189 |
| Granulocytes (% of WBCs) | 56.84 ± 8.56 ** | 54.77 ± 9.55 ** | 53.26 ± 9.48 ** | 53.48 ± 9.89 ** | 69.00 ± 12.30 * | <0.001 |
| CD11b+ Granulocytes (% of granulocytes) | 46.12 ± 34.14 | 57.34 ± 23.56 | 65.53 ± 26.21 | 70.89 ± 19.45 | 72.33 ± 18.24 | 0.156 |
| CD11b− Granulocytes (% of granulocytes) | 47.29 ± 27.52 | 36.13 ± 20.28 | 30.50 ± 24.68 | 26.18 ± 18.71 | 15.74 ± 9.40 | 0.037 |
| CD4+/CD8+ T cells | 4.51 ± 3.66 | 2.20 ± 0.66 | 2.17 ± 1.67 | 2.16 ± 12.14 | 3.77 ± 2.71 | 0.025 |
| Th1/Th2 | 6.46 ± 9.38 ** | 15.39 ± 20.67 ** | 7.55 ± 11.08 ** | 5.67 ± 4.10 ** | 1.19 ± 0.53 * | <0.001 |
| Th1/Th17 | 41.54 ± 72.48 | 95.54 ± 138.30 | 74.65 ± 168.90 | 36.77 ± 49.67 | 11.63 ± 7.87 | 0.324 |
| Th9/Th17 | 14.33 ± 20.89 | 41.82 ± 61.57 ** | 17.87 ± 30.10** | 12.83 ± 11.00 ** | 4.72 ± 1.38 * | 0.020 |
| Th17/CD4+ Tregs | 1.42 ± 1.54 | 3.23 ± 4.11 | 1.61 ± 1.84 | 1.59 ± 2.37 | 9.09 ± 19.41 | 0.070 |
| Mature/memory-like NK cells | 3.55 ± 1.35 | 3.21 ± 2.86 ** | 3.03 ± 1.80 ** | 2.89 ± 2.22 ** | 19.47 ± 30.79 * | <0.001 |
| Classical/non-classical monocytes | 594.1 ± 395.4 | 567.5 ± 909.5 | 315.7 ± 354.1 | 1113.0± 2724.1 | 458.6 ± 552.7 | 0.199 |
| Granulocytes/lymphocytes | 2.02 ± 1.15 | 1.87 ± 0.79 | 1.82 ± 0.88 ** | 1.88 ± 0.84 ** | 5.16 ± 5.09 * | 0.007 |
| Granulocytes/CD3+ T cells | 3.14 ± 2.20 | 2.53 ± 1.13 ** | 2.56 ± 1.30 ** | 2.54 ± 1.17 ** | 7.19 ± 5.88 * | 0.006 |
| CD11b+/CD11b− granulocytes | 6.40 ± 13.18 | 2.36 ± 1.73 | 6.63 ± 8.08 | 8.03 ± 14.83 | 16.26 ± 35.84 | 0.053 |
Publisher’s Note: MDPI stays neutral with regard to jurisdictional claims in published maps and institutional affiliations. |
© 2020 by the authors. Licensee MDPI, Basel, Switzerland. This article is an open access article distributed under the terms and conditions of the Creative Commons Attribution (CC BY) license (http://creativecommons.org/licenses/by/4.0/).
Share and Cite
Orologas-Stavrou, N.; Politou, M.; Rousakis, P.; Kostopoulos, I.V.; Ntanasis-Stathopoulos, I.; Jahaj, E.; Tsiligkeridou, E.; Gavriatopoulou, M.; Kastritis, E.; Kotanidou, A.; et al. Peripheral Blood Immune Profiling of Convalescent Plasma Donors Reveals Alterations in Specific Immune Subpopulations Even at 2 Months Post SARS-CoV-2 Infection. Viruses 2021, 13, 26. https://doi.org/10.3390/v13010026
Orologas-Stavrou N, Politou M, Rousakis P, Kostopoulos IV, Ntanasis-Stathopoulos I, Jahaj E, Tsiligkeridou E, Gavriatopoulou M, Kastritis E, Kotanidou A, et al. Peripheral Blood Immune Profiling of Convalescent Plasma Donors Reveals Alterations in Specific Immune Subpopulations Even at 2 Months Post SARS-CoV-2 Infection. Viruses. 2021; 13(1):26. https://doi.org/10.3390/v13010026
Chicago/Turabian StyleOrologas-Stavrou, Nikolaos, Marianna Politou, Pantelis Rousakis, Ioannis V. Kostopoulos, Ioannis Ntanasis-Stathopoulos, Edison Jahaj, Eleni Tsiligkeridou, Maria Gavriatopoulou, Efstathios Kastritis, Anastasia Kotanidou, and et al. 2021. "Peripheral Blood Immune Profiling of Convalescent Plasma Donors Reveals Alterations in Specific Immune Subpopulations Even at 2 Months Post SARS-CoV-2 Infection" Viruses 13, no. 1: 26. https://doi.org/10.3390/v13010026
APA StyleOrologas-Stavrou, N., Politou, M., Rousakis, P., Kostopoulos, I. V., Ntanasis-Stathopoulos, I., Jahaj, E., Tsiligkeridou, E., Gavriatopoulou, M., Kastritis, E., Kotanidou, A., Dimopoulos, M.-A., Tsitsilonis, O. E., & Terpos, E. (2021). Peripheral Blood Immune Profiling of Convalescent Plasma Donors Reveals Alterations in Specific Immune Subpopulations Even at 2 Months Post SARS-CoV-2 Infection. Viruses, 13(1), 26. https://doi.org/10.3390/v13010026