Base-By-Base Version 3: New Comparative Tools for Large Virus Genomes

 ,
,
Abstract

1. Introduction
- Java code; uses Java Web Start to launch and automate updating of BBB for users;
- Integration with the VBRC’s viral genome database (viral orthologous clusters; VOCs);
- Alignment of sequences or subsequences (MUSCLE, ClustalW, MAFFT);
- MSA editing, with intuitive highlighting of differences between sequences;
- Applicability to gene, protein, and virus genome sequences;
- Ability to edit individual sequences;
- Intuitive graphical user interface (GUI) with ability to view sequence residues or full sequence summaries;
- Display of 6-reading frames; understands and links to gene location (data from GenBank files);
- Multiple methods to annotate sequences and MSAs, treating the BBB file as a “results notebook”.
2. Materials and Methods
3. Results
3.1. CODEHOP Integration
3.2. Sequence Characteristics
3.3. Counting Nucleotides Associated with Specific Sequences in MSAs
3.4. Manipulation of Sequences
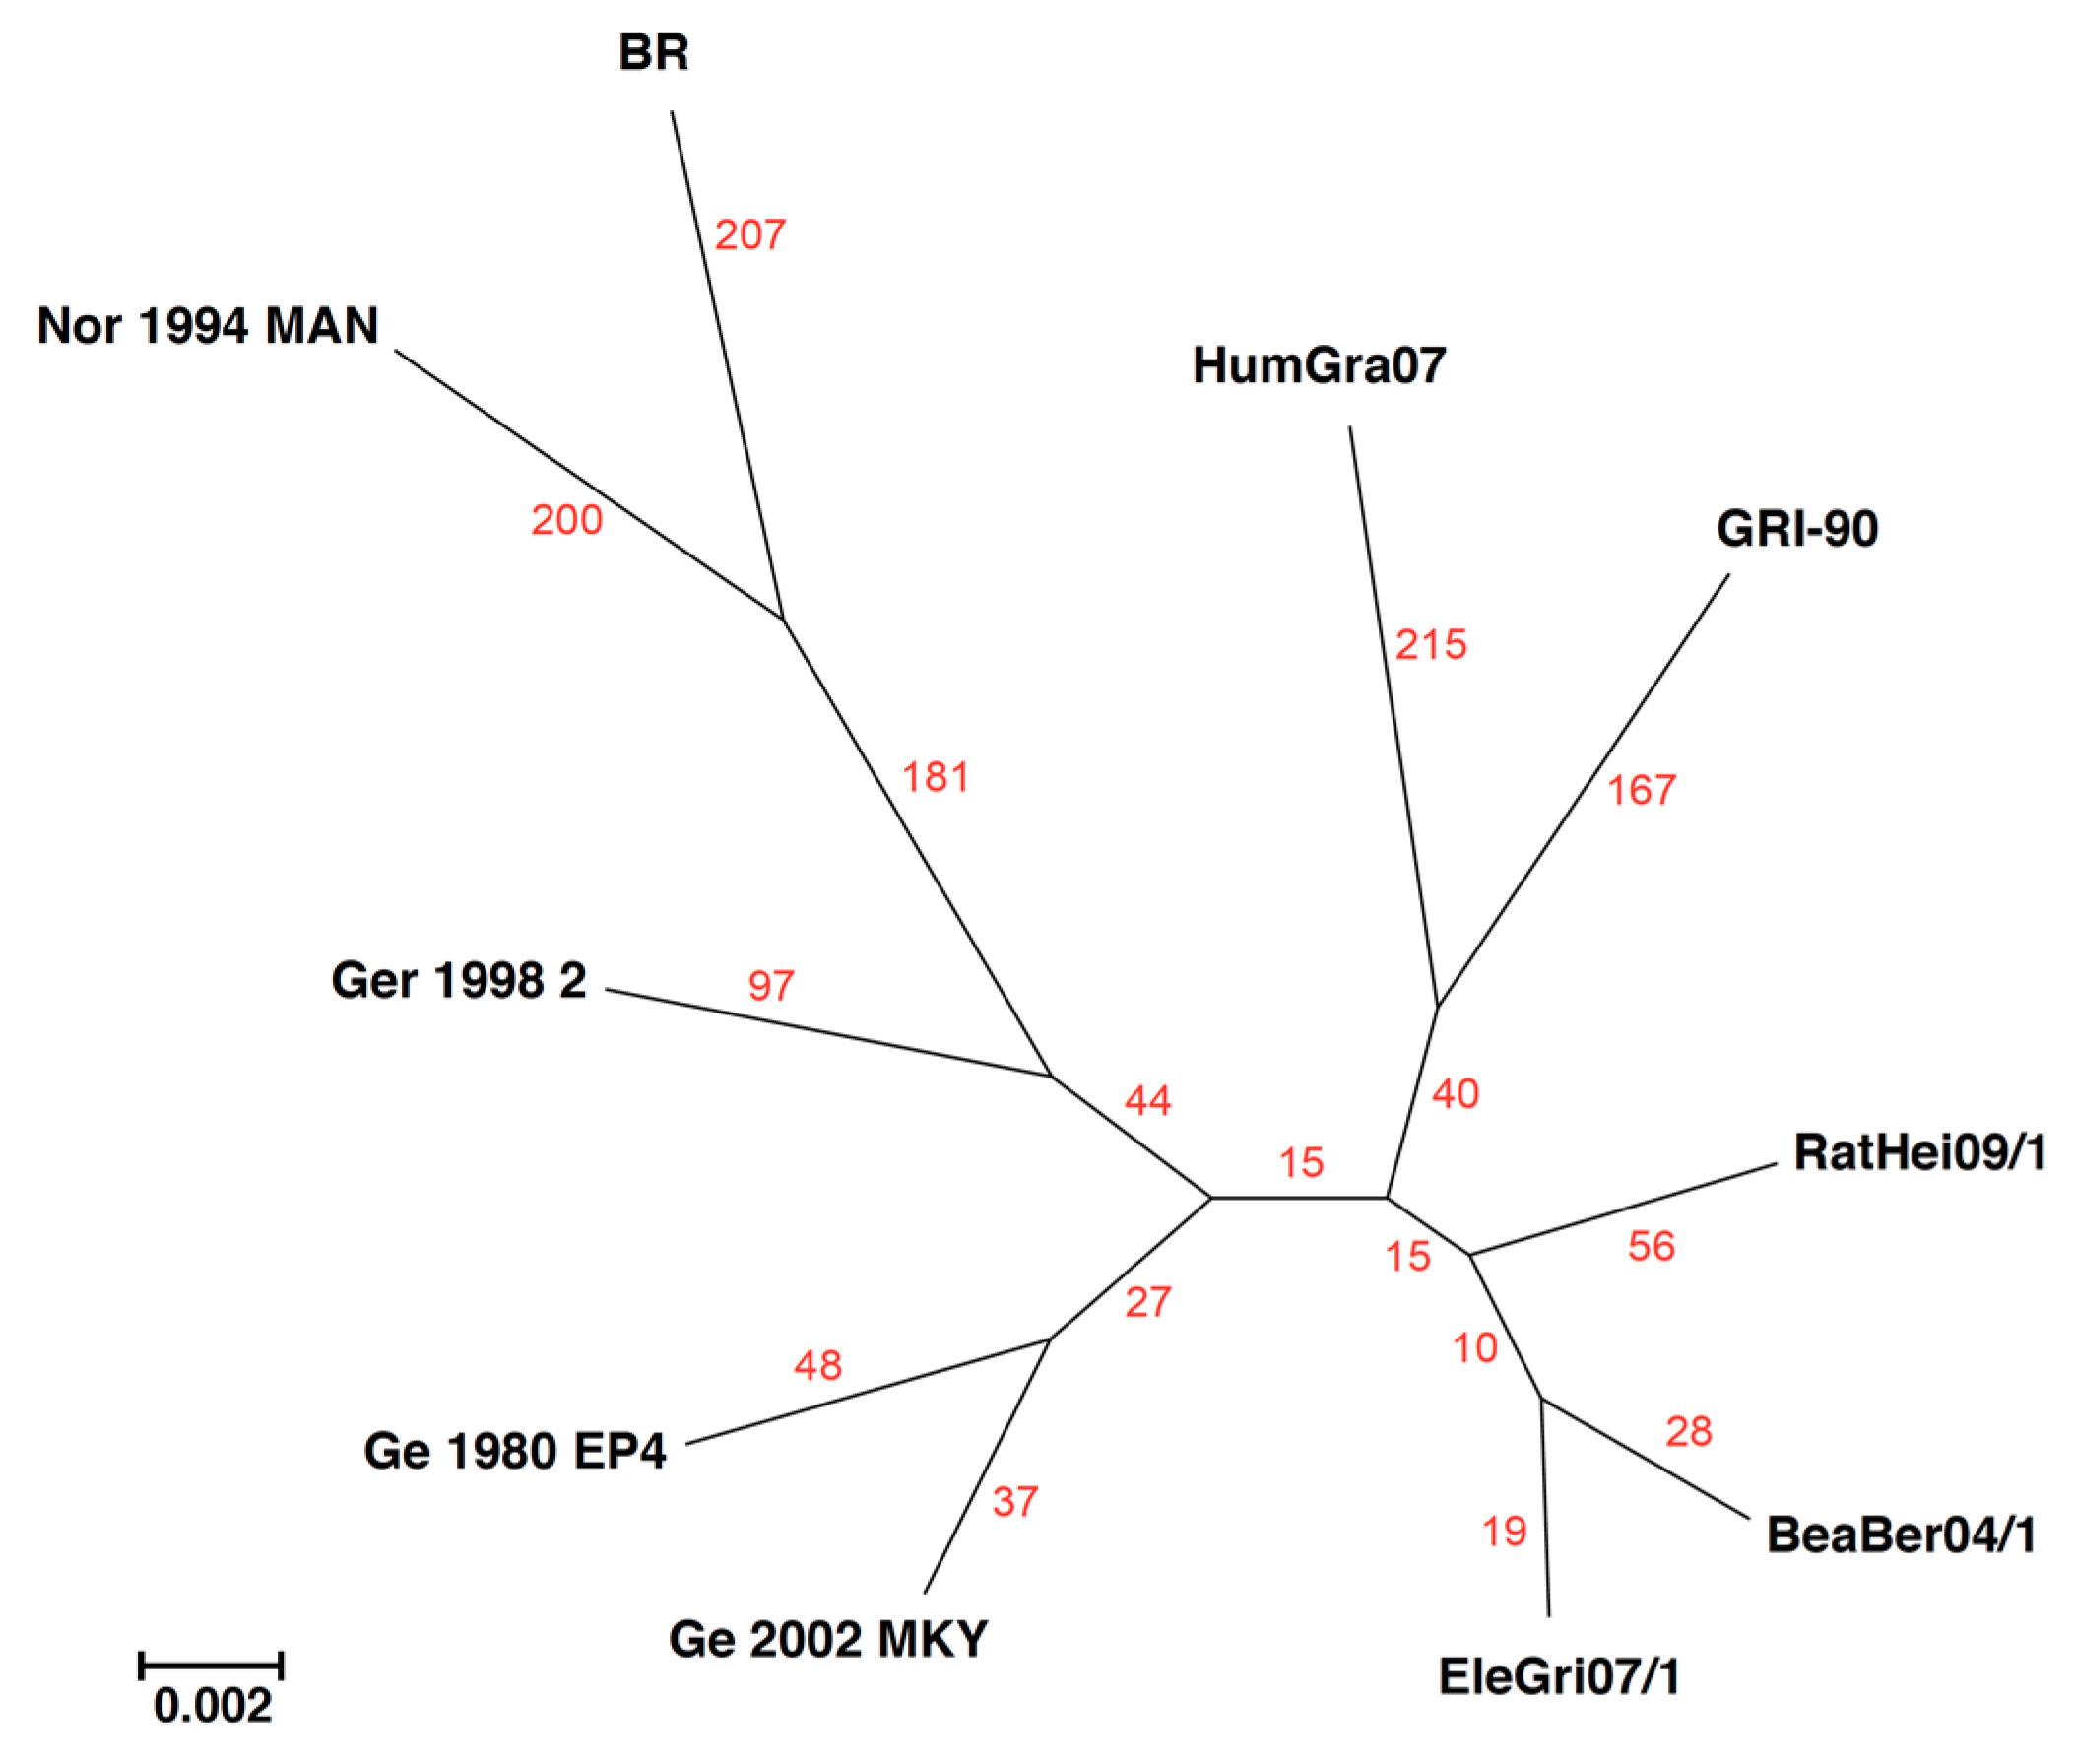
3.5. Alignment of Sequences
4. Discussion
Author Contributions
Funding
Acknowledgments
Conflicts of Interest
References
- Brodie, R.; Smith, A.J.; Roper, R.L.; Tcherepanov, V.; Upton, C. Base-By-Base: Single nucleotide-level analysis of whole viral genome alignments. BMC Bioinform. 2004, 5, 96–99. [Google Scholar] [CrossRef] [PubMed]
- Hillary, W.; Lin, S.-H.; Upton, C. Base-By-Base version 2: Single nucleotide-level analysis of whole viral genome alignments. Microb. Inform. Exp. 2011, 1, 2. [Google Scholar] [CrossRef] [PubMed]
- Stamatakis, A. RAxML version 8: A tool for phylogenetic analysis and post-analysis of large phylogenies. Bioinformatics 2014, 30, 1312–1313. [Google Scholar] [CrossRef] [PubMed]
- Rose, T.M.; Schultz, E.R.; Henikoff, J.G.; Pietrokovski, S.; McCallum, C.M.; Henikoff, S. Consensus-degenerate hybrid oligonucleotide primers for amplification of distantly related sequences. Nucleic Acids Res. 1998, 26, 1628–1635. [Google Scholar] [CrossRef] [PubMed]
- Nix, W.A.; Oberste, M.S.; Pallansch, M.A. Sensitive, Seminested PCR Amplification of VP1 Sequences for Direct Identification of All Enterovirus Serotypes from Original Clinical Specimens. J. Clin. Microbiol. 2006, 44, 2698–2704. [Google Scholar] [CrossRef] [PubMed]
- Van Devanter, D.R.; Warrener, P.; Bennett, L.; Schultz, E.R.; Coulter, S.; Garber, R.L.; Rose, T.M. Detection and analysis of diverse herpesviral species by consensus primer PCR. J. Clin. Microbiol. 1996, 34, 1666–1671. [Google Scholar]
- Børsting, C.; Hummel, R.; Schultz, E.R.; Rose, T.M.; Pedersen, M.B.; Knudsen, J.; Kristiansen, K. Saccharomyces carlsbergensis contains two functional genes encoding the acyl-CoA binding protein, one similar to the ACB1 gene from S. cerevisiae and one identical to the ACB1 gene from S. monacensis. Yeast 1997, 13, 1409–1421. [Google Scholar] [CrossRef]
- Wilson, C.A.; Wong, S.; Muller, J.; Davidson, C.E.; Rose, T.M.; Burd, P. Type C retrovirus released from porcine primary peripheral blood mononuclear cells infects human cells. J. Virol. 1998, 72, 3082–3087. [Google Scholar] [PubMed]
- Rose, T.M. CODEHOP-mediated PCR—A powerful technique for the identification and characterization of viral genomes. Virol. J. 2005, 2, 20. [Google Scholar] [CrossRef] [PubMed]
- Philipp-Staheli, J.; Marquardt, T.; Thouless, M.E.; Bruce, A.G.; Grant, R.F.; Tsai, C.-C.; Rose, T.M. Genetic variability of the envelope gene of Type D simian retrovirus-2 (SRV-2) subtypes associated with SAIDS-related retroperitoneal fibromatosis in different macaque species. Virol. J. 2006, 3, 11. [Google Scholar] [CrossRef] [PubMed]
- Staheli, J.P.; Boyce, R.; Kovarik, D.; Rose, T.M. CODEHOP PCR and CODEHOP PCR primer design. Methods Mol. Biol. 2011, 687, 57–73. [Google Scholar] [PubMed]
- Chouhy, D.; Kocjan, B.J.; Staheli, J.P.; Bolatti, E.M.; Hošnjak, L.; Sagadin, M.; Giri, A.A.; Rose, T.M.; Poljak, M. Detection of novel Betapapillomaviruses and Gammapapillomaviruses in eyebrow hair follicles using a single-tube “hanging droplet” PCR assay with modified pan-PV CODEHOP primers. J. Gen. Virol. 2018, 99, 109–118. [Google Scholar] [CrossRef] [PubMed]
- Rose, T.M.; Henikoff, J.G.; Henikoff, S. CODEHOP (COnsensus-DEgenerate Hybrid Oligonucleotide Primer) PCR primer design. Nucleic Acids Res. 2003, 31, 3763–3766. [Google Scholar] [CrossRef] [PubMed]
- Boyce, R.; Chilana, P.; Rose, T.M. iCODEHOP: A new interactive program for designing COnsensus-DEgenerate Hybrid Oligonucleotide Primers from multiply aligned protein sequences. Nucleic Acids Res. 2009, 37, W222–W228. [Google Scholar] [CrossRef] [PubMed]
- Altschul, S.F.; Gish, W.; Miller, W.; Myers, E.W.; Lipman, D.J. Basic local alignment search tool. J. Mol. Biol. 1990, 215, 403–410. [Google Scholar] [CrossRef]
- Brodie, R.; Roper, R.L.; Upton, C. JDotter: A Java interface to multiple dotplots generated by dotter. Bioinformatics 2004, 20, 279–281. [Google Scholar] [CrossRef] [PubMed]
- Sievers, F.; Higgins, D.G. Clustal Omega, Accurate Alignment of Very Large Numbers of Sequences. In Multiple Sequence Alignment Methods; Methods in Molecular Biology; Humana Press: Totowa, NJ, USA, 2013; Volume 1079, pp. 105–116. [Google Scholar]
- Edgar, R.C. MUSCLE: Multiple sequence alignment with high accuracy and high throughput. Nucleic Acids Res. 2004, 32, 1792–1797. [Google Scholar] [CrossRef] [PubMed]
- Katoh, K.; Standley, D.M. MAFFT Multiple Sequence Alignment Software Version 7: Improvements in Performance and Usability. Mol. Biol. Evol. 2013, 30, 772–780. [Google Scholar] [CrossRef] [PubMed]
- Kazutaka Katoh, M.C.F. Adding unaligned sequences into an existing alignment using MAFFT and LAST. Bioinformatics 2012, 28, 3144–3146. [Google Scholar] [CrossRef] [PubMed]
- Waterhouse, A.M.; Procter, J.B.; Martin, D.M.A.; Clamp, M.; Barton, G.J. Jalview Version 2—A multiple sequence alignment editor and analysis workbench. Bioinformatics 2009, 25, 1189–1191. [Google Scholar] [CrossRef] [PubMed]
- Pervez, M.T.; Babar, M.E.; Nadeem, A.; Aslam, N.; Naveed, N.; Ahmad, S.; Muhammad, S.; Qadri, S.; Shahid, M.; Hussain, T.; et al. IVisTMSA: Interactive Visual Tools for Multiple Sequence Alignments. Evol. Bioinform. Online 2015, 11, 35–42. [Google Scholar] [CrossRef] [PubMed]
- Larsson, A. AliView: A fast and lightweight alignment viewer and editor for large datasets. Bioinformatics 2014, 30, 3276–3278. [Google Scholar] [CrossRef] [PubMed]


| +BeaBer04/1 |
| 22,518, 22,519, 22,583 |
| 31,870 |
| +RatHei09/1 |
| 4677, 4679 |
| 4886, 4896, 4899, 4917 |
| 9401 |
| 16,480 |
| 19,731 |
| 31,573 |
| 35,003 |
| 40,781 |
| +Ge 1980 EP4 |
| 1204 |
| 10,615, 10,618 |
| 10,731, 10,747 |
| 14,442, 14,457, 14,460, 14,553, 14,574, 14,664, 14,667 |
| 15,071, 15,072, 15,076, 15,138, 15,161, 15,163, 15,171 |
| 19,409 |
| 25,381 |
| 30,528, 30,534, 30,547, 30,549, 30,556 |
| 32,797, 32,799 |
| 35,713, 35,758, 35,812 |
| 36,217 |
| 41,120 |
| +Ge 2002 MKY, |
| 19,510 |
| 47,392 |
© 2018 by the authors. Licensee MDPI, Basel, Switzerland. This article is an open access article distributed under the terms and conditions of the Creative Commons Attribution (CC BY) license (http://creativecommons.org/licenses/by/4.0/).
Share and Cite
Tu, S.-L.; Staheli, J.P.; McClay, C.; McLeod, K.; Rose, T.M.; Upton, C. Base-By-Base Version 3: New Comparative Tools for Large Virus Genomes. Viruses 2018, 10, 637. https://doi.org/10.3390/v10110637
Tu S-L, Staheli JP, McClay C, McLeod K, Rose TM, Upton C. Base-By-Base Version 3: New Comparative Tools for Large Virus Genomes. Viruses. 2018; 10(11):637. https://doi.org/10.3390/v10110637
Chicago/Turabian StyleTu, Shin-Lin, Jeannette P. Staheli, Colum McClay, Kathleen McLeod, Timothy M. Rose, and Chris Upton. 2018. "Base-By-Base Version 3: New Comparative Tools for Large Virus Genomes" Viruses 10, no. 11: 637. https://doi.org/10.3390/v10110637
APA StyleTu, S.-L., Staheli, J. P., McClay, C., McLeod, K., Rose, T. M., & Upton, C. (2018). Base-By-Base Version 3: New Comparative Tools for Large Virus Genomes. Viruses, 10(11), 637. https://doi.org/10.3390/v10110637