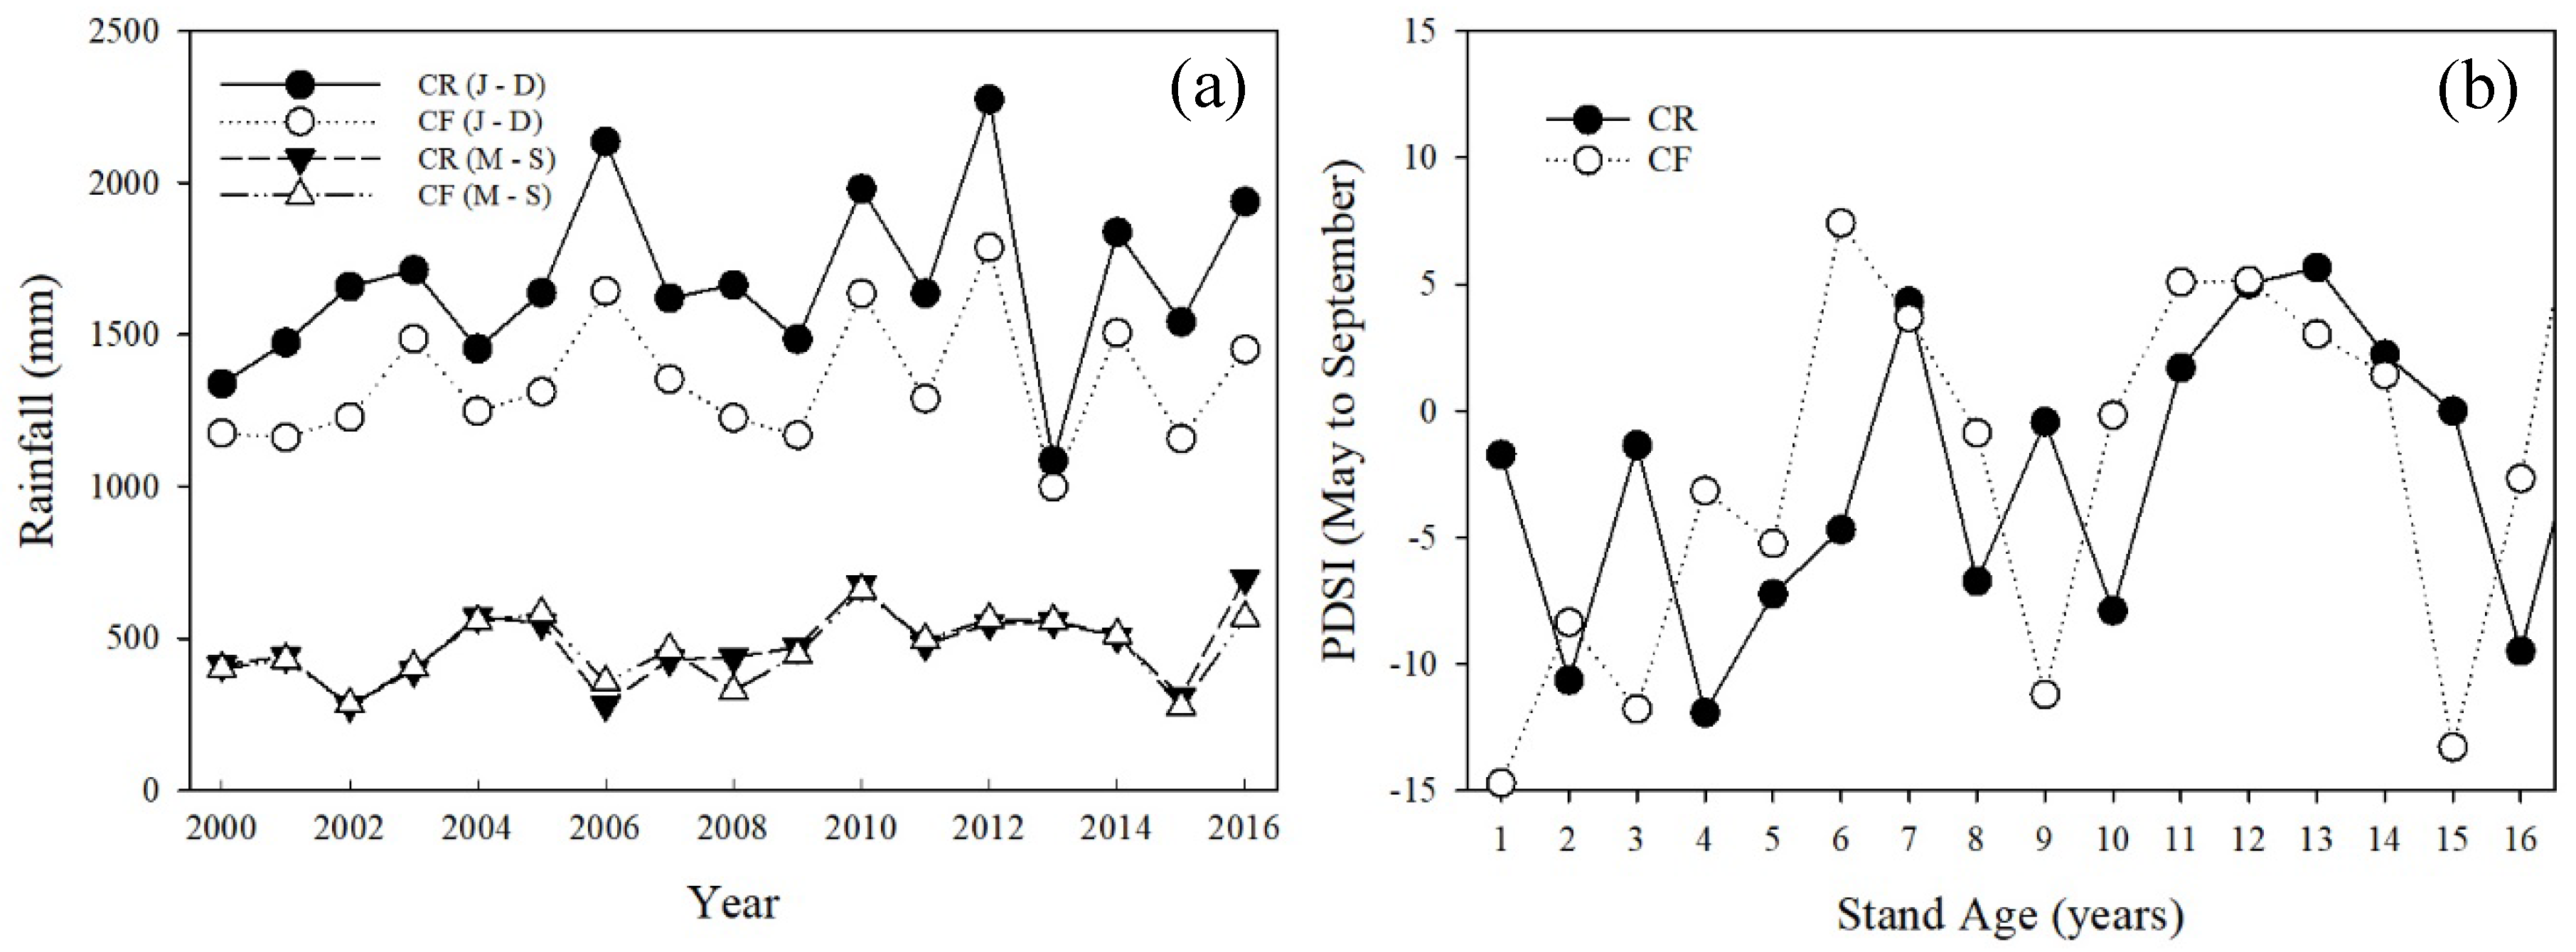
Figure 1.
(a) Rainfall during the whole year (J–D; circles) and growing season (M–S; triangles) and (b) Palmer Drought Severity Index (PDSI) from growing season 1 to 16, for the study sites located in the central Coast Range (CR; filled symbol) and the Cascade foothills (CF; open symbol) of western Oregon.
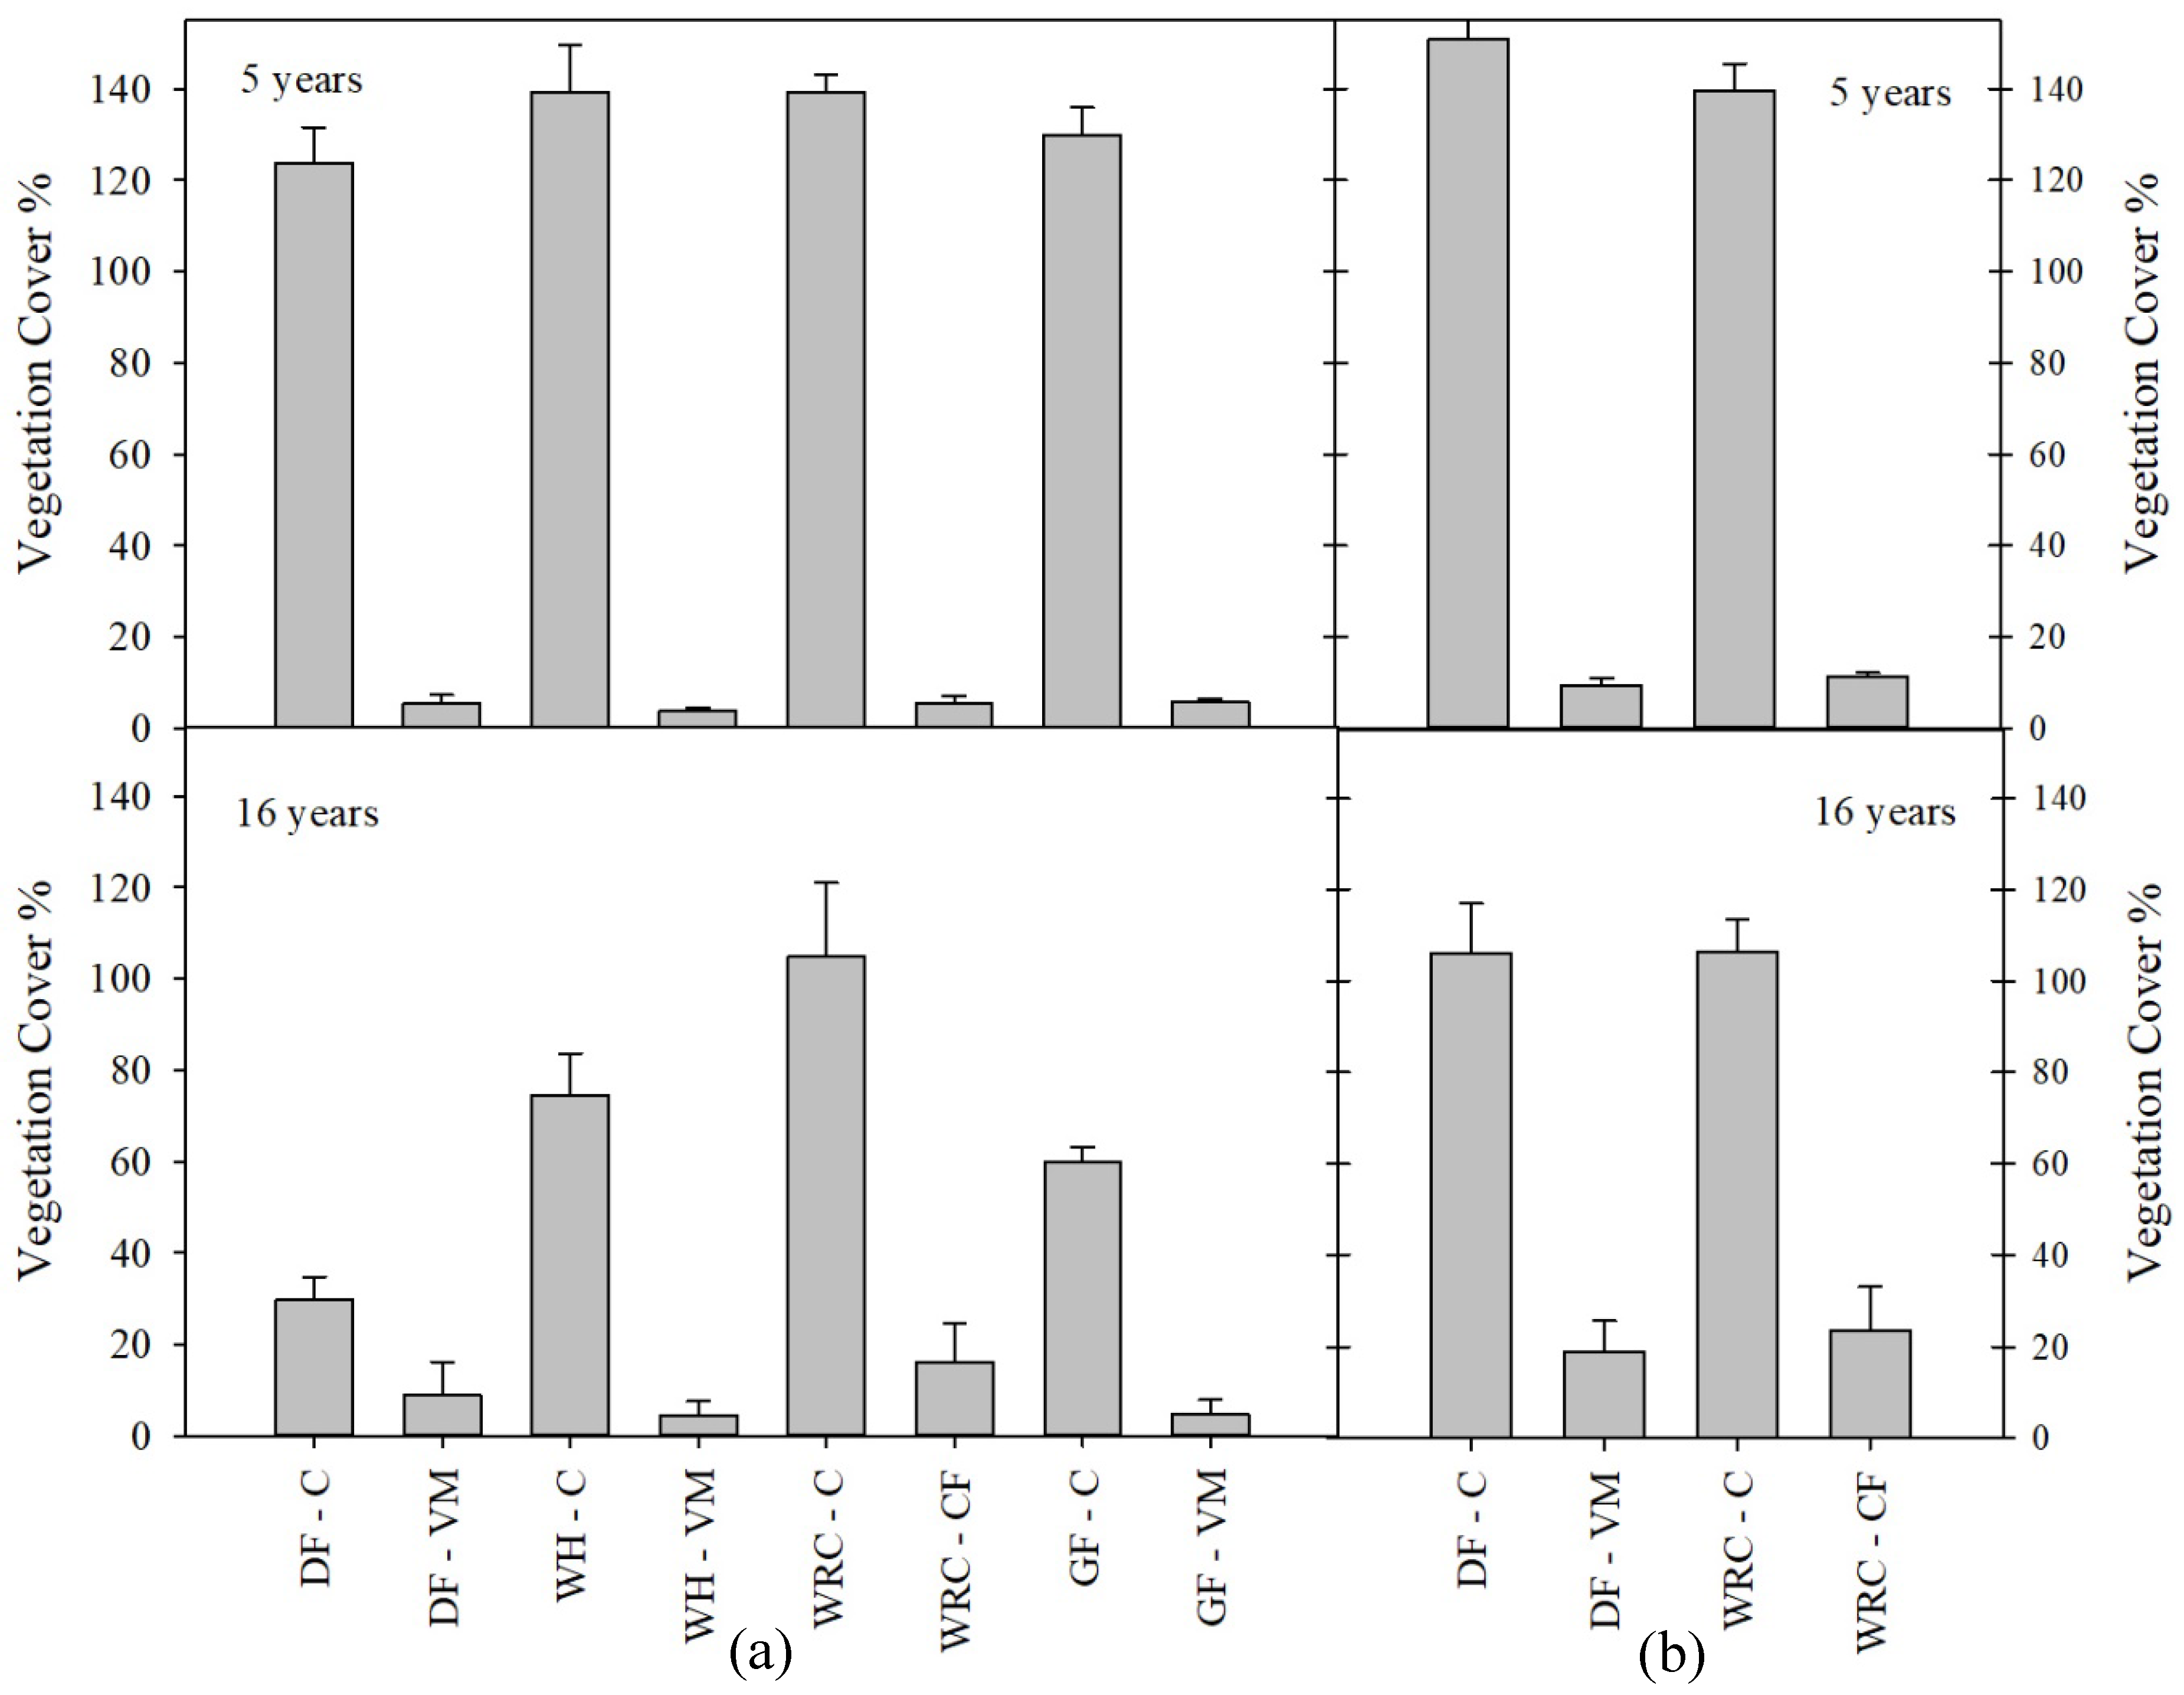
Figure 2.
Summed percent cover (%) of each species of competing vegetation on plots with no post-planting vegetation control (C) and plots with sustained vegetation control for the first 5 years post planting (vegetation management, (VM)) at ages 5 and 16 for Douglas-fir (DF), grand fir (GF), western hemlock (WH) and western redcedar (WRC) stands growing on sites located in the central Coast Range (a) and the Cascade foothills (b) of western Oregon. Error bars represent standard error.
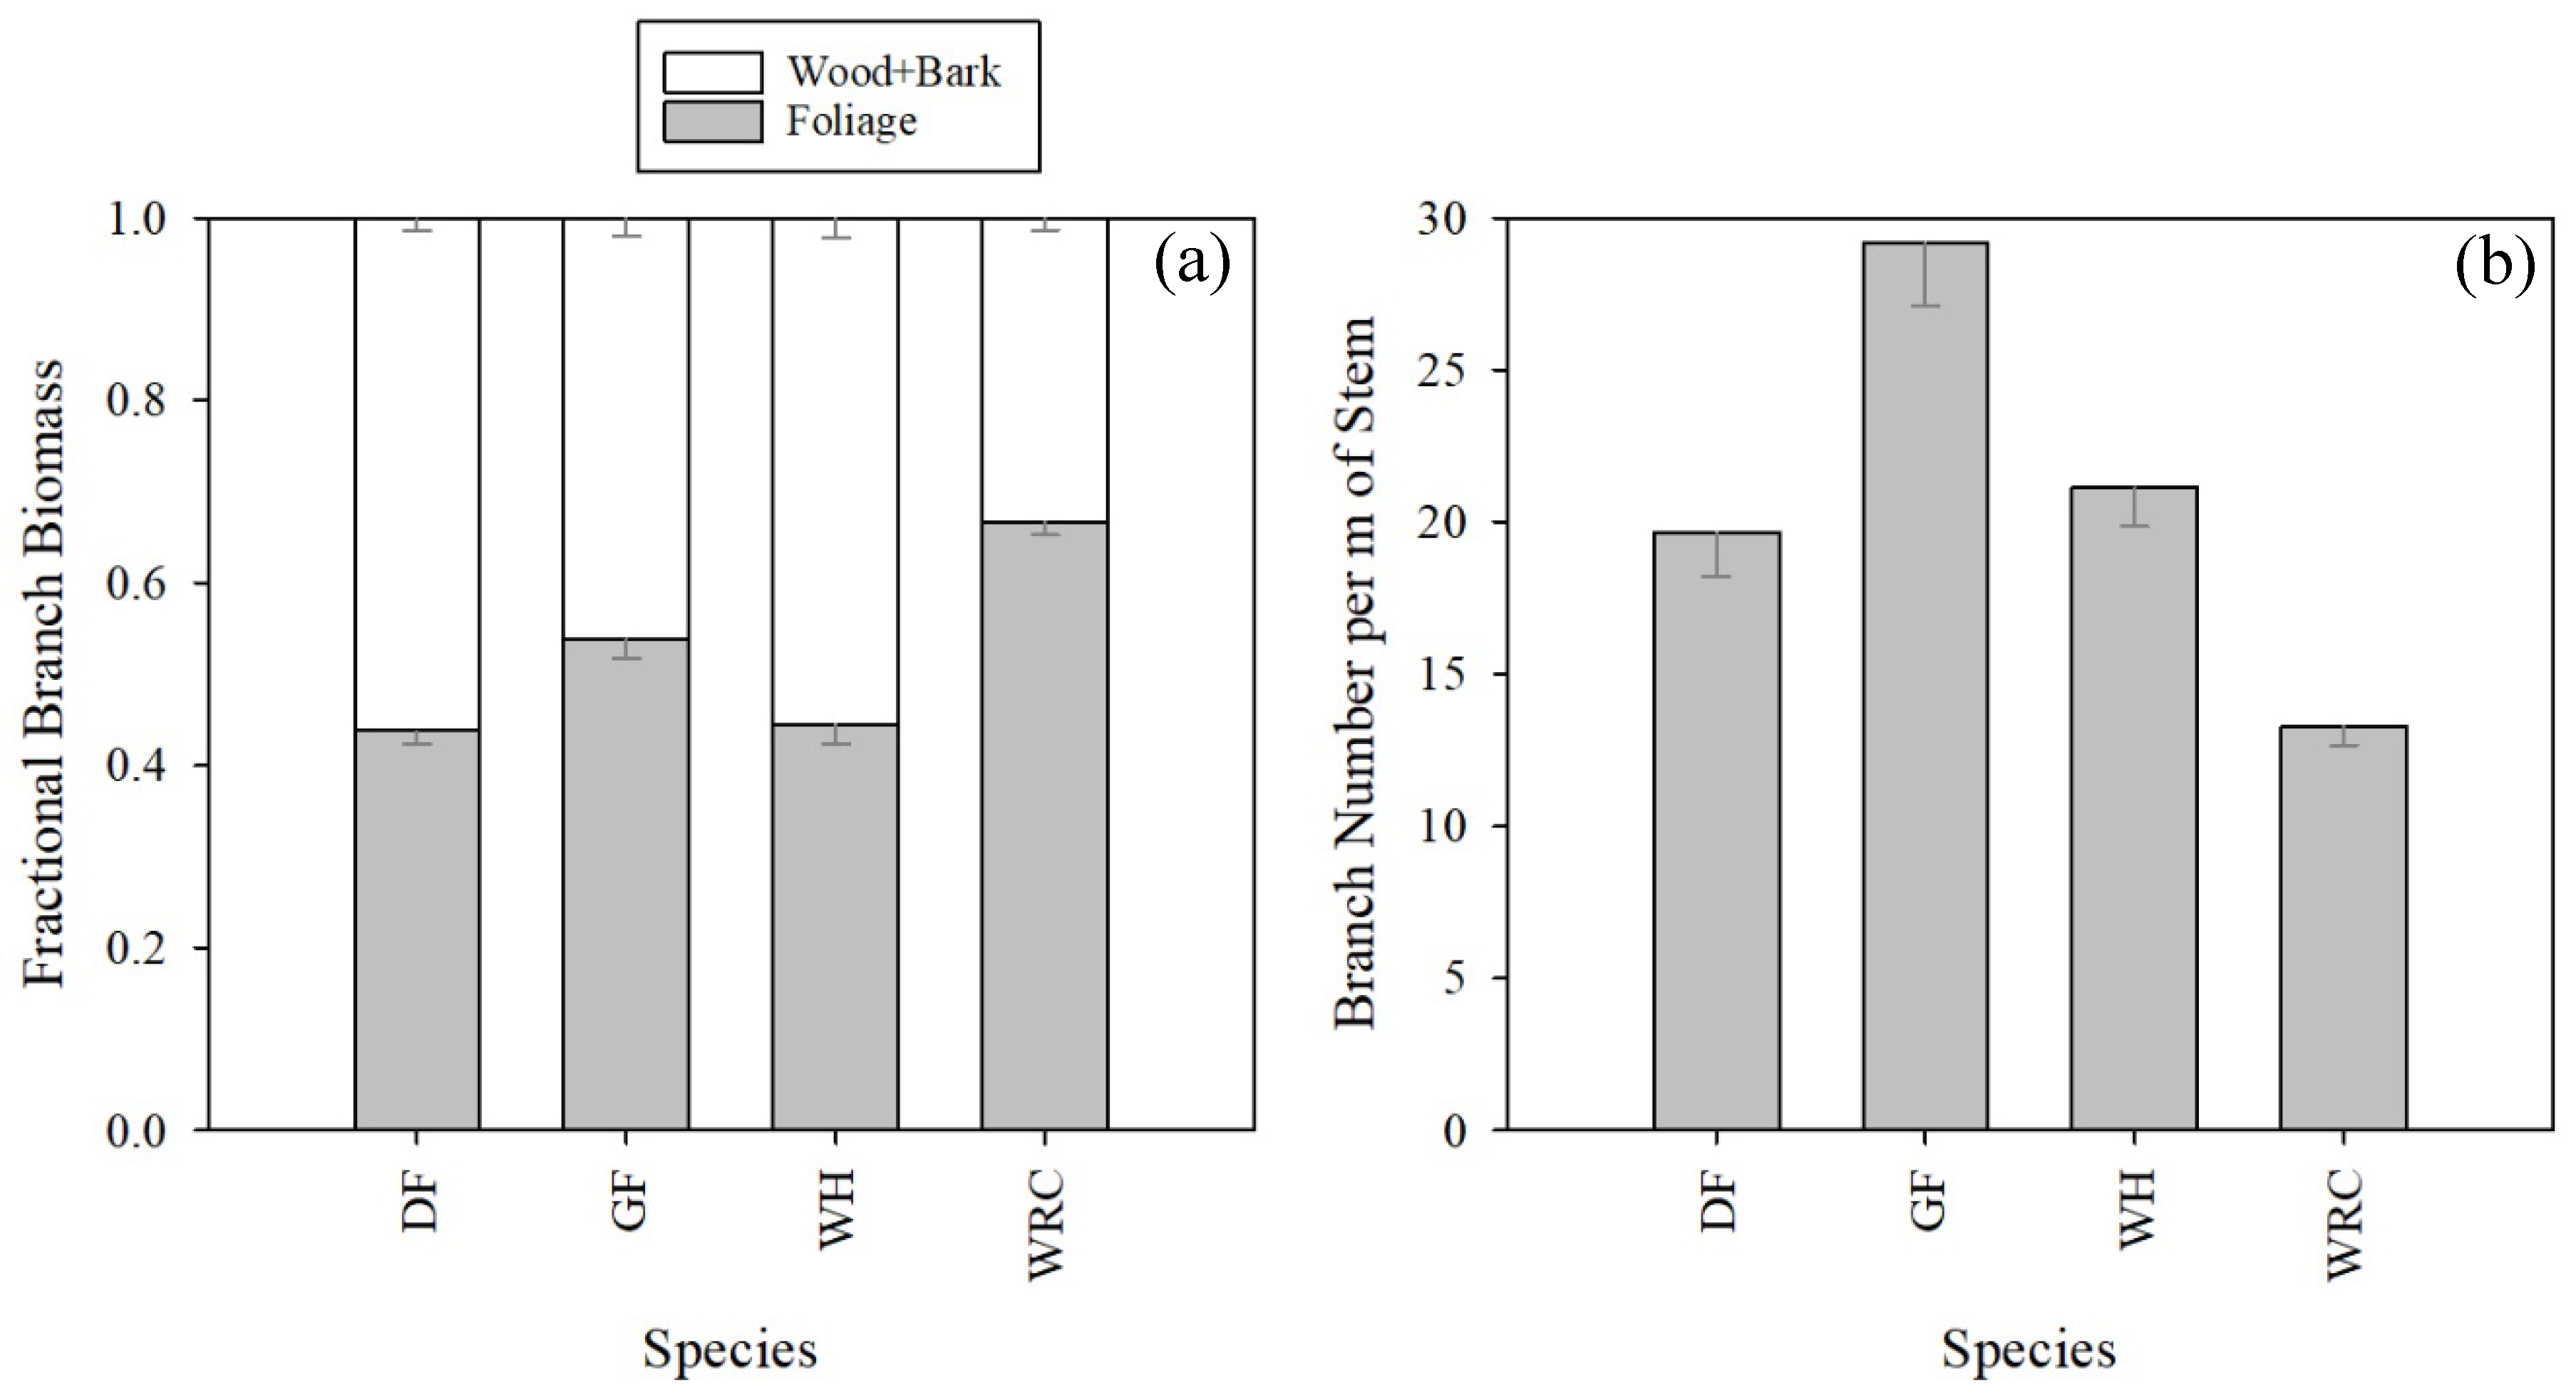
Figure 3.
Branch biomass partitioning (a) and density (b) for 15–16-year-old Douglas-fir (DF), grand fir (GF), western hemlock (WH) and western redcedar (WRC) growing on sites located in the central Coast Range and the Cascade foothills of western Oregon. Error bars represents standard error.
Figure 3.
Branch biomass partitioning (a) and density (b) for 15–16-year-old Douglas-fir (DF), grand fir (GF), western hemlock (WH) and western redcedar (WRC) growing on sites located in the central Coast Range and the Cascade foothills of western Oregon. Error bars represents standard error.
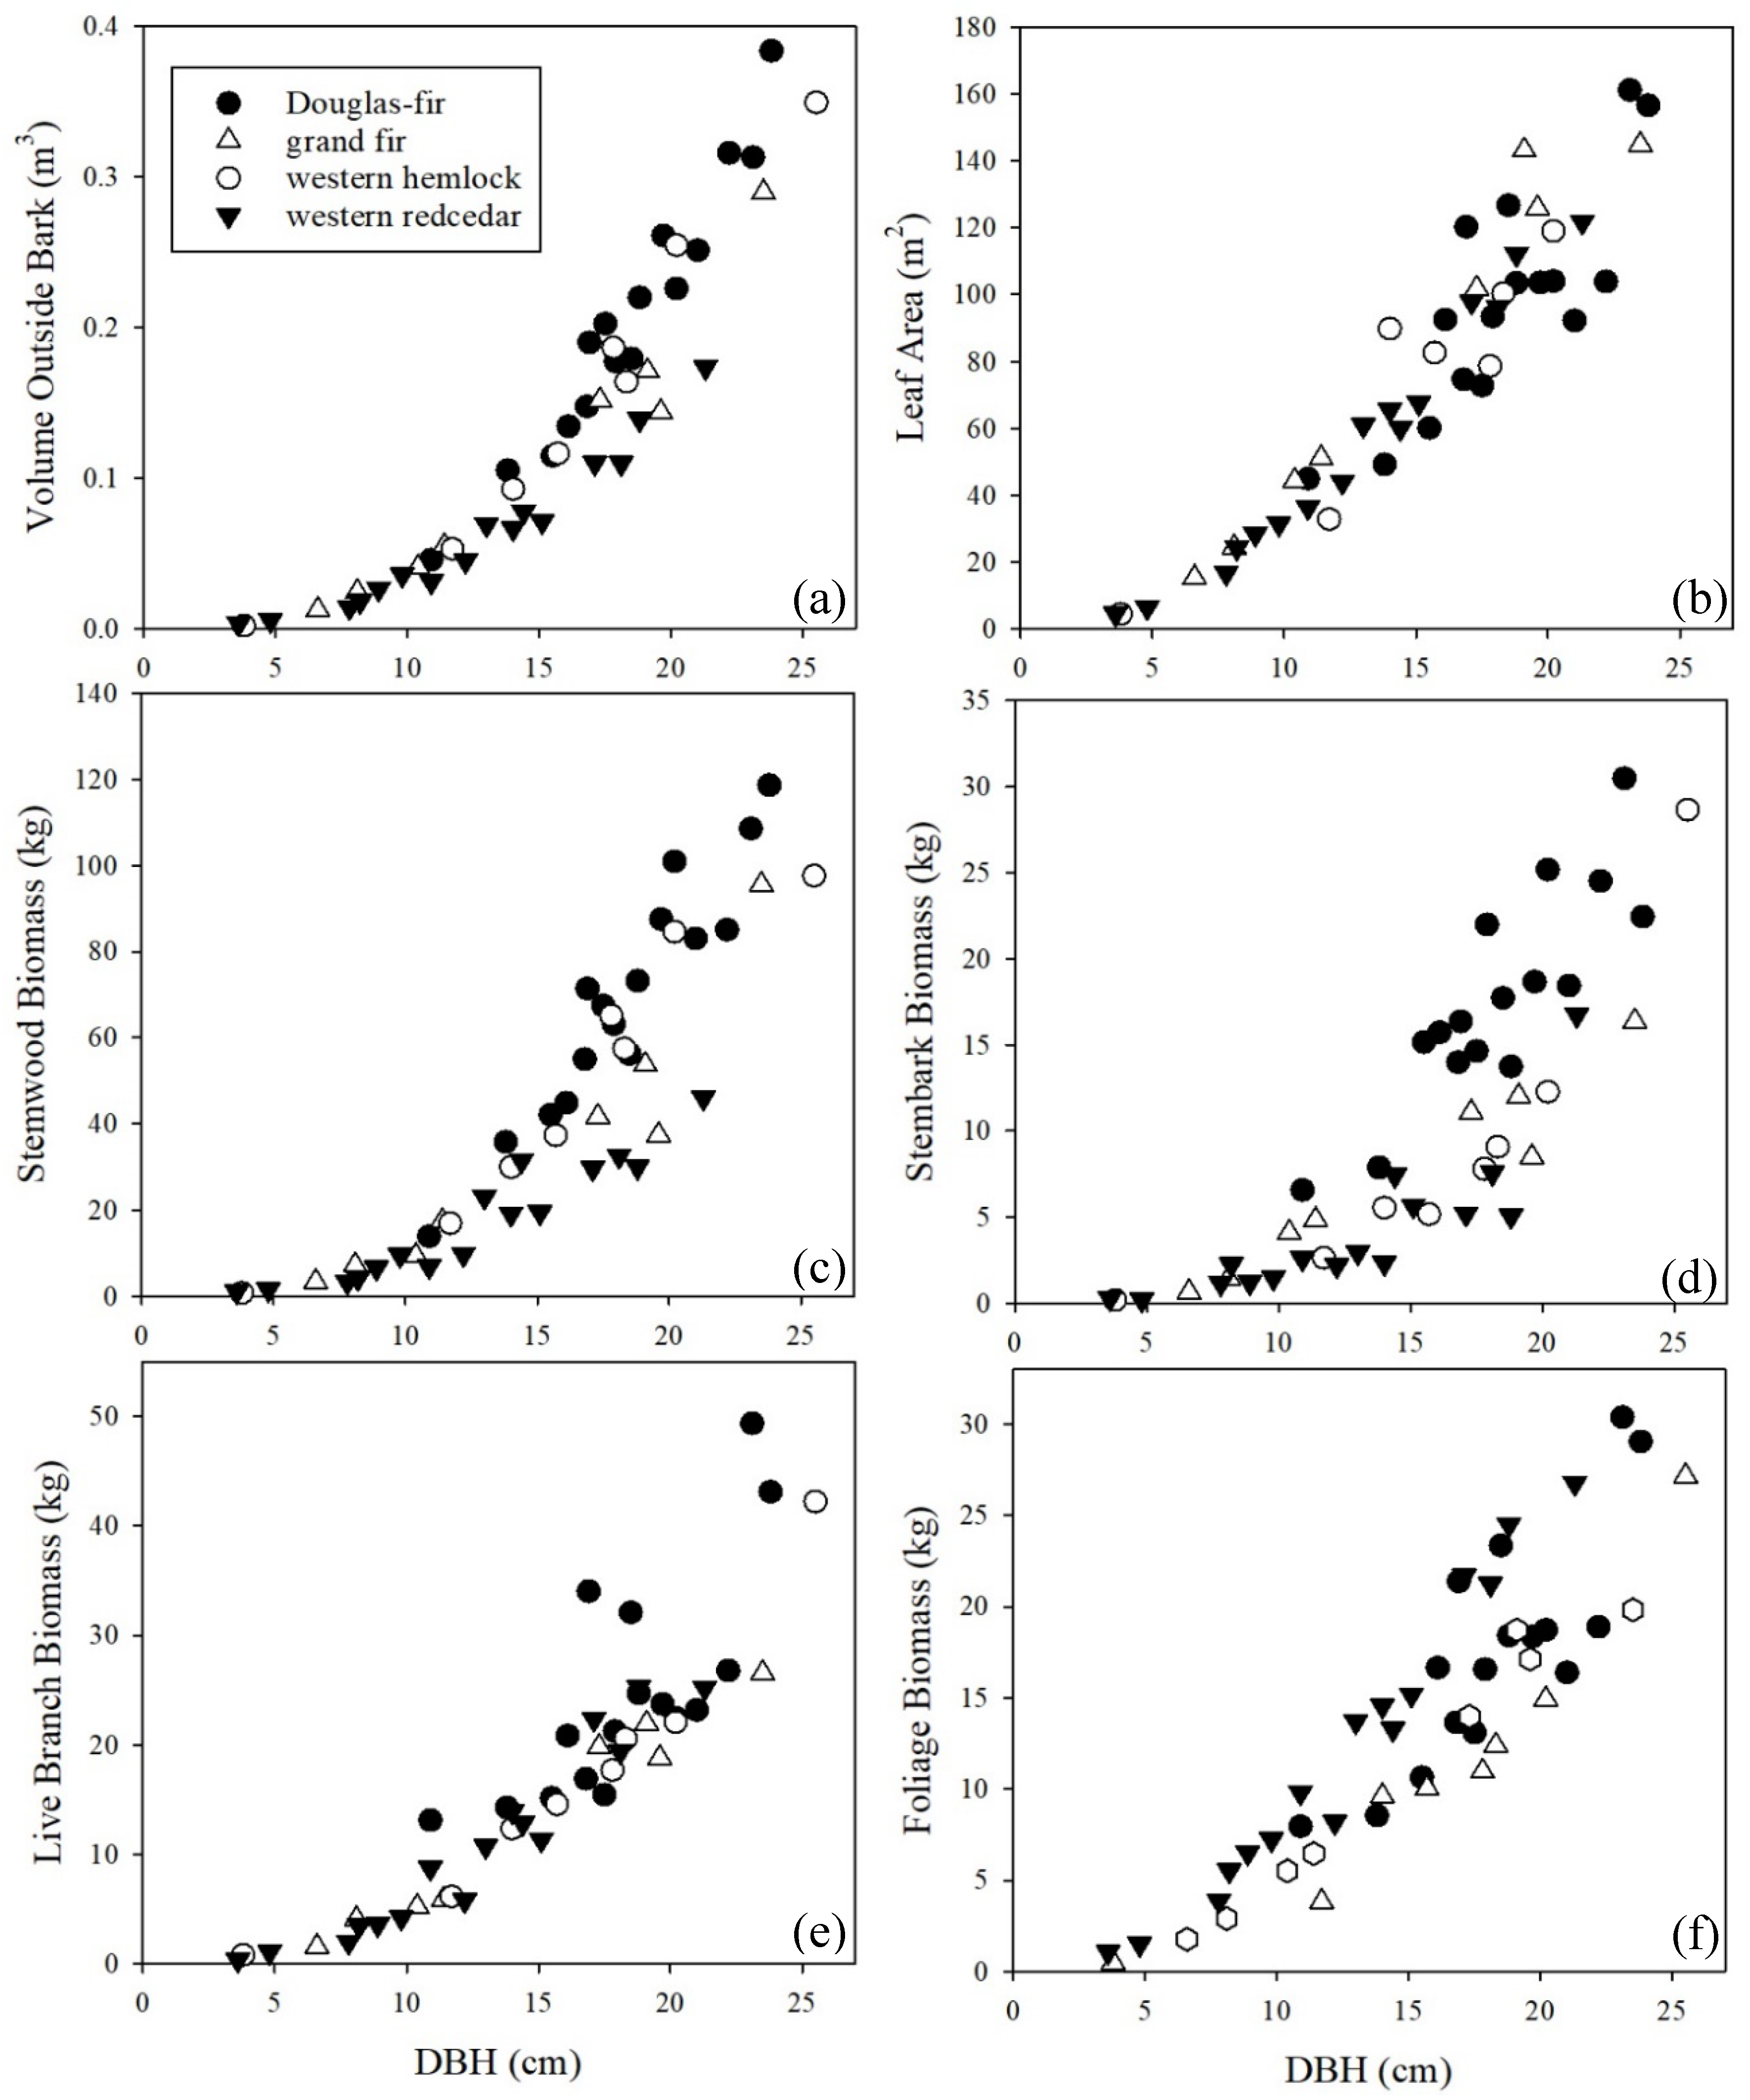
Figure 4.
Relationship between diameter at breast height (DBH) and (a) stem volume over-bark, (b) leaf area, (c) stemwood biomass, (d) stembark biomass, (e) live branch biomass and (f) foliage biomass, for 15–16-year-old Douglas-fir (filled circle), grand fir (open triangle), western hemlock (open circle) and western redcedar (filled triangle) growing on sites located in the central Coast Range and the Cascade foothills of western Oregon.
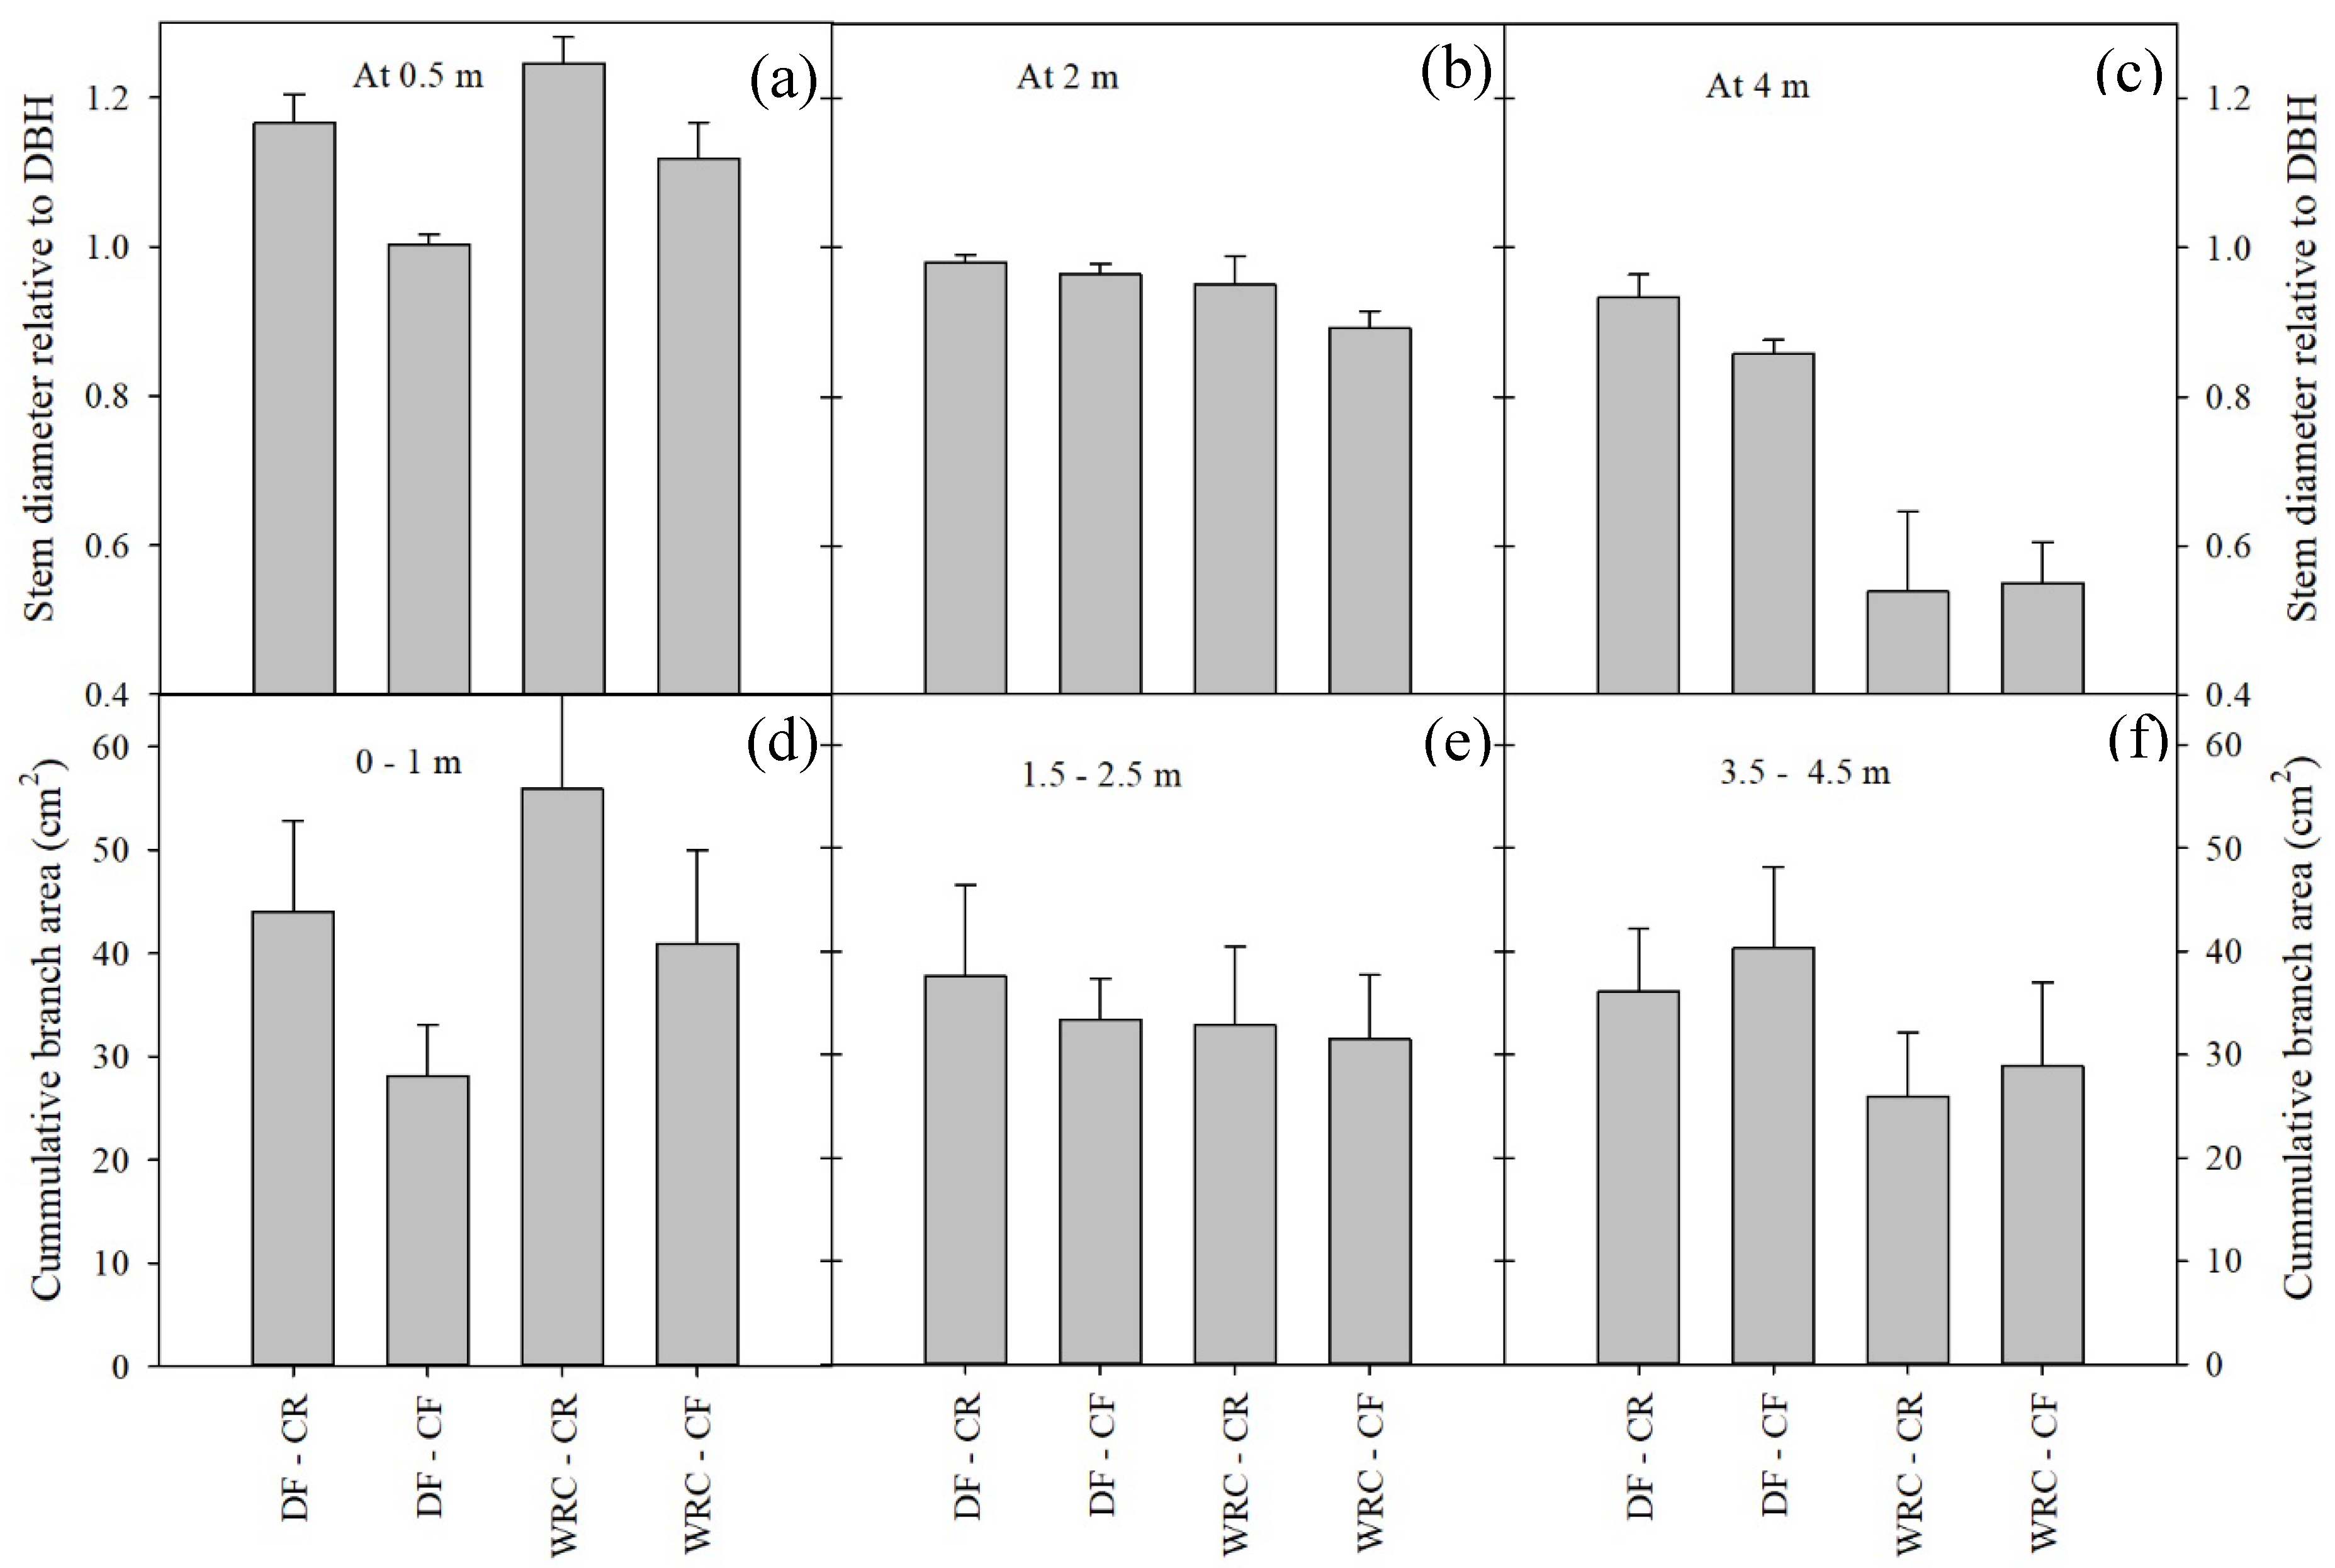
Figure 5.
Ratio of stem diameter at 0.5 m (a), 2 m (b) and 4 m (c) height to stem diameter at breast height (DBH) and cumulative branch cross section area at insertion point (cm2) between ground line and 1 m (d), 1.5 to 2.5 m (e) and between 3.5 to 4.5 m (f) stem height for 15–16-year-old Douglas-fir (DF) and western redcedar (WRC) growing on sites located in the central Coast Range (CR) and the Cascade foothills (CF) of western Oregon.
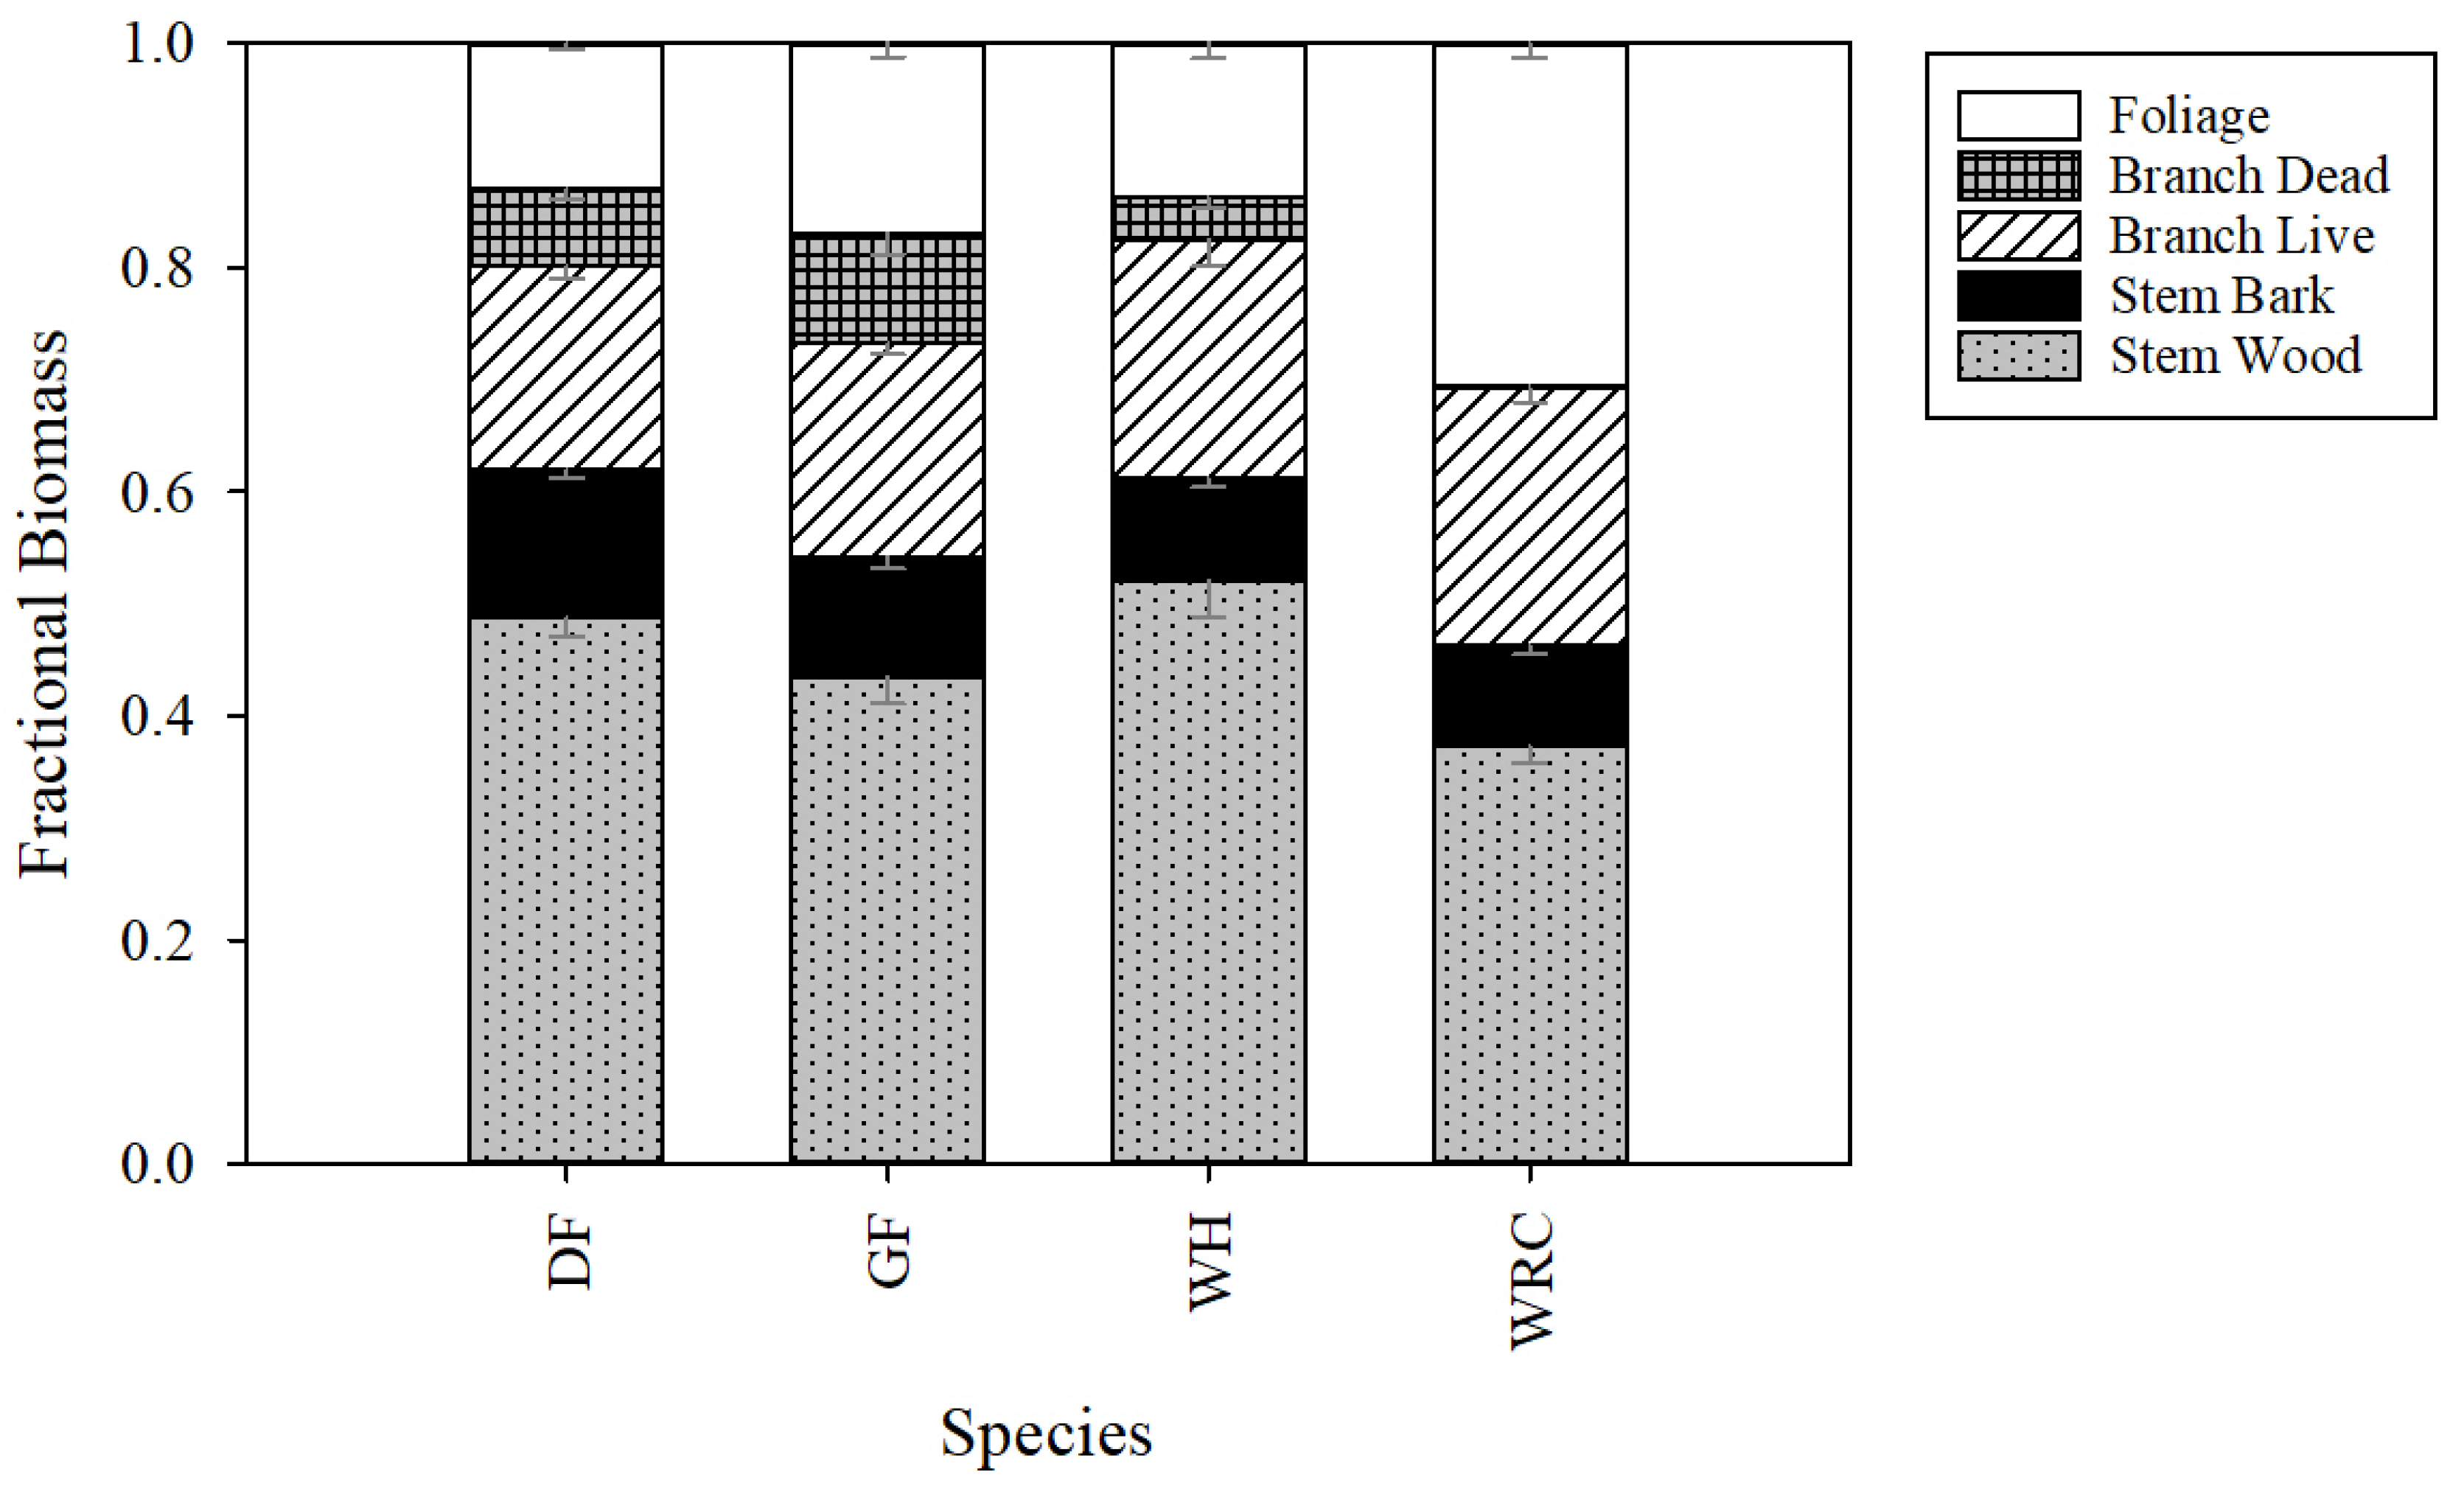
Figure 6.
Biomass partitioning for 15–16-year-old Douglas-fir (DF), grand fir (GF), western hemlock (WH) and western redcedar (WRC) growing on sites located in the central Coast Range and the Cascade foothills of western Oregon.
Figure 6.
Biomass partitioning for 15–16-year-old Douglas-fir (DF), grand fir (GF), western hemlock (WH) and western redcedar (WRC) growing on sites located in the central Coast Range and the Cascade foothills of western Oregon.
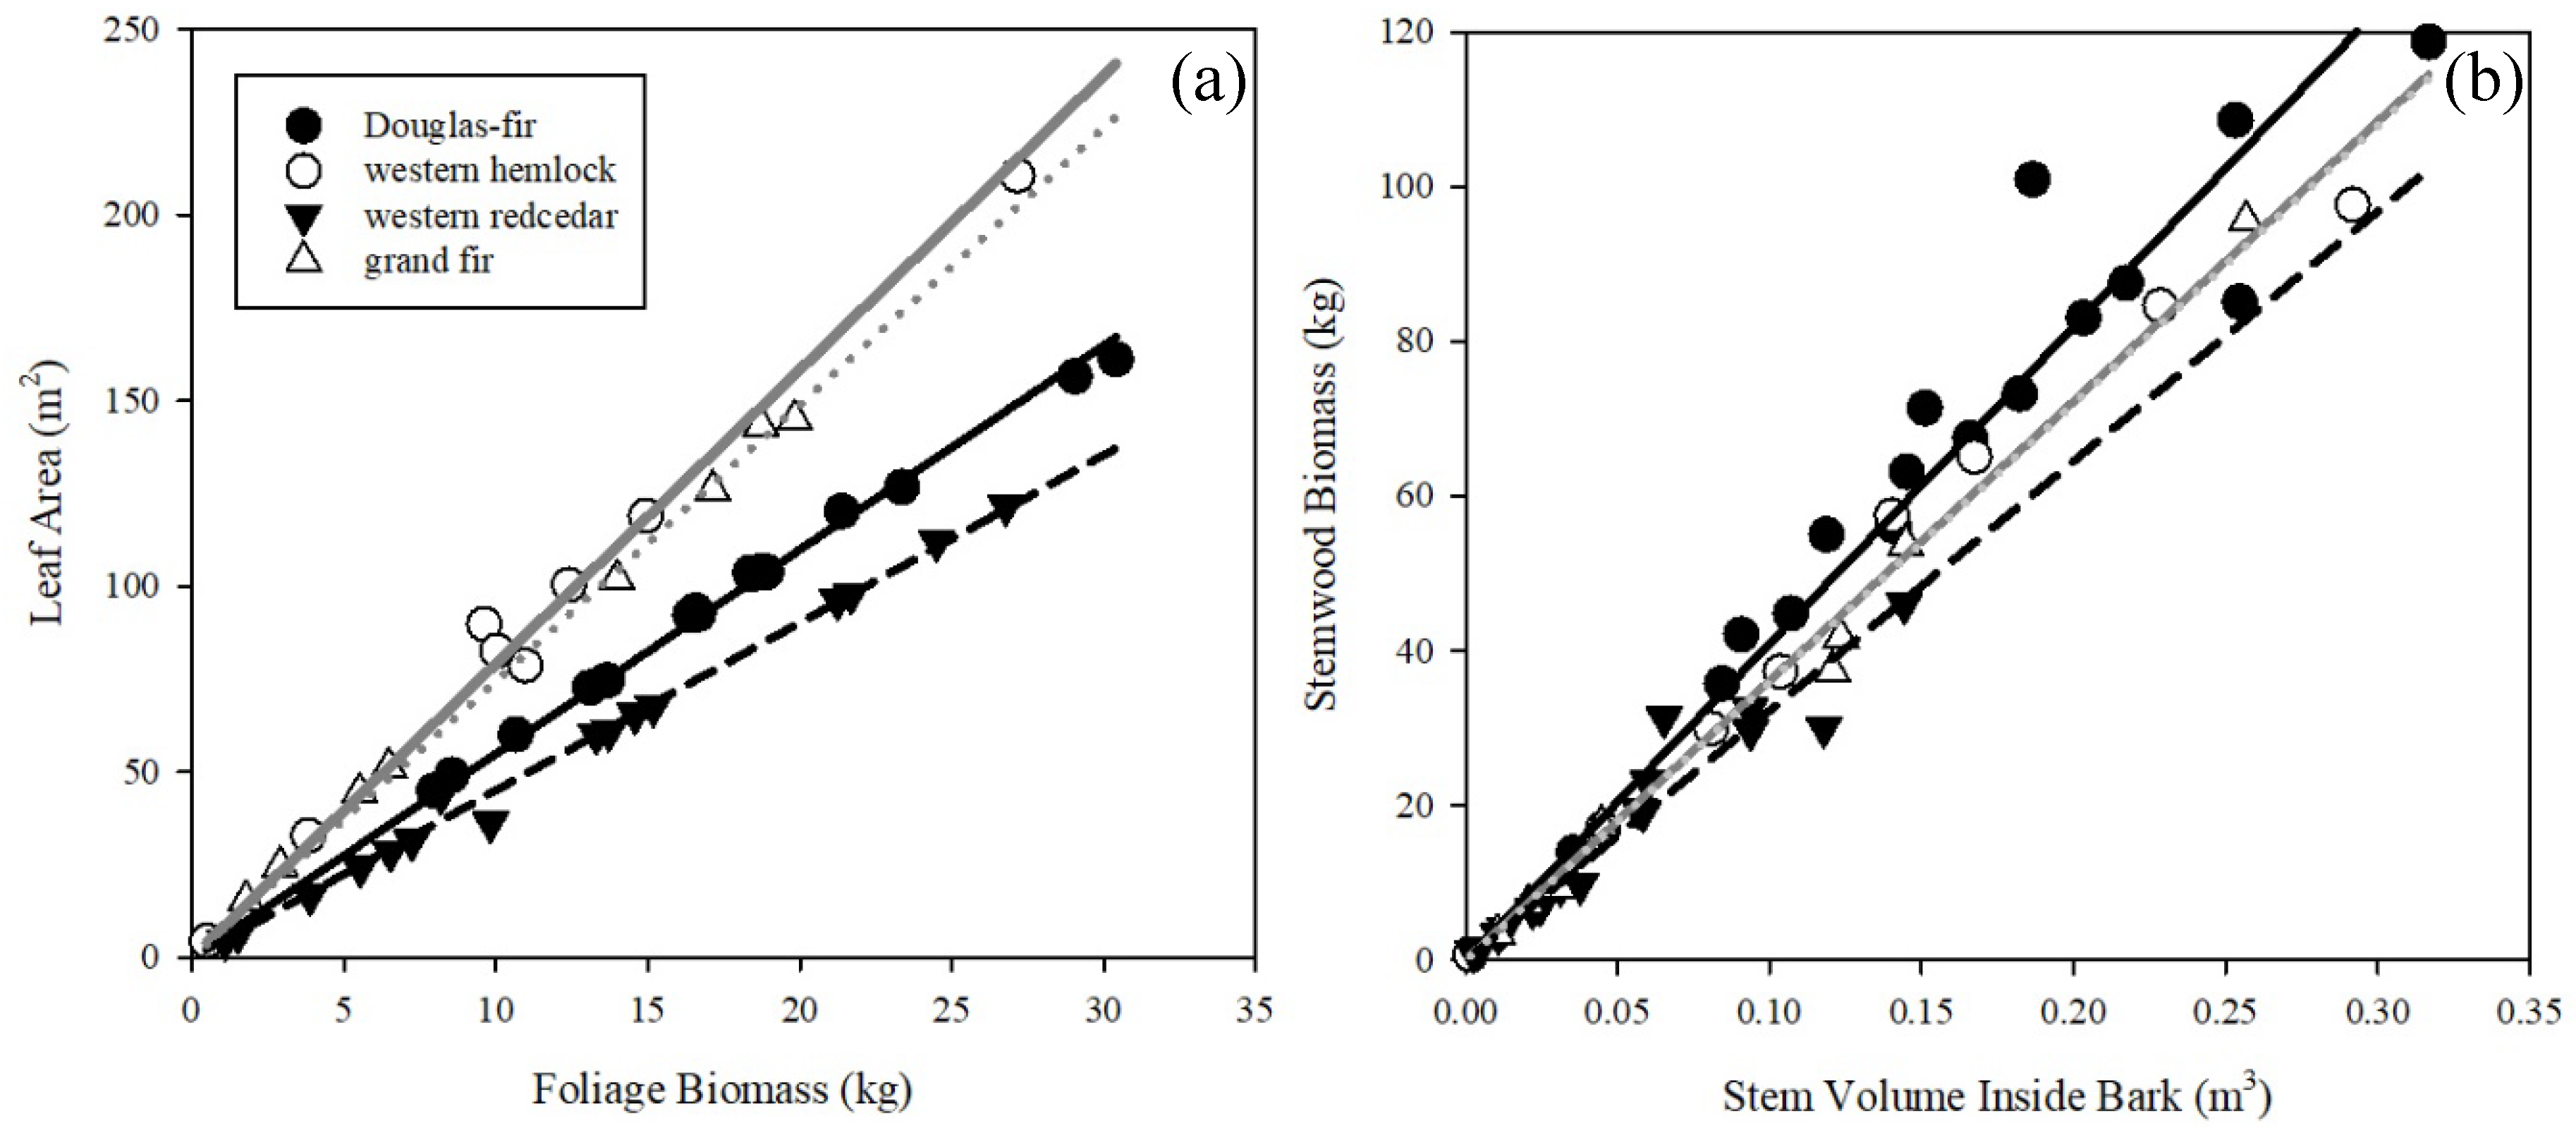
Figure 7.
Relationships between (a) foliage biomass and leaf area, and (b) stem volume inside bark and stemwood biomass for 15–16-year-old Douglas-fir (filled circle), grand fir (open triangle), western hemlock (open circle) and western redcedar (filled triangle) growing on sites located in the central Coast Range and the Cascade foothills of western Oregon.
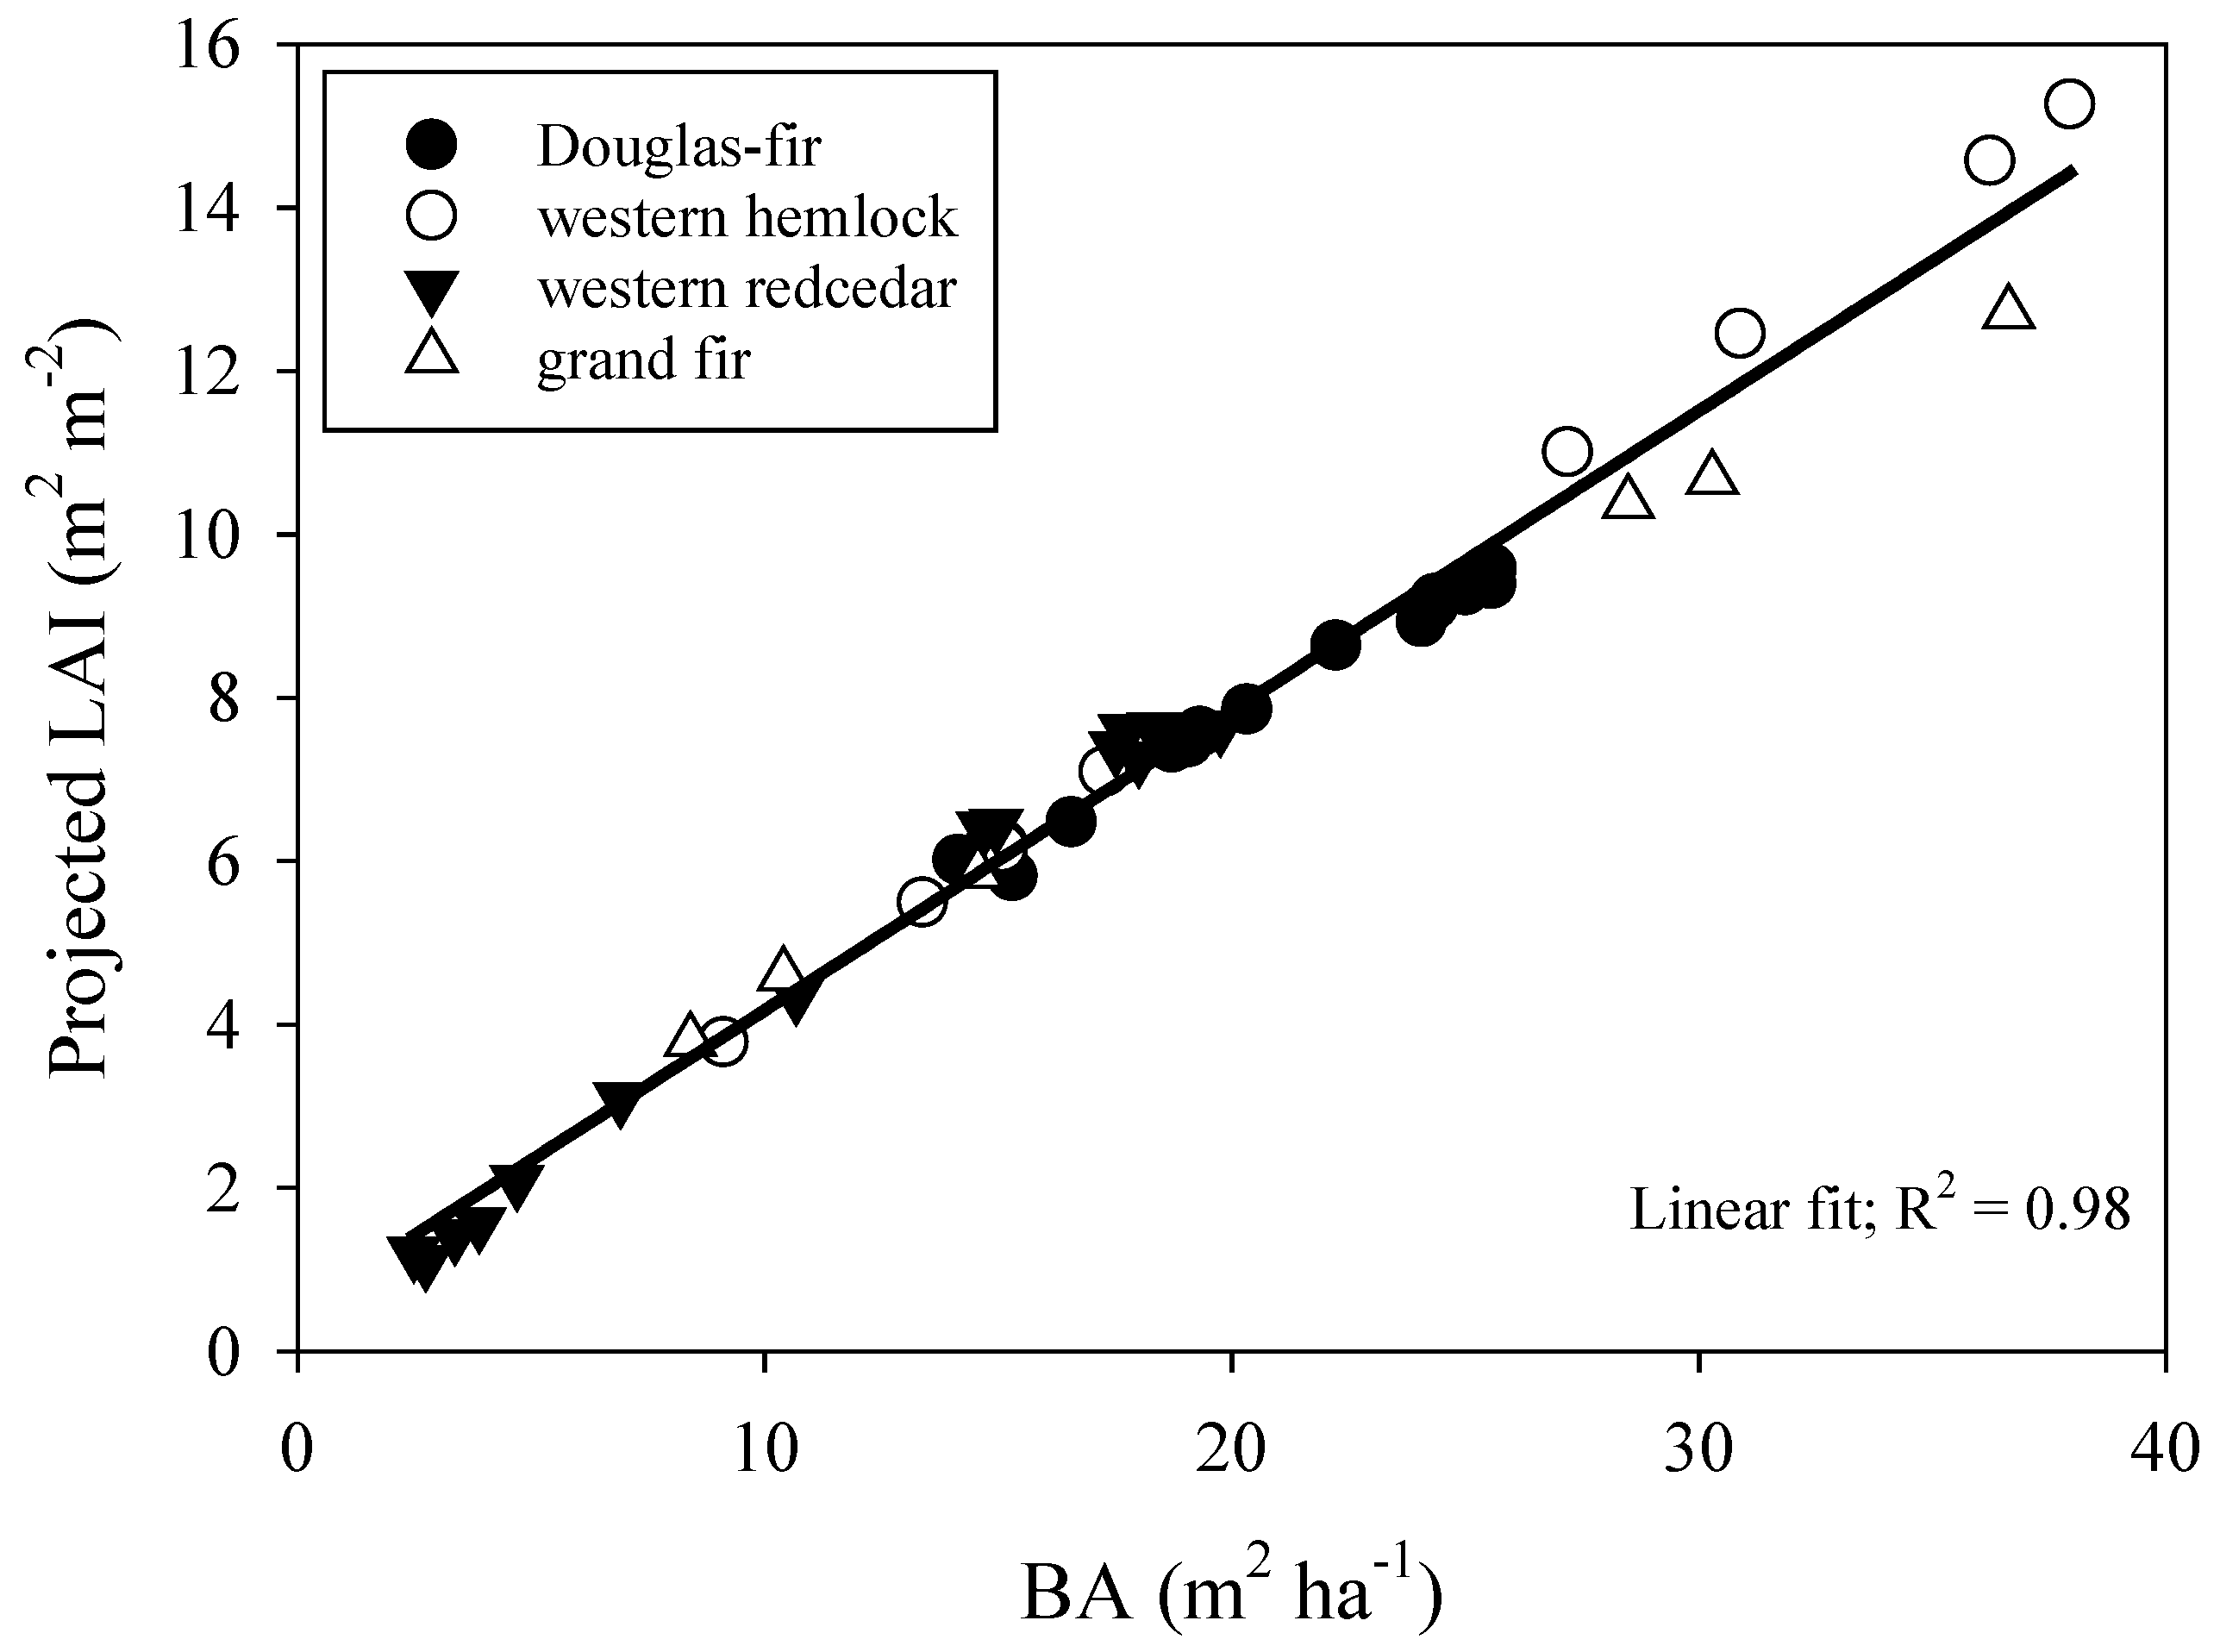
Figure 8.
Relationship between basal area (BA, m2 ha−1) and projected leaf area index (LAI, m2 m−2) for 15–16-year-old Douglas-fir, western hemlock, western redcedar, and grand fir stands. A single relationship was shared for all species growing under contrasting treatments of vegetation control on both sites.
Table 1.
Range of mean height (Height, m), quadratic mean diameter (QMD, cm), trees per ha (TPHA, ha−1), and basal area (BA, m2 ha−1), as well as height (HT, m) and diameter at breast height (DBH, cm) of sample trees, for Douglas-fir (DF), western hemlock (WH), western redcedar (WRC), and grand fir (GF) growing under contrasting treatments of vegetation management on sites located in the central Coast Range (CR; 16 years) and the Cascade foothills (CF; 15 years) of western Oregon. C: no post-planting vegetation control, VM: sustained vegetation control for first 5 years post planting.
| Site | Species | Treatment | Height (m) | QMD (cm) | TPHA (ha−1) | BA (m2 ha−1) | HT * (m) | DBH * (cm) |
|---|
| CR | DF | C | 13.4–14.5 | 18.2–18.8 | 598–718 | 16.6–19.3 | 14.3–17.2 | 13.8–22.2 |
| VM | 14.0–15.7 | 19.4–21.3 | 688–718 | 20.3–25.6 | 14.8–17.4 | 16.9–23.8 |
| WH | C | 9.8–11.9 | 11.8–16.4 | 718–1047 | 9.1–17.3 | 4.6–14.5 | 3.8–18.3 |
| VM | 13.3–14.8 | 18.2–21.5 | 987–1047 | 27.2–37.9 | 14.9–16.5 | 15.7–25.5 |
| WRC | C | 3.8–5.7 | 6.5–10.2 | 748–838 | 2.5–6.9 | 4.5–10.6 | 4.8–17.1 |
| VM | 8.0–8.6 | 14.6–16.5 | 838–1047 | 17.5–18.3 | 3.6–9.6 | 3.6–18.8 |
| GF | C | 7.8–9.5 | 10.7–14.6 | 868–987 | 8.4–14.6 | 6.1–12.9 | 6.6–19.1 |
| VM | 12.0–12.3 | 18.6–21.4 | 927–1047 | 28.5–36.6 | 8.6–14.0 | 8.1–23.5 |
| CF | DF | C | 11.7–13.2 | 15.1–15.6 | 658–718 | 12.6–13.1 | 9.7–15.2 | 10.9–18.5 |
| VM | 13.9–14.5 | 18.9–20.0 | 718–718 | 20.2–22.5 | 11.3–16.5 | 15.5–23.1 |
| WRC | C | 6.4–7.4 | 12.2–13.2 | 179–718 | 2.2–8.7 | 6.3–8.7 | 7.8–18.1 |
| VM | 7.7–8.0 | 13.7–14.4 | 838–1017 | 13.2–15.6 | 5.4–11.8 | 8.2–21.3 |
Table 2.
p-values of analysis of variance (ANOVA) testing effects of site, VM treatment (VM) and their interactions (VM × Site) on branch (BF, BWB, BD and BLA) and tree (W, B, DB, LB, F, LA, VOB and VIB) allometry for 15–16 year old Douglas-fir, western redcedar, western hemlock, and grand fir trees growing under contrasting treatments of vegetation management on sites located in the central Coast Range and the Cascade foothills of western Oregon. Bold: result is statistically significant at p < 0.05.
| Trait | Douglas-Fir | Western Redcedar | Western Hemlock | Grand Fir |
|---|
| VM | Site | VM × Site | VM | Site | VM × Site | VM | VM |
|---|
| BF | 0.777 | 0.848 | 0.997 | <0.001 | 0.013 | 0.234 | 0.072 | 0.301 |
| BWB | 0.961 | 0.944 | 0.302 | 0.277 | 0.509 | 0.933 | 0.433 | 0.196 |
| BD | 0.202 | 0.428 | 0.716 | - | - | - | 0.607 | 0.458 |
| BLA | 0.740 | 0.311 | 0.857 | <0.001 | 0.213 | 0.892 | 0.083 | 0.725 |
| W | 0.156 | 0.008 | 0.343 | 0.612 | 0.007 | 0.272 | 0.680 | 0.991 |
| B | 0.711 | 0328 | 0.349 | 0.085 | 0.098 | 0.277 | 0.904 | 0.576 |
| DB | 0.480 | 0.712 | 0.961 | - | - | - | 0.661 | 0.180 |
| LB | 0.685 | 0.638 | 0.214 | 0.737 | 0.183 | 0.491 | 0.930 | 0.402 |
| F | 0.994 | 0.235 | 0.107 | <0.001 | 0.153 | 0.062 | 0.972 | 0.232 |
| LA | 0.898 | 0.309 | 0.115 | 0.848 | 0.135 | 0.709 | 0.946 | 0.165 |
| VOB | 0.373 | 0.048 | 0.672 | 0.136 | 0.009 | 0.500 | 0.996 | 0.685 |
| VIB | 0.286 | 0.055 | 0.515 | 0.363 | 0.004 | 0.787 | 0.786 | 0.506 |
Table 3.
Parameter estimates and fit statistics of models to estimate branch foliage (BF), branch wood and bark (BWB), and dead branch (BD) biomass (kg), as well as projected branch leaf area (BLA, m2), for 15–16 year old Douglas-fir (DF), western hemlock (WH), western redcedar (WRC), and grand fir (GF) trees growing under contrasting treatments of vegetation management on sites located in the central Coast Range and the Cascade foothills of western Oregon.
| Species | Component | Model | Parameter | Parameter Estimate | SE | R2 | RMSE | CV |
|---|
| DF | BF | =a·Dbb·Hrc | a | 0.242740 | 0.111243 | 0.900 | 43.874 | 41.9 |
| b | 2.234609 | 0.153935 |
| c | 0.325534 | 0.070549 |
| BWB | =a·Dbb·Hrc | a | 0.104009 | 0.030414 | 0.969 | 40.342 | 24.3 |
| b | 2.520137 | 0.093530 |
| c | −0.083128 | 0.023099 |
| BD | =a·Dbb | a | 0.322141 | 0.157709 | 0.968 | 34.485 | 22.1 |
| b | 2.175812 | 0.158788 |
| BLA | =a·Dbb·Hrc | a | 0.001583 | 0.000812 | 0.883 | 0.400 | 45.6 |
| b | 2.297381 | 0.170593 |
| c | 0.266067 | 0.072168 |
| WH | BF | =a·Dbb·Hrc | a | 0.409374 | 0.183901 | 0.899 | 26.031 | 40.9 |
| b | 2.079810 | 0.153200 |
| c | 0.386665 | 0.080550 |
| BWB | =a·Dbb·Hrc | a | 0.258027 | 0.100716 | 0.953 | 28.206 | 28.8 |
| b | 2.172031 | 0.128320 |
| c | −0.100870 | 0.030428 |
| BD | =a·Dbb | a | 0.296655 | 0.161302 | 0.976 | 28.392 | 19.7 |
| b | 2.169103 | 0.172334 |
| BLA | =a·Dbb·Hrc | a | 0.006060 | 0.002824 | 0.905 | 0.218 | 40.6 |
| b | 1.845332 | 0.160453 |
| c | 0.302019 | 0.074047 |
| WRC | BF | = a·Dbb·Hrc | a | 0.887282 | 0.264078 | 0.937 | 42.222 | 33.5 |
| b | 1.811325 | 0.094996 |
| c | 0.101805 | 0.038719 |
| BFCR-C | =a·Dbb | a | 0.414763 | 0.268685 | 0.937 | 34.654 | 33.4 |
| b | 2.036934 | 0.212626 |
| BFCR-VM | =a·Dbb·Hrc | a | 0.226815 | 0.119741 | 0.973 | 24.922 | 25.1 |
| b | 2.255054 | 0.168183 |
| c | 0.361523 | 0.100470 |
| BFC-CF | =a·Dbb | a | 2.161440 | 0.987219 | 0.941 | 40.444 | 29.6 |
| b | 1.497172 | 0.147314 | | | |
| BFVM-CF | =a·Dbb·Hrc | a | 0.225451 | 0.157968 | 0.958 | 42.924 | 26.1 |
| b | 2.323746 | 0.225658 |
| c | 0.264838 | 0.073860 |
| BWB | =a·Dbb·Hrc | a | 0.043754 | 0.029673 | 0.837 | 54.141 | 65.3 |
| b | 2.581373 | 0.206244 |
| c | −0.135667 | 0.048691 |
| BD | =a·Dbb | a | 0.025267 | 0.044227 | 0.944 | 3.137 | 29.9 |
| b | 2.848520 | 0.752131 |
| BLA | =a·Dbb | a | 0.003206 | 0.000994 | 0.935 | 0.198 | 33.8 |
| b | 1.853035 | 0.097849 |
| BLAC | =a·Dbb | a | 0.006833 | 0.002779 | 0.929 | 0.208 | 35.8 |
| b | 1.623735 | 0.132254 |
| BLAVM | =a·Dbb | a | 0.000931 | 0.000425 | 0.959 | 0.164 | 27.7 |
| b | 2.229274 | 0.141052 |
| GF | BF | =Dbb·Hrc | a | 0.263667 | 0.184964 | 0.841 | 37.831 | 55.7 |
| b | 2.201609 | 0.239199 |
| c | 0.185972 | 0.074089 |
| BWB | =a·Dbb·Hrc | a | 0.113294 | 0.048466 | 0.956 | 21.431 | 30.0 |
| b | 2.338510 | 0.142954 |
| c | −0.154903 | 0.024570 |
| BD | =a·Dbb | a | 0.390743 | 0.296059 | 0.943 | 37.788 | 35.3 |
| b | 2.091764 | 0.242813 |
| BLA | =a·Dbb·Hrc | a | 0.002418 | 0.001487 | 0.875 | 0.226 | 46.0 |
| b | 2.141783 | 0.211811 |
| c | 0.311511 | 0.104361 |
Table 4.
Stem Volume functions and fit statistics for 15–16-year-old Douglas-fir (DF), western hemlock (WH), western redcedar (WRC), and grand fir (GF) trees growing under contrasting treatments of vegetation management on sites located in the central Coast Range and the Cascade foothills of western Oregon.
| Species | Model | Parameter | Parameter Estimate | SE | R2 | RMSE | CV |
|---|
| DF | | a | 0.000055 | 0.000027 | 0.996 | 0.014 | 6.9 |
| b | 1.703752 | 0.203596 |
| c | 1.190193 | 0.306222 |
| a | 0.000102 | 0.000117 | 0.996 | 0.016 | 6.7 |
| b | 1.8385 | 0.2893 |
| c | 0.8307 | 0.6082 |
| a | 0.000146 | 0.000041 | 0.999 | 0.005 | 3.2 |
| b | 2.3508 | 0.2107 |
| c | 0.1037 | 0.287 |
| a | 0.000034 | 0.000018 | 0.995 | 0.012 | 7.5 |
| b | 1.671631 | 0.219626 |
| c | 1.327253 | 0.333032 |
| a | 0.000054 | 0.000066 | 0.995 | 0.014 | 7.1 |
| b | 1.7884 | 0.3071 |
| c | 1.0374 | 0.6467 |
| a | 0.000104 | 0.000042 | 0.998 | 0.006 | 4.6 |
| b | 2.401 | 0.3005 |
| c | 0.0946 | 0.4104 |
| WH | | a | 0.000027 | 0.000019 | 0.997 | 0.009 | 6.3 |
| b | 2.027001 | 0.099639 |
| c | 1.083405 | 0.242174 |
| a | 0.000018 | 0.000016 | 0.995 | 0.011 | 8.2 |
| b | 1.890755 | 0.129699 |
| c | 1.335256 | 0.308443 |
| WRC | | a | 0.000177 | 0.000052 | 0.993 | 0.006 | 10.3 |
| b | 2.2539 | 0.1023 |
| a | 0.000256 | 0.000078 | 0.997 | 0.004 | 7.2 |
| b | 2.1418 | 0.1085 |
| a | 0.000111 | 0.000039 | 0.996 | 0.006 | 8.2 |
| b | 2.4007 | 0.119 |
| a | 0.000148 | 0.000051 | 0.991 | 0.006 | 12.2 |
| b | 2.2559 | 0.1213 |
| a | 0.00024 | 0.000073 | 0.997 | 0.004 | 7.4 |
| b | 2.1086 | 0.1086 |
| a | 0.00008 | 0.000031 | 0.995 | 0.005 | 9.1 |
| b | 2.4494130 | 0.1327910 |
| GF | | a | 0.0000392 | 0.0000100 | 0.999 | 0.004 | 4.0 |
| b | 2.0478170 | 0.0756310 |
| c | 0.9230922 | 0.1050010 |
| a | 0.0000170 | 0.0000070 | 0.998 | 0.006 | 6.0 |
| b | 2.2572040 | 0.1190240 |
| c | 0.9347452 | 0.1599140 |
Table 5.
Parameter estimates and fit statistics of the models to estimate stem wood (W), stem bark (B), live branch (LB), dead branch (DB), and foliage (F) biomass (kg tree−1), as well as projected leaf area (LA, m2 tree−1), for 15–16-year-old Douglas-fir (DF), western hemlock (WH), western redcedar (WRC), and grand fir (GF) trees growing under contrasting treatments of vegetation management on sites located in the central Coast Range and the Cascade foothills of western Oregon.
| Species | Component | Model | Parameter | Parameter Estimate | SE | R2 | RMSE | CV |
|---|
| DF | W | | a | 0.085982 | 0.079190 | 0.983 | 9.548 | 13.8 |
| b | 1.743391 | 0.410895 |
| c | 0.588628 | 0.592671 |
| B | | a | 0.143963 | 0.124467 | 0.970 | 3.237 | 18.3 |
| b | 1.650530 | 0.289199 |
| F | | a | 0.127946 | 0.126649 | 0.962 | 3.663 | 20.8 |
| b | 1.687964 | 0.330921 |
| LB | | a | 0.091734 | 0.124809 | 0.934 | 6.883 | 27.8 |
| b | 1.914700 | 0.453363 |
| DB | | a | 0.013202 | 0.040815 | 0.744 | 6.009 | 61.2 |
| b | 2.257778 | 1.025492 |
| LA | | a | 0.809925 | 0.790337 | 0.962 | 21.795 | 20.6 |
| b | 1.671241 | 0.326305 |
| WH | W | | a | 0.007047 | 0.004370 | 0.99 | 2.928 | 6.00 |
| b | 1.571966 | 0.097645 |
| c | 1.662778 | 0.219399 |
| B | | a | 0.000498 | 0.000253 | 0.995 | 0.888 | 9.95 |
| b | 3.381269 | 0.161567 |
| F | | a | 0.022128 | 0.011911 | 0.990 | 1.335 | 11.9 |
| b | 2.189509 | 0.175570 |
| LB | | a | 0.026507 | 0.010002 | 0.995 | 1.419 | 8.32 |
| b | 2.271618 | 0.122826 |
| DB | | a | 0.048264 | 0.087975 | 0.888 | 1.482 | 37.2 |
| b | 1.531550 | 0.605645 |
| LA | | a | 0.378075 | 0.186953 | 0.991 | 10.329 | 11.2 |
| b | 1.942013 | 0.162359 |
| WRC | W | | a | 0.084895 | 0.057711 | 0.961 | 4.275 | 24.9 |
| b | 2.053715 | 0.237990 |
| B | | a | 0.000772 | 0.001259 | 0.892 | 1.870 | 46.1 |
| b | 3.204432 | 0.556574 |
| F | | a | 0.140835 | 0.039597 | 0.992 | 1.329 | 10.9 |
| b | 1.736489 | 0.099446 |
| LB | | a | 0.048643 | 0.028102 | 0.972 | 2.245 | 21.1 |
| b | 2.083644 | 0.202075 |
| DB | | a | 0.003620 | 0.009308 | 0.938 | 0.044 | 29.2 |
| b | 1.825111 | 1.152156 |
| LA | | a | 0.632243 | 0.197693 | 0.989 | 7.109 | 12.1 |
| b | 1.764259 | 0.110488 |
| GF | W | | a | 0.001790 | 0.001526 | 0.969 | 4.664 | 31.8 |
| b | 2.367067 | 0.238453 |
| c | 1.292649 | 0.331163 |
| B | | a | 0.054515 | 0.050308 | 0.967 | 1.638 | 22.2 |
| b | 1.799409 | 0.308392 |
| F | | a | 0.141392 | 0.084277 | 0.983 | 1.675 | 15.5 |
| b | 1.599511 | 0.200387 |
| LB | | a | 0.096273 | 0.069479 | 0.979 | 2.265 | 17.4 |
| b | 1.799857 | 0.241167 |
| DB | | a | 0.000009 | 0.000035 | 0.899 | 2.497 | 42.9 |
| b | 4.570093 | 1.150185 |
| LA | | a | 1.015881 | 0.615344 | 0.982 | 11.524 | 15.9 |
| b | 1.575135 | 0.203806 |
Table 6.
Average specific leaf area (SLA, m2 kg−1), stemwood density (DW, kg m−3) and bark density (DB, kg m−3) for destructively sampled 15–16-year-old Douglas-fir (DF), western hemlock (WH), western redcedar (WRC) and grand fir (GF) trees growing on sites located in the central Coast Range (CR) and the Cascade foothills (CF) of western Oregon.
| Species | Variable | CR | CF |
|---|
| Mean | SE | Mean | SE |
|---|
| DF | SLA | 5.59 | 0.04 | 5.53 | 0.05 |
| DW | 398.7 | 11.92 | 394.4 | 10.43 |
| DB | 382.2 | 13.51 | 392.2 | 11.20 |
| WH | SLA | 8.30 | 0.28 | | |
| DW | 396.5 | 15.68 | | |
| DB | 420.6 | 25.74 | | |
| WRC | SLA | 4.41 | 0.05 | 4.48 | 0.17 |
| DW | 328.7 | 10.34 | 335.4 | 8.96 |
| DB | 309.0 | 15.16 | 329.8 | 10.58 |
| GF | SLA | 7.82 | 0.20 | | |
| DW | 343.3 | 11.98 | | |
| DB | 416.2 | 17.71 | | |
Table 7.
Comparison of mean absolute bias (Bias) and root mean square error (RMSE) between the models reported in this study and three functions reported in scientific literature for total living aboveground biomass (TAGB; kg tree−1) for Douglas-fir (DF), western hemlock (WH), western redcedar (WRC), and grand fir (GF) trees.
| Species | Source | | | Bias | RMSE |
|---|
| DF | This study | 129.3 | 129.4 | −0.07 | 11.5 |
| Chojnacky et al. (2014) [19] | 123.8 | 4.26 | 14.0 |
| Gholz (1982) [17] | 134.1 | −3.64 | 15.5 |
| Standish (1985) [18] | 111.5 | 13.8 | 20.3 |
| WH | This study | 85.9 | 85.7 | 0.29 | 4.2 |
| Chojnacky et al. (2014) [19] | 86.4 | −0.54 | 11.0 |
| Gholz (1982) [17] | 101.3 | −17.87 | 26.0 |
| Standish (1985) [18] | 94.5 | −9.98 | 18.7 |
| WRC | This study | 44.1 | 44.3 | −0.2 | 12.5 |
| Chojnacky et al. (2014) [19] | 34.7 | 9.36 | 26.7 |
| Shaw (1979) [17] | 25.5 | 18.53 | 50.8 |
| Standish (1985) [18] | 56.1 | −11.99 | 51.4 |
| GF | This study | 64.4 | 64.0 | 0.44 | 6.1 |
| Chojnacky et al. (2014) [19] | 66.0 | −1.64 | 15.3 |
| Gholz (1982) [17] | 64.7 | −0.29 | 17.6 |
| Standish (1985) [18] | 73.5 | −9.07 | 26.1 |


