Article

Subwatershed-Level Lodgepole Pine Attributes Associated with a Mountain Pine Beetle Outbreak

1
W.A. Franke College of Forestry & Conservation, University of Montana, 32 Campus Drive, Missoula, MT 59812, USA
2
USDA Forest Service, Rocky Mountain Research Station, Missoula, MT 59808, USA
3
USDA Forest Service, Forest Health Protection, 26 Fort Missoula Road, Missoula, MT 59804, USA
4
USDA Forest Service, Rocky Mountain Research Station, Fort Collins, CO 80525, USA
*
Author to whom correspondence should be addressed.
Forests 2018, 9(9), 552; https://doi.org/10.3390/f9090552
Submission received: 3 August 2018 / Revised: 31 August 2018 / Accepted: 5 September 2018 / Published: 9 September 2018

Abstract

:
Mountain pine beetle (Dendroctonus ponderosae Hopkins; MPB) is an aggressive bark beetle that attacks numerous Pinus spp. and causes extensive mortality in lodgepole pine (Pinus contorta Douglas ex Loudon; LPP) forests in the western United States and Canada. We used pre-outbreak LPP attributes, cumulative MPB attack severity, and areal extent of mortality data to identify subwatershed-scale forest attributes associated with severe MPB-caused tree mortality that occurred across the Northern Rockies, USA from 1999–2014. We upscaled stand-level data to the subwatershed scale to allow identification of large LPP areas vulnerable to MPB. The highest mortality occurred in subwatersheds where LPP mean basal area was greater than 11.5 m2 ha−1 and LPP quadratic mean diameter was greater than or equal to 18 cm. A coarse assessment of federally-owned LPP-dominated forestland in the analysis area indicated about 42% could potentially be silviculturally treated. Silvicultural management may be a suitable option for many LPP forests, and our hazard model can be used to identify subwatersheds with LPP attributes associated with high susceptibility to MPB across landscape spatial scales. Identifying highly susceptible subwatersheds can help prioritize general areas for potential treatments, especially where spatially extensive areas of contiguous, highly susceptible LPP occur.

1. Introduction

In western North America, some bark beetles (Curculionidae: Scolytinae) species can cause massive, widespread mortality in coniferous forests, yet the landscape-scale vegetation factors associated with sustained outbreaks are unclear [1]. Host and stand conditions influence mortality at the forest stand level [2,3], but research on causes of outbreaks over large areas have mainly focused on climatic factors [4,5,6,7]. Studies that have related forest attributes to the severity of tree mortality during outbreaks, have typically covered relatively small spatial extents [8,9,10,11], with the exception of Taylor et al. [12]. Collectively, these studies suggest regional climatic and weather conditions are necessary to trigger the initiation of an outbreak, while quality and abundance of host trees are important factors explaining the spatial extent and severity of tree mortality during an outbreak.
Mountain pine beetle (Dendroctonus ponderosae Hopkins; MPB) is a particularly aggressive native bark beetle that attacks numerous Pinus spp. and has caused extensive mortality in lodgepole pine (Pinus contorta Douglas ex Loudon; LPP) forests in the western and midwestern United States and western Canada since the early 2000s [13]. It is well-documented that MPB infestations occur primarily in dense stands with an abundance of large-diameter trees [1,3,8,11]. However, the interactions that shape LPP forest structure, composition, and spatial distribution, as well as MPB-attack patterns during outbreaks, are complex and include physical site conditions and disturbance frequency [14]. Given favorable climate conditions, MPB outbreak severity is limited by the availability and the spatial distribution of preferred susceptible host trees [15,16]. Severe MPB outbreaks tend to originate during periods of substantial drought [17] and continue, even after precipitation has returned to near-normal levels, until the depletion of quality host resources [4,18] or the collapse of insect populations to factors such as lethal winter temperatures and predation. MPB-attack in LPP forested areas is highly correlated with tree age and diameter due to thicker bark and phloem that are beneficial for successful MPB colonization and reproduction [19]. Therefore, under a conducive climate, outbreak severity is a function of the abundance and quality of susceptible-sized host trees.
Most of the available information on stand conditions that foster MPB infestations comes from small-scale studies. There is a pressing need to extrapolate this knowledge of small-scale patterns to larger spatial scales. Understanding the relationship between forest characteristics and MPB-attack severity at regional scales can provide important information about how current and future forest management can influence MPB outbreaks in LPP forests at large scales. In general, landscape heterogeneity is considered to make LPP forests more resistant and resilient to insect-caused disturbance [20]. Forest management recommendations to reduce forest susceptibility to severe and widespread beetle-caused mortality often include various silvicultural treatments to promote species and age class heterogeneity [21,22,23,24]. While stand-scale management actions may mitigate local losses, they do little to reduce the likelihood of an outbreak unless they are performed over a sufficiently large proportion of the landscape [1,11]. For example, Negrón et al. [25], working with ponderosa pine (Pinus ponderosa Lawson & C. Lawson var. scopulorum Engelm.) in the Black Hills, SD, showed that large-scale stand density reductions can mitigate MPB-caused tree mortality across the landscape.
Our knowledge of host species forest characteristics prior to the 2000s MPB outbreak in the western United States is limited. To date, only two studies [26,27] described host characteristics across large landscapes to examine general patterns of MPB-attack severity. Taylor and Carroll [26] reconstructed LPP age classes in British Columbia, Canada to determine changes in forest structure between the early 1900s and 2000s and found that the proportion of LPP in age classes susceptible to MPB attack (i.e., 45–85 years old) increased from 17% in 1910 to 55% in 2010. However, other factors known to foster MPB outbreaks, such as tree size, basal area, and stem density were not included. Hicke and Jenkins [27] estimated the contribution of LPP stand structure to MPB-caused mortality in the Western United States and reported that susceptible stands were typically in age classes (60–120 years) and stem densities (>400 stem ha−1). Neither of the two studies related host attributes prior to the MPB outbreak with observed attack patterns and severity during the outbreak.
In this study we explored the relationships between subwatershed-level LPP forest attributes and MPB-attack occurrence and severity across 17.9 million hectares of LPP-forests that experienced a widespread and severe MPB outbreak in the Northern Rockies region of the United States. We chose the subwatershed level as it is the smallest hydrologic unit in the hierarchical system used by the United State Geological Survey, representing hydrologically distinct areas of approximately 4050–16,200 ha. As subwatersheds are much larger than stand-level project management units, they can potentially be used to identify larger, landscape-scale project areas. Our objectives were to (1) summarize pre-outbreak LPP characteristics at the subwatershed level, (2) relate these LPP characteristics to MPB-attack severity to determine host characteristics associated with high-severity MPB-attack and (3) determine the total proportion of study area and administrative units not precluded from silvicultural management that could potentially reduce severity of MPB-caused mortality. Host characteristics associated with severe MPB-attack at the subwatershed level can inform landscape-scale management of LPP forests in order to reduce the risk of undesirable impacts from future outbreaks.

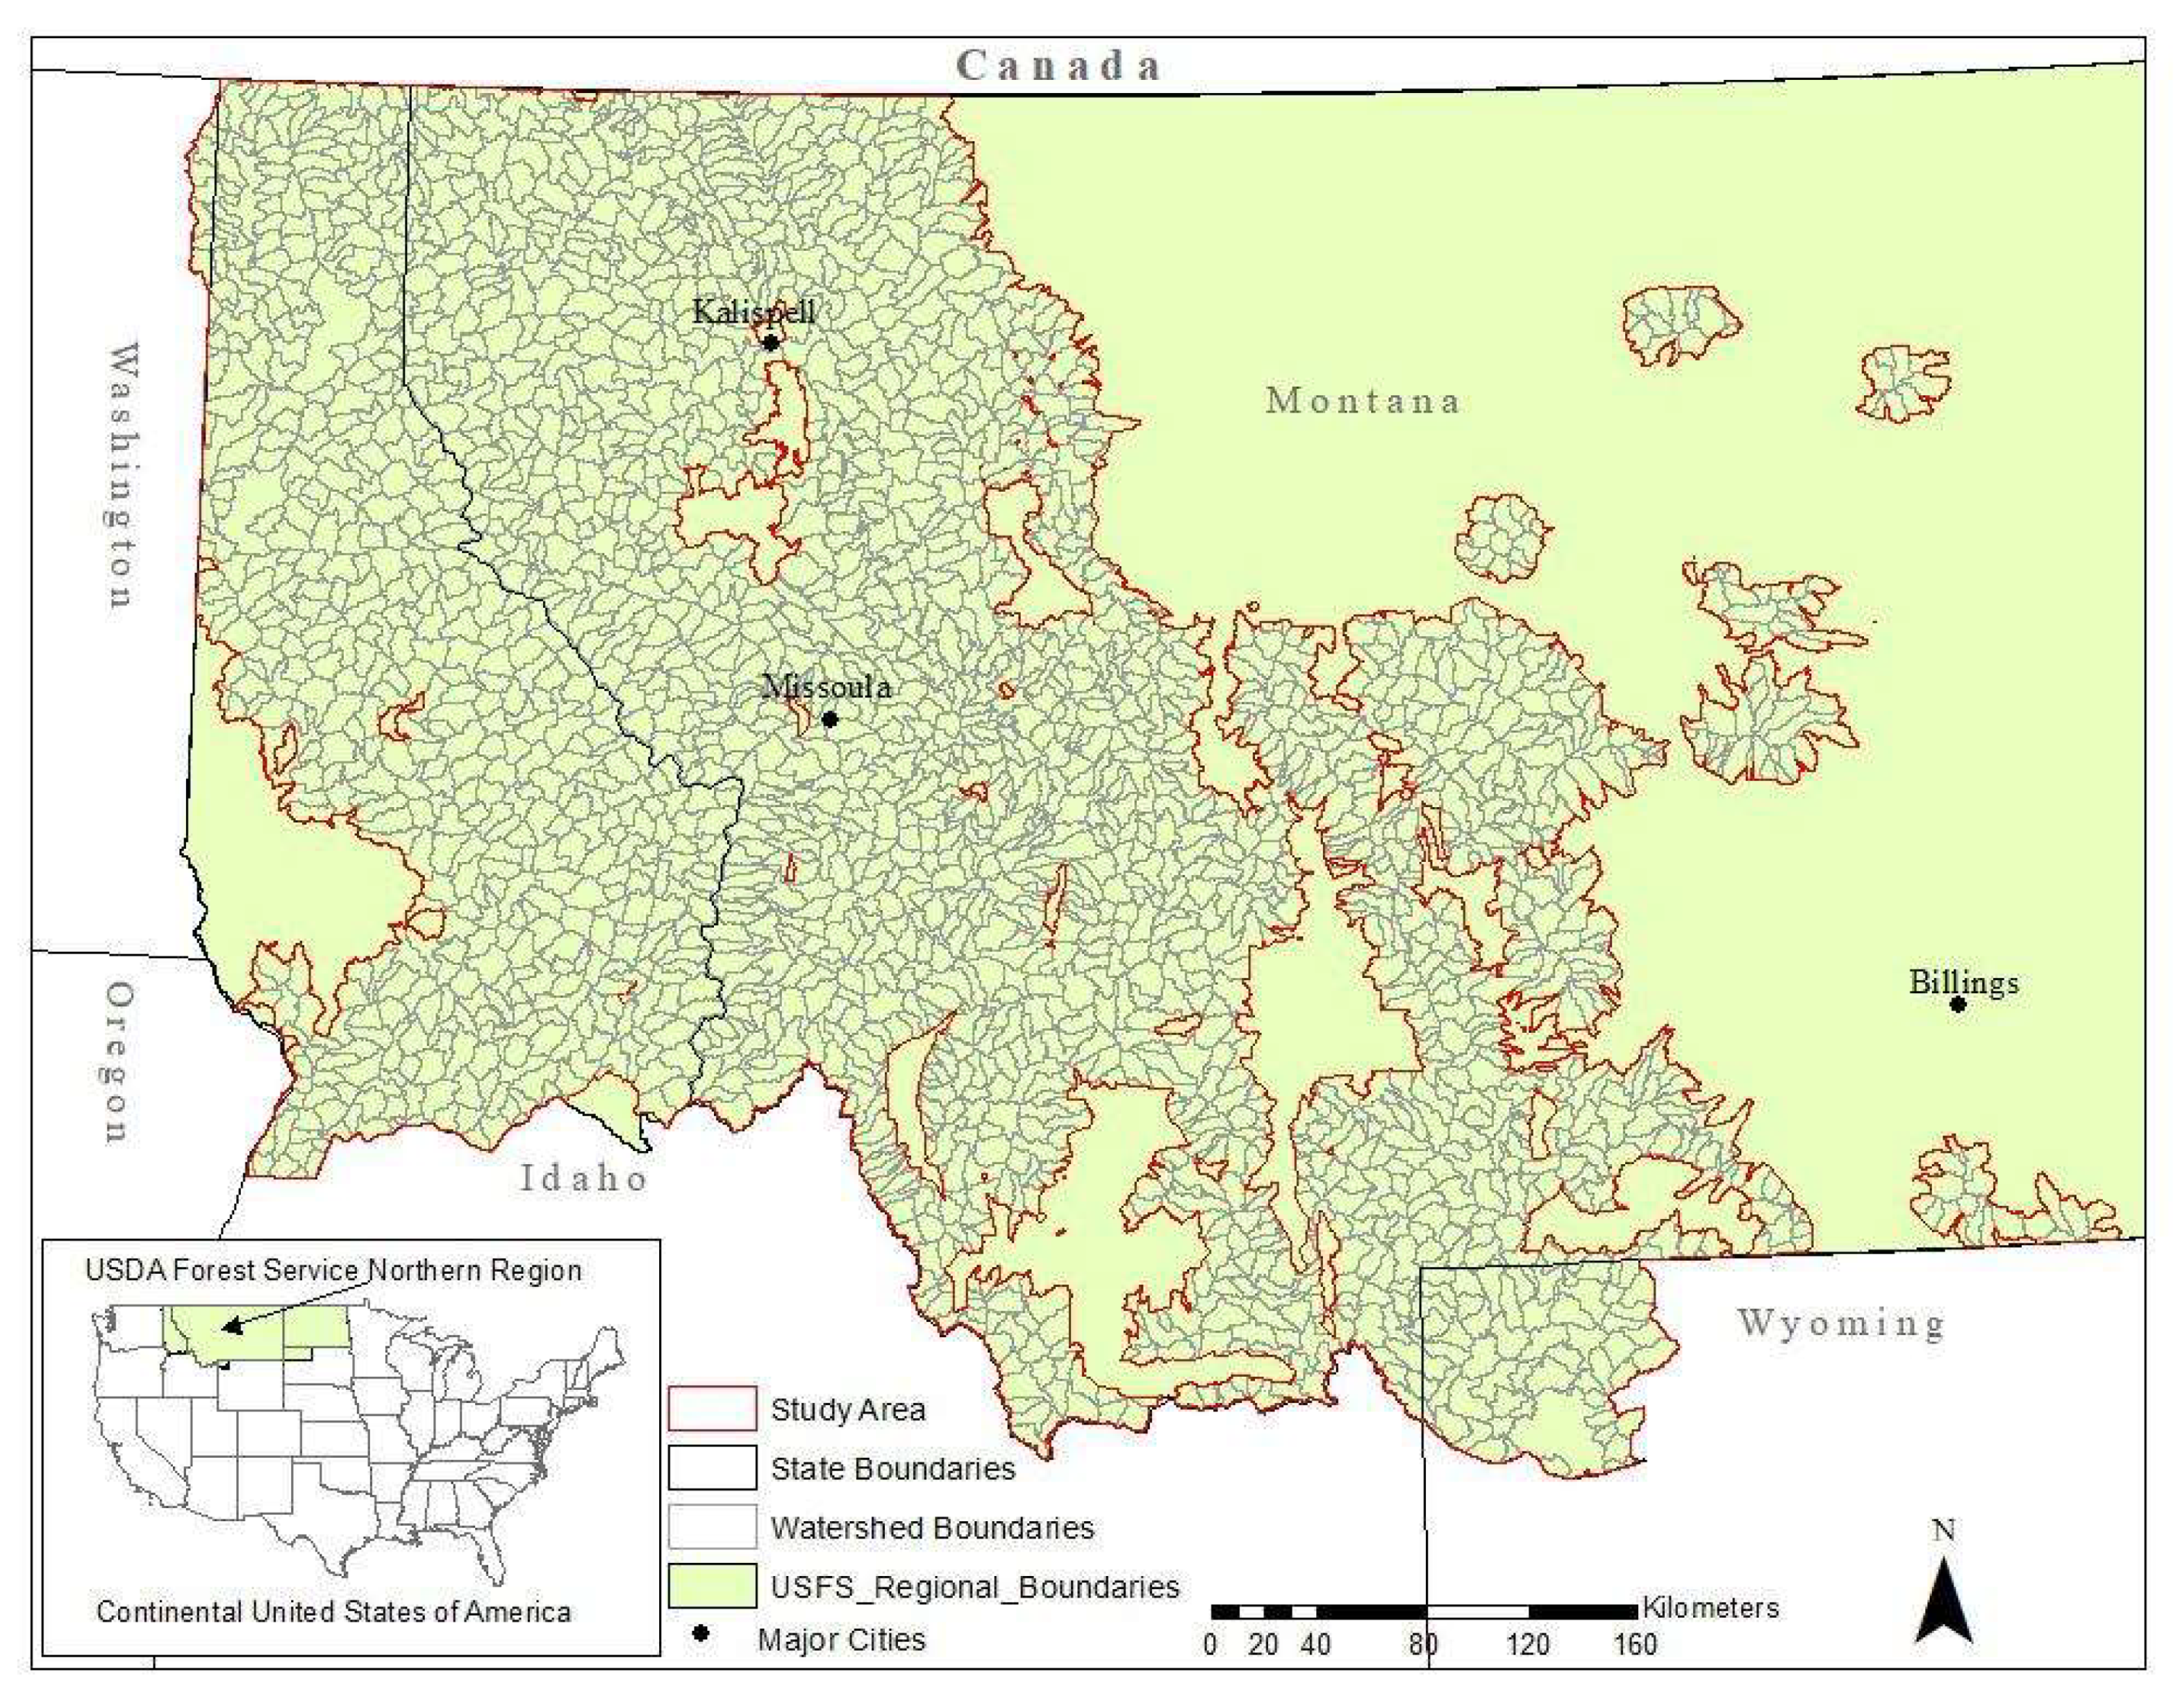
2. Materials and Methods

Our study area includes approximately 180,000 km2 in the Northern Rockies, USA and is bounded by the Northern Region of the United States Department of Agriculture (USDA) Forest Service (Figure 1). It is defined by two factors: the presence of LPP [28] and inclusion in the flown portion of the USDA Forest Service Forest Health Protection Aerial Insect and Disease Detection Surveys (ADS) conducted between 1999 and 2014 [29]. ADS data were used to estimate severity of MPB-attacks at landscape level (see below for details), similar to methods used in Chapman, Veblen and Schoennagel [18], and are considered to be a conservative estimator of MPB-caused mortality across broad spatial areas [13]. All data are available in Williams et al. [30].
The majority of the study area is in the states of Montana and Idaho, but also includes small portions of Washington and Wyoming. While a broad range of forest types exists within the study area, this analysis was limited to forests containing LPP. LPP forests in this region occur at elevations of 1500–2500 m, with cold, wet winters and warm, dry summers. Temperatures can range from below −46 °C in winter to over 38 °C in the summer; annual precipitation ranges from less than 25 cm annually in the driest areas to over 86 cm annually in the wettest areas [31]. Host characteristics and attack severity were analyzed at the subwatershed scale within the study area. Subwatershed units are defined by National Hydrological Data 12 code hydrological unit boundaries (HUC12) [32].
We used vegetation data of LPP forest characteristics developed for a national-scale risk assessment of tree mortality due to major insects and diseases [28]. These 30-m resolution, forest parameter, geospatial datasets were produced from data collected on USDA Forest Service Forest Inventory and Analysis plots, sampled between 1999 and 2005 (some plots were sampled as late as 2009). The mean collection date used for the forest parameter data was 2002. Only live trees greater than or equal to 2.5 cm diameter at breast height were included in these data. Statistical modeling was used to interpolate vegetation between inventory plots based on additional non-vegetation GIS layers, such as soils, slope, aspect, and Landsat imagery (see [28] for detailed descriptions of vegetation and non-vegetation layer calculations). We utilized the following LPP forest parameter data from our study area: dominance in terms of proportion of total basal area, LPP basal area (BA), LPP density, LPP stand density index (SDI) [33], LPP quadratic mean diameter (QMD), and LPP presence (Table 1).
Five additional variables were developed from the LPP forest parameter and subwatershed unit data to create subwatershed-level values of LPP characteristics (Table 1): LPP area, LPP HUC extent, high BA, high dominance area, and large QMD. We identified thresholds for high BA (area with LPP basal area > 18.4 m2 ha−1), high dominance area (area with LPP dominance > 50%), and large QMD (area with LPP QMD > 20.3 cm) based on studies showing that forest with these host characteristics are more susceptible to MPB attack [8,18,19]. Mean values for dominance, BA, density, SDI and LPP HUC extent, and summed values for all other variables were calculated for each subwatershed unit. Landscape-scale age data were not available to incorporate into this analysis. All variables served as dependent variables in model development presented below.
Only subwatersheds which had aerial coverage in the ADS 1999–2014 (https://www.fs.usda.gov/detail/r1/forest-grasslandhealth/?cid=stelprdb5366459) and presence of LPP were included in the study. ADS spatial data includes polygons of insect attack by host species and an estimated number of attacked trees per hectare for each polygon [29]. Polygon size varied with the spatial distribution of MPB-caused tree mortality. The minimum polygon size was 0.8 ha and ranged up to 1000s of hectares, though the majority of polygons were less than 2 ha. We first calculated the characteristics described in Table 1 by attacked and unattacked LPP for each subwatershed and used Student’s t-tests to determine differences in LPP characteristics that had MPB-attack present versus those that had no MPB activity during the study period. This first analysis does not account for attack density or number of attacked trees within an area.
To account for attack density, we next estimated attack severity for each subwatershed in the study area by (1) aggregating ADS data from 1999–2014 to obtain cumulative estimates that aggregated severity of overlapping surveyed area through time; (2) converting cumulative severity estimated in ADS to broad mortality classes representing low ≤ 10%, moderate = 10%–30%, and high ≥ 30% mortality levels; and (3) creating a severity-weighted area value that effectively scaled the low and moderate severity class area to a high-severity baseline [34]. We did this to account for uncertainties in the ADS estimated number of attacked trees per polygon. This method integrates the areal footprint of damage mapped with the density of mortality into one measure to compare subwatersheds based on relatively more or less area mapped with high-severity MPB-caused mortality [34].
Cumulative attack severity was stratified into a low mortality class for ADS estimates that ranged from 1 to 25 trees ha−1, a moderate class where mortality ranged from >25 to 62 trees ha−1, and a high class where mortality was >62 trees ha−1. Then, area totals for polygons were reduced by a factor of 0.10 (90% reduction in area) for low mortality class and by a factor of 0.30 (70% reduction in area) for moderate class, with no reduction in area applied to the baseline high class. Scaling factors were derived based on relativity of respective low and moderate percent mortality class midpoints with the high mortality class baseline rounded to the nearest tenth (0.05/0.65 = low reduction factor, 0.2/0.65 = moderate) [34]. The severity-weighted area value was summed for each subwatershed to provide an estimate of the amount of area highly impacted by MPB within a subwatershed from 1999–2014.
To account for variability in subwatershed size, attack severity was then relativized as the proportion of total subwatershed area attacked. Based on exploratory analysis of the attack severity data, we used the 75th percentile value of 0.10 as the threshold to define a low or high subwatershed MPB attack severity (<0.10 = low, >0.10 = high). The categorical low/high subwatershed MPB attack severity class data served as the response variable in all models.
We used classification and regression trees (CART) [35] analysis to identify host characteristic splitting rules associated with attack severity. CART is ideally suited for description and prediction of landscape scale ecological patterns and processes because of its ability to handle complex data, create terminal nodes based on reduced variance, and variable interaction across temporal and spatial scales [36,37]. As an algorithmic classifier, CART it is not sensitive to violations in multivariate normality and independence that limit other parametric models [35].
Analysis was performed with R version 3.2.3 [38], package rpart [39]. We randomly selected 70% of the observations for model development and 30% for model validation. An over-fitted tree was created by setting the minimum number of observations per node to 10 and the cost-complexity parameter to 0.001. This tree was pruned to find the parsimonious model using the cost-complexity parameter that corresponded with the data split with the lowest cross-validation relative error. To assess the change to misclassification rate associated with more simplistic models, the over-fitted model was iteratively pruned using the cost-complexity parameter rates corresponding with each number of splits lower than the parsimonious model. We compared misclassification rates of the parsimonious and simplest models to evaluate how much external accuracy was lost by the reduction of model complexity.
The potential for silvicultural prescriptions to modify host susceptibility and improve host resistance to MPB outbreaks is limited by location and extent due to a variety of constraints. Certain federal land-use designations, such as Wilderness or Inventoried Roadless Area, prohibit tree removal. To examine the maximum potential area that could be managed to decrease forest susceptibility to severe MPB-attack, we calculated total LPP forest area, restricted forest area precluding treatment (Wilderness and Inventoried Roadless), and potentially treatable LPP forest area separately for all National Forests (as of 2002) in the USDA Forest Service Northern Region. Additional legal, administrative, physiographic, ecological, and economic constraints that would limit treatment activity or render treatments infeasible were beyond the scope of this coarse analysis and not considered.

3. Results

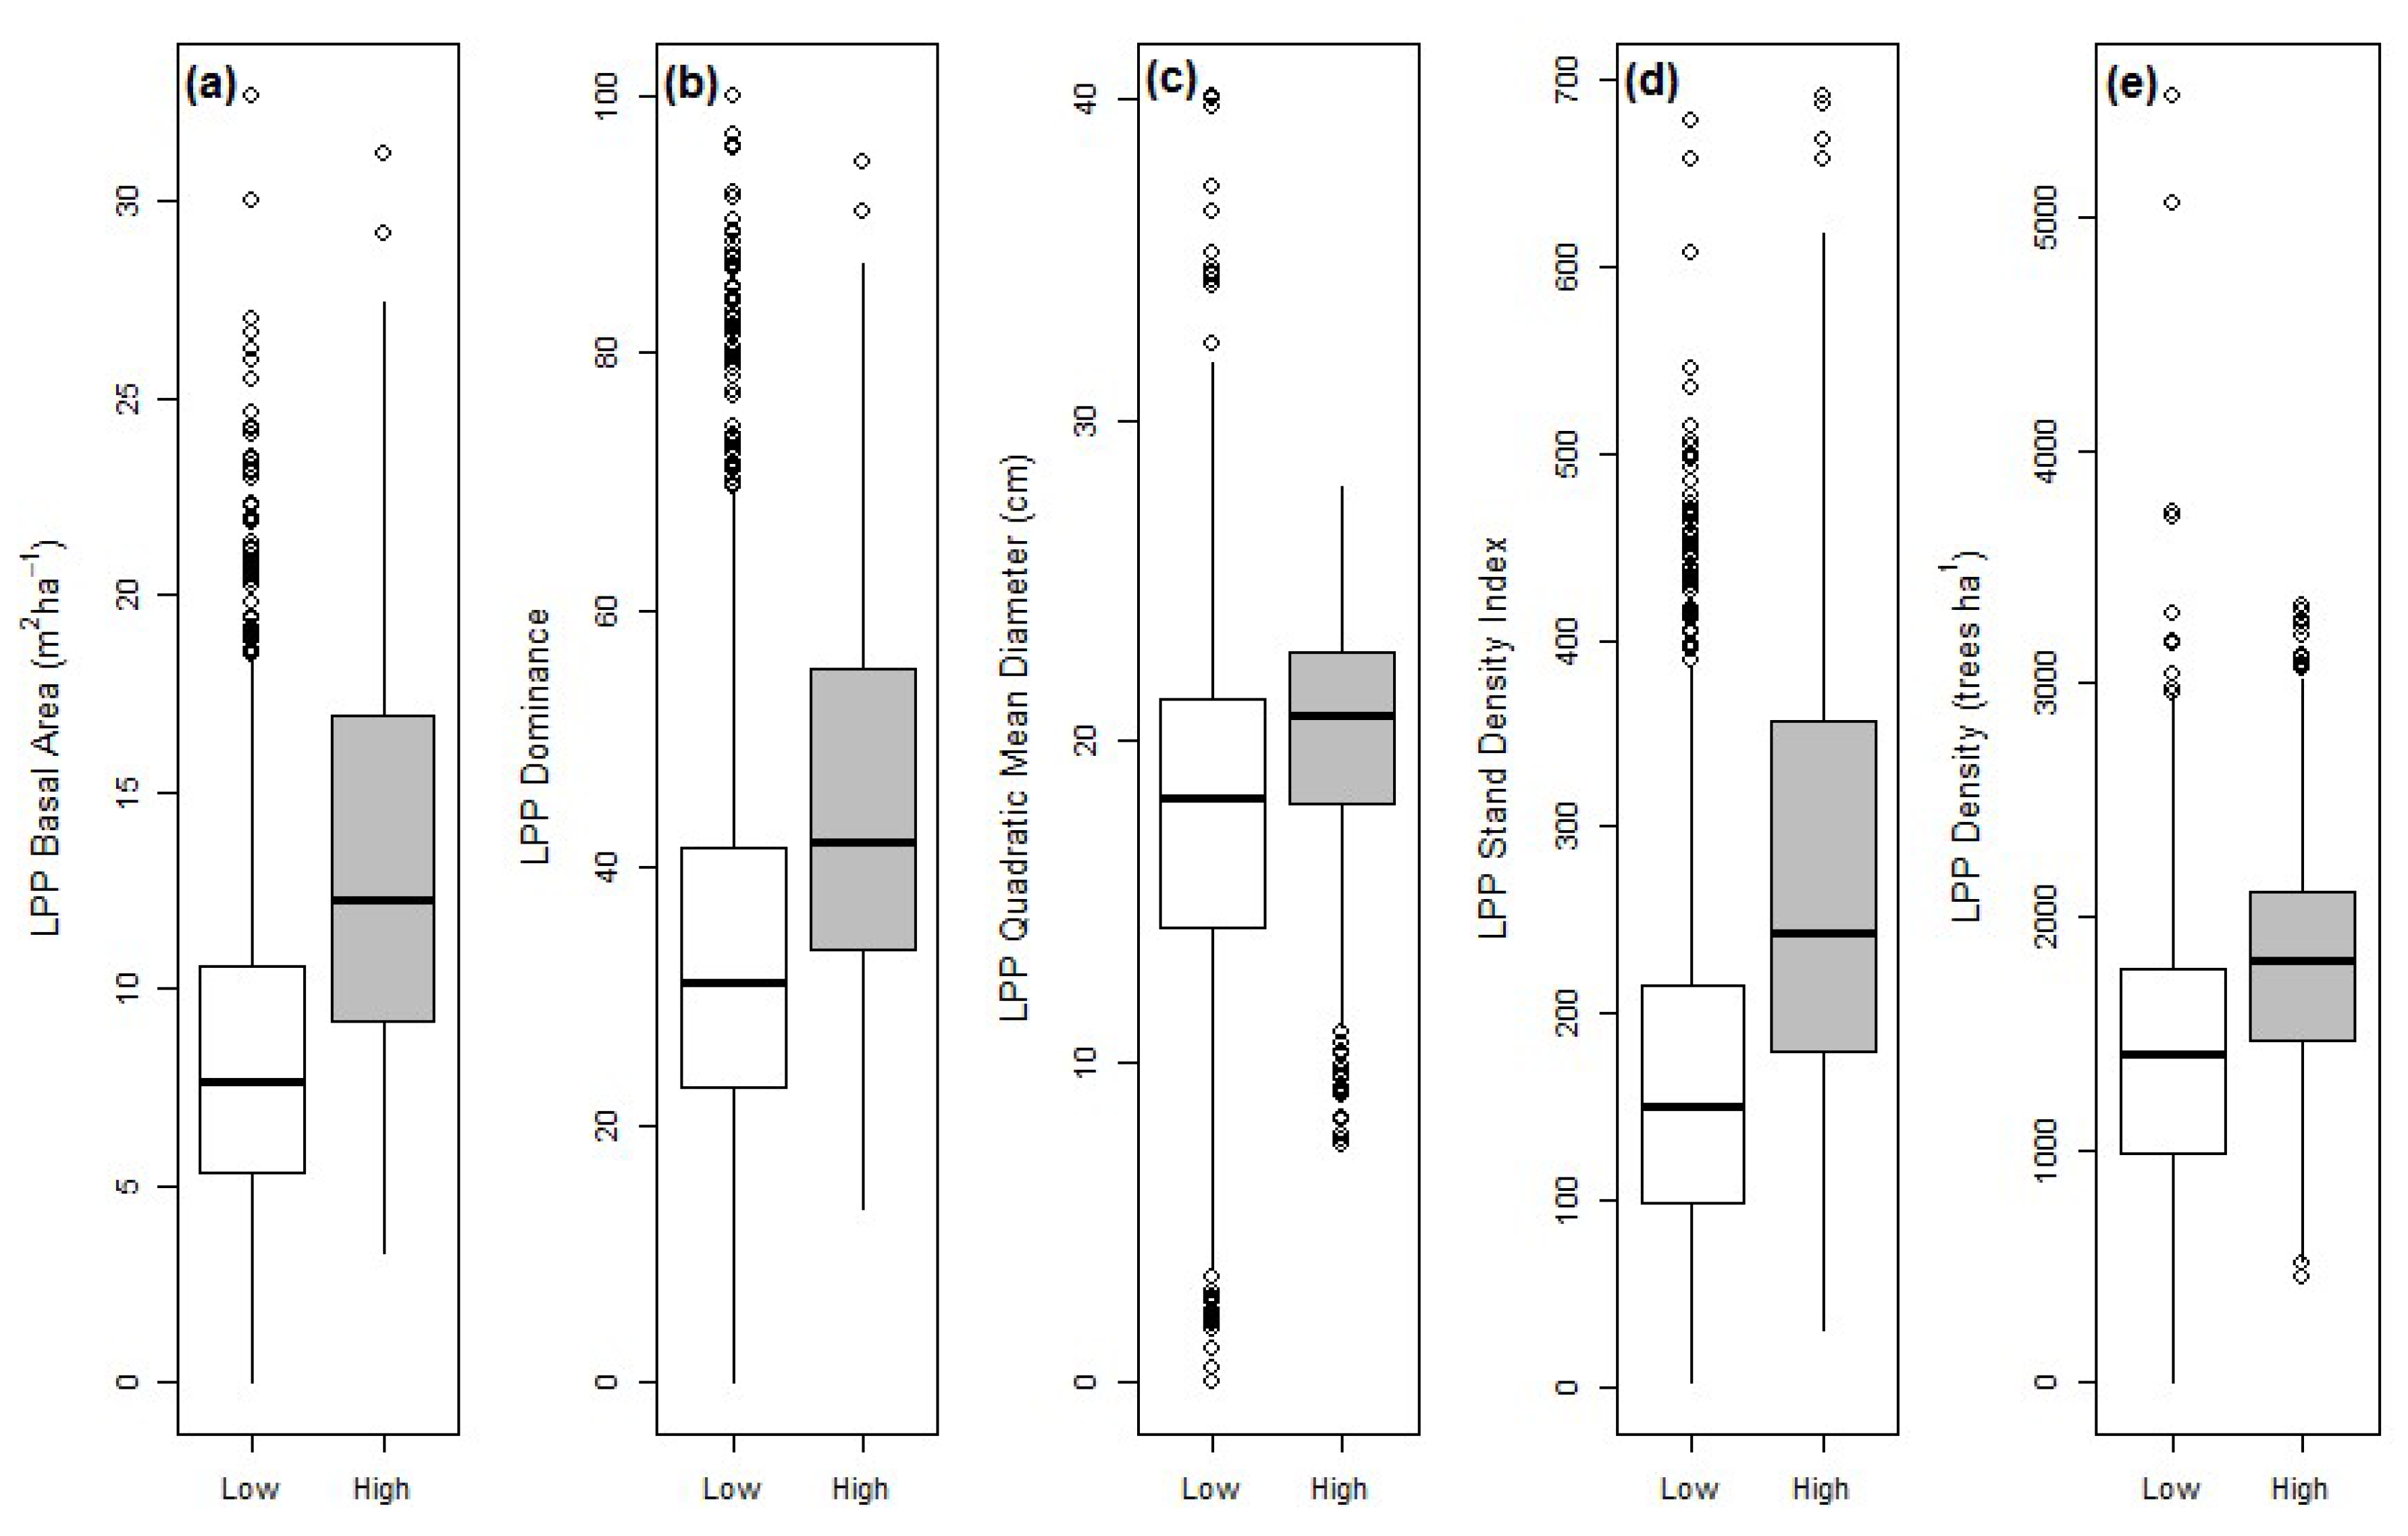
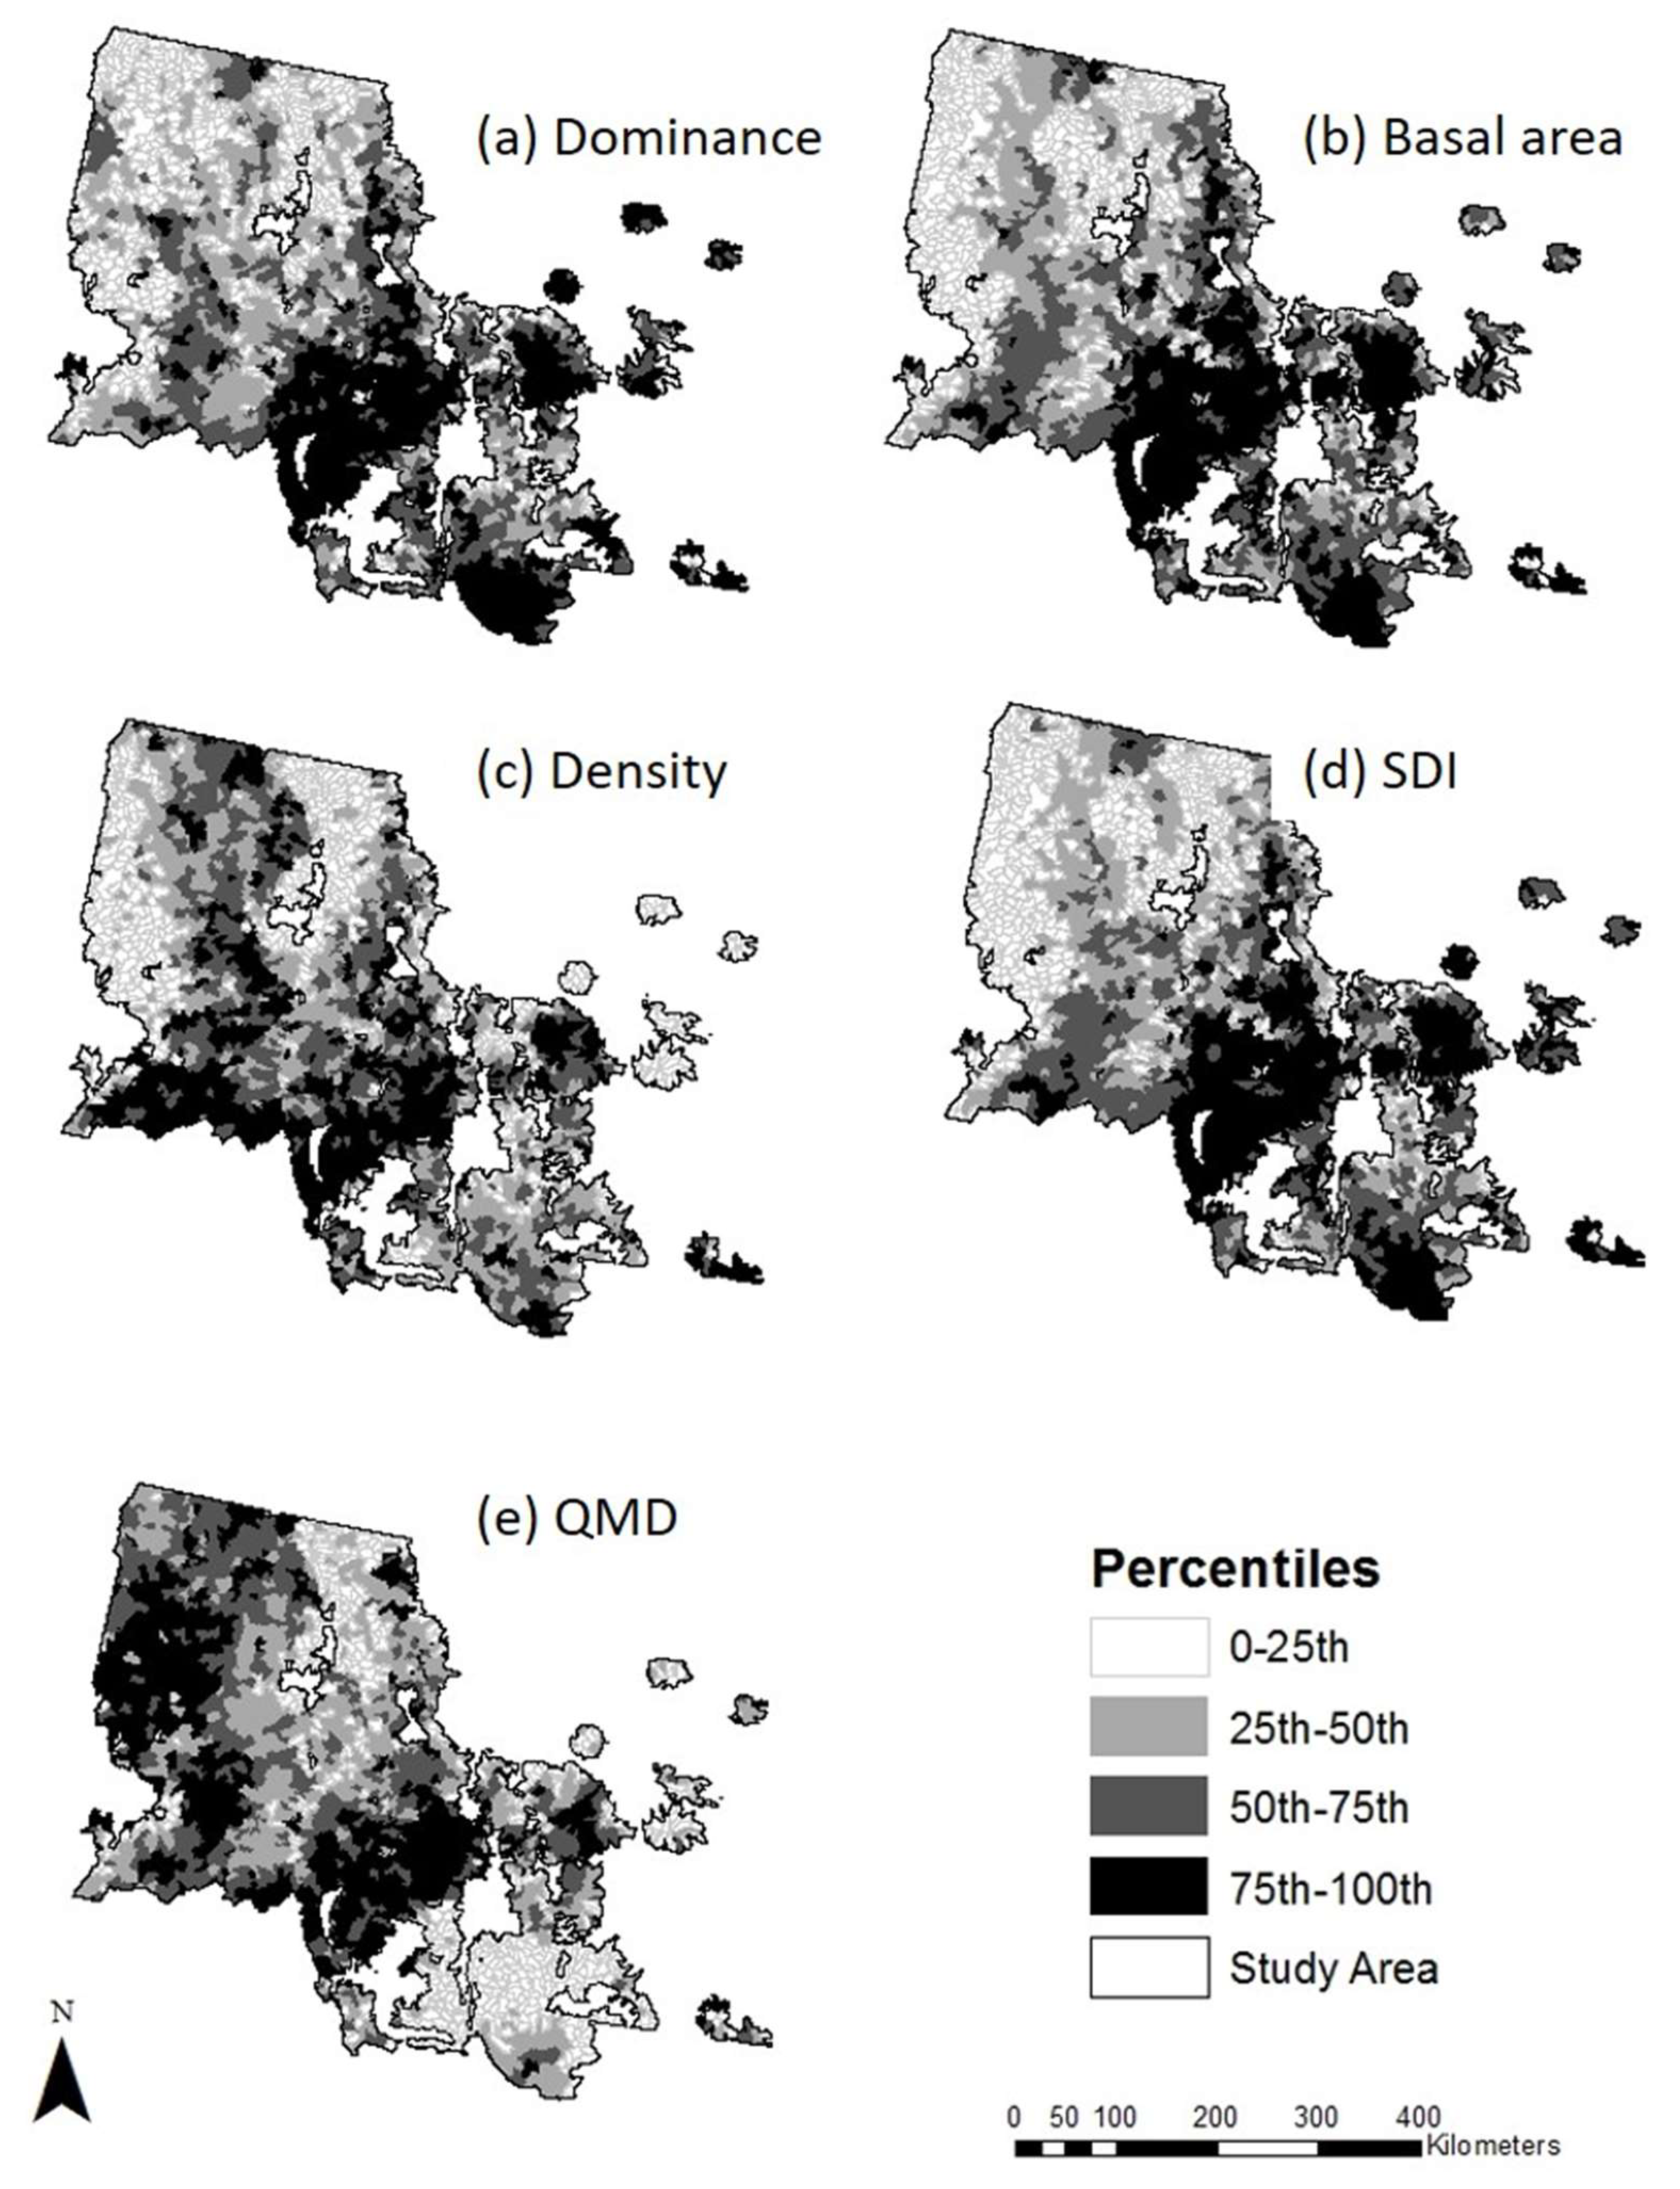
3.1. LPP Forest Attributes during the 2000s Outbreak

LPP host and forest characteristics in the Northern Rockies prior to the 2000s MPB outbreak varied greatly by subwatershed (Table 1). BA, dominance, QMD, SDI, and density were higher in LPP areas attacked by MPB compared to unattacked LPP areas within a subwatershed based on the ADS data of MPB-attack occurrence (Table 2).
Subwatersheds with higher values for BA, dominance, QMD, SDI, and density generally had higher attack severity during the 2000s outbreak (Figure 2). LPP characteristics were unevenly distributed across the study area; high values for all characteristics occurred in large patches in the south-central portion of the study area, and in smaller patches in the southwestern and southeastern portions (Figure 3).

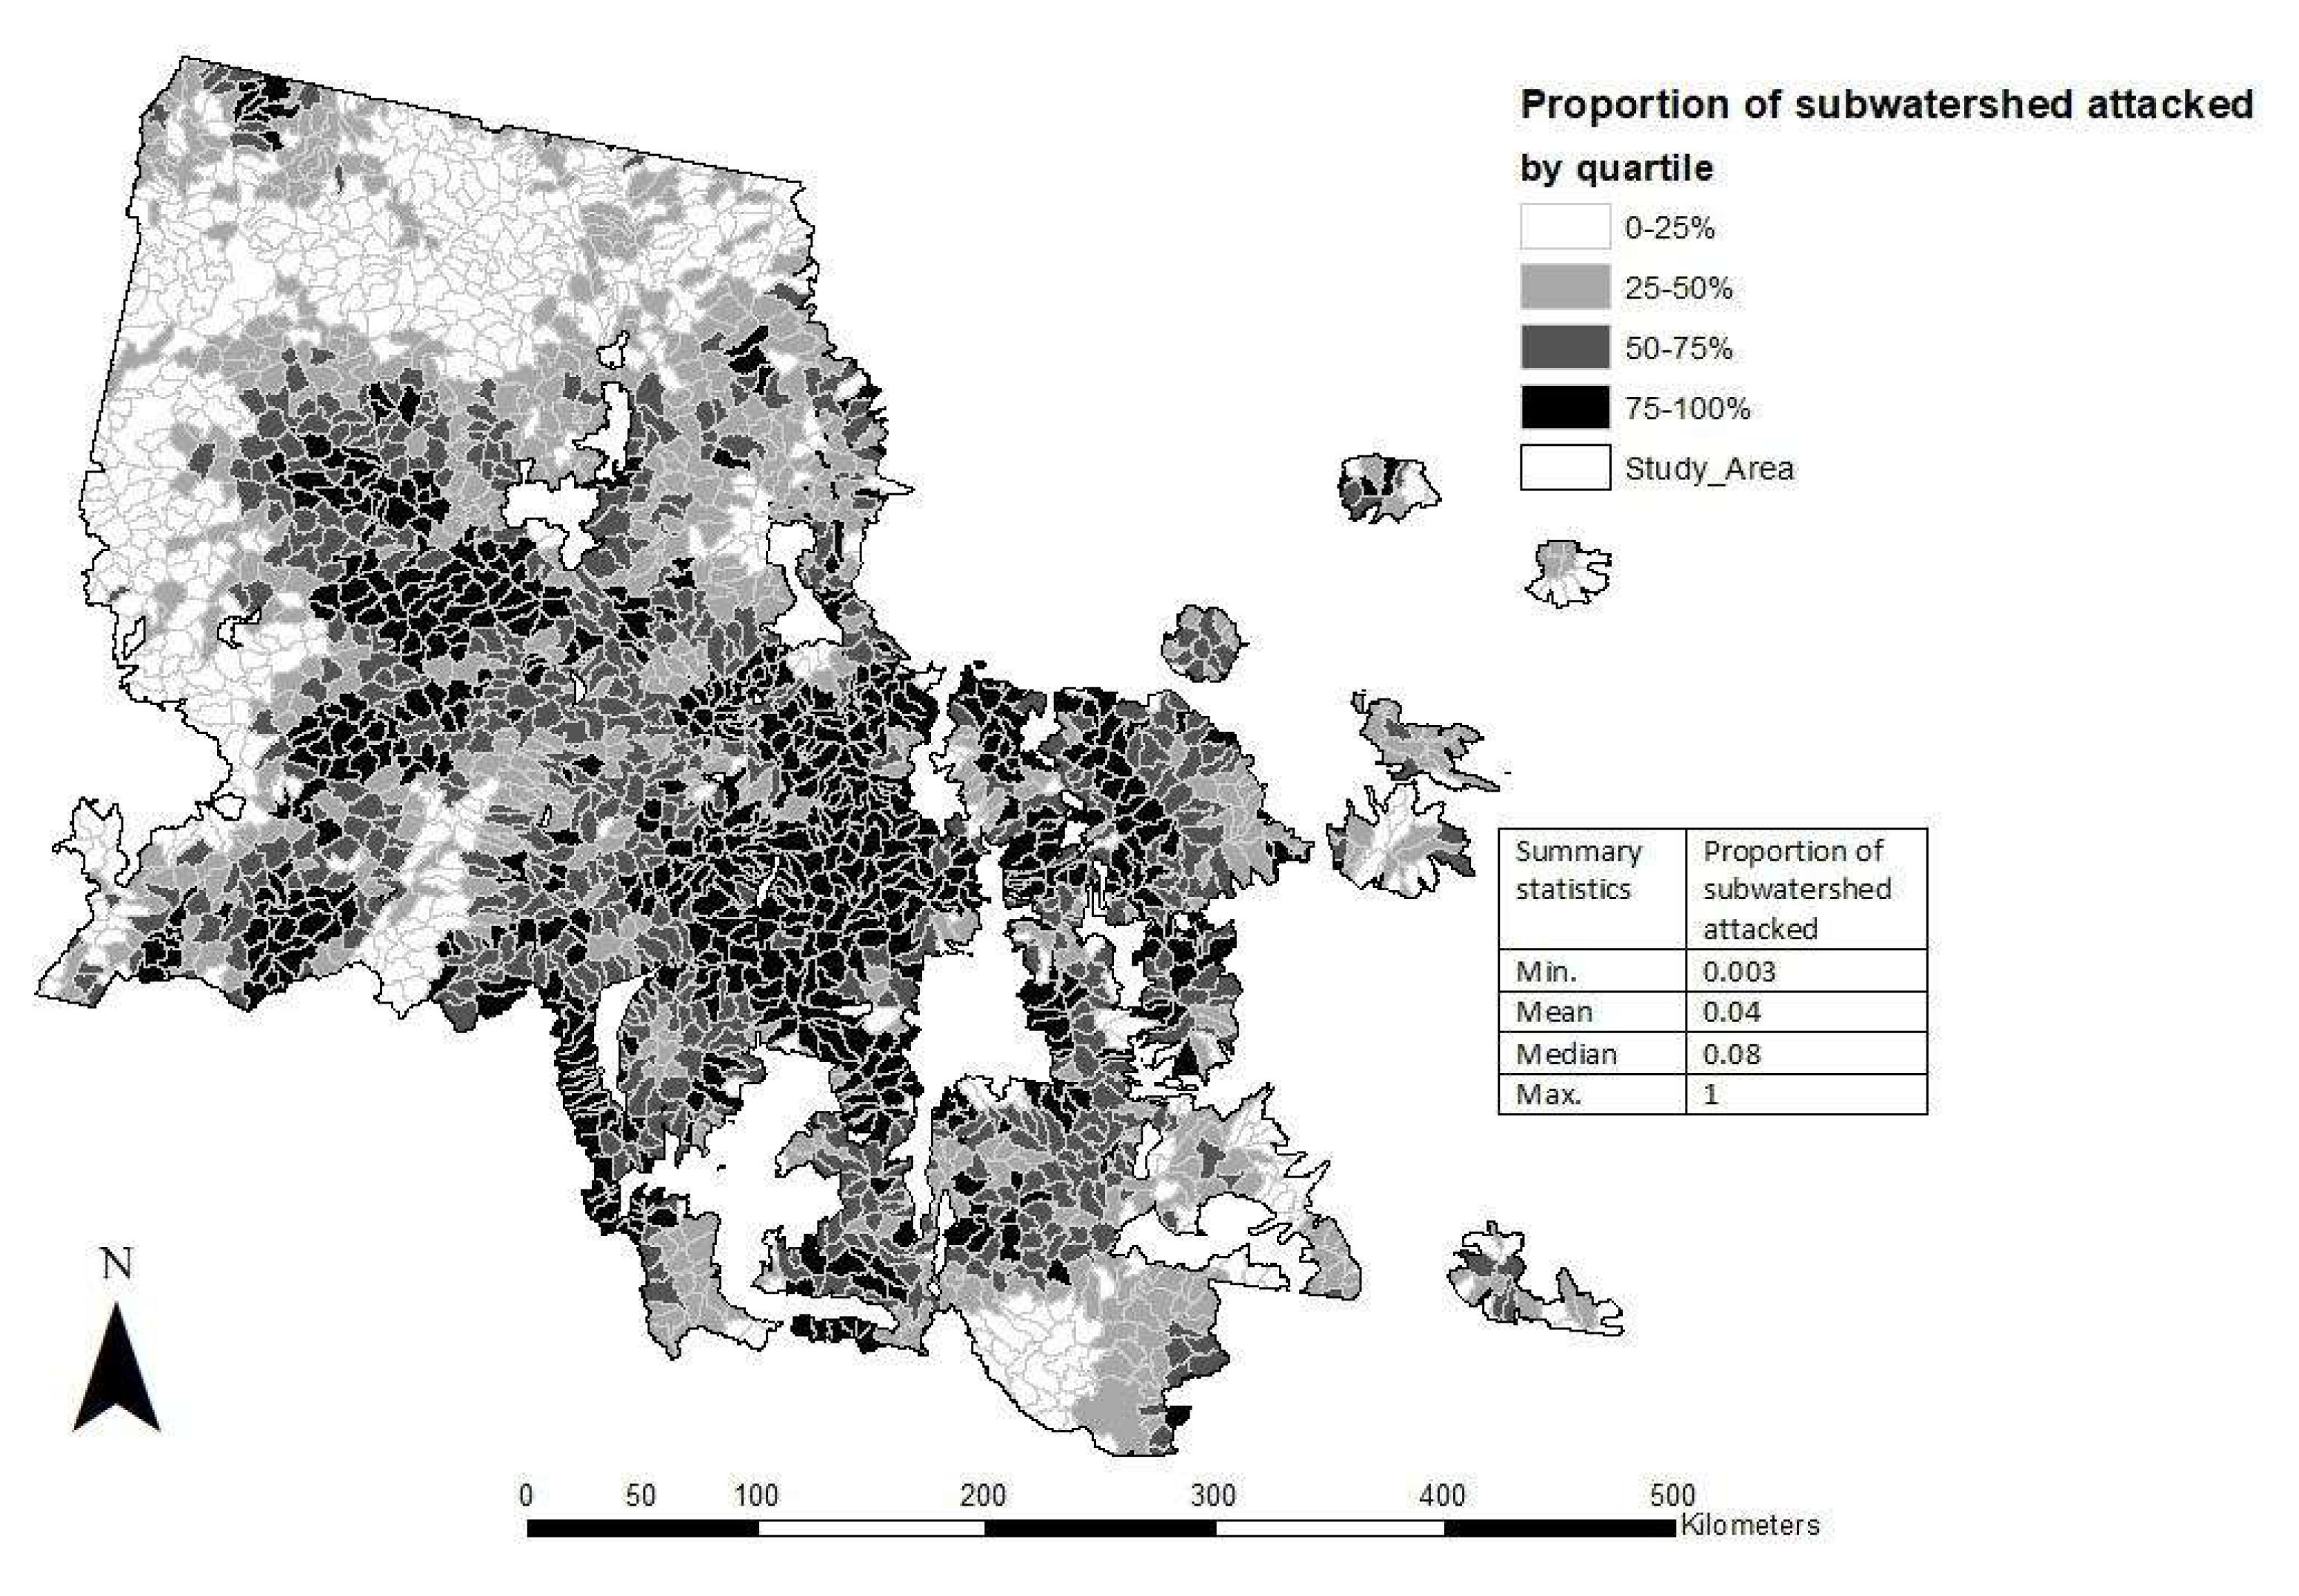
3.2. Subwatershed MPB Attack Severity during the 2000s Outbreak

Subwatershed MPB attack severity ranged from 0–1 with a median value of 0.08 and a mean value of 0.04. Of the 2262 subwatersheds assessed, 594 (26%) experienced high attack severity in the 2000s outbreak. Subwatersheds with attack severity in the 75th quartile were centrally concentrated in the study area with small clusters in the northwest and southeast (Figure 4). Severity was considered high where the proportion of subwatershed hectares with area-weighted high MPB-caused mortality was ≥0.1 (the 75th quartile), and was considered low below 0.1. Values were higher for all mean LPP characteristics for high attack severity subwatersheds compared to low attack severity subwatersheds (Table 3). Regions of high attack severity (i.e., large areal extent with high density of MPB-caused mortality) (Figure 4) generally correspond with the regions that had relatively higher mean forest attribute values, as shown in Figure 3.

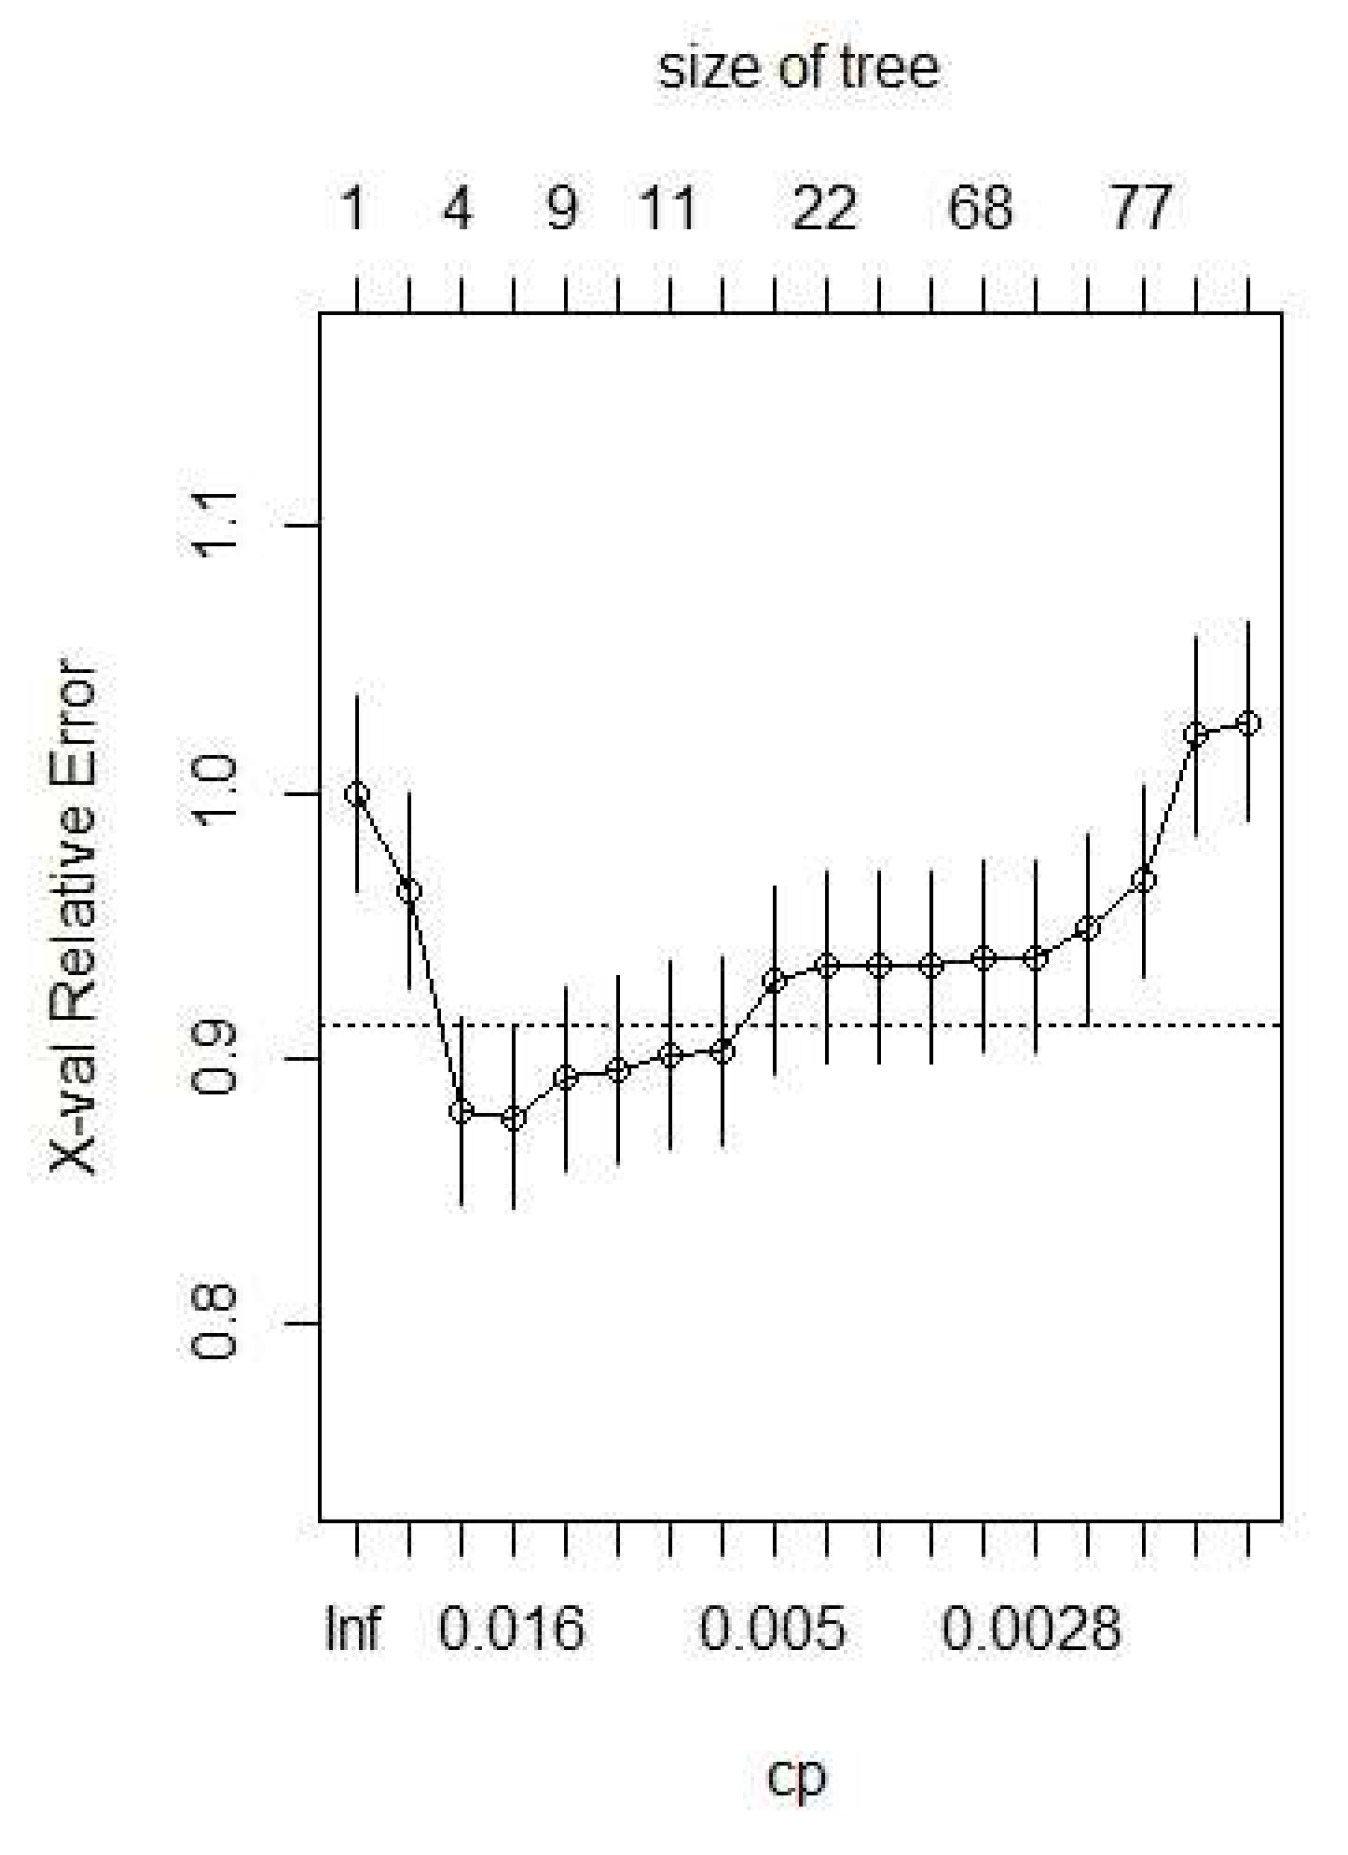
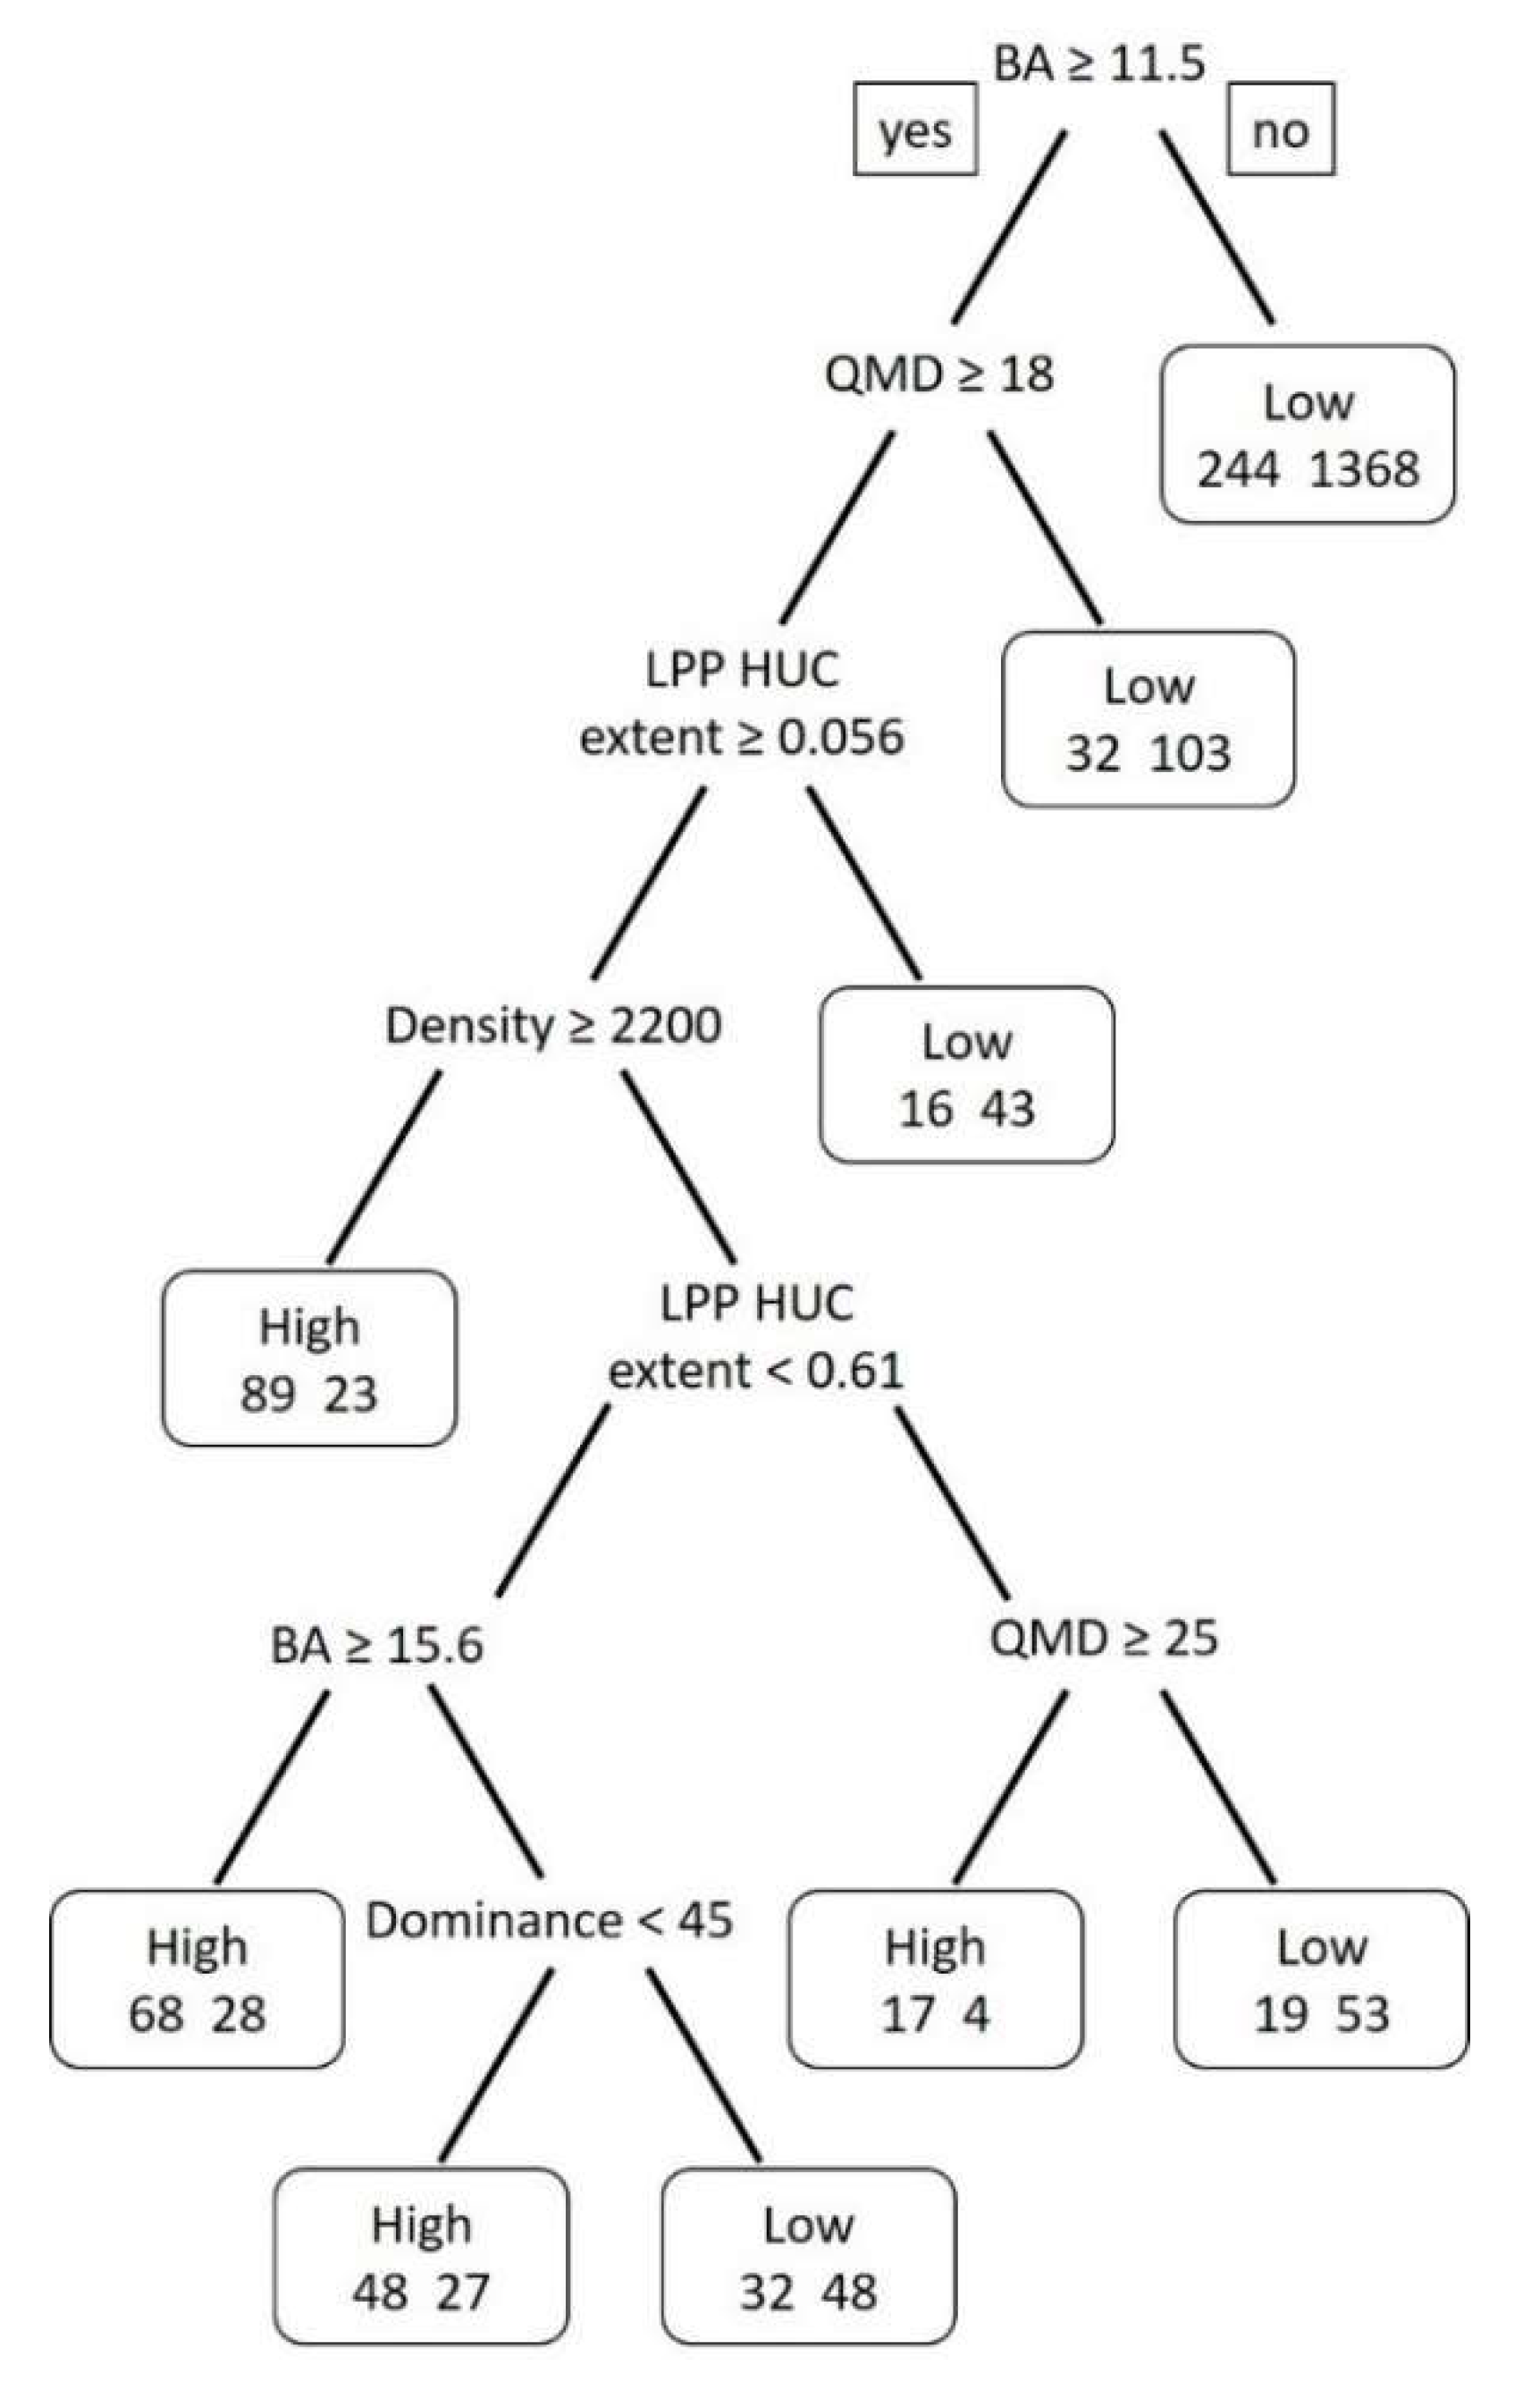
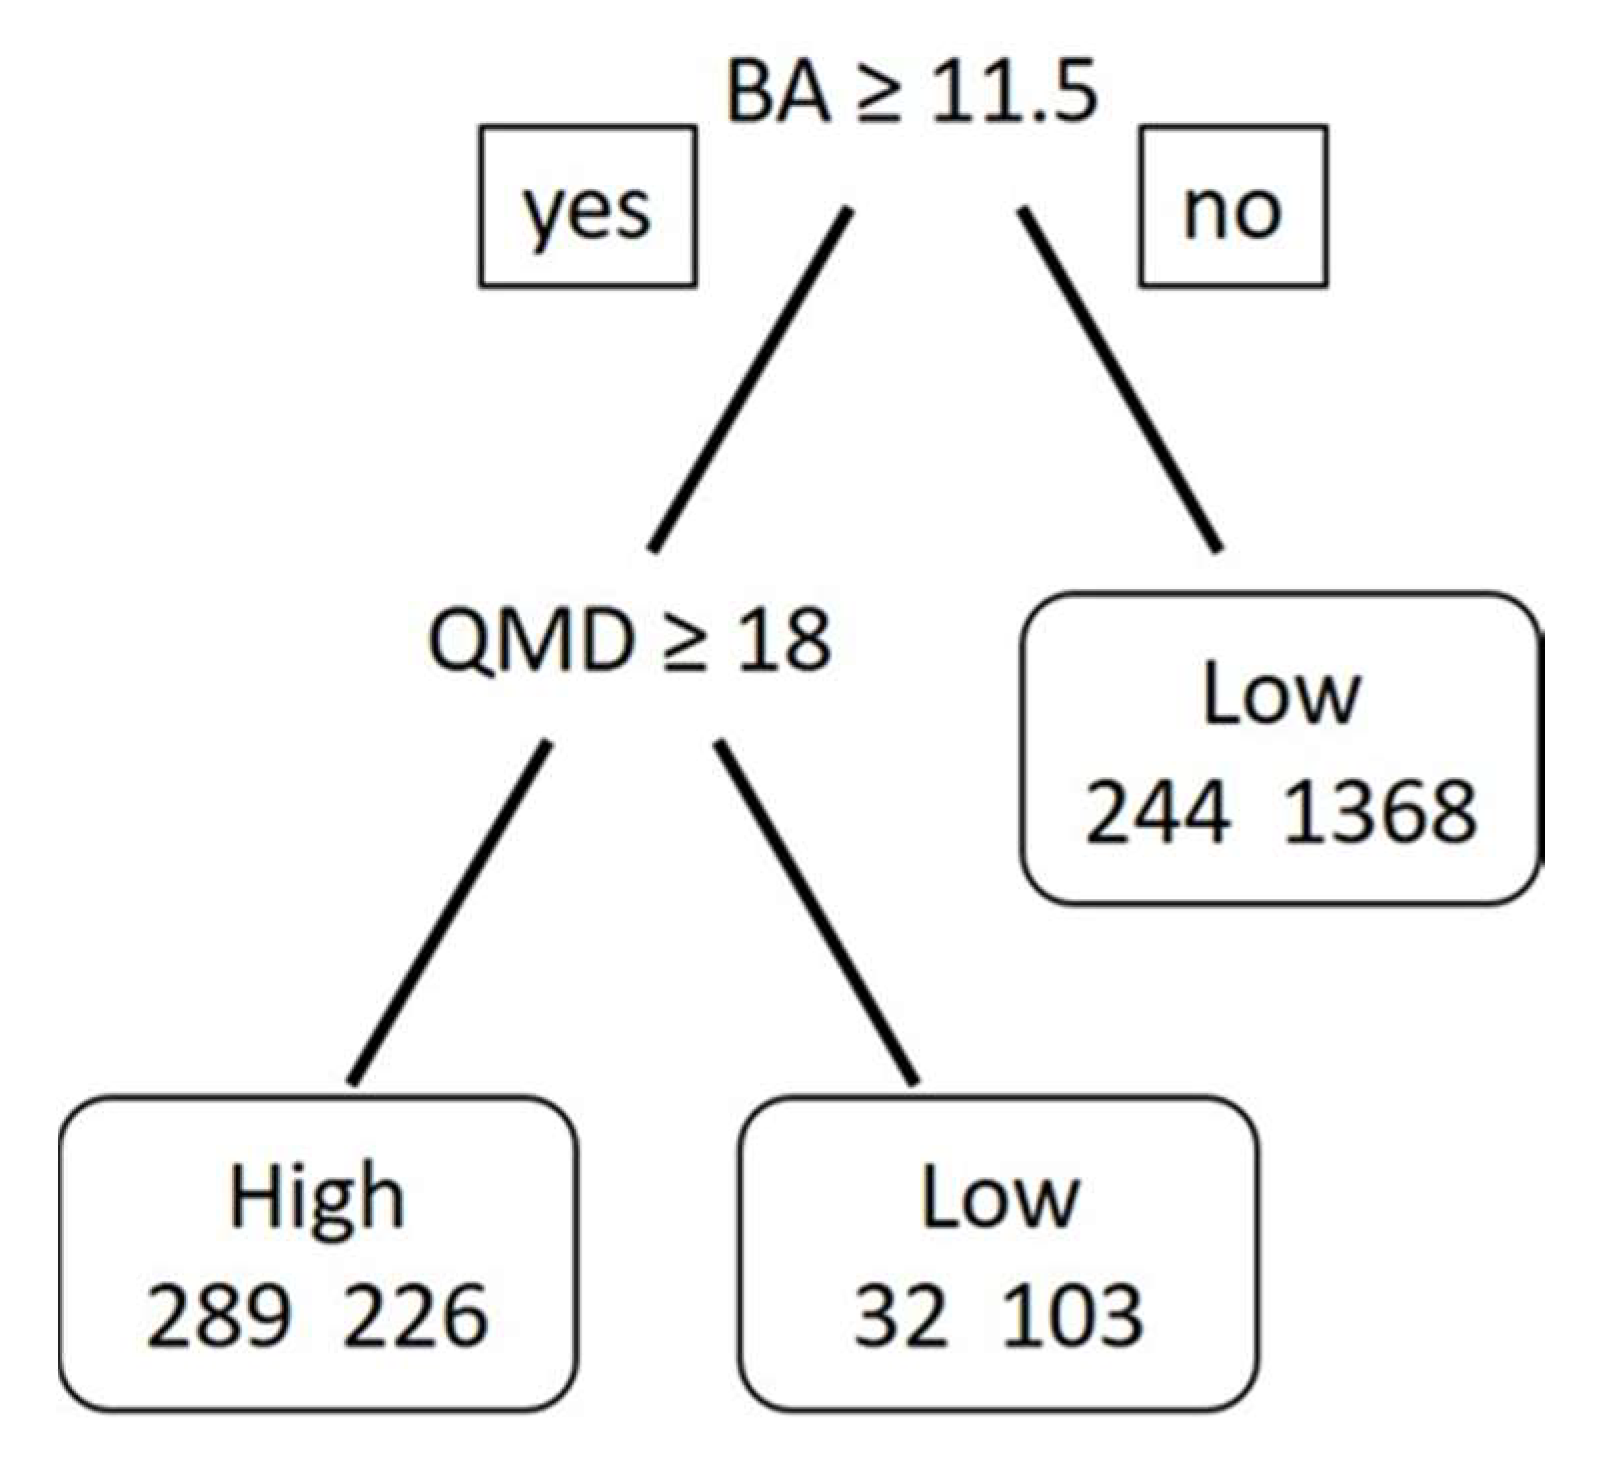
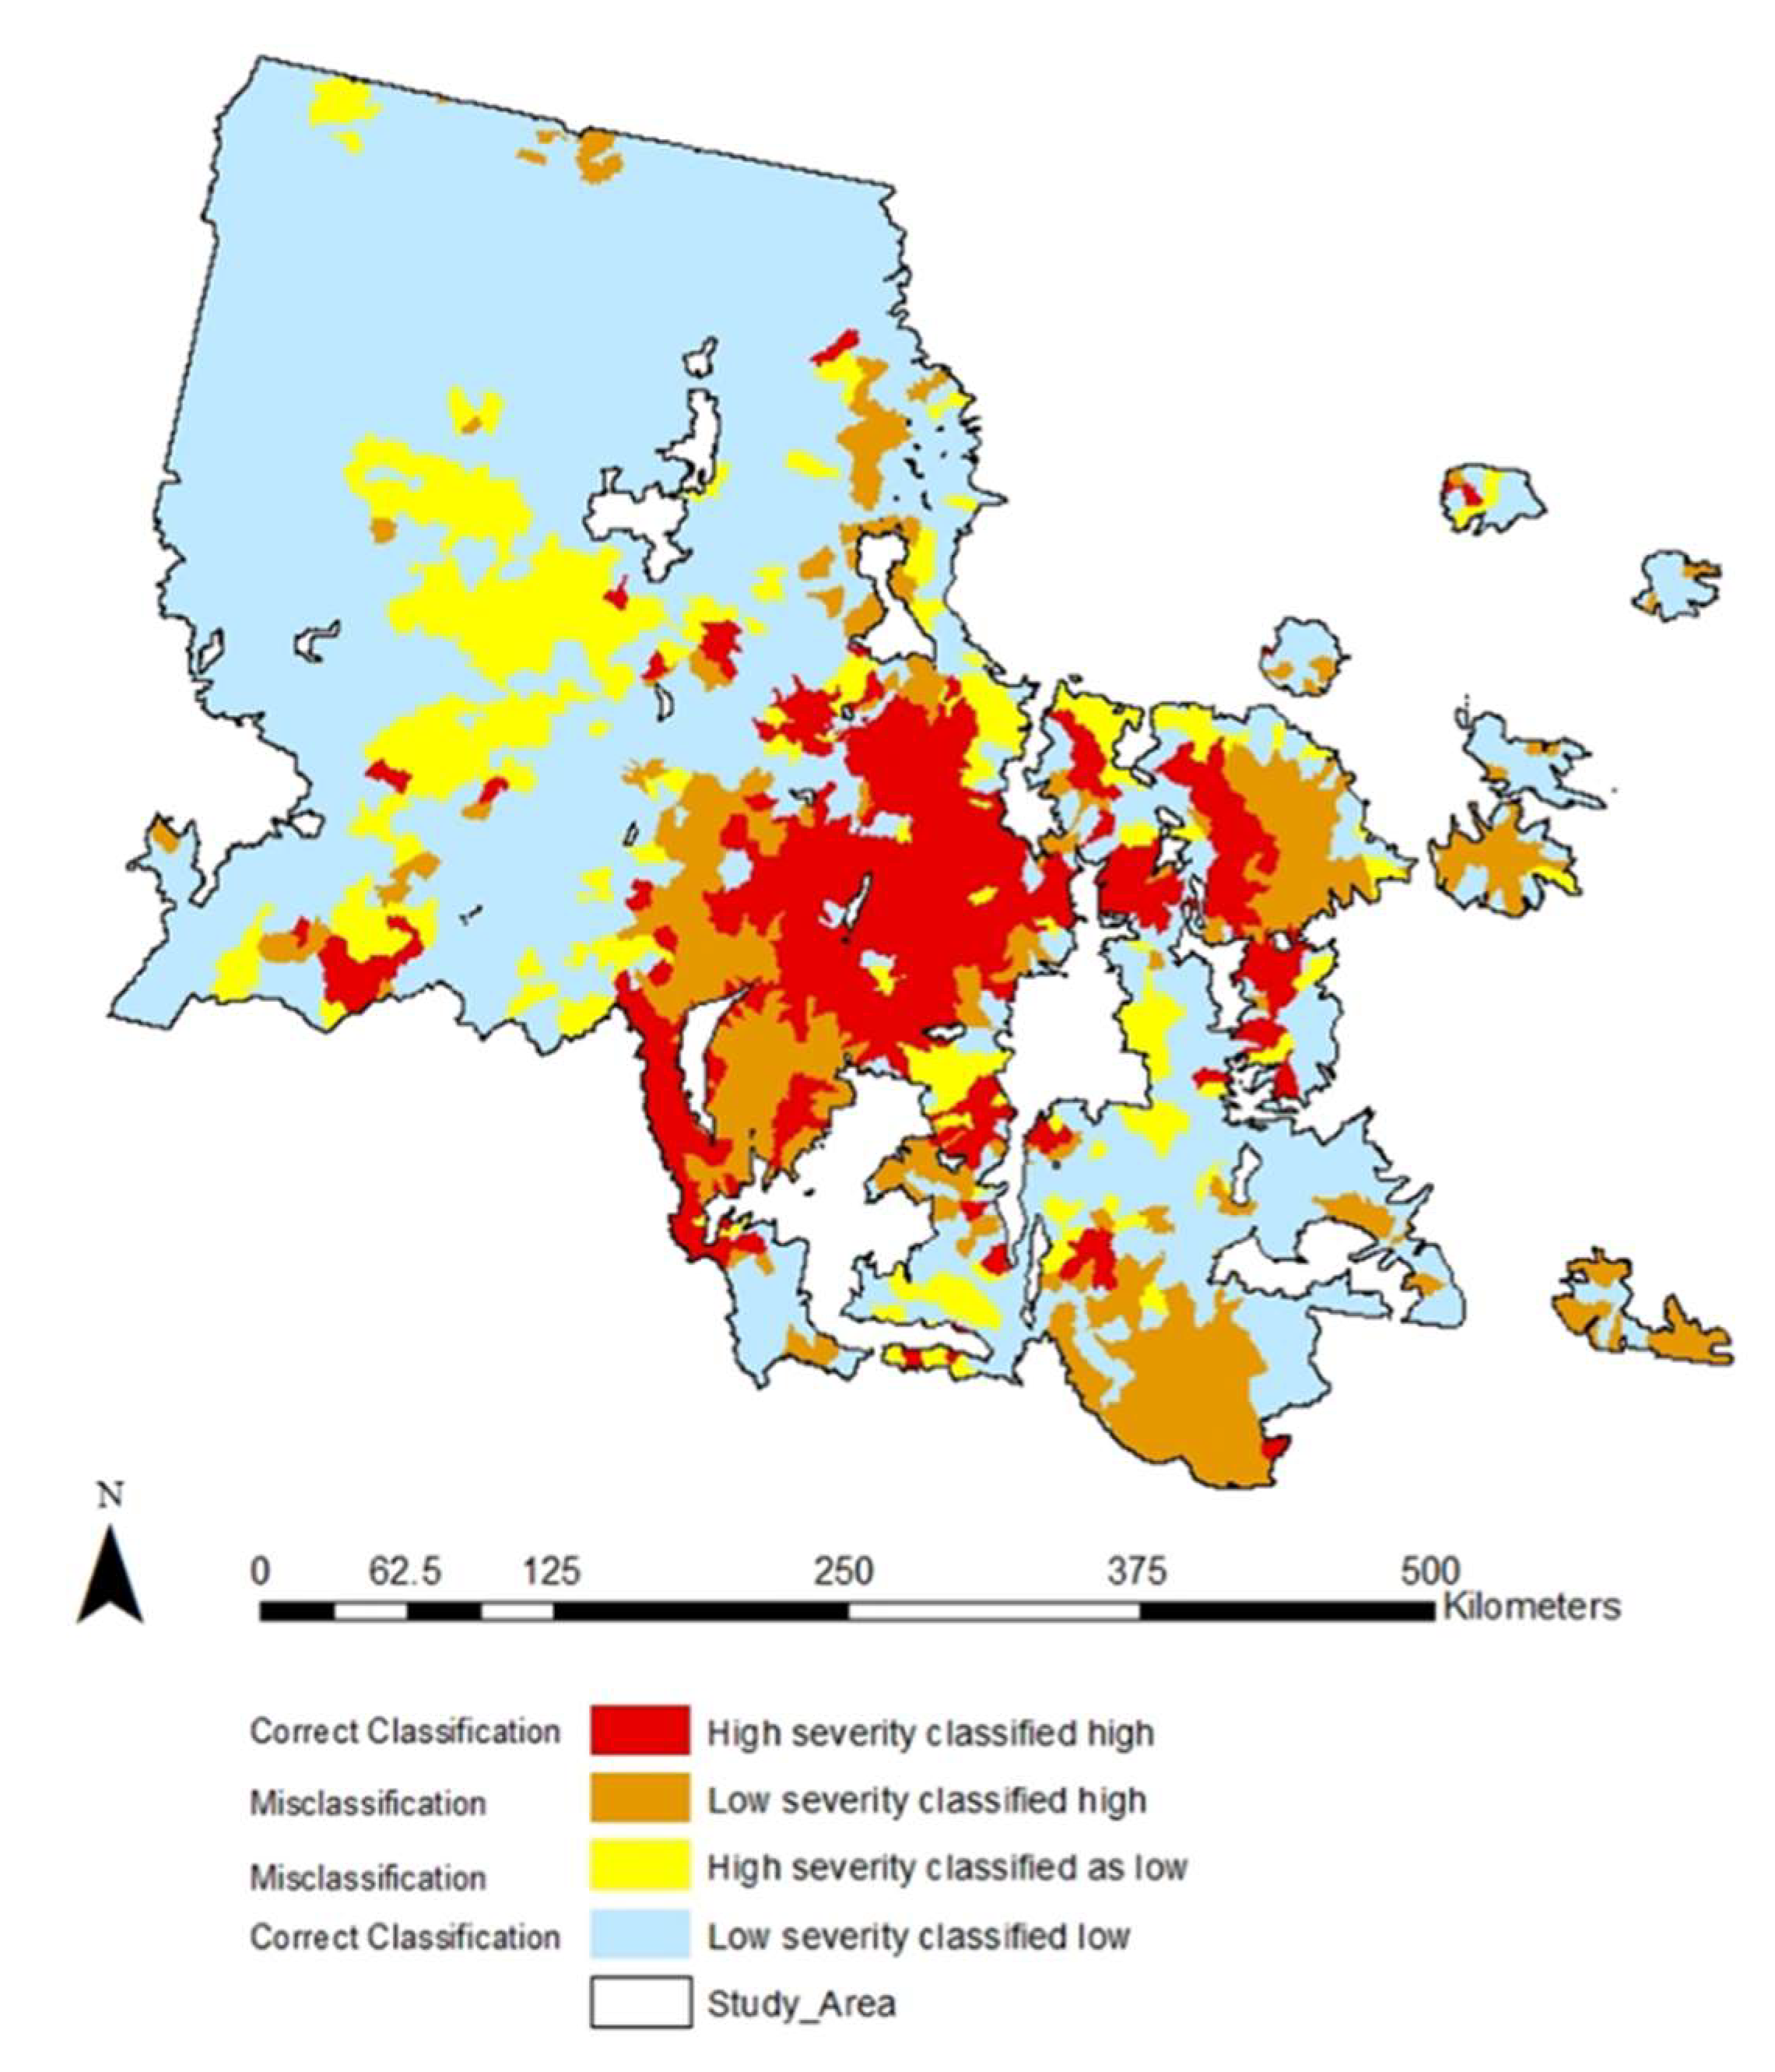
3.3. Modeling Results

The over-fitted model produced a tree with 118 data splits. It included all variables entered in the model and performed well, with a misclassification rate of 0.08. The over-fitted model (Figure A1) was then pruned to a tree with 9 terminal nodes, split on the following variables: BA, QMD, LPP HUC extent, density, and dominance (Figure A2). Out of the 2262 observations, 1873 were correctly classified and 425 were misclassified, for an overall internal misclassification rate of 18%. This loss of accuracy can be thought of as the cost of model simplification. The parsimonious model results suggest that subwatershed MPB attack severity is associated with subwatersheds with BA values ≥ 11.5 m2 ha−1, QMD ≥ 18 cm, LPP HUC extent ≥ 0.06 and density ≥ 2200 (89 of 222 correct high-severity attack predictions). Conversely, subwatershed MPB attack severity is most likely to be low in subwatersheds with BA < 11.5 m2 ha−1 (1368 of 1615 (84.7%) correct low-severity attack predictions).
Pruning the over-fitted model by decreasing the cost-complexity parameter values stepwise from the parsimonious model resulted in models with fewer data splits and increased misclassification rates (Table A1). The simplest model (Figure 5) reduced the number of data splits to two and produced a tree with three leaves split on BA and QMD. Out of the 2262 observations, 1760 were correctly classified and 502 were misclassified, for an overall internal misclassification rate of 22%. The simplest model suggests that subwatershed MPB attack severity is most likely to be high in subwatersheds with BA ≥ 11.5 m2 ha−1 and with QMD ≥ 18 cm (100% correctly classified as high). Conversely, this is likely to be low in subwatersheds with a BA < 11.5 m2 ha−1 (93% correctly classified as low). Using the validation dataset, the parsimonious model misclassified the withheld data at a rate of 23% and the simplest model misclassified the withheld values at a rate of 24% (Figure 6).
This CART analysis yielded several models with varying abilities to describe subwatershed MPB attack severity in our study area. The over-fitted model, with a misclassification rate of 8%, was the most accurate model. However, splitting the data more than 8 times resulted in increasing cross validation error, which suggests that despite the model’s high internal accuracy, its ability to describe external observations decreases with model complexity. The parsimonious model provides the lowest misclassification rate of 18% in addition to the lowest cross validation error rate (Table A1). This model describes observations from the sample dataset correctly 82% of the time and it is the best choice model for describing external observations relative to the other models.
While the parsimonious model is the most accurate, it is complex with 8 splits on BA, QMD, dominance, LPP HUC extent, density and SDI. Alternatively, the simplest model, with a misclassification rate and internal validation error only slightly higher than the parsimonious model (22% vs. 18%, and 0.96 vs. 0.85), had considerably fewer splits (2 vs. 8), making it the favorable model for classifying subwatershed MPB attack severity. Performing the same model selection process with a subset of the observations and testing the models on the withheld data resulted in a parsimonious model with a 23% misclassification rate, and the simplest model with a 24% misclassification rate. Therefore, the reduction in splits provided by the simplest model comes at a very low loss of accuracy in describing external data. The simplest model can be expected to make correct descriptions with a 76% probability on external data, and is a considerable improvement over the null model for a binary response variable (which inherently provides 50% accuracy).

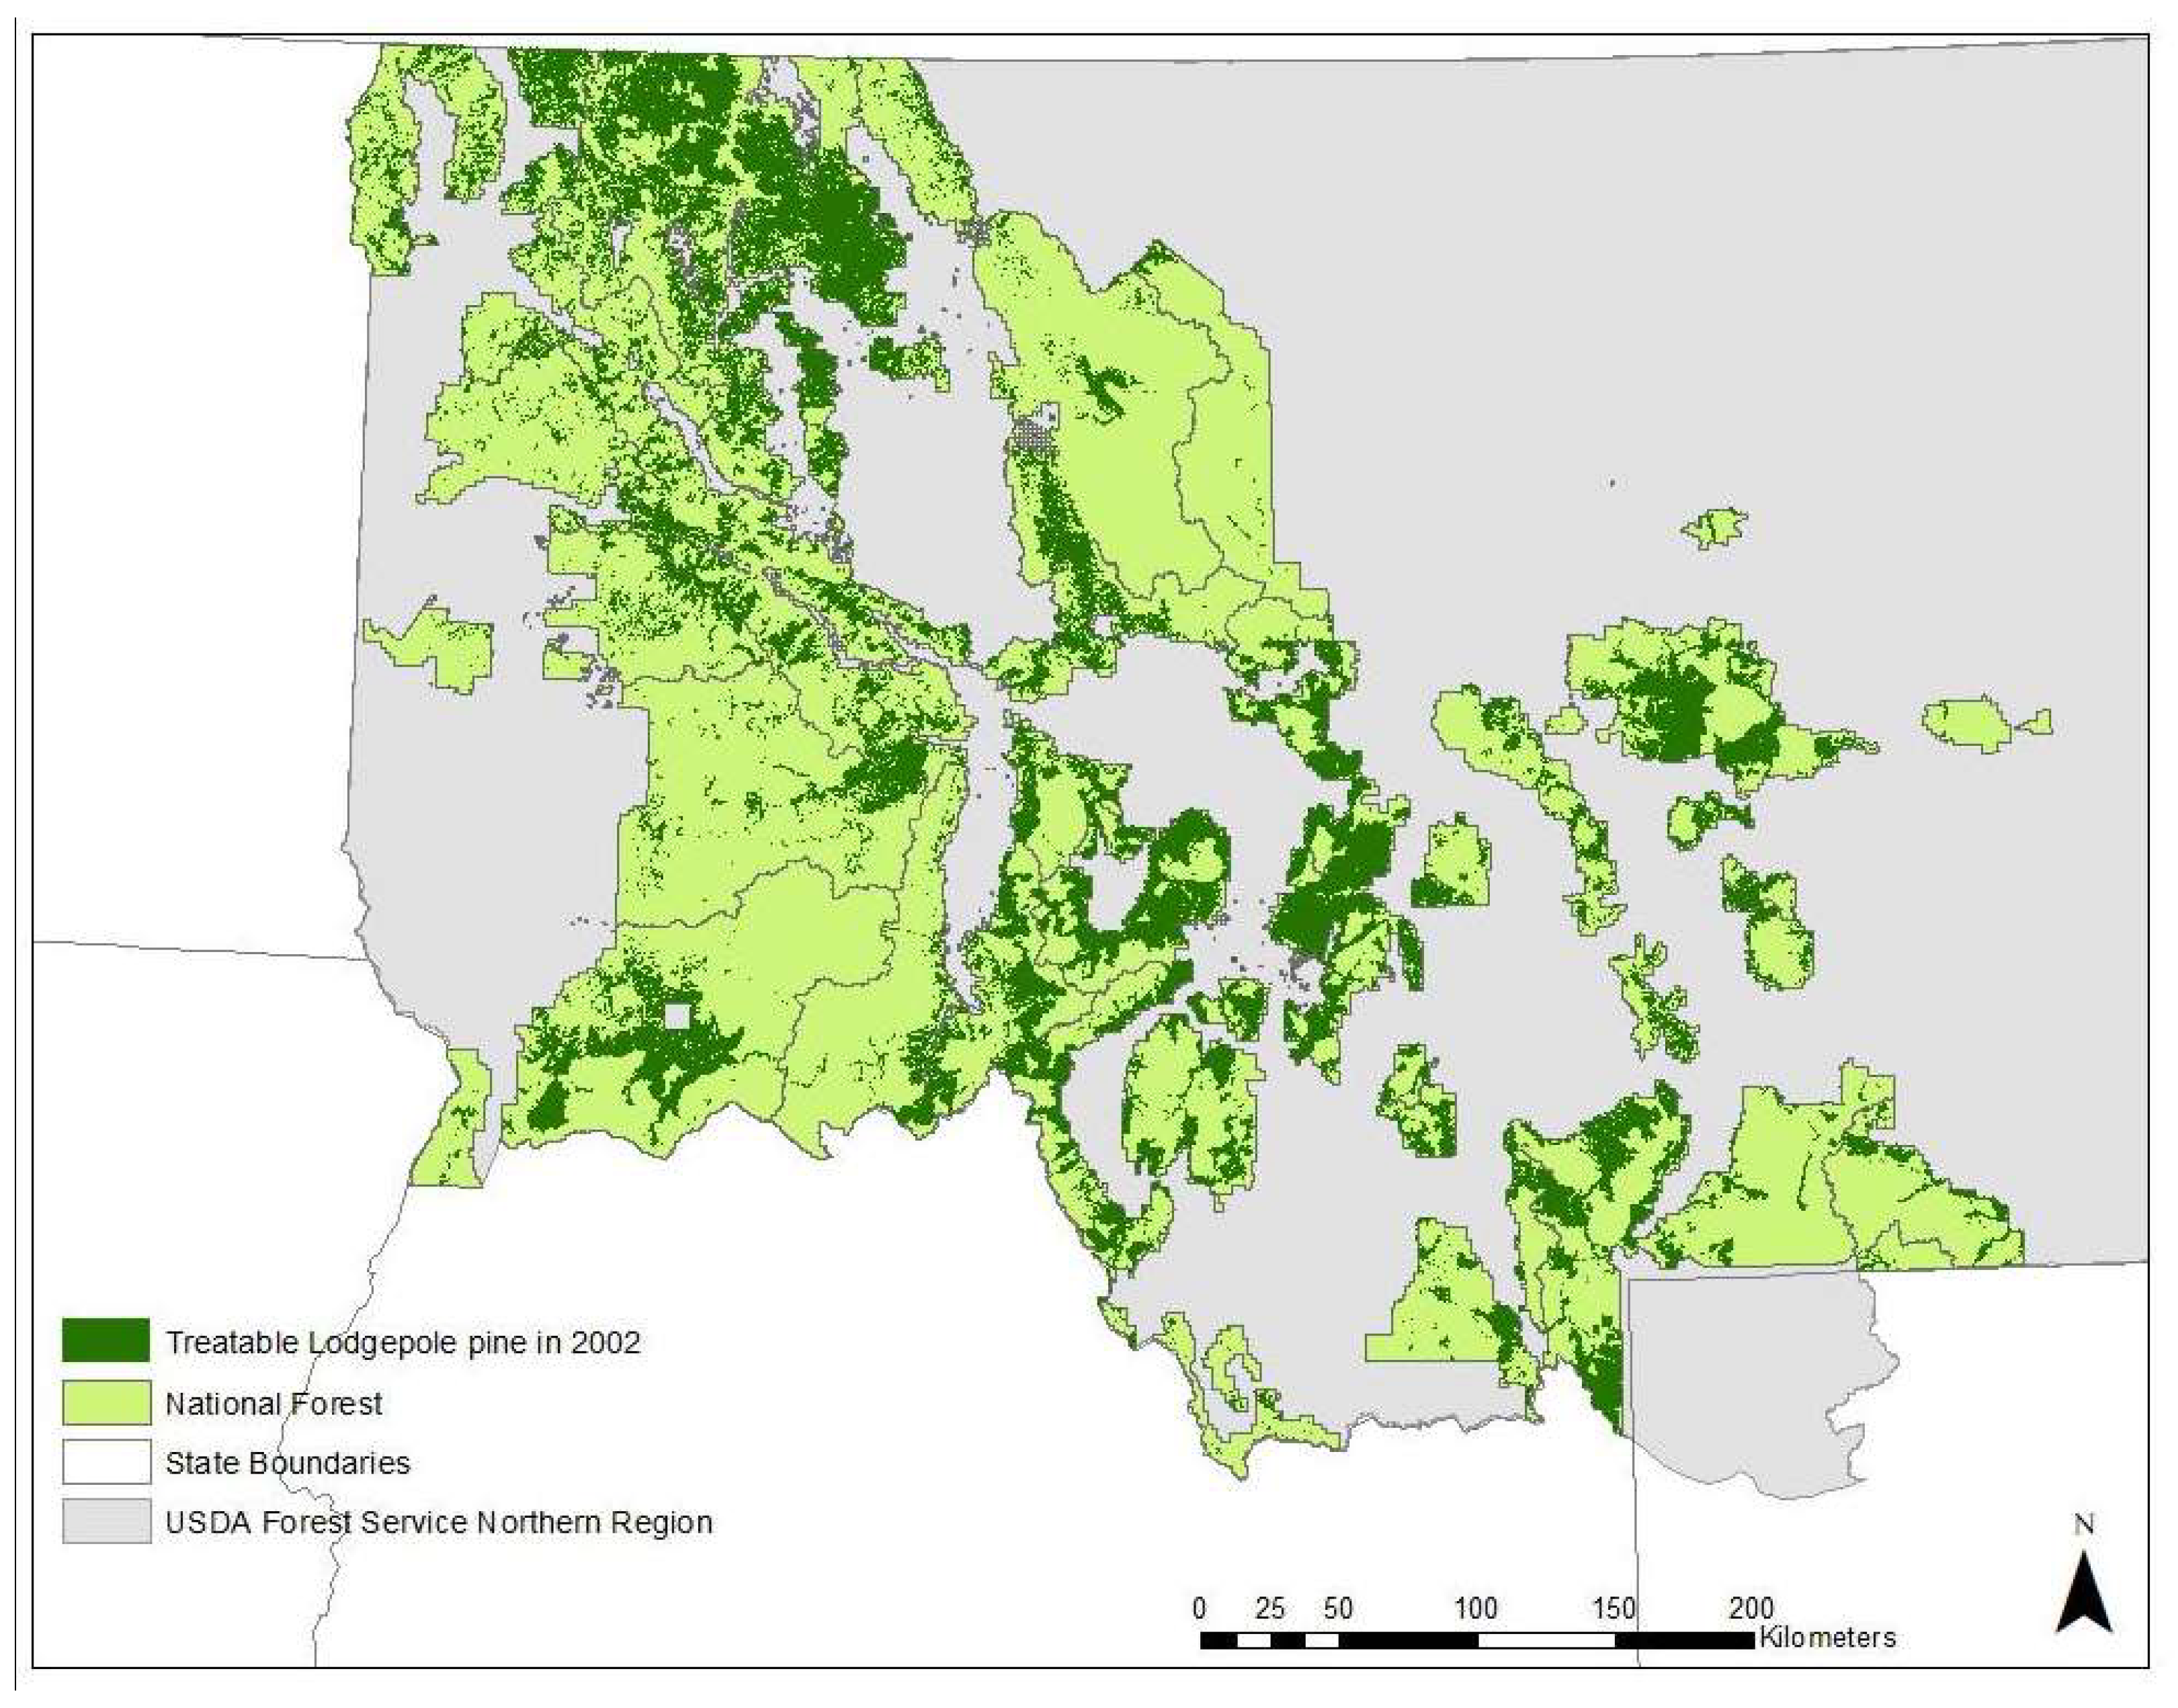
3.4. Potential for Treatment

Approximately 42% of National Forest LPP forestlands (where the probability of LPP occurrence is greater than or equal to 50%) in the USDA Forest Service Northern Region could potentially be treated to reduce forest susceptibility to severe MPB-attack (Table A2 and Figure 7). Management on the remaining 58% is restricted by legal constraints imposed by Wilderness or Inventoried Roadless Area designations. Unrestricted (potentially treatable) LPP forest areas range from 13% on the Clearwater National Forest to 76% on the Kootenai National Forest, with a median of 40% (Flathead National Forest) (Table A2).

4. Discussion

MPB outbreaks are triggered when favorable climate conditions and abundant susceptible host conditions occur simultaneously [1,4,17,40]. Our results highlight the importance of host forest characteristics in influencing MPB outbreak extent and severity at the landscape scale. The simplest model determined that during the 2000s outbreak in the Northern Rockies region, subwatersheds with high stocking comprised of larger trees were most vulnerable to high-severity attack. Our results showing the importance of subwatershed-level LPP basal area and tree diameter in susceptibility to MPB are consistent with numerous others studies in LPP at both stand and landscape scales [9,10,11,18,40,41]. Our more complex model also identified stand density (TPH) and host dominance (dominance) as important predictors of MPB-attack severity, which is in agreement with the landscape-scale studies by Nelson et al. [8] and Hicke and Jenkins [27]. We did not find a strong correlation between attack severity and the availability of large diameter LPP reported by Nelson et al. [8] and Simard et al. [10]. This discrepancy may be a reflection of differences in sampling techniques and attribute calculation. For example, [10] only sampled in stands with host trees ≥ 20 cm, while we used contiguous data with 30m resolution for all LPP forests in our study area. We did not calculate mean diameter of larger trees as in [8], but used the area of forest with a mean diameter ≥ 20 cm (Large QMD). Other studies have found positive correlations between MPB severity and canopy cover [18,42] and age [19,27,43]; however, we were not able to examine these attributes with our data.
Numerous risk and hazard models of stand susceptibility to MPB have been developed that include host characteristics ([44], for reviews see [45]). It is inherently difficult to predict MPB outbreak patterns and severity, and these models generally have low predictive accuracy of future attacks [44,46]. For example, though models are relatively good at identifying stands that are more likely to sustain higher mortality rates compared to low susceptibility stands when attacked, oftentimes the high susceptibility stands are not attacked or challenged by beetle population pressure during an outbreak (high false positive rates, but low false negative) [47]. Our hazard model can be used to identify subwatersheds that have LPP attributes associated with high susceptibility to MPB across landscape spatial scales. Our model applies to large spatial extents and should not be used for stand-level purposes. Rather, identifying highly susceptible subwatersheds can help prioritize general areas for potential treatments, especially where spatially extensive areas of contiguous, highly susceptible LPP occur, as spatial heterogeneity can limit MPB population increases [8]. Stand-level coupled hazard and risk models such as the Lodgepole Mountain Pine Beetle Impact Model in the Forest Vegetation Simulator [48] could then be used to prioritize areas within the subwatershed for treatment.
We show the importance of forest structure and composition in predicting MPB severity, but did not incorporate climate variables. Climate and host variables interact to influence on MPB population dynamics with effects that vary regionally [4,49]. Many studies have shown the importance of climate variables in predicting MPB outbreaks [5,6,18,50,51]. While the importance of climate is unquestionably important to understand MPB ecological dynamics in LPP systems, proactive forest management and natural disturbances such as past fires and bark beetle outbreaks that create heterogeneous forest conditions can help mitigate future outbreak extent and severity when MPB-favorable climatic conditions occur.
Our coarse assessment of USDA Forest Service National Forest administrative units indicated 42% of LPP-dominated forest area in Northern Region administrative units is not legally precluded from silvicultural treatment (i.e., Wilderness; Inventoried Roadless Areas) and can potentially be treated to manipulate forest attributes associated with high-severity MPB outbreaks. Precise estimates of treatable area would certainly reduce this percentage further as other legal constraints and fine-scale administrative, physiographic, ecological, and economic factors limit treatment feasibility. Yet, this indicates that silvicultural management of LPP forests is a viable option in many areas to reduce susceptibly to severe and widespread MPB outbreaks.
Management and disturbance regimes control vegetation occurrence and distribution, as prior bark beetle outbreaks and wildfire impact host and forest attributes [52]. In a non-spatial analysis of LPP in British Columbia, Canada, Taylor and Carroll [26] estimated that the proportion of MPB-susceptible LPP forests in 1990 was three times the amount in 1910, and attributed that result to forest management policies that excluded fire and allowed older and large diameter LPP forests to develop. Similar forest management policies practiced in the western United States during the same period may have had the same effect on age-class distribution of LPP in the Northern Rockies. Prioritizing management that enhances structural and age class diversity and focuses on subwatersheds with high BA and QMD in LPP may reduce susceptible host conditions related to severe MPB outbreaks [8].

5. Conclusions

Climate and host availability in the 2000s were sufficient to establish and maintain a large and destructive MPB outbreak in the Northern Rockies region, which affected to a greater extent subwatersheds with higher than regionally average BA and QMD. This research also indicates that stand-level data can successfully be scaled to the subwatershed level. Realizing that forest management comprises many objectives and that mountain pine beetle is a natural keystone disturbance agent in these forests, silvicultural treatment of sizable extents may help mitigate extensive mortality levels across large areas.

Author Contributions

Conceptualization, J.E., S.H., C.K, and J.N.; Methodology, S.H., H.W. and J.E.; Formal Analysis, H.W. and S.H. Data Curation, H.W. and S.H. Writing-Original Draft Preparation, H.W. and S.H.; Writing-Review & Editing, H.W., S.H., C.K., J.E., and J.N.; Funding Acquisition, J.E. and C.K.

Funding

This work was funded by the USDA Forest Service, Northern Region Forest Health Protection under Agreement 14-CS-11015600-046.

Conflicts of Interest

The authors declare no conflict of interest.

Appendix A

Table A1. Classification tree model results.
Classification
Tree Model
Data SplitsCross Validation ErrorCost ComplexityMisclassification Rate
1 a1181.030.0010.08
2 b80.850.010.18
340.870.0140.18
430.880.0180.19
5 c20.960.0480.22
a Over-fitted model, b Parsimonious model, c Simplest model.
Table A2. LPP forest areas (probability of LPP occurrence greater than 50%) for all National Forests in USDA Forest Service Northern Region (2002): Total LPP area, Restricted LPP area, and Treatable LPP area. Values are hectares (percent of total in parentheses). Restricted area includes lands designated as Wilderness Area or Inventoried Roadless Area; Treatable area is the remainder, and does not account for any additional administrative, physiographic, or economic constraints.
National ForestTotal LPPRestricted LPPTreatable LPP
Beaverhead274,115187,146 (68%)86,969 (32%)
Bitterroot90,59265,545 (72%)25,047 (28%)
Clearwater45,98639,976 (87%)6010 (13%)
Coeur d’Alene42201332 (32%)2888 (68%)
Custer20,11312,908 (64%)7205 (36%)
Deerlodge232,00280,540 (35%)151,462 (65%)
Flathead75,88645,335 (60%)30,551 (40%)
Gallatin122,97369,296 (56%)53,677 (44%)
Helena109,41165,180 (60%)44,231 (40%)
Kaniksu24,02211,651 (49%)12,371 (51%)
Kootenai72,58417,437 (24%)55,147 (76%)
Lewis & Clark161,003101,299 (63%)59,704 (37%)
Lolo102,96957,124 (55%)45,845 (45%)
Nez Perce96,49769,224 (72%)27,273 (28%)
St. Joe14,8639577 (64%)5286 (36%)
Northern Region Total1,447,236833,570 (58%)613,666 (42%)
Figure A1. Plot of the cross-validation relative error rate for trees of increasing size (top X-axis) and the corresponding cost-complexity values (bottom X-axis).
Forests 09 00552 g0a1
Figure A2. Parsimonious classification tree; misclassification rate 18%. In each box, the left value is the number of incorrectly classified subwatersheds and the right value is the number of correctly classified subwatersheds. Classification tree 1 in Table A1. See Table 1 for variable descriptions.
Forests 09 00552 g0a2

References

  1. Raffa, K.F.; Aukema, B.H.; Bentz, B.J.; Carroll, A.L.; Hicke, J.A.; Turner, M.G.; Romme, W.H. Cross-scale drivers of natural disturbances prone to anthropogenic amplification: The dynamics of bark beetle eruptions. Bioscience 2008, 58, 501–517. [Google Scholar] [CrossRef]
  2. Berryman, A.A.; Raffa, K.R.; Millstein, J.A.; Stenseth, N.C. Interaction dynamics of bark beetle aggregation and conifer defense rates. Oikos 1989, 56, 256–263. [Google Scholar] [CrossRef]
  3. Graham, R.T.; Asherin, L.A.; Battaglia, M.A.; Jain, T.; Mata, S.A. Mountain Pine Beetles: A Century of Knowledge, Control Attempts, and Impacts Central to the Black Hills; General Technical Report. RMRS-GTR-353; US Department of Agriculture, Forest Service, Rocky Mountain Research Station: Fort Collins, CO, USA, 2016; p. 193. [Google Scholar]
  4. Creeden, E.P.; Hicke, J.A.; Buotte, P.C. Climate, weather, and recent mountain pine beetle outbreaks in the western United States. For. Ecol. Manag. 2014, 312, 239–251. [Google Scholar] [CrossRef]
  5. Aukema, B.H.; Carroll, A.L.; Zheng, Y.; Zhu, J.; Raffa, K.F.; Dan Moore, R.; Stahl, K.; Taylor, S.W. Movement of outbreak populations of mountain pine beetle: Influences of spatiotemporal patterns and climate. Ecography 2008, 31, 348–358. [Google Scholar] [CrossRef]
  6. Preisler, H.K.; Hicke, J.A.; Ager, A.A.; Hayes, J.L. Climate and weather influences on spatial temporal patterns of mountain pine beetle populations in Washington and Oregon. Ecology 2012, 93, 2421–2434. [Google Scholar] [CrossRef] [PubMed]
  7. Sambaraju, K.R.; Carroll, A.L.; Zhu, J.; Stahl, K.; Moore, R.D.; Aukema, B.H. Climate change could alter the distribution of mountain pine beetle outbreaks in western Canada. Ecography 2012, 35, 211–223. [Google Scholar] [CrossRef]
  8. Nelson, K.; Rocca, M.; Diskin, M.; Aoki, C.; Romme, W. Predictors of bark beetle activity and scale-dependent spatial heterogeneity change during the course of an outbreak in a subalpine forest. Landsc. Ecol. 2014, 29, 97–109. [Google Scholar] [CrossRef]
  9. Kashian, D.M.; Jackson, R.M.; Lyons, H.D. Forest structure altered by mountain pine beetle outbreaks affects subsequent attack in a Wyoming lodgepole pine forest, USA. Can. J. For. Res. 2011, 41, 2403–2412. [Google Scholar] [CrossRef]
  10. Simard, M.; Powell, E.N.; Raffa, K.F.; Turner, M.G. What explains landscape patterns of tree mortality caused by bark beetle outbreaks in greater Yellowstone? Glob. Ecol. Biogeogr. 2012, 21, 556–567. [Google Scholar] [CrossRef]
  11. Klutsch, J.G.; Negron, J.F.; Costello, S.L.; Rhoades, C.C.; West, D.R.; Popp, J.; Caissie, R. Stand characteristics and downed woody debris accumulations associated with a mountain pine beetle (Dendroctonus ponderosae Hopkins) outbreak in Colorado. For. Ecol. Manag. 2009, 258, 641–649. [Google Scholar] [CrossRef]
  12. Taylor, S.W.; Carroll, A.L.; Alfaro, R.I.; Safranyik, L. Forest, climate and mountain pine beetle outbreak dynamics in western Canada. In The Mountain Pine Beetle: A Synthesis of Biology, Management, and Impacts on Lodgepole Pine; Safranyik, L., Wilson, B., Eds.; Canadian Forest Service: Victoria, BC, Canada, 2006; pp. 67–94. [Google Scholar]
  13. Meddens, A.J.H.; Hicke, J.A.; Ferguson, C.A. Spatiotemporal patterns of observed bark beetle-caused tree mortality in British Columbia and the western United States. Ecol. Appl. 2012, 22, 1876–1891. [Google Scholar] [CrossRef] [PubMed]
  14. Li, C.; Barclay, H.J.; Hawkes, B.C.; Taylor, S. Lodgepole pine forest age class dynamics and susceptibility to mountain pine beetle attack. Ecol. Complex. 2005, 2, 232–239. [Google Scholar] [CrossRef]
  15. Safranyik, L. Effects of climate and weather on mountain pine beetle populations. In Theory and Practice of Mountain Pine Beetle Management in Lodgepole Pine Forests; Symposium Proceedings, Berryman, A.A., Amman, G.D., Stark, R.W., Eds.; University of Idaho: Moscow, ID, USA, 1978; pp. 74–84. [Google Scholar]
  16. Mitchell, R.G.; Preisler, H.K. Analysis of spatial patterns of lodgepole pine attacked by outbreak populations of the mountain pine beetle. For. Sci. 1991, 37, 1390–1408. [Google Scholar]
  17. Kolb, T.E.; Fettig, C.J.; Ayres, M.P.; Bentz, B.J.; Hicke, J.A.; Mathiasen, R.; Stewart, J.E.; Weed, A.S. Observed and anticipated impacts of drought on forest insects and diseases in the United States. For. Ecol. Manag. 2016, 380, 321–334. [Google Scholar] [CrossRef]
  18. Chapman, T.B.; Veblen, T.T.; Schoennagel, T. Spatiotemporal patterns of mountain pine beetle activity in the southern Rocky Mountains. Ecology 2012, 93, 2175–2185. [Google Scholar] [CrossRef] [PubMed]
  19. Safranyik, L.; Carroll, A.L. The biology and epidemiology of the mountain pine beetle in lodgepole pine forests. In The Mountain Pine Beetle: A Synthesis of Biology, Management, and Impacts on Lodgepole Pine; Safranyik, L., Wilson, B., Eds.; Natural Resources Canada, Canadian Forest Service, Pacific Forestry Centre: Victoria, BC, Canada, 2006; pp. 3–66. [Google Scholar]
  20. Jakubauskas, M.E.; Price, K.P. Empirical relationships between structural and spectral factors of Yellowstone lodgepole pine forests. Photogramm. Eng. Remote Sens. 1997, 63, 1375–1380. [Google Scholar]
  21. Roe, A.L.; Amman, G.D. Mountain pine beetle in lodgepole pine forests RP-INT-71; US Department of Agriculture, Forest Service, Intermountain Forest and Range Experiment Station: Ogden, UT, USA, 1970; p. 23. [Google Scholar]
  22. Cole, W.E.; Amman, G.D. Mountain Pine Beetle Infestations in Relation to Lodgepole Pine Diameters; Research Note INT-95; US Department of Agriculture, Forest Service, Intermountain Forest & Range Experiment Station: Ogden, UT, USA, 1969; p. 7. [Google Scholar]
  23. Mitchell, R.; Waring, R.H.; Pitman, G. Thinning lodgepole pine increases tree vigor and resistance to mountain pine beetle. For. Sci. 1983, 29, 204–211. [Google Scholar]
  24. Whitehead, R.J.; Russo, G.L. “Beetle-Proofed” Lodgepole Pine Stands in Interior British Columbia have Less Damage from Mountain Pine Beetle; Information Report BC-X-402; Natural Resources Canada. Canadian Forest Service: Victoria, BC, Canada, 2005. [Google Scholar]
  25. Negrón, J.F.; Allen, K.K.; Ambourn, A.; Cook, B.; Marchand, K. Large-scale thinnings, ponderosa pine, and mountain pine beetle in the Black Hills, USA. For. Sci. 2017, 63, 529–536. [Google Scholar] [CrossRef]
  26. Taylor, S.; Carroll, A. Disturbance, forest age, and mountain pine beetle outbreak dynamics. In Mountain Pine Beetle Symposium: Challenges and Solutions; Shore, T.L., Brooks, J.E., Stone, J.E., Eds.; Natural Resources Canada, Canadian Forest Service, Pacific Forestry Centre: Victoria, BC, Canada, 2004; pp. 41–51. [Google Scholar]
  27. Hicke, J.A.; Jenkins, J.C. Mapping lodgepole pine stand structure susceptibility to mountain pine beetle attack across the western United States. For. Ecol. Manag. 2008, 255, 1536–1547. [Google Scholar] [CrossRef]
  28. Krist, F.J.; Ellenwood, J.R.; Woods, M.E.; McMahan, A.; Cowardin, J.; Ryerson, D.; Saplo, F.J.; Zwelfler, M.O.; Romero, S. 2013–2027 National Insect and Disease Forest Risk Assessment; US Department of Agriculture, Forest Service, Forest Health Technology Enterprise Team: Fort Collins, CO, USA, 2014; p. 209. [Google Scholar]
  29. McConnell, T.J.; Johnson, E.W.; Burns, B. A Guide to Conducting Aerial Sketchmapping Surveys; US Department of Agriculture, Forest Service, Forest Health Technology Enterprise Team: Fort Collins, CO, USA, 2000; p. 88. [Google Scholar]
  30. Williams, H.L.; Hood, S.M.; Keyes, C.R.; Egan, J.M. Mountain Pine Beetle Attack Severity Data in Lodgepole Pine in the Northern Rockies from 1999–2014; Forest Service Research Data Archive: Fort Collins, CO, USA, 2018. [CrossRef]
  31. National Oceanic and Atmospheric Administration, Narrative Summaries, Tables and Maps for Each State with Overview of State Climatologist Programs, Third Edition; Volume 1: Alabama-New Mexico; Volume 2: New York-Wyoming. 1985. Available online: https://wrcc.dri.edu/Climate/narratives.php (accessed on 28 August 2018).
  32. Montana Natural Resources Conservation Service State Office. Watershed Boundary Data; Montana Natural Resources Conservation Service State Office: Bozeman, MT, USA, 2006.
  33. Reineke, L.H. Perfecting a stand-density index for even-aged forests. J. Agric. Res. 1933, 46, 627–638. [Google Scholar]
  34. Egan, J.M.; Jenne, J.; Stasey, A. Techniques to Enhance Assessment and Reporting of Pest Damages Estimated with Aerial Detection Surveys; US Department of Agriculture, Forest Service, Northern Region, Forest Health Protection: Missoula, MT, USA, 2018; p. 35. [Google Scholar]
  35. Breiman, L.; Friedman, J.; Stone, C.J.; Olshen, R.A. Classification and Regression Trees; CRC Press, Taylor & Francis Group: Boca Raton, FL, USA, 1984. [Google Scholar]
  36. De’Ath, G.; Fabricius, K.E. Classification and regression trees: A powerful yet simple technique for ecological data analysis. Ecology 2000, 81, 3178–3192. [Google Scholar] [CrossRef]
  37. Evans, J.S.; Cushman, S.A. Gradient modeling of conifer species using random forests. Landsc. Ecol. 2009, 24, 673–683. [Google Scholar] [CrossRef]
  38. R Core Team. R: A Language and Environment for Statistical Computing, 3.2.3 ed.; R Foundation for Statistical Computing: Vienna, Austria, 2015. [Google Scholar]
  39. Therneau, T.; Atkinson, B.; Ripley, B. Rpart: Recursive partitioning and regression trees, R package version 4.1–10. 2015. Available online: https://cran.r-project.org/web/packages/rpart/index.html (accessed on 28 August 2018).
  40. Fettig, C.J.; Klepzig, K.D.; Billings, R.F.; Munson, A.S.; Nebeker, T.E.; Negrón, J.F.; Nowak, J.T. The effectiveness of vegetation management practices for prevention and control of bark beetle infestations in coniferous forests of the western and southern United States. For. Ecol. Manag. 2007, 238, 24–53. [Google Scholar] [CrossRef]
  41. Björklund, N.; Lindgren, B.S. Diameter of lodgepole pine and mortality caused by the mountain pine beetle: Factors that influence their relationship and applicability for susceptibility rating. Can. J. For. Res. 2009, 39, 908–916. [Google Scholar] [CrossRef]
  42. Robertson, C.; Wulder, M.; Nelson, T.; White, J. Risk rating for mountain pine beetle infestation of lodgepole pine forests over large areas with ordinal regression modelling. For. Ecol. Manag. 2008, 256, 900–912. [Google Scholar] [CrossRef]
  43. Shore, T.L.; Safranyik, L. Susceptibility and Risk Rating Systems for the Mountain Pine Beetle in Lodgepole Pine Stands; Information Report BC-X-336; Forestry Canada, Pacific Forestry Centre: Victoria, BC, Canada, 1992; p. 12. [Google Scholar]
  44. Nelson, W.A.; Potapov, A.; Lewis, M.A.; Hundsdörfer, A.E.; He, F. Balancing ecological complexity in predictive models: A reassessment of risk models in the mountain pine beetle system. J. Appl. Ecol. 2008, 45, 248–257. [Google Scholar] [CrossRef]
  45. Shore, T.L.; Riel, W.; Safranyik, L.; Fal, A. Decision support systems. In The Mountain Pine Beetle: A Synthesis of Biology, Management, and Impacts on Lodgepole Pine; Safranyik, L., Wilson, B., Eds.; Natural Resources Canada, Canadian Forest Service, Pacific Forestry Centre: Victoria, BC, Canada, 2006; pp. 193–230. [Google Scholar]
  46. Bentz, B.J.; Amman, G.D.; Logan, J.A. A critical assessment of risk classification systems for the mountain pine beetle. For. Ecol. Manag. 1993, 61, 349–366. [Google Scholar] [CrossRef]
  47. Dymond, C.C.; Wulder, M.A.; Shore, T.L.; Nelson, T.; Boots, B.; Riel, B.G. Evaluation of risk assessment of mountain pine beetle infestations. West. J. Appl. For. 2006, 21, 5–13. [Google Scholar]
  48. Dixon, G.E. Essential FVS: A User’s Guide to the Forest Vegetation Simulator; Internal Report; US Department of Agriculture, Forest Service, Forest Management Service Center: Fort Collins, CO, USA, 2018; p. 226. [Google Scholar]
  49. Bentz, B.J.; Regniere, J.; Fettig, C.J.; Hansen, E.M.; Hayes, J.L.; Hicke, J.A.; Kelsey, R.G.; Negron, J.F.; Seybold, S.J. Climate change and bark beetles of the western United States and Canada: Direct and indirect effects. Bioscience 2010, 60, 602–613. [Google Scholar] [CrossRef]
  50. Buotte, P.C.; Hicke, J.A.; Preisler, H.K.; Abatzoglou, J.T.; Raffa, K.F.; Logan, J.A. Climate influences on whitebark pine mortality from mountain pine beetle in the greater Yellowstone ecosystem. Ecol. Appl. 2016, 26, 2507–2524. [Google Scholar] [CrossRef] [PubMed]
  51. Liang, L.; Hawbaker, T.J.; Chen, Y.; Zhu, Z.; Gong, P. Characterizing recent and projecting future potential patterns of mountain pine beetle outbreaks in the southern Rocky Mountains. Appl. Geogr. 2014, 55, 165–175. [Google Scholar] [CrossRef]
  52. Axelson, J.N.; Alfaro, R.I.; Hawkes, B.C. Influence of fire and mountain pine beetle on the dynamics of lodgepole pine stands in British Columbia, Canada. For. Ecol. Manag. 2009, 257, 1874–1882. [Google Scholar] [CrossRef]
Figure 1. Study area boundary of lodgepole pine forests.
Forests 09 00552 g001
Figure 2. Distribution mean of host characteristics by subwatershed by low and high MPB-attack severity for lodgepole (a) basal area, (b) dominance, (c) quadratic mean diameter, (d) stand density index, and (e) density. See Table 1 for variable descriptions.
Forests 09 00552 g002
Figure 3. Spatial distribution of subwatershed mean LPP forest parameters by percentile for lodgepole (a) dominance, (b) basal area, (c) density, (d) stand density index and (e) quadratic mean diameter. See Table 1 for variable description.
Forests 09 00552 g003
Figure 4. Subwatershed MPB attack severity by quartile, with summary statistics of proportion of area attacked in a subwatershed at high severity.
Forests 09 00552 g004
Figure 5. Simplest classification tree; misclassification rate 22%. In each box, the left value is the number of incorrectly classified subwatersheds and the right value is the number of correctly classified subwatersheds. Classification tree 5 in Table A1. See Table 1 for variable descriptions.
Forests 09 00552 g005
Figure 6. Results of the simplest model for the study area, indicating where subwatershed MPB attack severity was correctly classified and misclassified.
Forests 09 00552 g006
Figure 7. Spatial extent of land in the USDA Forest Service Northern Region in 2002 and the areas with a LPP probability of occurrence greater than or equal to 50% where tree removal is not prohibited by legal constraints.
Forests 09 00552 g007
Table 1. Summary statistics for mean host characteristics and summed acreages by subwatershed (n = 2226). LPP = lodgepole pine; BA = basal area; SDI = stand density index; DBH = diameter at breast height; QMD = quadratic mean diameter; HUC = hydrological unit boundaries.
VariableDescriptionUnitsRangeMedianMeanStd. Error
Stand-Level Variables
DominanceMean LPP proportion of total basal areaProportion0–100.370.004
BAMean LPP basal aream2 ha−10–339100.1
DensityMean LPP trees per haTrees ha−10.8–55221507148712.7
SDIMean number of 25 cm DBH LPP trees per hectareUnitless index (metric)3–6911701942.4
QMDLPP quadratic mean diametercm0–4019180.11
Subwatershed-Level Variables
LPP areaLPP areal extentha0.09–29,9841262195746
LPP HUC extentMean proportion of subwatershed occupied by LPPProportion0–10.20.250.005
High BAArea with LPP basal area > 18.4 m2 ha−1ha0.09–17,51516849919
High dominance areaArea with LPP dominance > 50%ha0.09–24,32330679027
Large QMDArea with LPP QMD > 20.3 cmha0.09–22,116687126633
Table 2. Mean (s.e.) of stand host characteristics for attacked, unattacked, and all lodgepole pine (LPP) by subwatershed (n = 2262). Different superscript letters indicate significantly different values between unattacked and attacked LPP (p ≤ 0.05). See Table 1 for variable descriptions.
VariableLPP UnattackedLPP AttackedAll LPP
BA8.1 (0.08) a10.8 (0.11) b9.7 (0.11)
High BA209.4 (13.0) a334.0 (13.4) a499.3 (19.0)
LPP area1100.4 (35.0) a940.8 (30.4) b1956.8 (45.8)
Dominance0.34 (0.003) a0.39 (0.004) b0.37 (0.004)
High Dominance377.9 (20.0) a466.7 (18.2) a789.9 (27.4)
QMD17.3 (0.1) a18.8 (0.1) b18.3 (0.1)
Large QMD671.6 (24.1) a659.3 (23.2) a1266.1 (33.2)
SDI161.4 (1.9) a217.8 (2.6) b193.7 (2.4)
Density1371.3 (12.3) a1590.3 (15.5) b1487.2 (12.8)
LPP HUC extent0.14 (0.004) a0.12 (0.004) a0.25 (0.005)
Table 3. Summary statistics of subwatersheds at or above the 75th quartile for subwatershed MPB attack severity for HIGH and below the 75th quartile for LOW (n = 2262). See Table 1 for variable descriptions.
VariableAttack
Severity
RangeMedianMeanStd. Error
BALOW0.12–33880.11
HIGH0–3112130.21
High BALOW0–17,51011137921
HIGH0–590544182540
LPP areaLOW0–29,9801002176853
HIGH0–13,4001944248887
DominanceLOW0–10.310.340.004
HIGH0–0.950.420.450.007
High dominance areaLOW0–24,32021664031
HIGH0–7514713120555
QMDLOW0–4018180.1
HIGH0–2820200.17
Large QMDLOW0–22,120520109737
HIGH0–10,0501222174268
SDILOW3–6771491672
HIGH31–6912402695
DensityLOW0–55221400137915
HIGH5–37391794179122
LPP HUC extentLOW0–0.970.140.220.01
HIGH0–0.990.290.330.01

