Article

Investigations on the Effects of Seasonal Temperature Changes on the Electrical Resistance of Living Trees

1
College of Transportation and Civil Engineering, Fujian Agriculture and Forestry University, Fuzhou 35002, Fujian, China
2
College of Engineering and Technology, Northeast Forestry University, Harbin 150040, Heilongjiang, China
*
Author to whom correspondence should be addressed.
Forests 2018, 9(9), 550; https://doi.org/10.3390/f9090550
Submission received: 23 July 2018 / Revised: 3 September 2018 / Accepted: 4 September 2018 / Published: 8 September 2018
(This article belongs to the Section Forest Ecophysiology and Biology)

Abstract

:
In order to use the electrical resistance method to accurately and timely detect and evaluate the internal decay defects of living trees, the effects of the seasonal temperature and moisture content on the electrical resistance of standing trees were investigated. At the Northeast Forestry University Experimental Forest Farm, Harbin, Heilongjiang Province of China, Populus simonii Populus simonii Carr. and Larix gmelinii (Rupr.) Rupr. were selected as the objects and the electrical resistance of standing trees was tested through different seasons from December 2016 to December 2017. Meanwhile, the effects of changes in the seasonal temperatures (−20 to −10 °C, −10 to −5 °C, −5 to 0 °C, 0 to 5 °C, 5 to 10 °C, 10 to 15 °C, 15 to 25 °C) as well as changes in the moisture content (MC) (Populus simonii, MC ≥ 103%; Larix gmelinii, MC ≥ 77.5%) on the electrical resistance in the cross-sections of living trees were studied. The influence of temperature at different moisture contents, the moisture content at different temperatures, and their combined effects on electrical resistance were analyzed, following which a regression model was also established. The obtained results indicated that ambient temperature had a significant effect on the average value of electrical resistance in the cross-section of living trees when temperatures were below the freezing point. There was a sudden discontinuity near the freezing point, and logR (logarithm value of electrical resistance) in the cross-sections of sound trees and decayed trees changed in a similar trend with variations in the temperature. While the effect of moisture content on logR in the cross-sections of threes was insignificant at different temperatures because of the moisture content above FSP (fiber saturation point). It indicated that the temperature and moisture content had interactive effects on logR in the cross-sections. The binary linear regression model between moisture content, temperature, and logR was highly fitted with a correlation coefficient (R2) higher than 0.8. The outcome of this investigation indicates that when non-destructive testing is performed on living trees using electrical resistance at different seasonal temperatures, the measured results need to consider both the temperature and moisture content. For practical work, it is not recommended to consider testing living trees near the freezing point temperature using the electrical resistive tomography. Below the freezing point, the electrical resistance changes with temperature greatly relative to the normal temperature. Therefore, when performing the detection of electrical resistance, it is necessary to calibrate the effects of temperature

1. Introduction

An effective use of existing timber resources and improving the quality of wood products are considered to be the important issues faced by the forestry management and timber industries. Wood nondestructive testing technology is an important route to increase its utilization rate. In recent years, a variety of non-destructive evaluation techniques have been used to investigate and detect the internal decay of standing trees, such as ultrasonic, resistograph, X-rays, microwave, and so on [1,2,3]. Based on the nondestructive testing techniques, many researchers examine the physical and mechanical properties of woods to detect the defects or decay. Electrical resistance is one of the physical properties of wood, and researchers have started to consider detection based on the electrical resistance of wood owing to the advantages offered by this resistivity method in detecting the decay of wood [4,5]. Many different measurement methods have been developed to detect the electrical resistance of wood, for example, the Shigometer pin type wood electrical resistance tester [6,7], four-point test method [8,9], and Electrical Resistant Tomography [10,11]. With the development of finite element technology, it is combined with resistance imaging to study the electrical resistance of standing trees [12]. With the continuous development of ERT (Electrical Resistance Tomography) and computer technology, German researchers have developed a tree-resistance tomography imager called Picus Tree-Tronic, a widely used detection instrument specifically for the evaluation of internal decay [13] or detecting heartwood and sapwood of trees [14,15]. Following this, many researchers have conducted studies based on non-destructive testing to examine the effects of species, density, decay, and electrolyte content in the accurate determination of electrical resistance non-destructive testing technique [13,16]. Some of these studies [17,18] also conducted a comparative analysis of the electrical resistance method with other commonly used non-destructive testing techniques for wood, such as ultrasonic and resistograph, and found that electrical resistance method has its own advantages in terms of sensitivity and image accuracy. Meanwhile, this method of detection using electrical resistance is a convenient tool as it is easy to carry out and is useful for field work.
However, as the forest resources are distributed in different regions, there are changes in the climate as well as environment during four different seasons. A wood is an extremely complex natural organic polymer material with the characteristics of porosity, hygroscopicity, and anisotropy. Therefore, the electrical resistance of wood is affected by many factors, in which temperature and moisture content are considered to be very important [19]. Under an electrical field, ionization occurs in the interior of wood, where it works together with the ions that constitute the wood polymer or the ions generated from the impurities in the inorganic components of wood, which make the wood have a weak conductivity. When the moisture content is below the FSP (fiber saturation point), the free ion concentration in the wood is the main factor affecting the conductivity of the wood; when the moisture content is above the FSP, the ion mobility is the main factor affecting conductivity. At a certain temperature, the number and mobility of free ions in the wood is in a relatively balanced state. When the temperature rises, if the moisture content is below the FSP, the probability of bound ions in the dissociated state will increase, which leads to an in the number of free ions and hence the electrical conductivity of wood increases or results in a decrease in the electrical resistance. When the temperature changes, if the moisture content is above FSP, the ion mobility and distribution will change, which also results in a variation in the electrical resistance [20]. Although it is known that temperature has important effect on electrical resistance of wood, little is known about the effect of seasonal temperature changes on electrical resistance of standing trees. This information is important to field operations when electrical resistance technique is used to assess the quality and value of trees and stands.
Therefore, it is necessary to study the effects of changes in the seasonal temperature on the electrical resistance of wood, and to improve the accuracy of detection using electrical resistance for non-destructive testing in different climatic conditions, which will lay a scientific foundation for non-destructive testing of decayed trees. Considering that changes in the moisture content have a great influence on the electrical resistance, in this study, in addition to examining the influence of changes in the temperature on the electrical resistance of different seasons, the impact of moisture content on the electrical resistance was also analyzed.
Some of the earlier reports indicated the relationship between temperature and moisture content and electrical conductivity of wood, but most of them focused on the effect of moisture content on the electrical resistance of wood. It was first indicated that the electrical resistance of wood was greatly affected by the moisture content and was decreased with an increase in the moisture content [21]. Based on this, it was found that when the moisture content was below the fiber saturation point (FSP), there was a certain linear relationship between the electrical resistance of wood and moisture content, while the relationship was not obvious when the moisture content was above FSP [22]. Soon afterwards, the electrical conductivity method for determining the moisture content of wood was introduced [23]. Since then, a variety of moisture detectors for timber based on the electrical resistance theory have also been developed. These detectors were applied to the production, processing, and trade of timber [24,25]. To improve the accuracy of moisture meters for timber, a lot of research has been done and good results were achieved [26,27,28]. For the standing trees, the electrical resistance technique has shown the possibility to monitor the sap flow of trees and to evaluate the water potential of tree stem [12]. Few researchers have used the electrical technique to study the distribution and movement of water in the trunk of standing trees [29]. Studies have also reported on the relationship between electrical resistance and moisture content of wood under decay [30].
However, for the influence of temperature on the electrical resistance of wood or trees, there are few studies. Brischke [31] describe a method based on internal conductive glue electrodes for field studies as well as for in situ measurements to monitor objects in service on long-term moisture monitoring, unfortunately, the temperature range in the study was just between 4 and 36 °C. To evaluate the accuracy of wood resistance sensors for measurement of relative humidity (RH) and to identify sources of error, RH was expressed as a function of the logarithm of the sensor’s electrical resistance and of its temperature, but the corresponding RH was 55% to 90%, and the temperature was only at 300 and 272 K [32]. Other studies have been reported from Du et al. [33] and Wang et al. have been reported [34]. Unfortunately, the former analyzed the impact of temperature and moisture content on the wood resistance in the wood drying process carried out in the laboratory with the range of temperature is only above 0 °C. Whereas the latter involved only a small range of ambient temperature.
While there have been studies on the effects of temperature and moisture content on the electrical resistance of wood, still a complete understanding is a lacking due to the following reasons: (1) Most of the research activities were carried out in the laboratory, and only a little research involved field experiments; (2) There are few studies on the effect of temperature on the electrical resistance of wood, but the range of temperatures was very limited, especially in low temperature conditions.
Thus, in this study, living trees of Populus simonii and Larix gmelinii were selected as the objects, and the electrical resistance in the cross-section of these trees was tested in different seasons of spring, summer, autumn, and winter in the field areas. The effects of changes in the seasonal temperatures on the electrical resistance were systematically studied, and then the regularity of the changes on the electrical resistance of solid and decaying trees was analyzed. Thereby, the accuracy of the electrical resistance method in detecting the decay of standing trees could be improved. This study provides the theoretical and scientific basis for the non-destructive testing method based on electrical resistance technology.

2. Materials and Methods

The study was conducted at the Northeast Forestry University Experimental Forest Farm, Harbin, Heilongjiang Province, China. The area is located at a longitude 126°37′ E; latitude 45°43′ N; 140 m above the sea level, with a slope of 5°. The study area comprised of 43.95 hectares, located in the warm temperate zone semi-humid monsoon climate zone; and the annual average temperature was 3.6 °C. The average highest temperature in July was 36.4 °C and the average lowest temperature in January was −38.1 °C. In the frost-free period, the average rainfall in the area is 600 mm/year. By reforestation between the early 1950s and the end of 1960s, trees mixed species have been divided into 46 sample plots, each with different types of trees.

2.1. Selection of Sample Wood
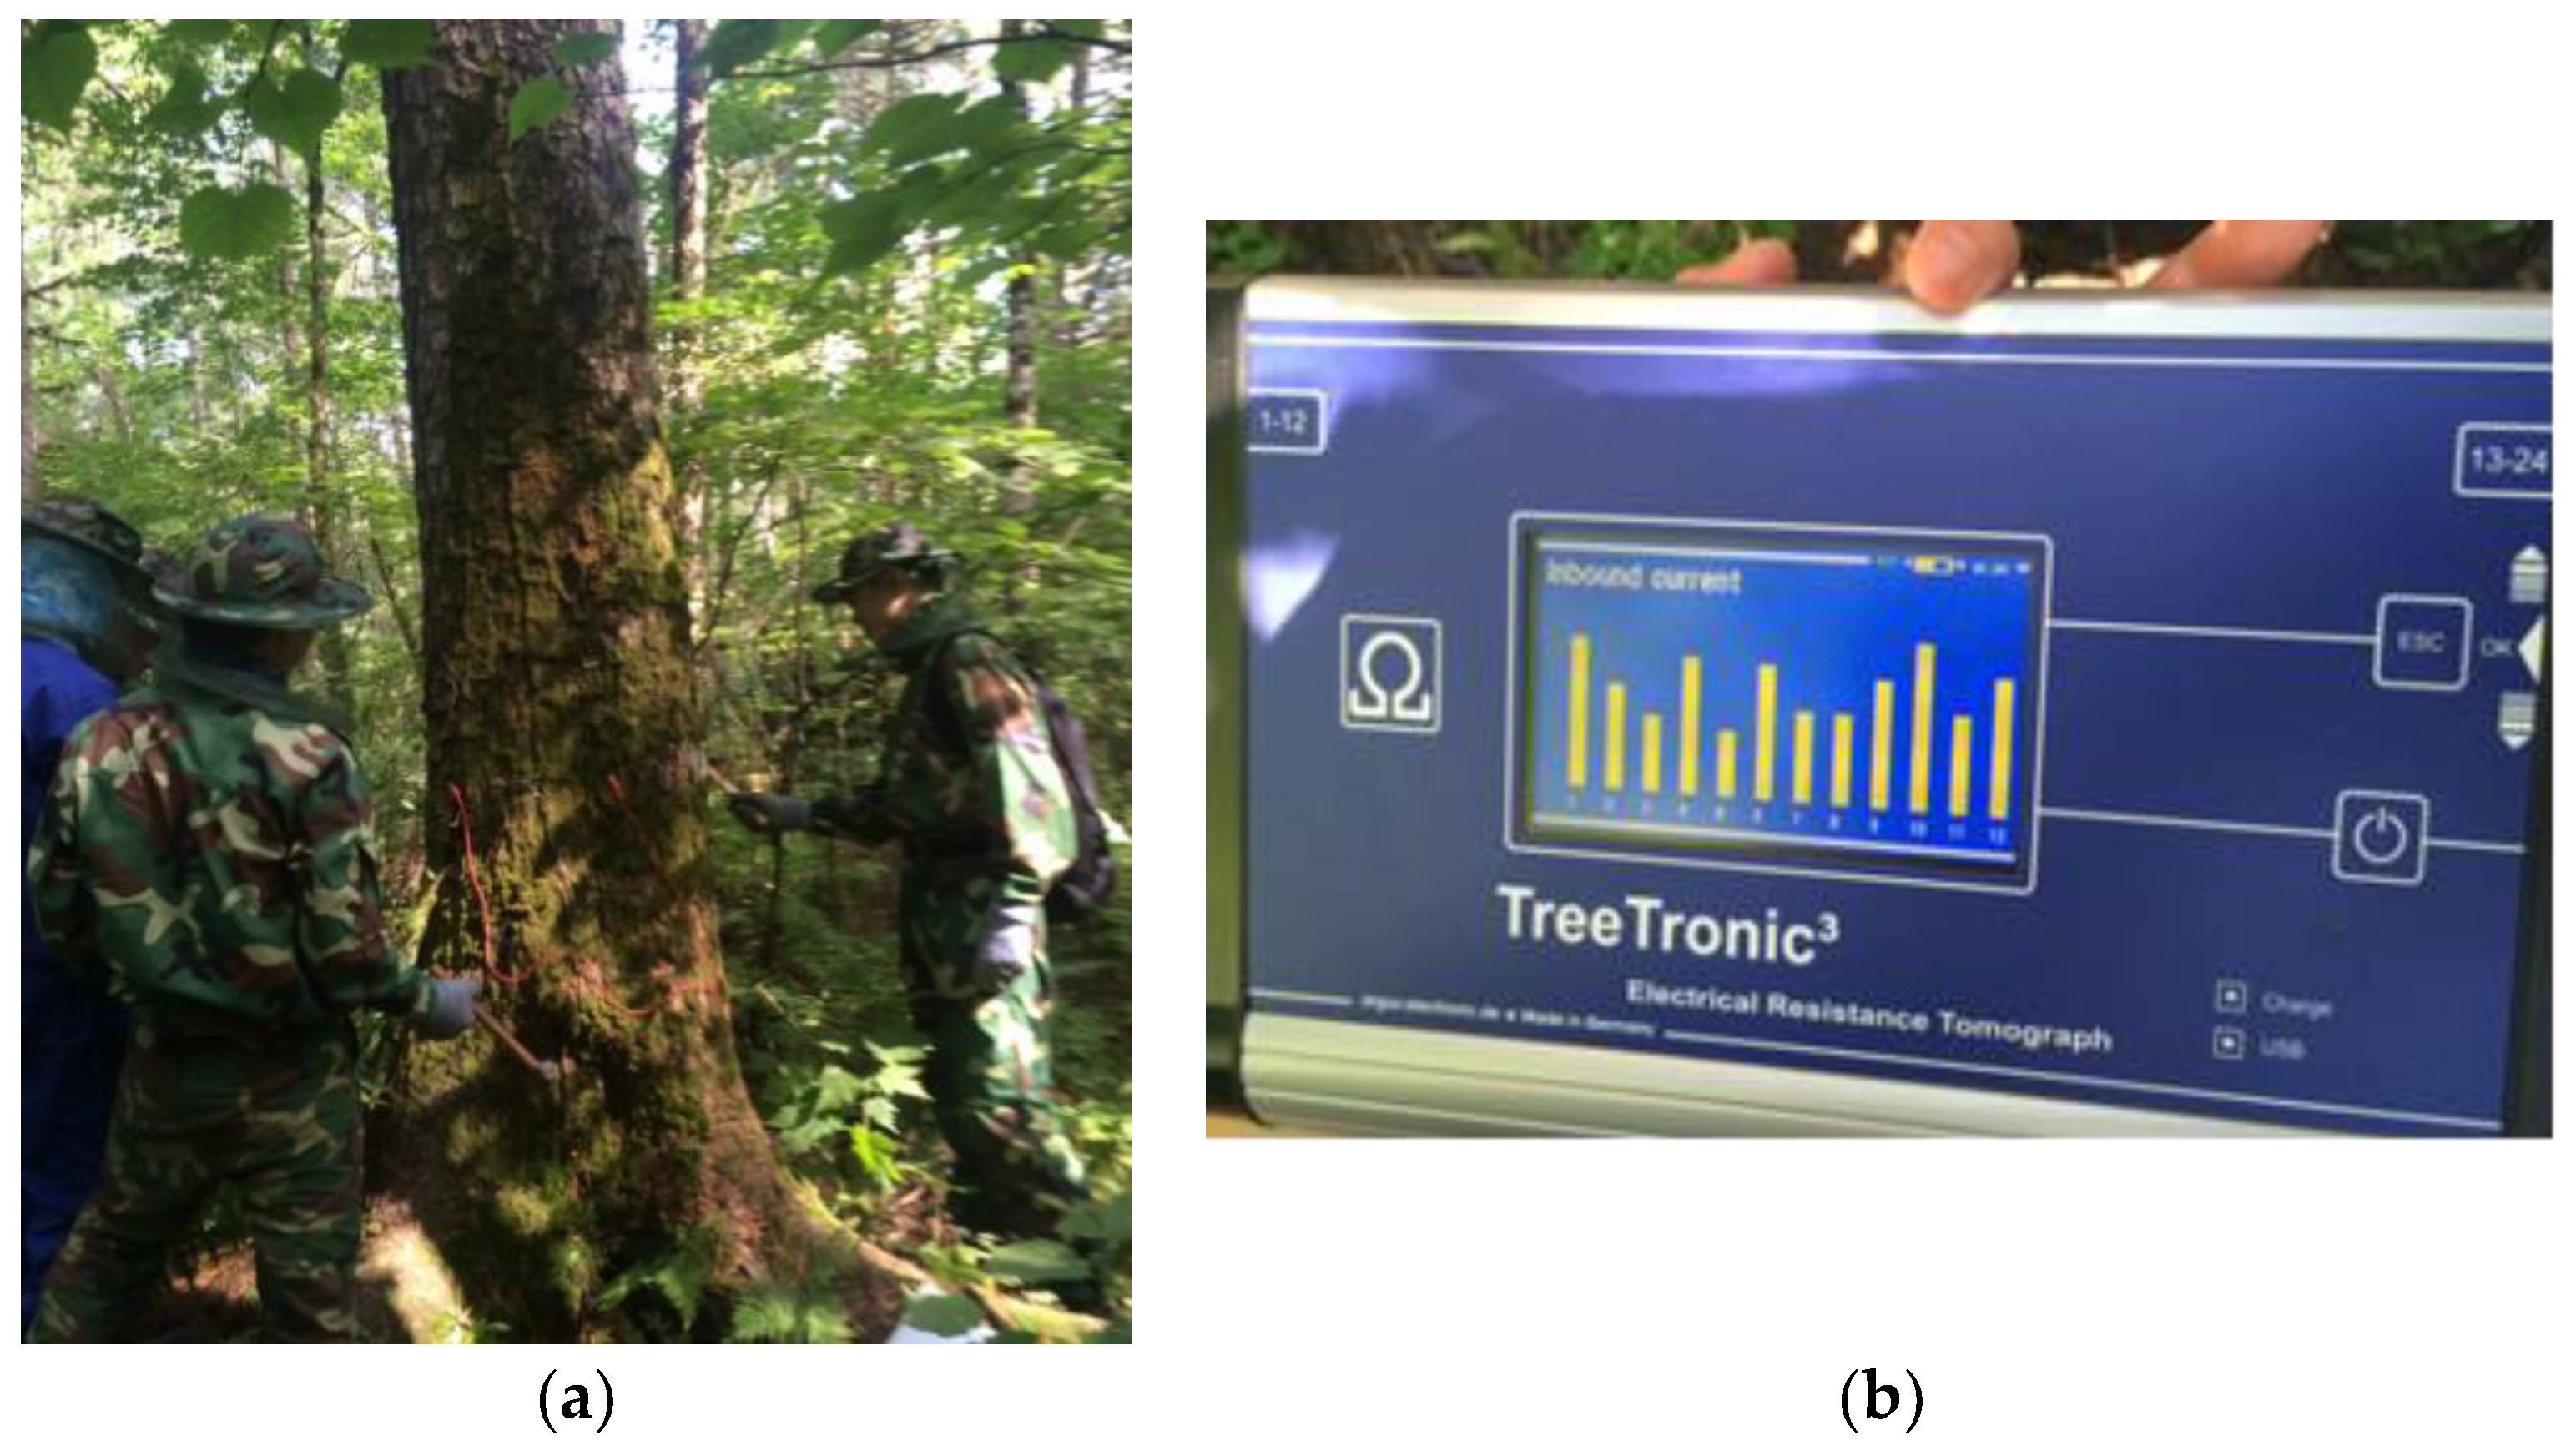
Populus simonii Carr. and Larix gmelinii (Rupr.) Rupr. were selected as the test objects. In the experimental forest, an experienced forester visually identified 10 Populu simonii and 10 Larix gmelinii standing trees that with potential internal decay. Then, 10 sound Populu simonii and 10 sound Larix gmelinii were also selected and were marked in order (Number 1 to 10 were sound, and Number 11 to 20 were decayed). All the selected trees were in between the ages of 50~60 years old. The DBH (diameter at breast height) of Populus simonii trees was 30–50 cm, and the DBH of Larix gmelinii was 25–35 cm.

2.2. Test Equipment

The PICUS Tree Tronic (Argus, Berlin, Germany) Tree Electrical Resistance Tomography was used to test the electrical resistance in the cross-section of standing trees. ST-85 digital wood moisture meter (Shanghai Timber Industry Research Institute) was used to check the moisture content. The Infrared Thermometer (Tektronix Tm750, Shanghai, China) and the thermometer (Telford TH108, Beijing, China) were used to measure the temperature of trunk’s surface and the ambient temperature of the standing timber sample, respectively.

2.3. Test Methods

The field experiments for measuring the resistance of living trees were selected in different seasons from December 2016 to December 2017. The specific dates were determined depending on the temperature and weather conditions with multiple measurements. The parameters measured included ambient temperature, moisture content, and electrical resistance using tomography.
The temperature data was collected by Infrared Thermometer (Tektronix Tm750) and thermometer (Telford TH108), and an average temperature represents the ambient temperature. In addition, the temperature was tested both before and after electrical resistance testing. An average temperature was then used to represent the temperature condition of the ERT testing.
To monitor moisture content change during the 1-year testing cycle, each time before ERT measurements, we inserted the pin of the moisture content tester into the stem at three points around the section, and then an average MC (moisture content) was used to represent the moisture condition.
One section for every tree was tested and the test location was 100 cm above the ground. The Picus ERT measurement system was comprised of 12 electrodes which were evenly placed around the trunk in a horizontal plane during testing [35]. For ease of analysis, the first electrode was arranged in a south orientation and the other electrodes were arranged equidistantly in a clockwise manner. Each electrode was clipped and attached to a nail (2 mm in diameter) which was tightly inserted into the bark and sapwood. After connecting the electrodes, the electrical resistance tests were conducted. To reduce the error, the testing was carried out twice and the displayed histogram was noted. If there was a difference between the two tests, a third test was then performed, and the output file name was recorded for subsequent analysis. Upon completion of ERT measurements, 2D tomograms were obtained and combined with Picus Q72 (2013, Argus, Berlin, Germany) software program the measure of electrical resistance tomography was as shown in Figure 1

3. Data Processing Methods

3.1. Calculation of Resistance Values

The outcome of electrical resistance tomography is a two-dimensional image of the distribution of resistance values. This image presents the changes in the electrical resistivity of the tree section. The red and blue parts indicate the high and low resistivity areas, respectively. In order to accurately calculate the resistance values from the image of resistance tomography, the color image was first grayed (grayscale, 0–255), and then the pixel values in the graph were converted into resistance values by Matlab software, so that the resistance value could be displayed on the image and then the average value of the resistance in the cross-section was calculated. In this experiment, the main purpose of using the electrical resistance tomography to detect the electrical resistance of a standing tree was to determine the effect of changes in the seasonal temperature on the electrical resistance of the standing tree. Therefore, the subsequent analysis and discussion of the results were based on the average values of the obtained electrical resistance in the cross-section of the standing trees.

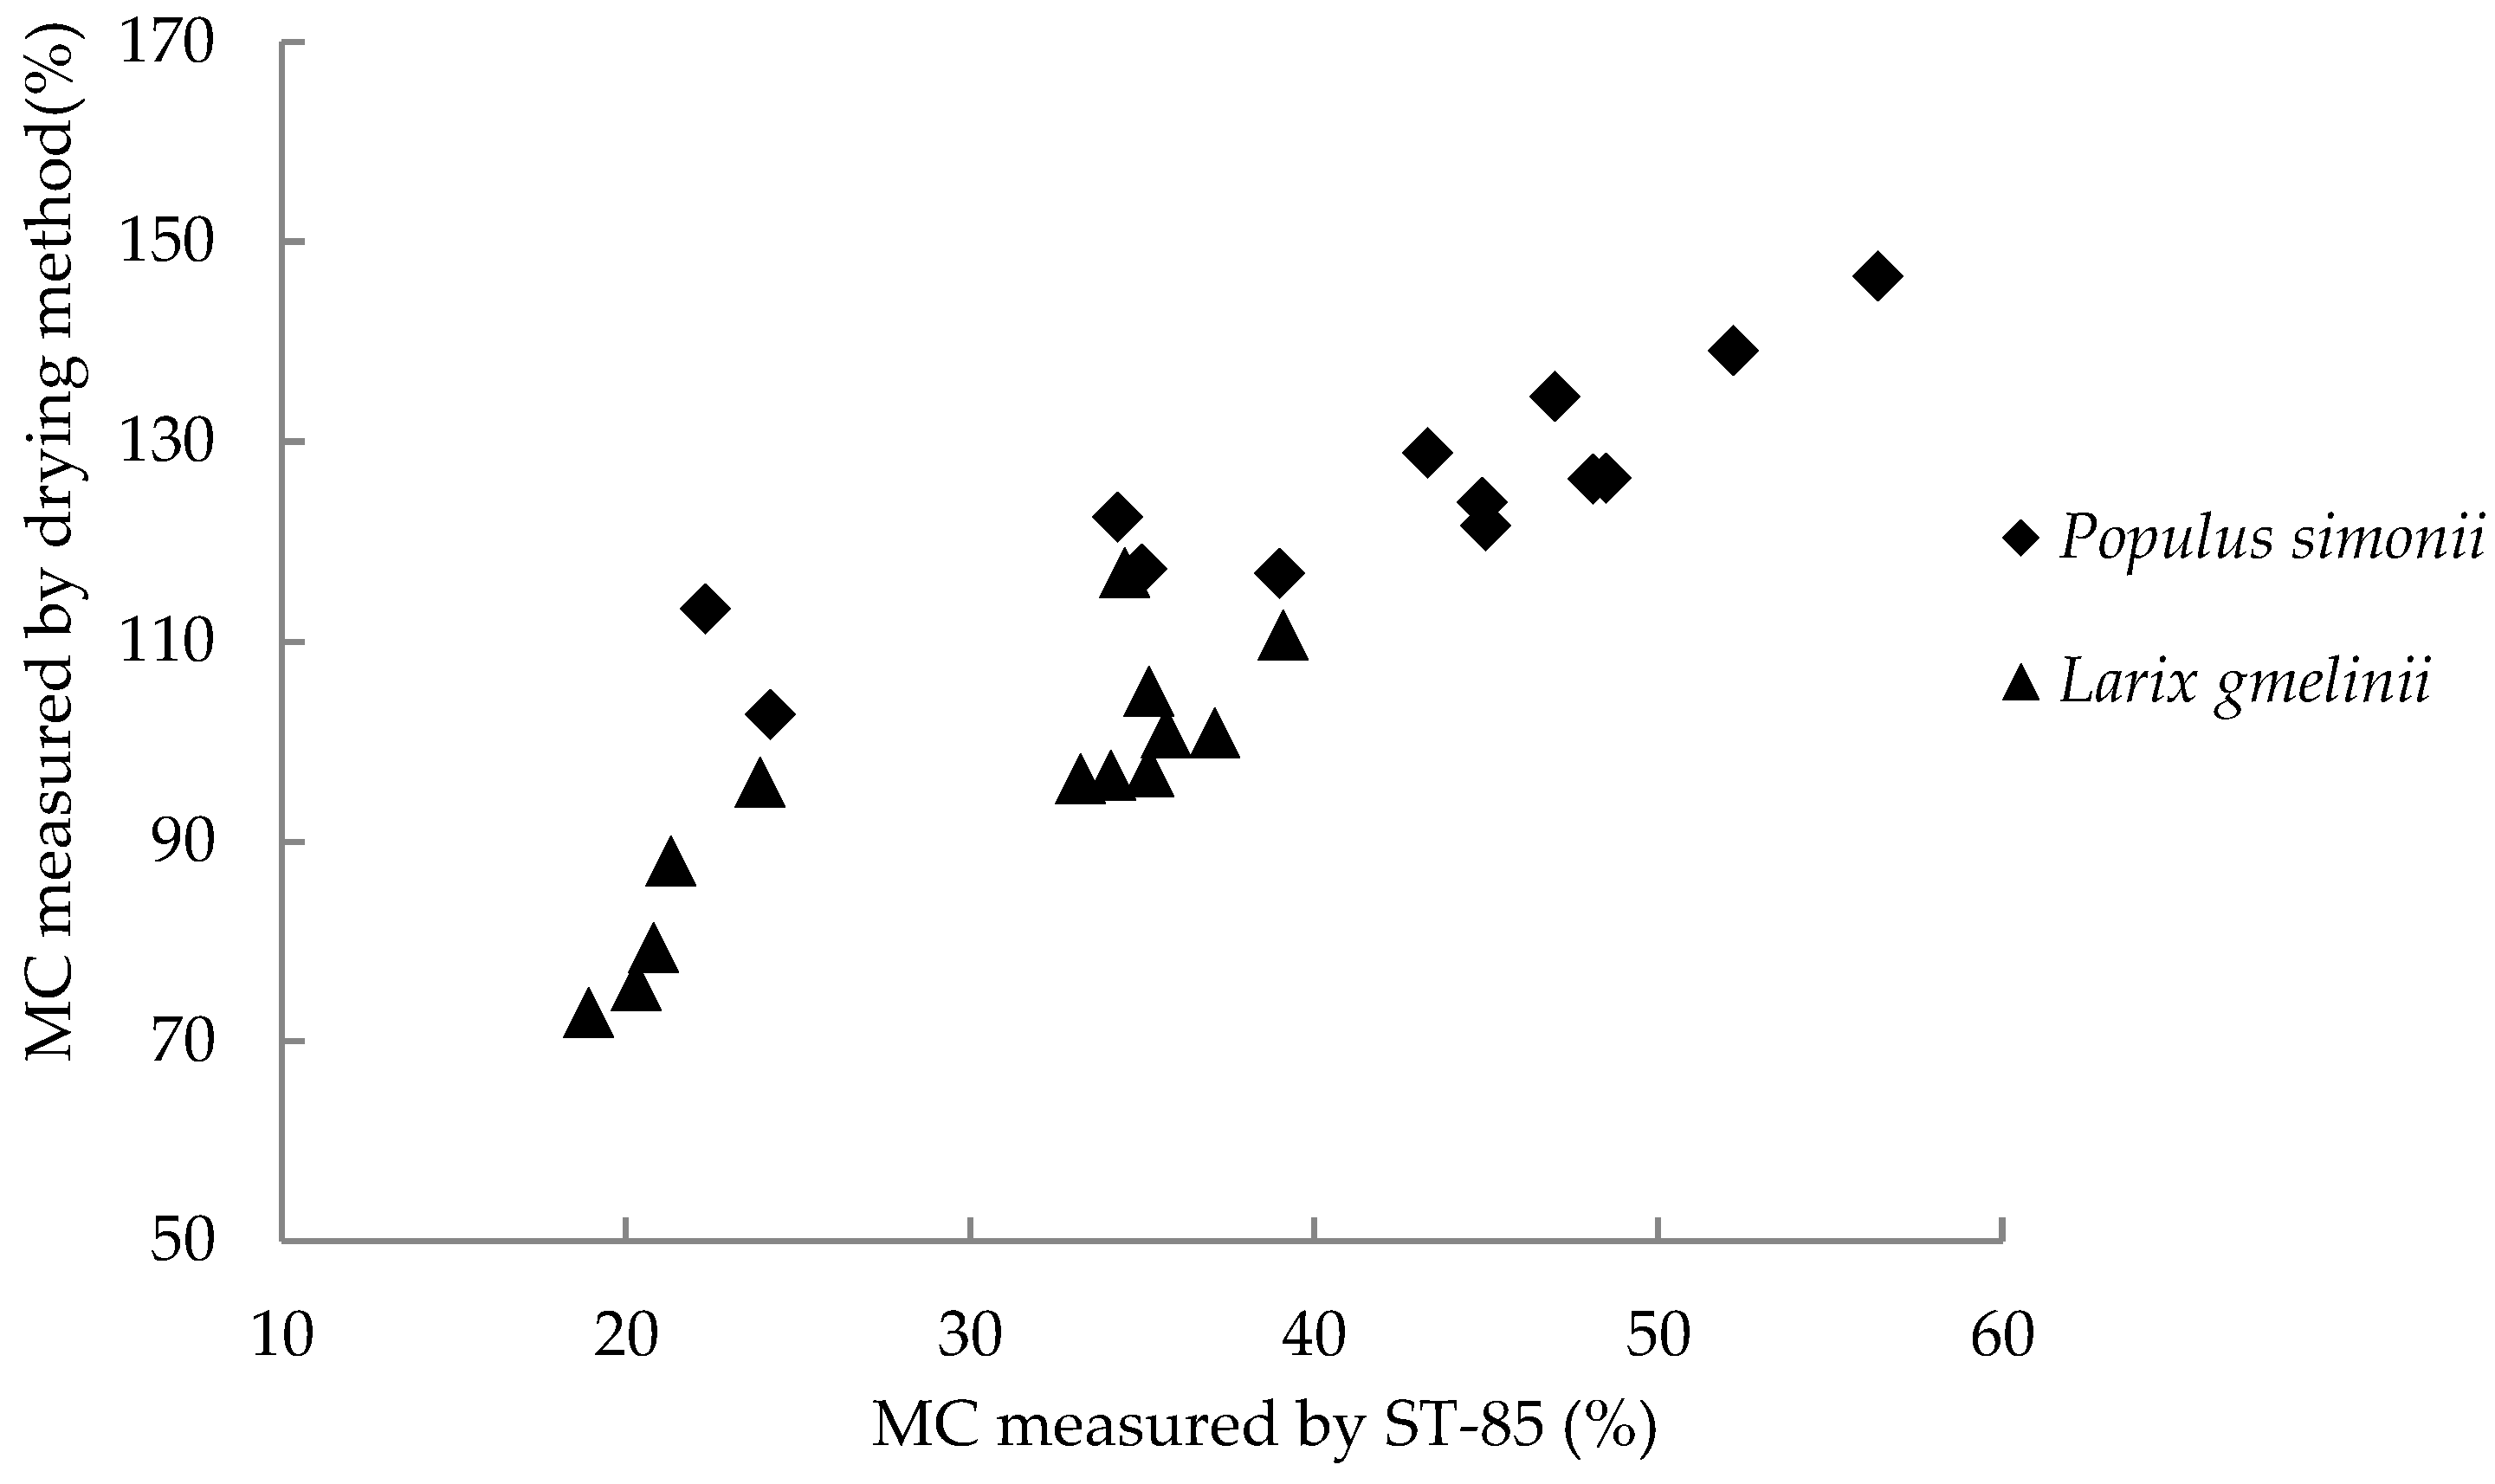
3.2. Correction of the Moisture Content

The moisture content of the living trees was measured using a ST-85 digital wood moisture meter, which measures the moisture content of sapwood. The moisture content of Populus simonii heartwood and sapwood is not much different, so we used the moisture of sapwood as the moisture content of the whole stem. The moisture content of Larix gmelinii heartwood and sapwood is usually much different, so one should not use it as the moisture content of the whole stem. However, according to the relationship between DBH and sapwood area [36,37], we could estimate the area of the sapwood, therefore, the moisture content of sapwood was used for analysis, and correspondingly, the resistance of the sapwood area was also used of Larix gmelinii trees. The entire test process took a long time, especially in the cold winter months, during which the water flow in the trees freezes and thus the moisture content measured by this instrument was subjected to error. In the tests, in order to ensure the accuracy of the measured moisture content, the data of moisture content measured by the digital tester (ST-85) needed corrections. The most accurate method for measuring the moisture content of wood is by oven drying, which is not suitable for field operations. Thus, each time after field tests, the two species of trees to be measured were sampled according to the GB/T 1927–2009 Method of sample tree collection for physical and mechanical tests of wood [38]. Samples were carried to the laboratory to determine the moisture content using the oven-dry method according to the GB/T 1931–2009 Method [39]. Although the moisture content measured by the instrument was different from that measured by the drying method, analysis of their relationship showed that there was a significant correlation as shown in Figure 2 and Table 1.

4. Results

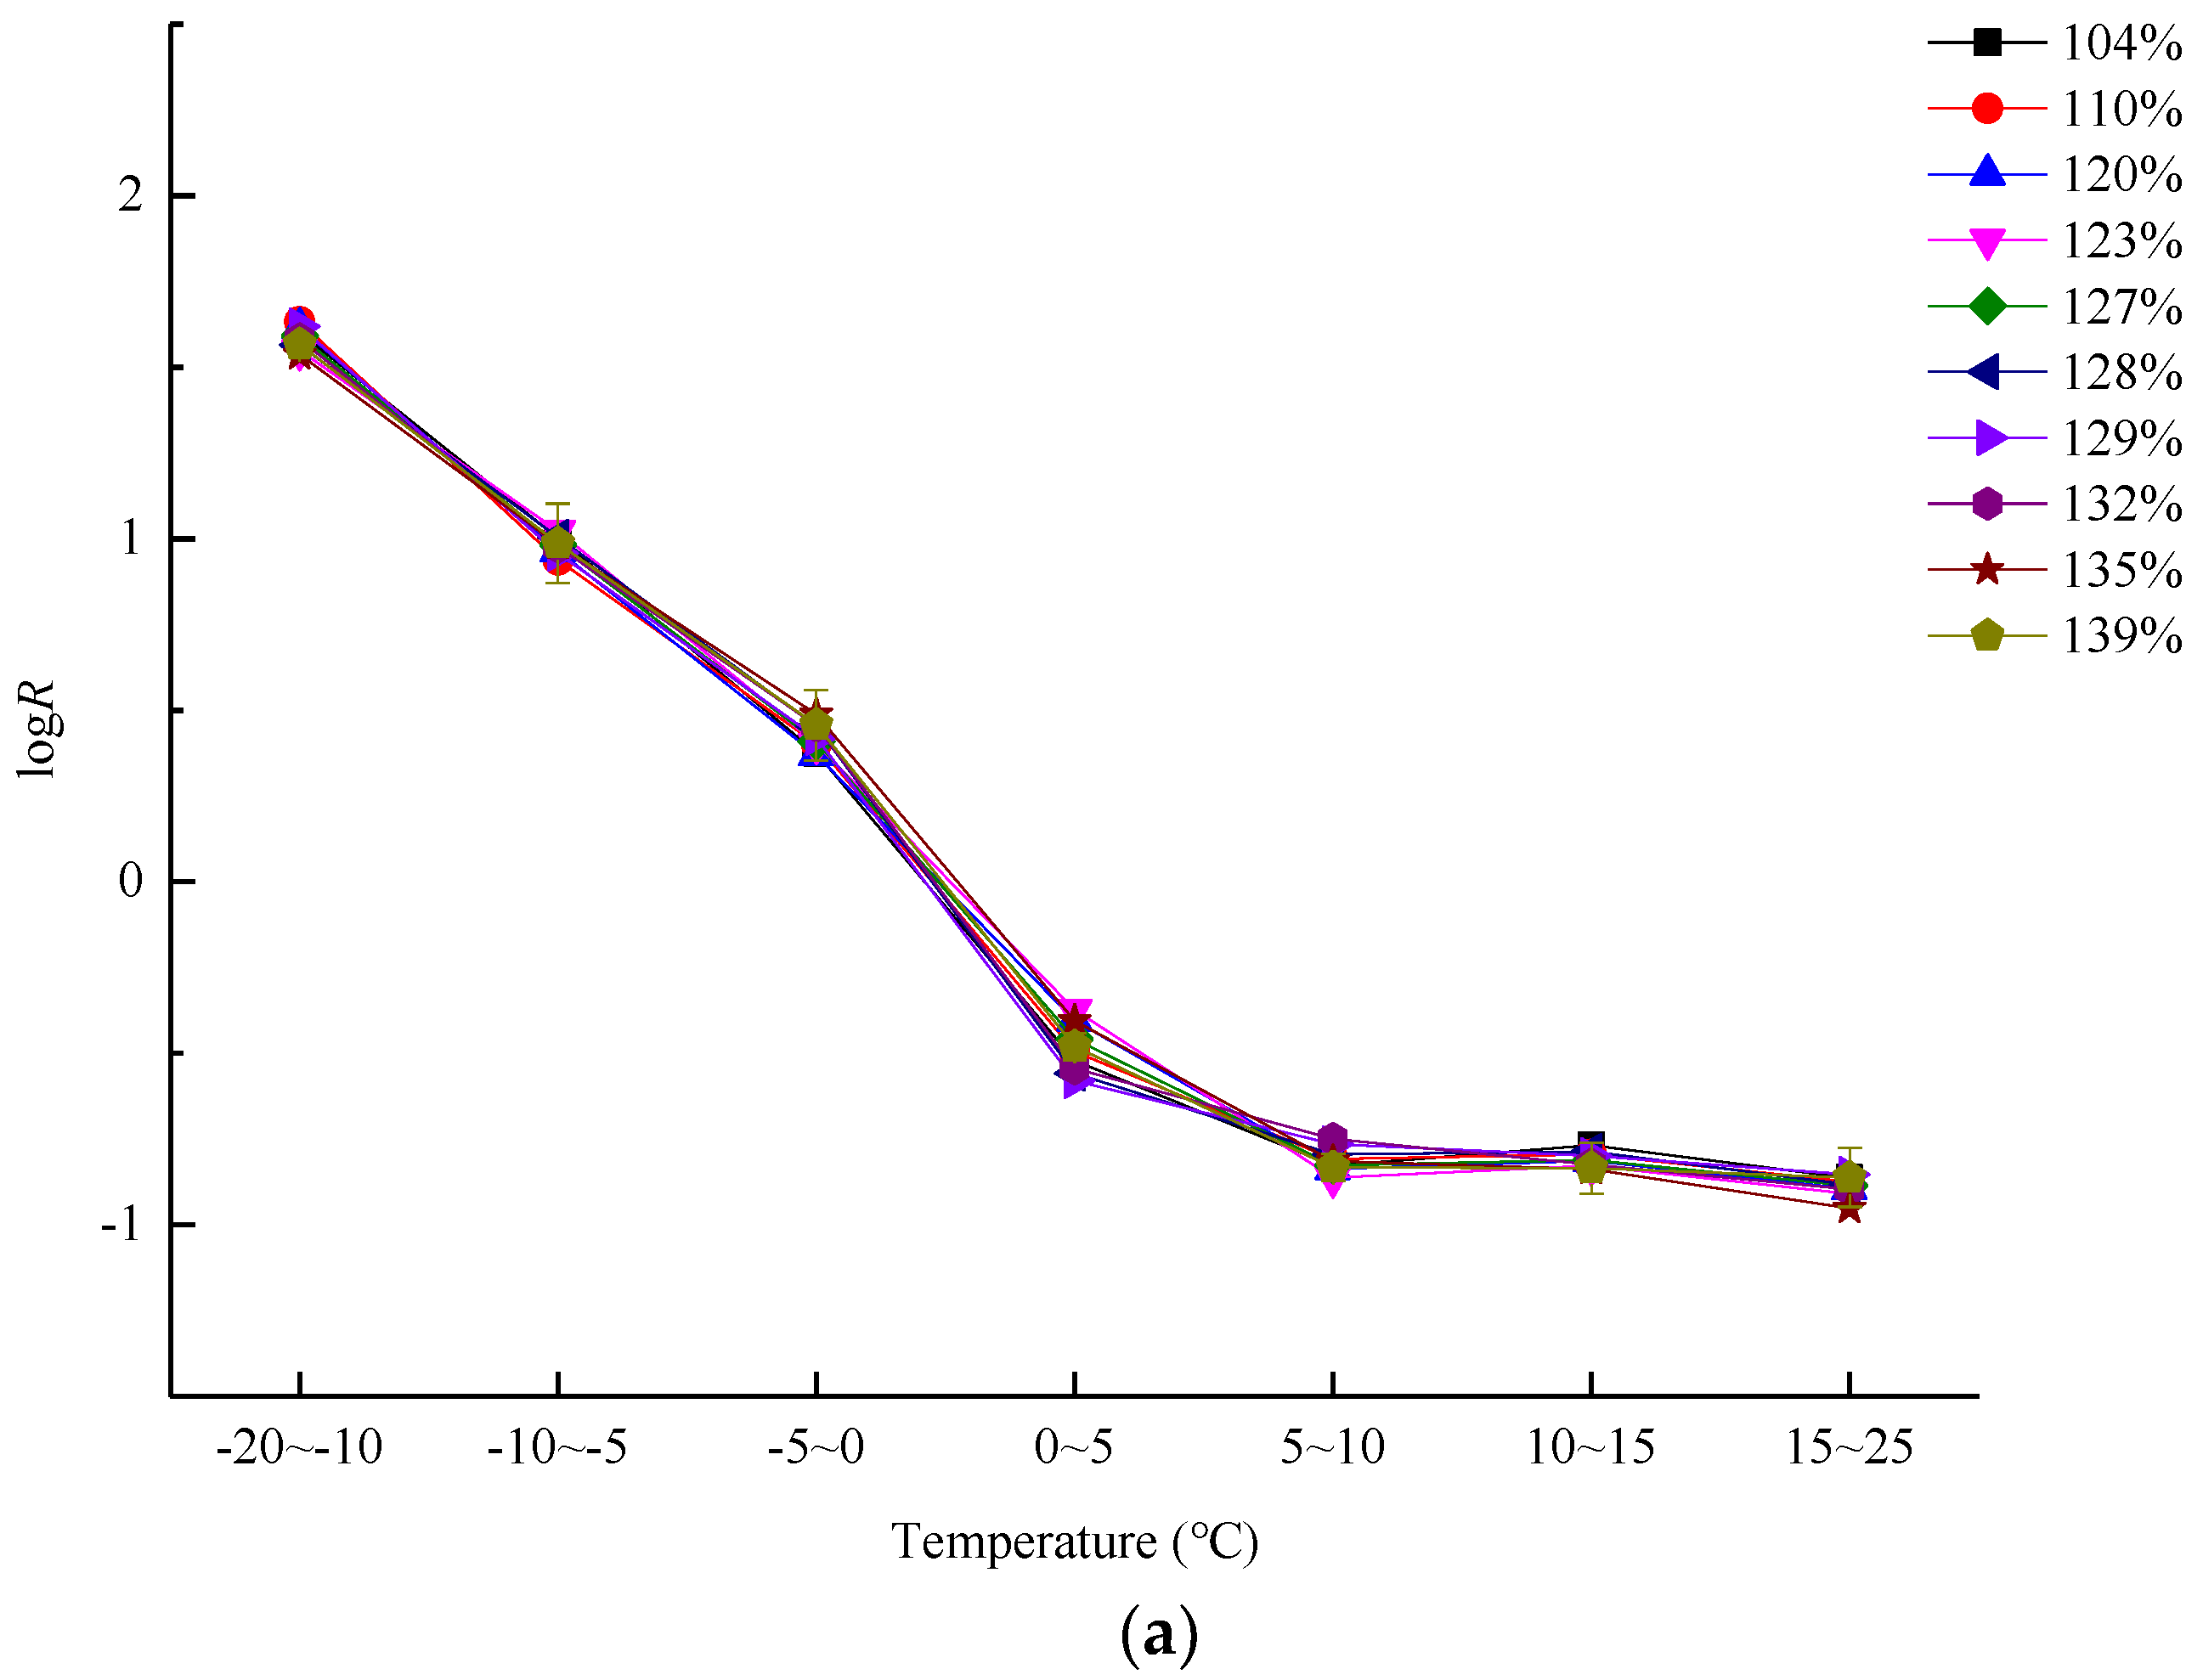
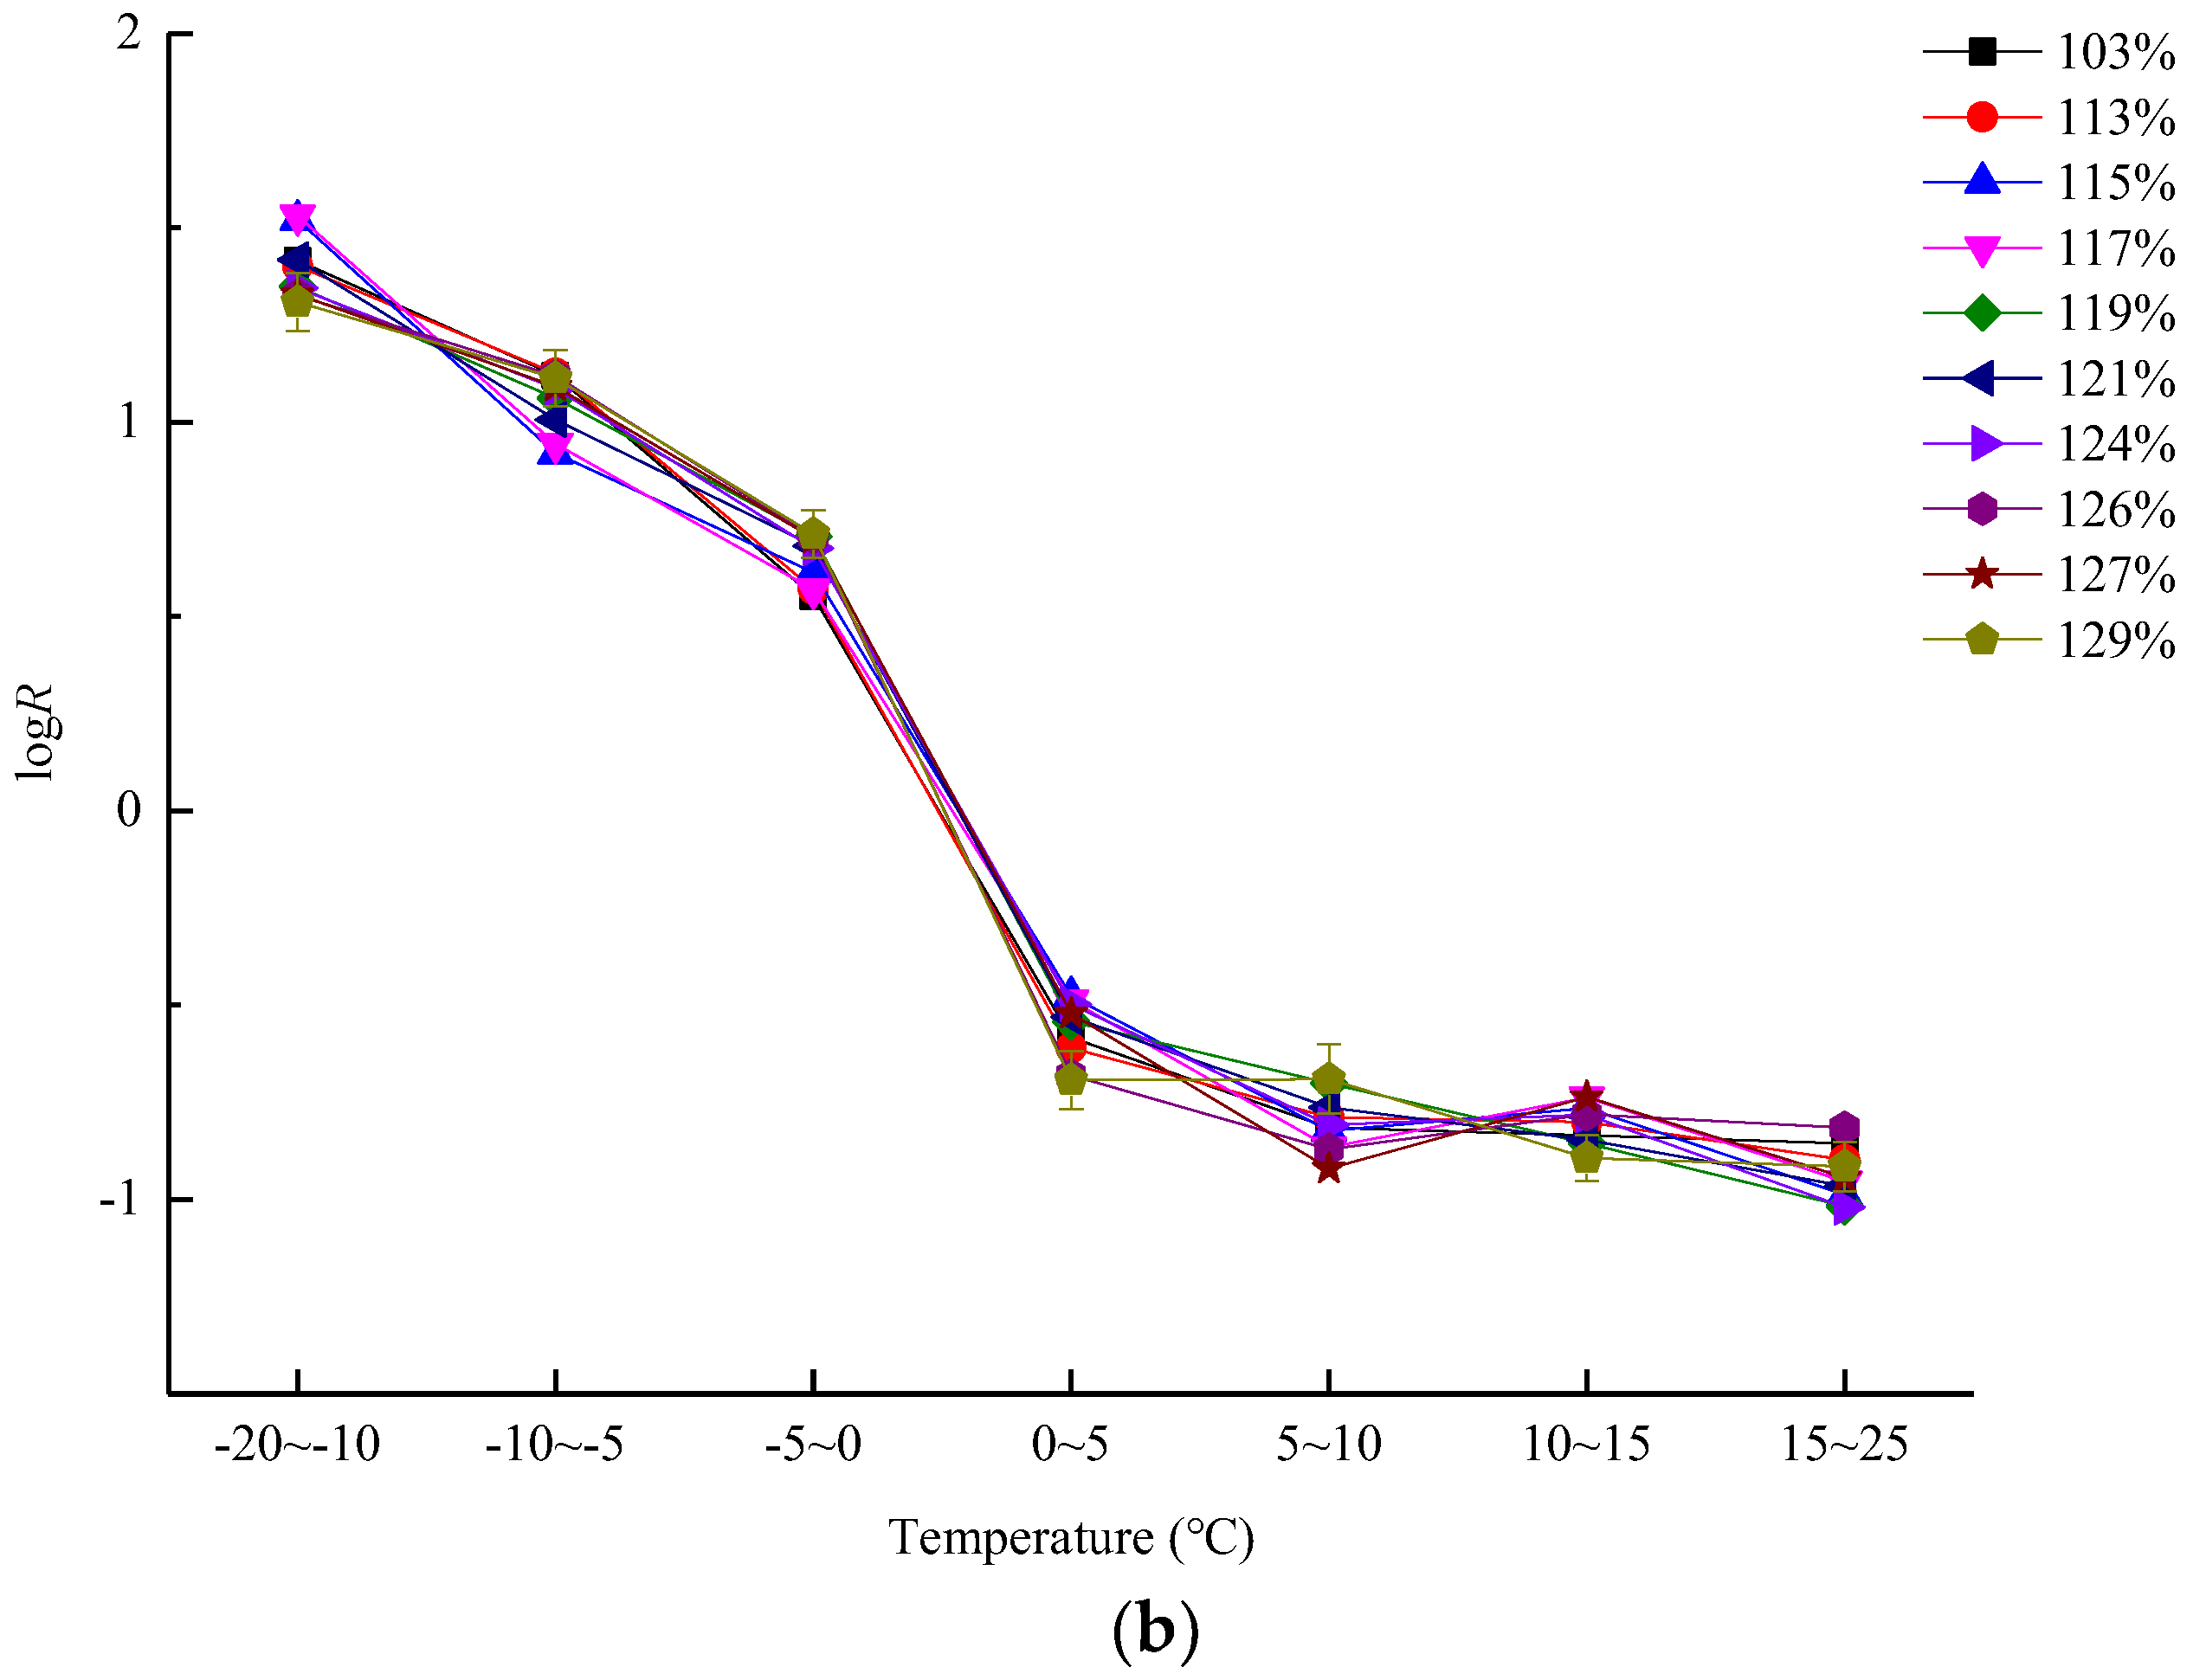
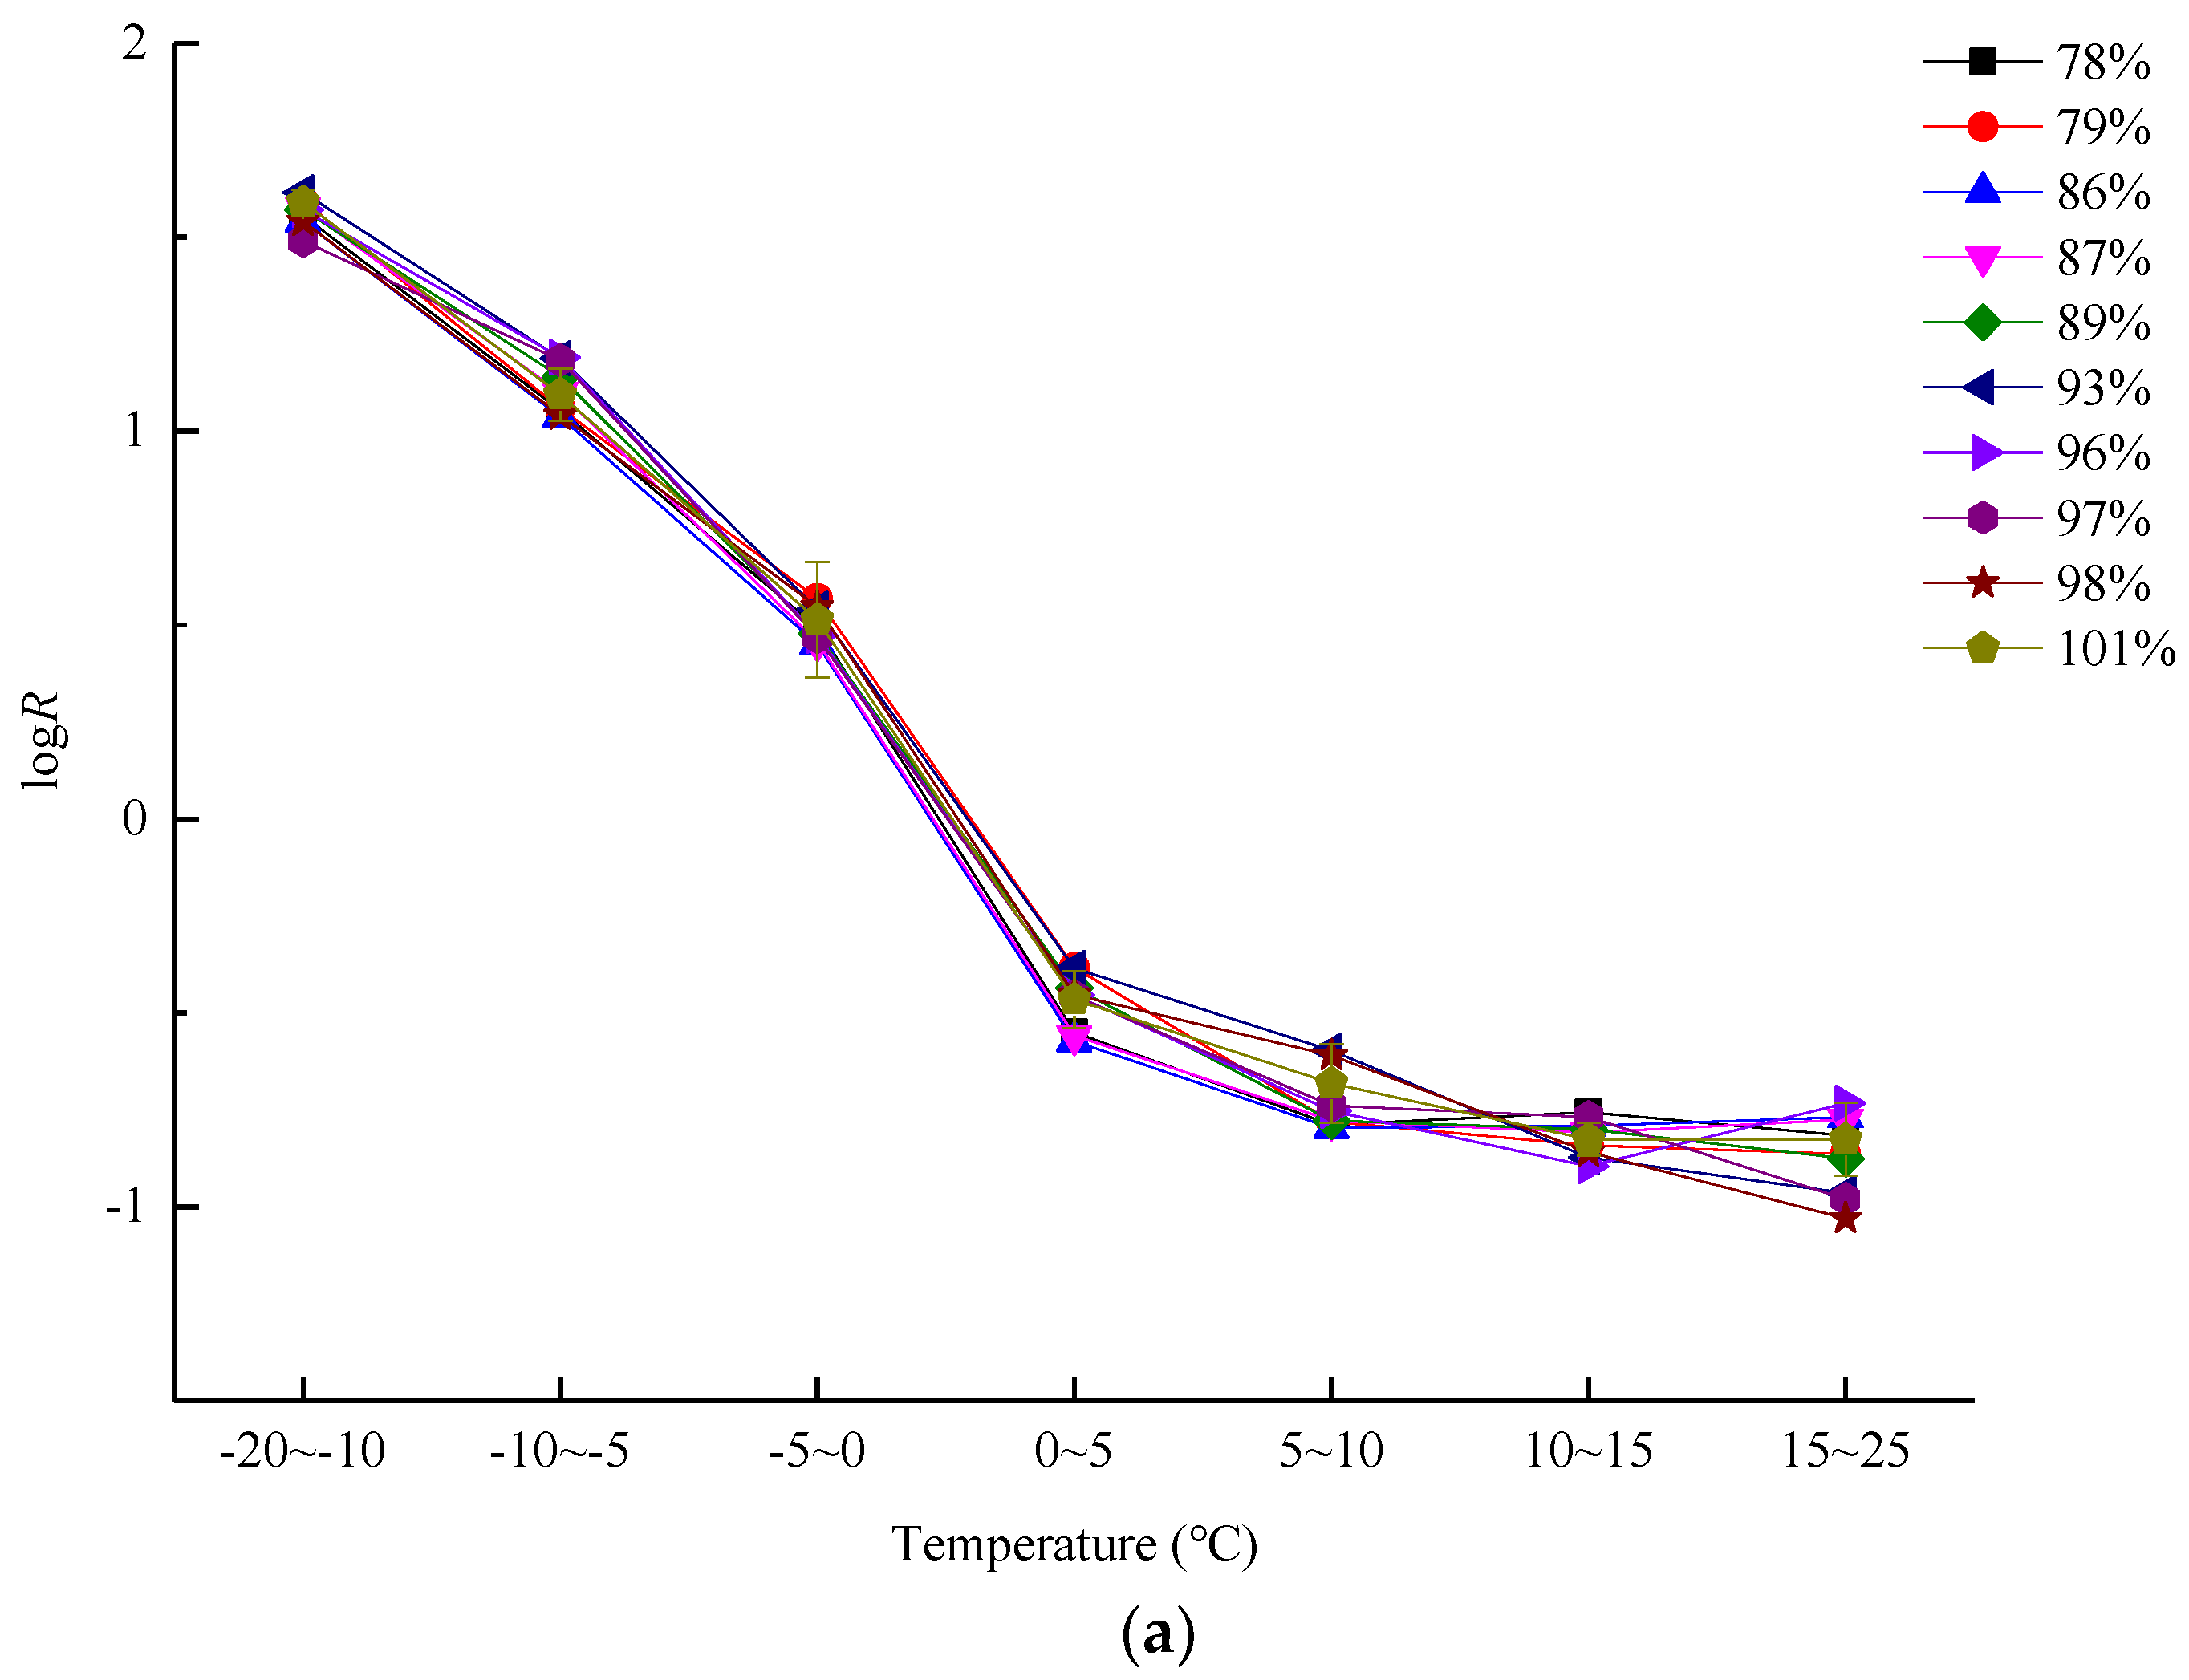
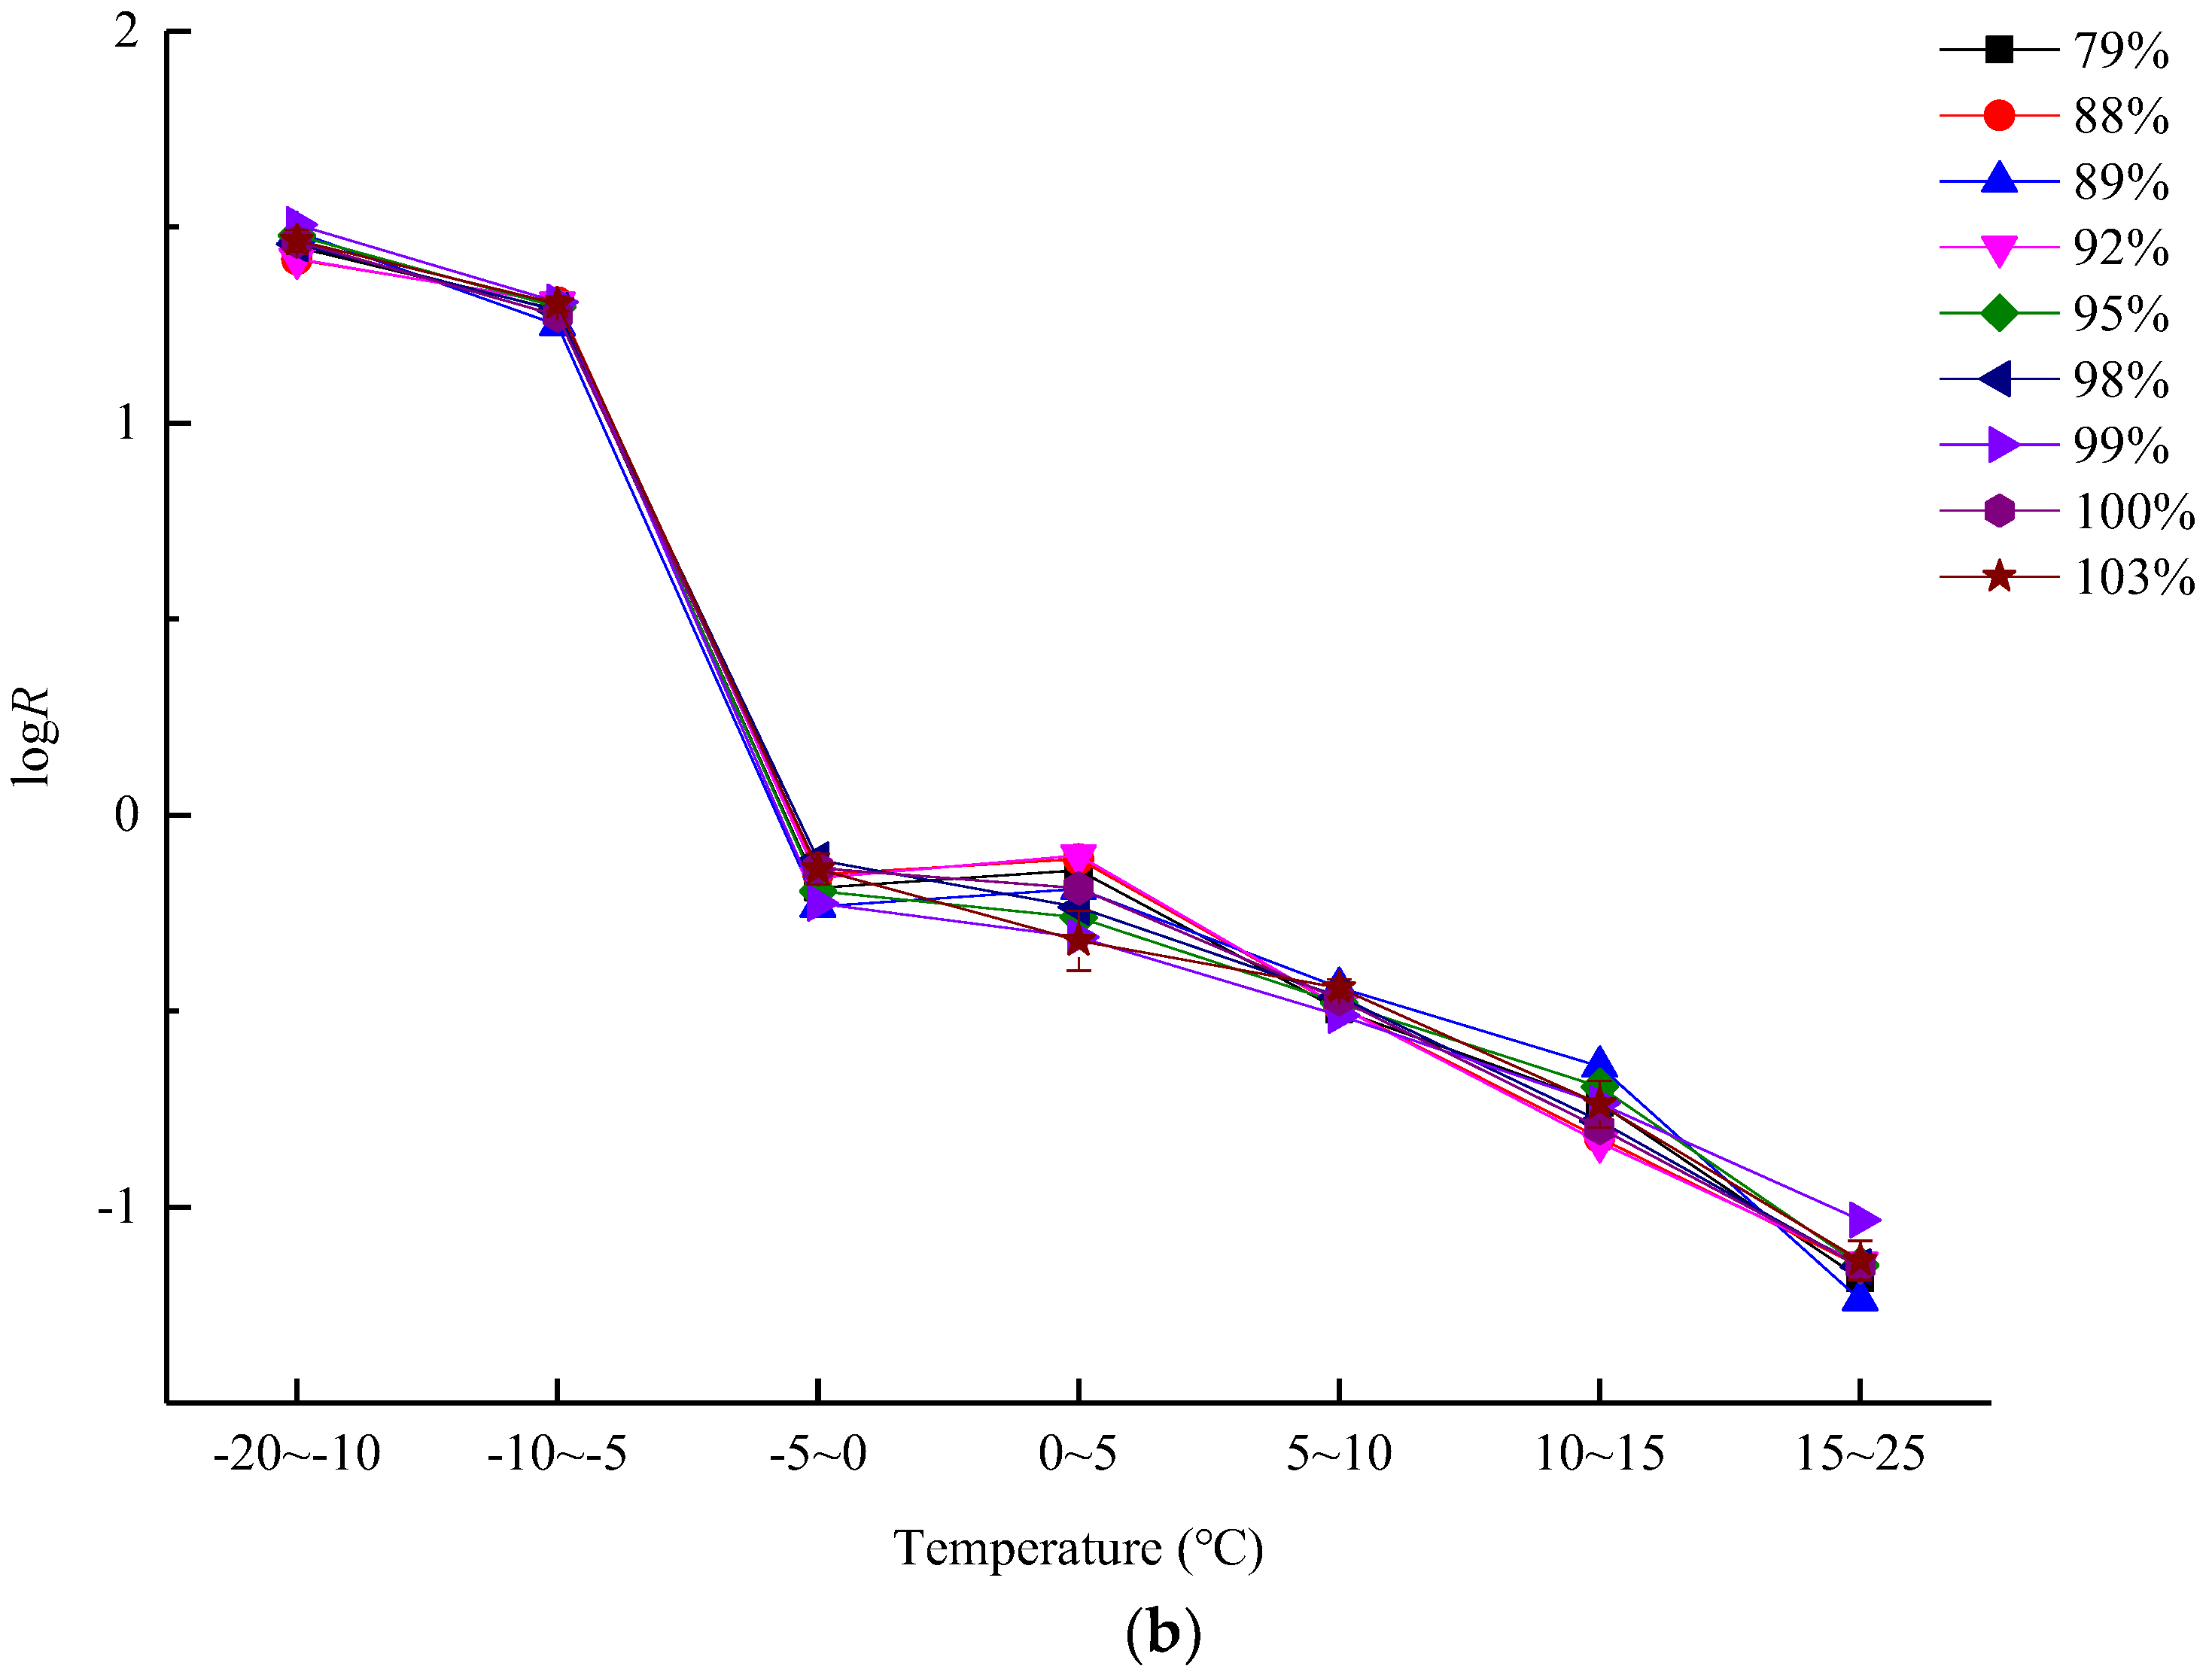
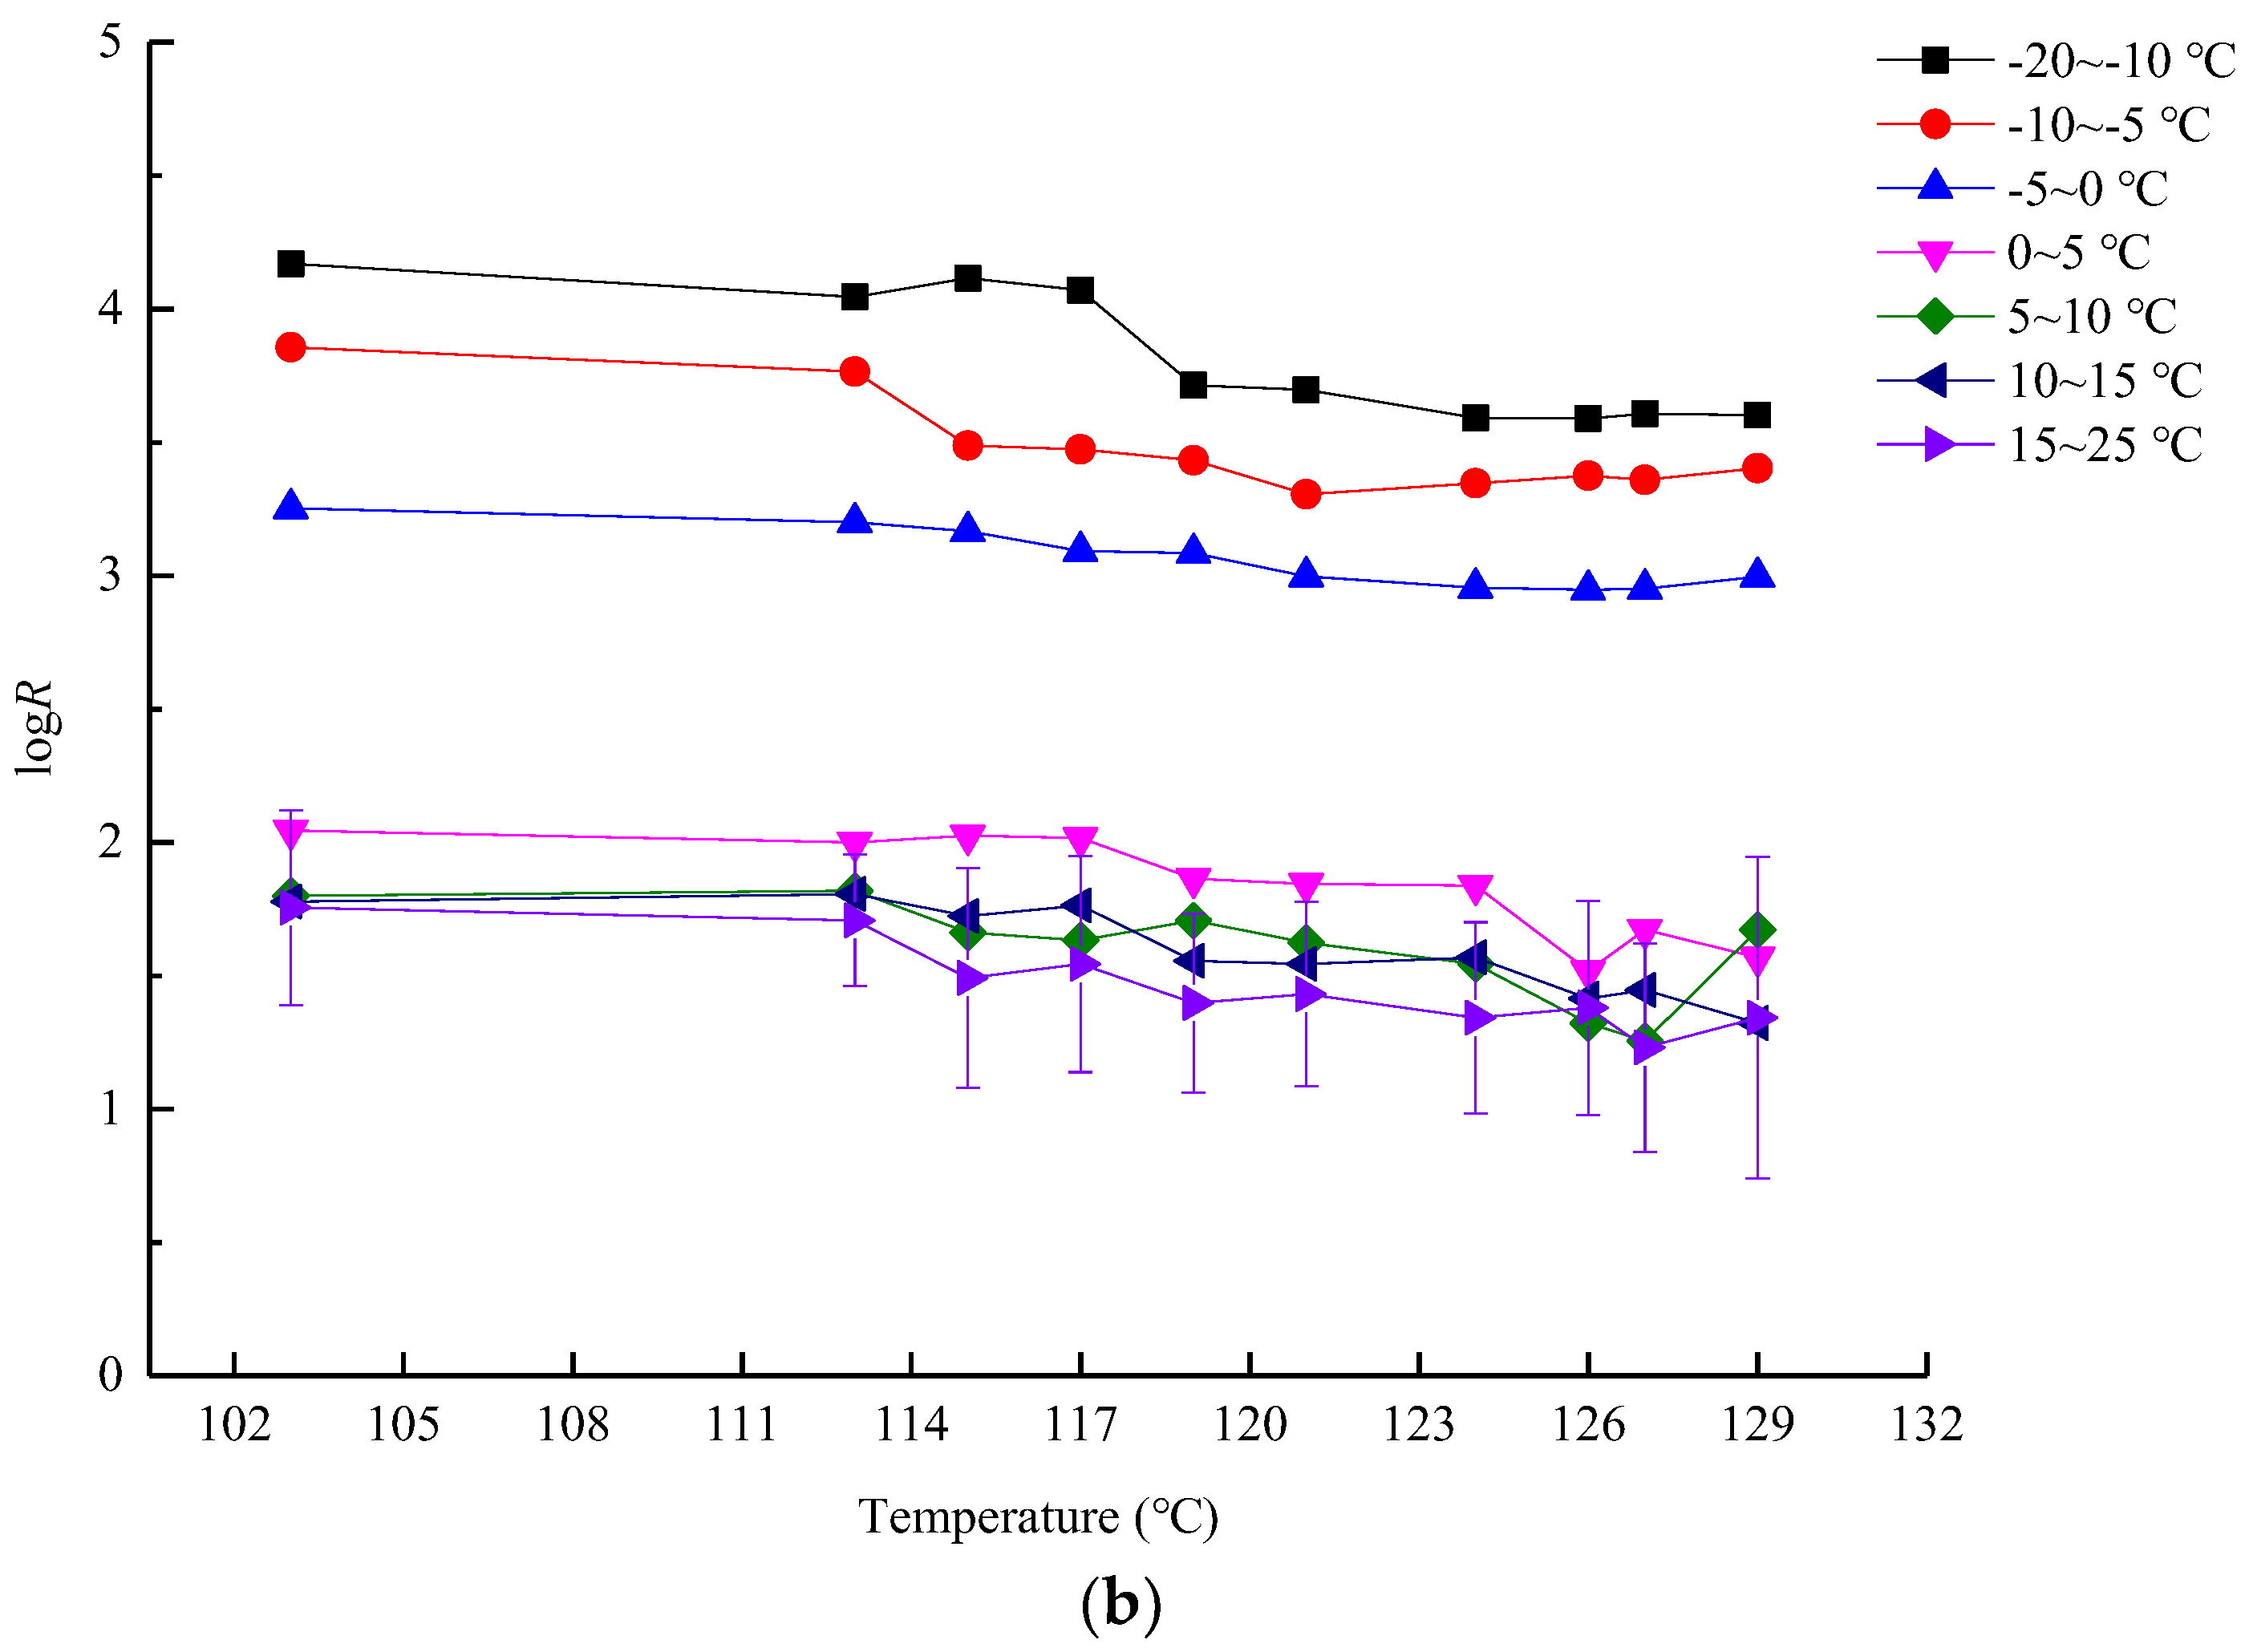
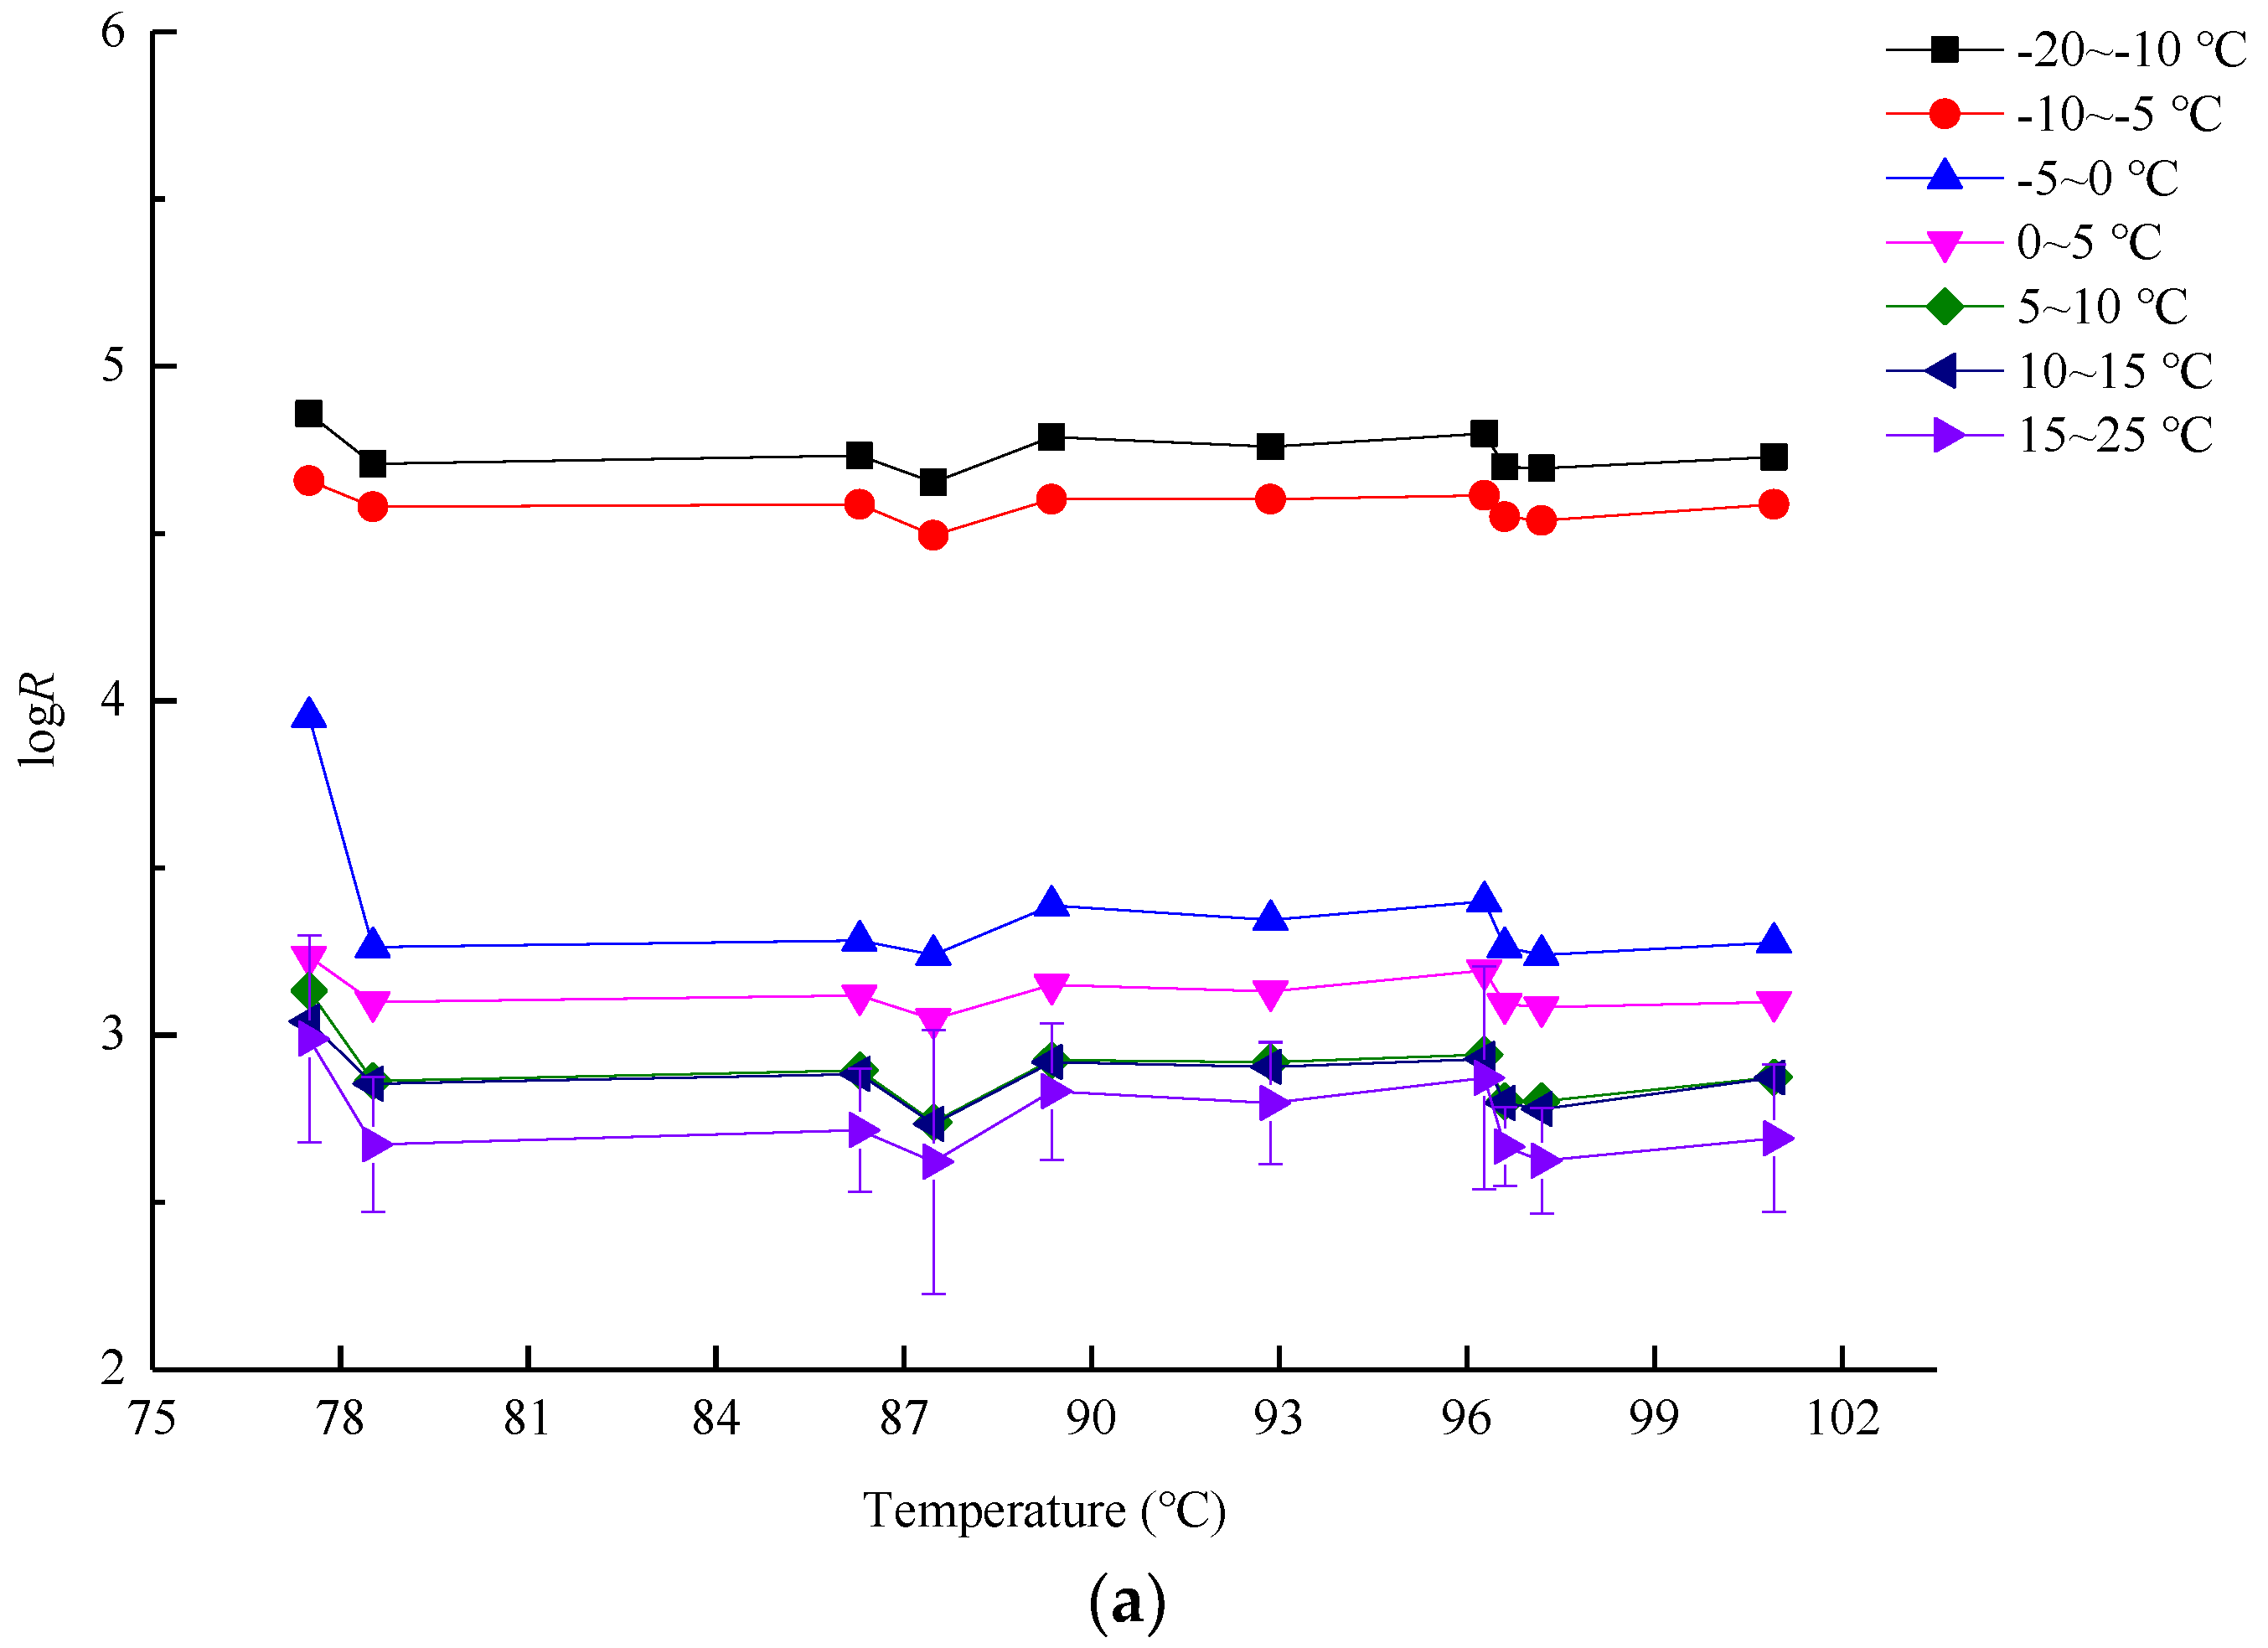
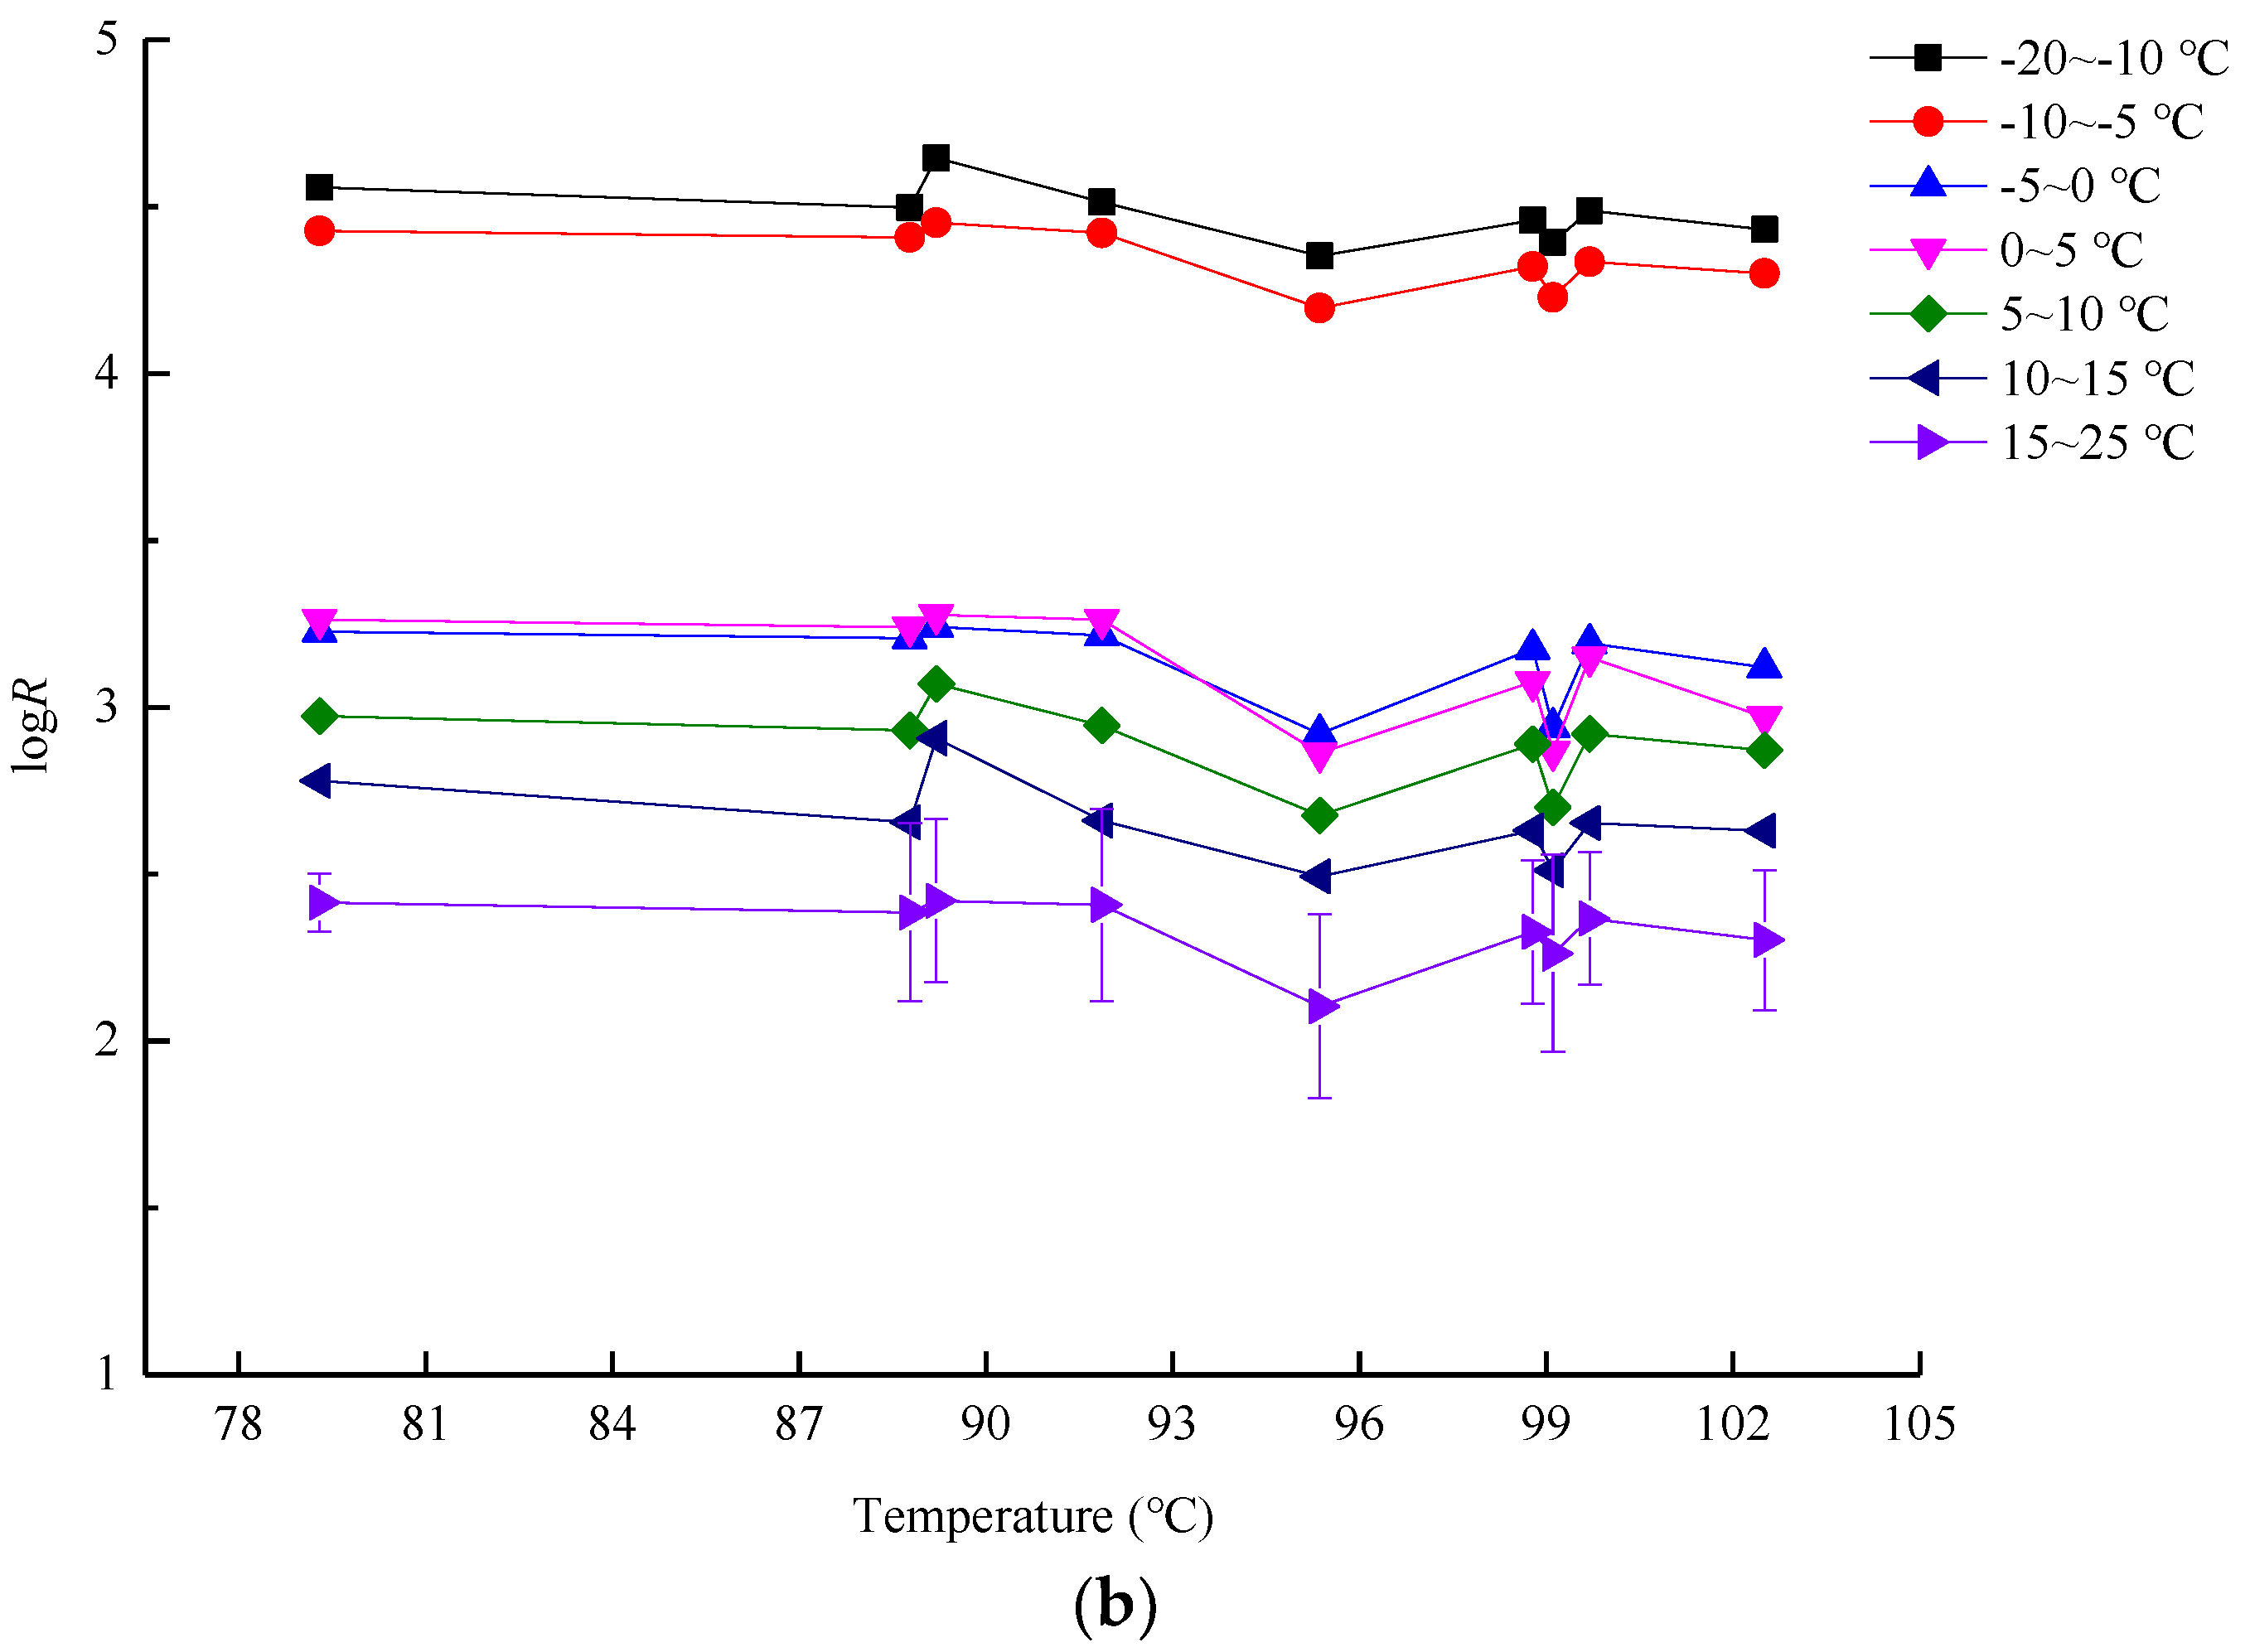
4.1. The Variation of Electrical Resistance in the Cross-Section of Living Trees with Seasonal Temperature under Different Moisture Contents

According to the measured electrical resistance in the cross-sections at different times of the year, the temperatures were classified as: −20 ~ −10 °C, −10 ~ −5 °C, −5 ~ 0 °C, 0 ~ 5 °C, 5 ~ 10 °C, 10 ~ 15 °C, and 15 ~ 25 °C. The moisture content as measured by the field instrument was corrected by the oven drying method to obtain the average value of the electrical resistance in the cross-sections at different temperatures. From these data, it could be found that these two tree species measured in different seasons, no matter whether they were solid or decayed, had different mean electrical resistance in their cross-sections at different temperatures. Especially, the electrical resistance significantly increased when the winter temperature was below zero. The mean values of the electrical resistance in the cross-sections of the healthy Populus simonii tree was 209 Ω when the temperature was above 0 °C (0 ~ 5 °C, 5 ~ 10 °C, 10 ~ 15 °C, and 15 ~ 25 °C were above zero), while the average was 5340 Ω when the temperature was below 0 °C (−20 ~ −10 °C, −10 ~ −5 °C, and −5 ~ 0 °C were below zero), which was 25 times the value obtained above 0 °C. The mean value of the resistance in the cross-sections of the decayed Populus simonii tress was 48 Ω when the temperature was above 0 °C, and the average value was 4062 Ω when the temperature was below 0 °C, which was more than 90 times the value above 0 °C. The average value of the electrical resistance in the cross-sections of the healthy Larix gmelinii tree below 0 °C was 15 times higher compared to that obtained above 0 °C, and the average value of the electrical resistance in the cross-sections of the decayed Larix gmelinii tree below 0 °C was nearly 16 times higher compared to that obtained above 0 °C.
Since the value of electrical resistance varied greatly at different temperatures and to better analyze the effect of changes in the seasonal temperatures, the logarithm of electrical resistance was calculated in log (R in Ω) and then normalized. LogR–temperature diagram (logR–T) was plotted and then the effect of different temperatures on logR was analyzed as shown in Figure 3 and Figure 4. It could be noted that the logarithmic mean value of the electrical resistance in the cross-sections of the two tree species as a whole first decreased and then remained stable with increasing temperatures, and logR showed the same trend between different moisture contents. An abrupt discontinuity was noted near 0 °C, which indicated that different ranges of ambient temperature had different effects on the average values of the electrical resistance in the cross-sections of living trees. Based on this phenomenon, the relationship of logR–T was divided into three temperatures: below the freezing point, the logR decreased with increasing temperature; near the freezing point, the logR changed rapidly with increasing temperature; above the freezing point, the logR changed slowly with increasing temperature, and the higher the temperature, the more its stability.
In terms of sound and decaying trees, the logR of the cross-section had the same trend with the changes in the temperature. At the same temperature, the logR in the cross-sections of the sound trees of the same tree species was slightly higher compared to decaying trees. Figure 5 showed the line graphs of the average logR values in the cross-sections of solid and decayed trees at different temperatures. Although there was not too much difference that was seen between the logR of sound and decay in Figure 5, it could be seen that the logR of sound trees were slightly larger than that of the decayed ones. However, in this study, we focused on the effect of changes in the temperature on the electrical resistance; we used the average value of the electrical resistance obtained in the cross-section, which was likely resulted the difference not to be very large. In addition, we used ‘log R’ instead of ‘R’ in the Figure, which was another factor causing the difference to not be very obvious between sound and decaying trees. Even so, a more comprehensive investigation should be conducted in future study to make the result more scientific.
The above experimental results demonstrated that they are in good agreement with the results of previous studies. James (1963) [25] used the wood moisture content meter and found that the electrical resistivity decreased with increasing temperature at a certain moisture content. Lin (1965) [40] studied the influencing factors of wood conductivity and found that the temperature had a greater effect on the conductivity of wood, where an increase in the temperature resulted in decreased resistivity, which again was dependent on the changes in the moisture content of wood.
Under the influence of temperature, the electrical resistance in the cross-section of the standing trees changed. This could be due to the fact that the temperature decreased, the activation of ions in the wood was suppressed and hence the activation energy in the wood decreased, and also the free ion content decreased which resulted in a decrease in the internal conductivity of the wood. There were also other possible reasons, such as shrinkage due to drying at low-temperature (the binding water moved from the inner wall of cell wall to the inner surface of cell cavity due to vapor pressure gradient). At the same time, changes in the electrical resistance may also be related to the moisture content and the presence of water in the wood. When the temperature dropped below the freezing point, the free water present in the cavity of the wood formed ice. It is to be noted that the electrical resistivity of solid ice is much greater than the resistivity of water. Therefore, when the temperature dropped from above zero to below zero, it led to an increase in the amount of ice crystals, and the logR in the logR–T curve changed significantly at around zero degrees. In this field experiment, the moisture content of trees was higher than the fiber saturation point, and in the interior, there was free water. Therefore, logR had a mutation near the freezing point. A sudden change in the logR occurred in a temperature range near the freezing point, and this indicated that the free water in the cell was not rapidly frozen into ice, and different moisture content of the wood caused the formation of ice and its percentage in the interior of the wood different when the temperature dropped, so that logR varied within a range around the freezing point.

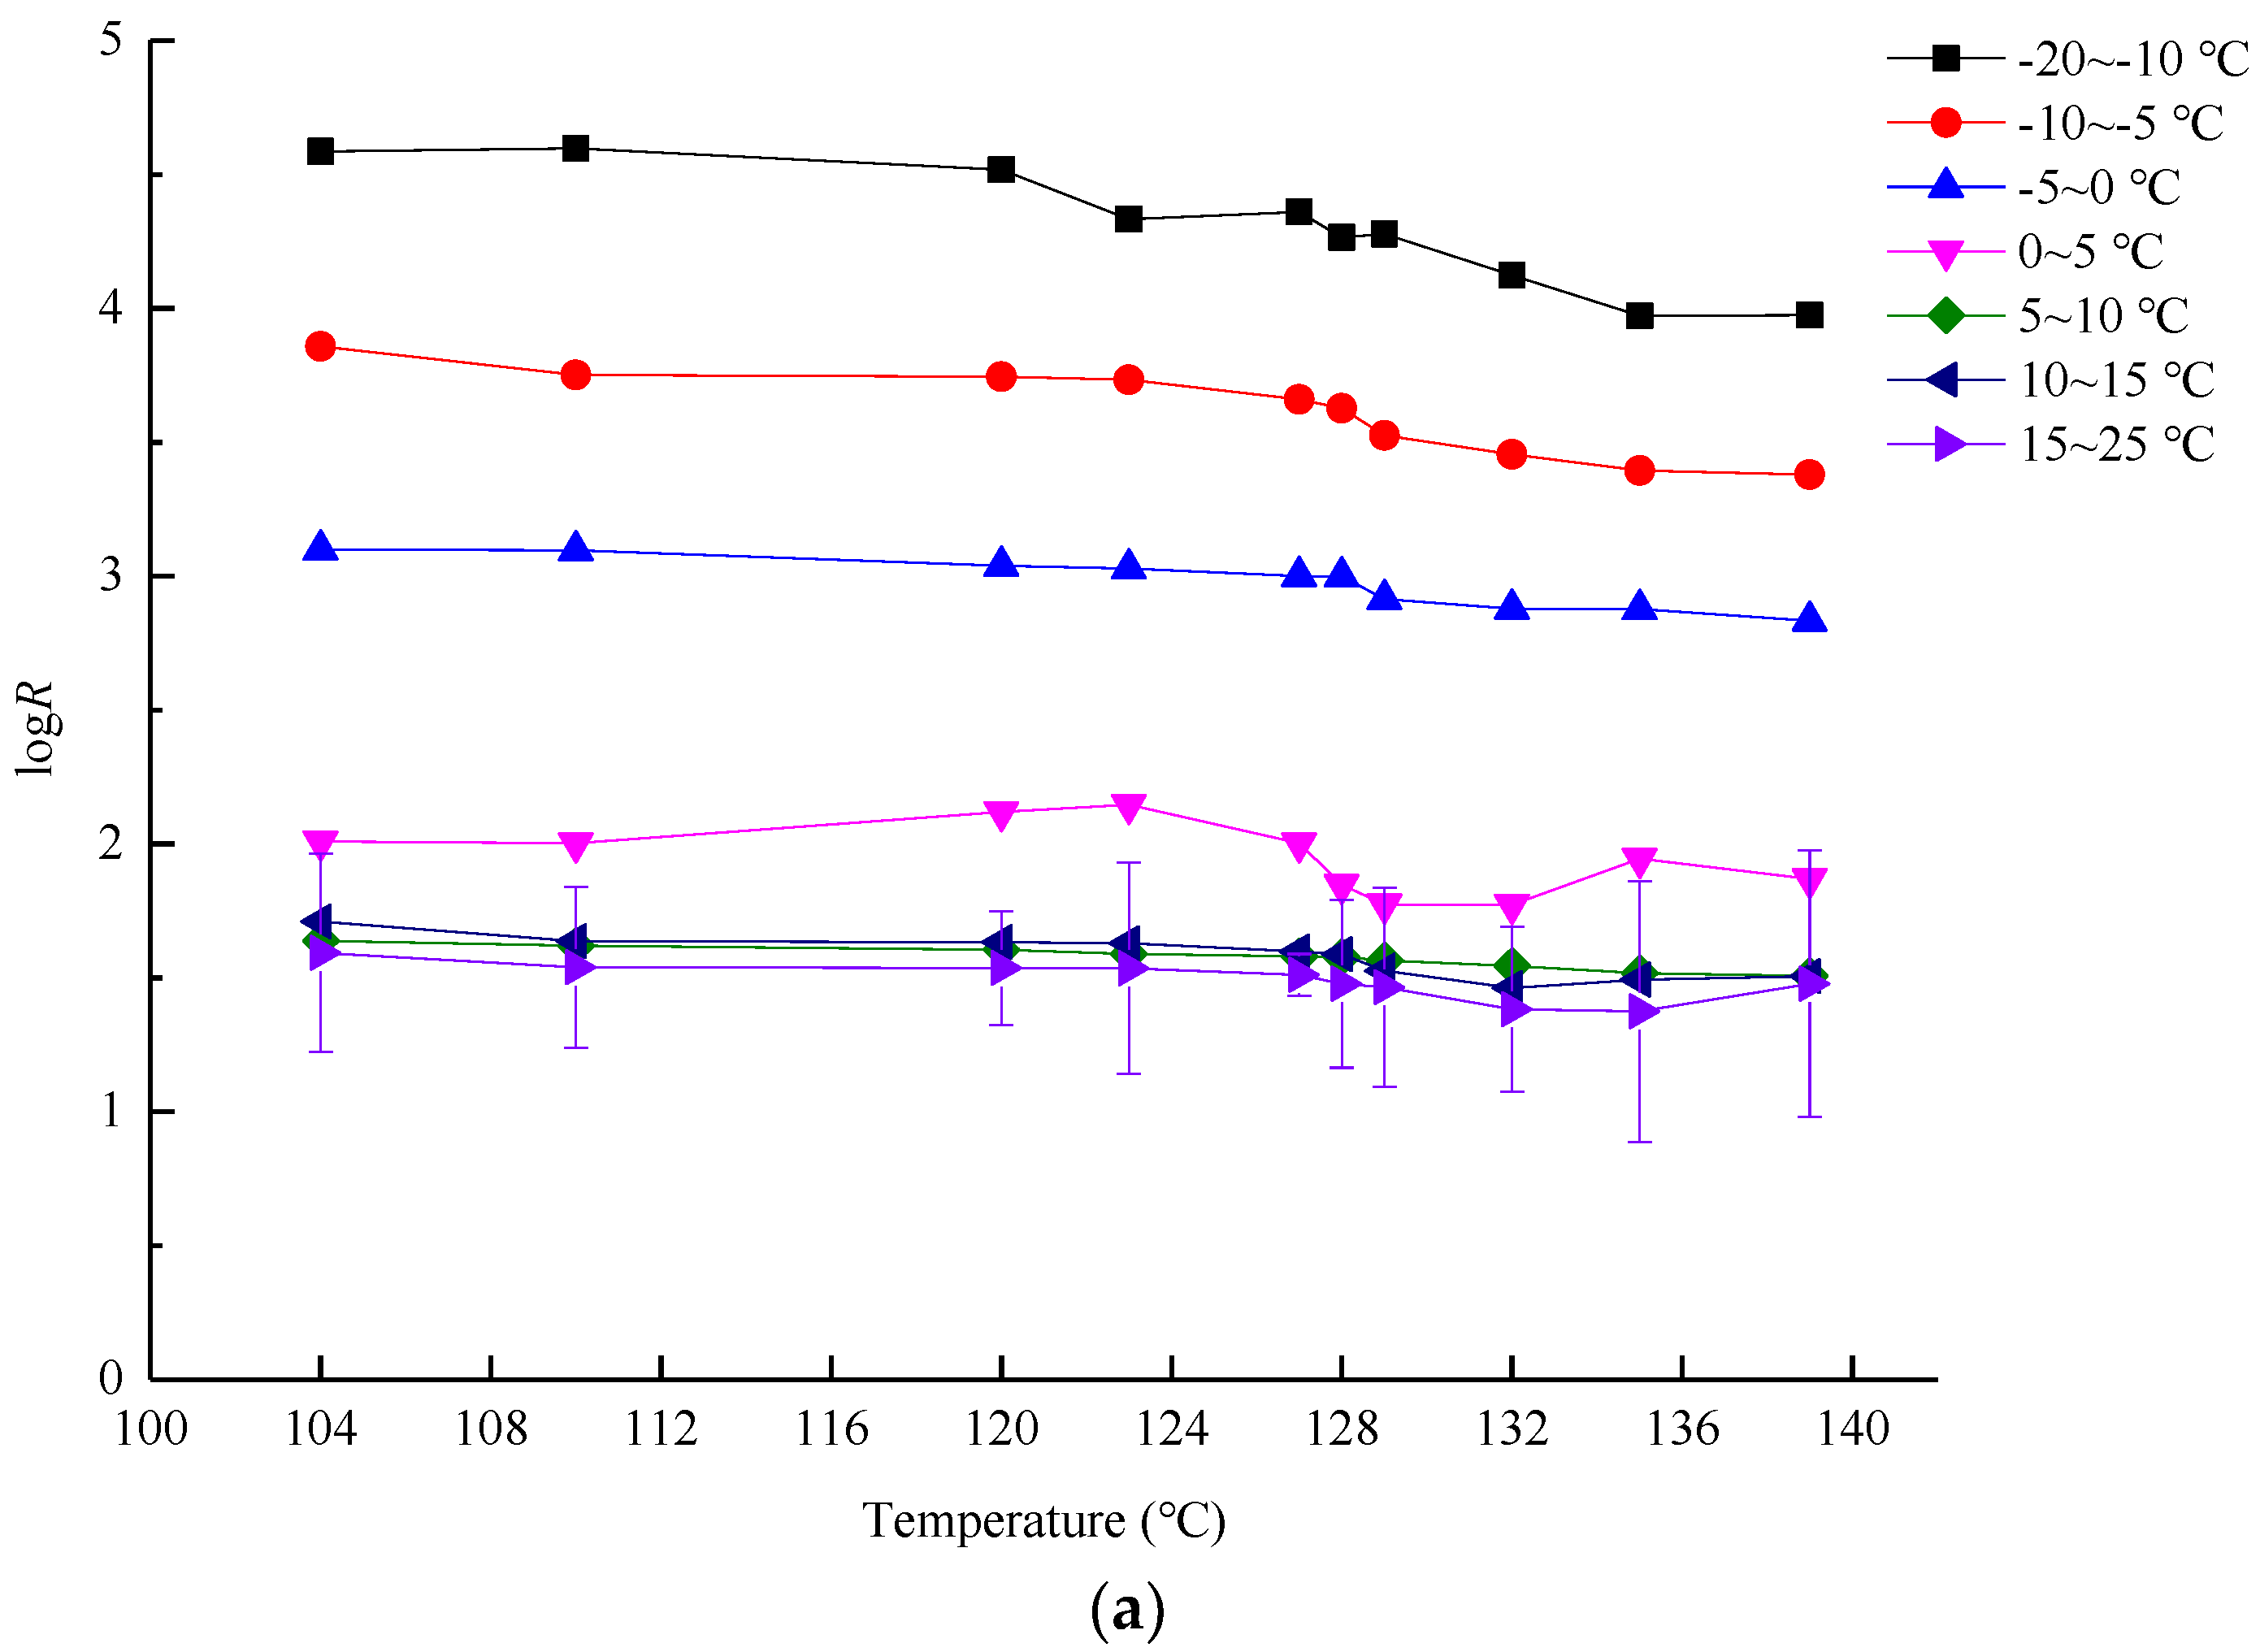
4.2. The Variation of Electrical Resistance in the Cross-Section of Living Trees with Moisture Content under Different Seasonal Temperatures

To analyze the effect of moisture content on the electrical resistance in the cross-section of living trees, the relationship between the logarithm of the mean electrical resistance (logR)–moisture content (logR–MC) in the cross-section of solid and decay trees of Populus simonii and Larix gmelinii was determined, as shown in Figure 6 and Figure 7, respectively. It can be seen from Figure 6 and Figure 7 that the moisture contents of living trees of the two species were relatively high, and, notably, they were above the fiber saturation point (FSP). The influence on logR with moisture content was not obvious, but the trends were relatively flat. The FSP is one of the important demarcation points for the change in the physical properties of wood. When the moisture content of wood is below the FSP, moisture exists in the cell wall, and the nature of wood is greatly affected by the moisture. Whereas, above the FSP, the bound water in the cell wall of the wood is saturated, and the moisture in the wood is freely existing in the cell cavity. At this time, the physical properties of wood are gradually reduced by the influence of moisture. In this study, the moisture content of living trees was above the FSP, and thus the electrical resistance changed more slowly with the changes in the moisture content.

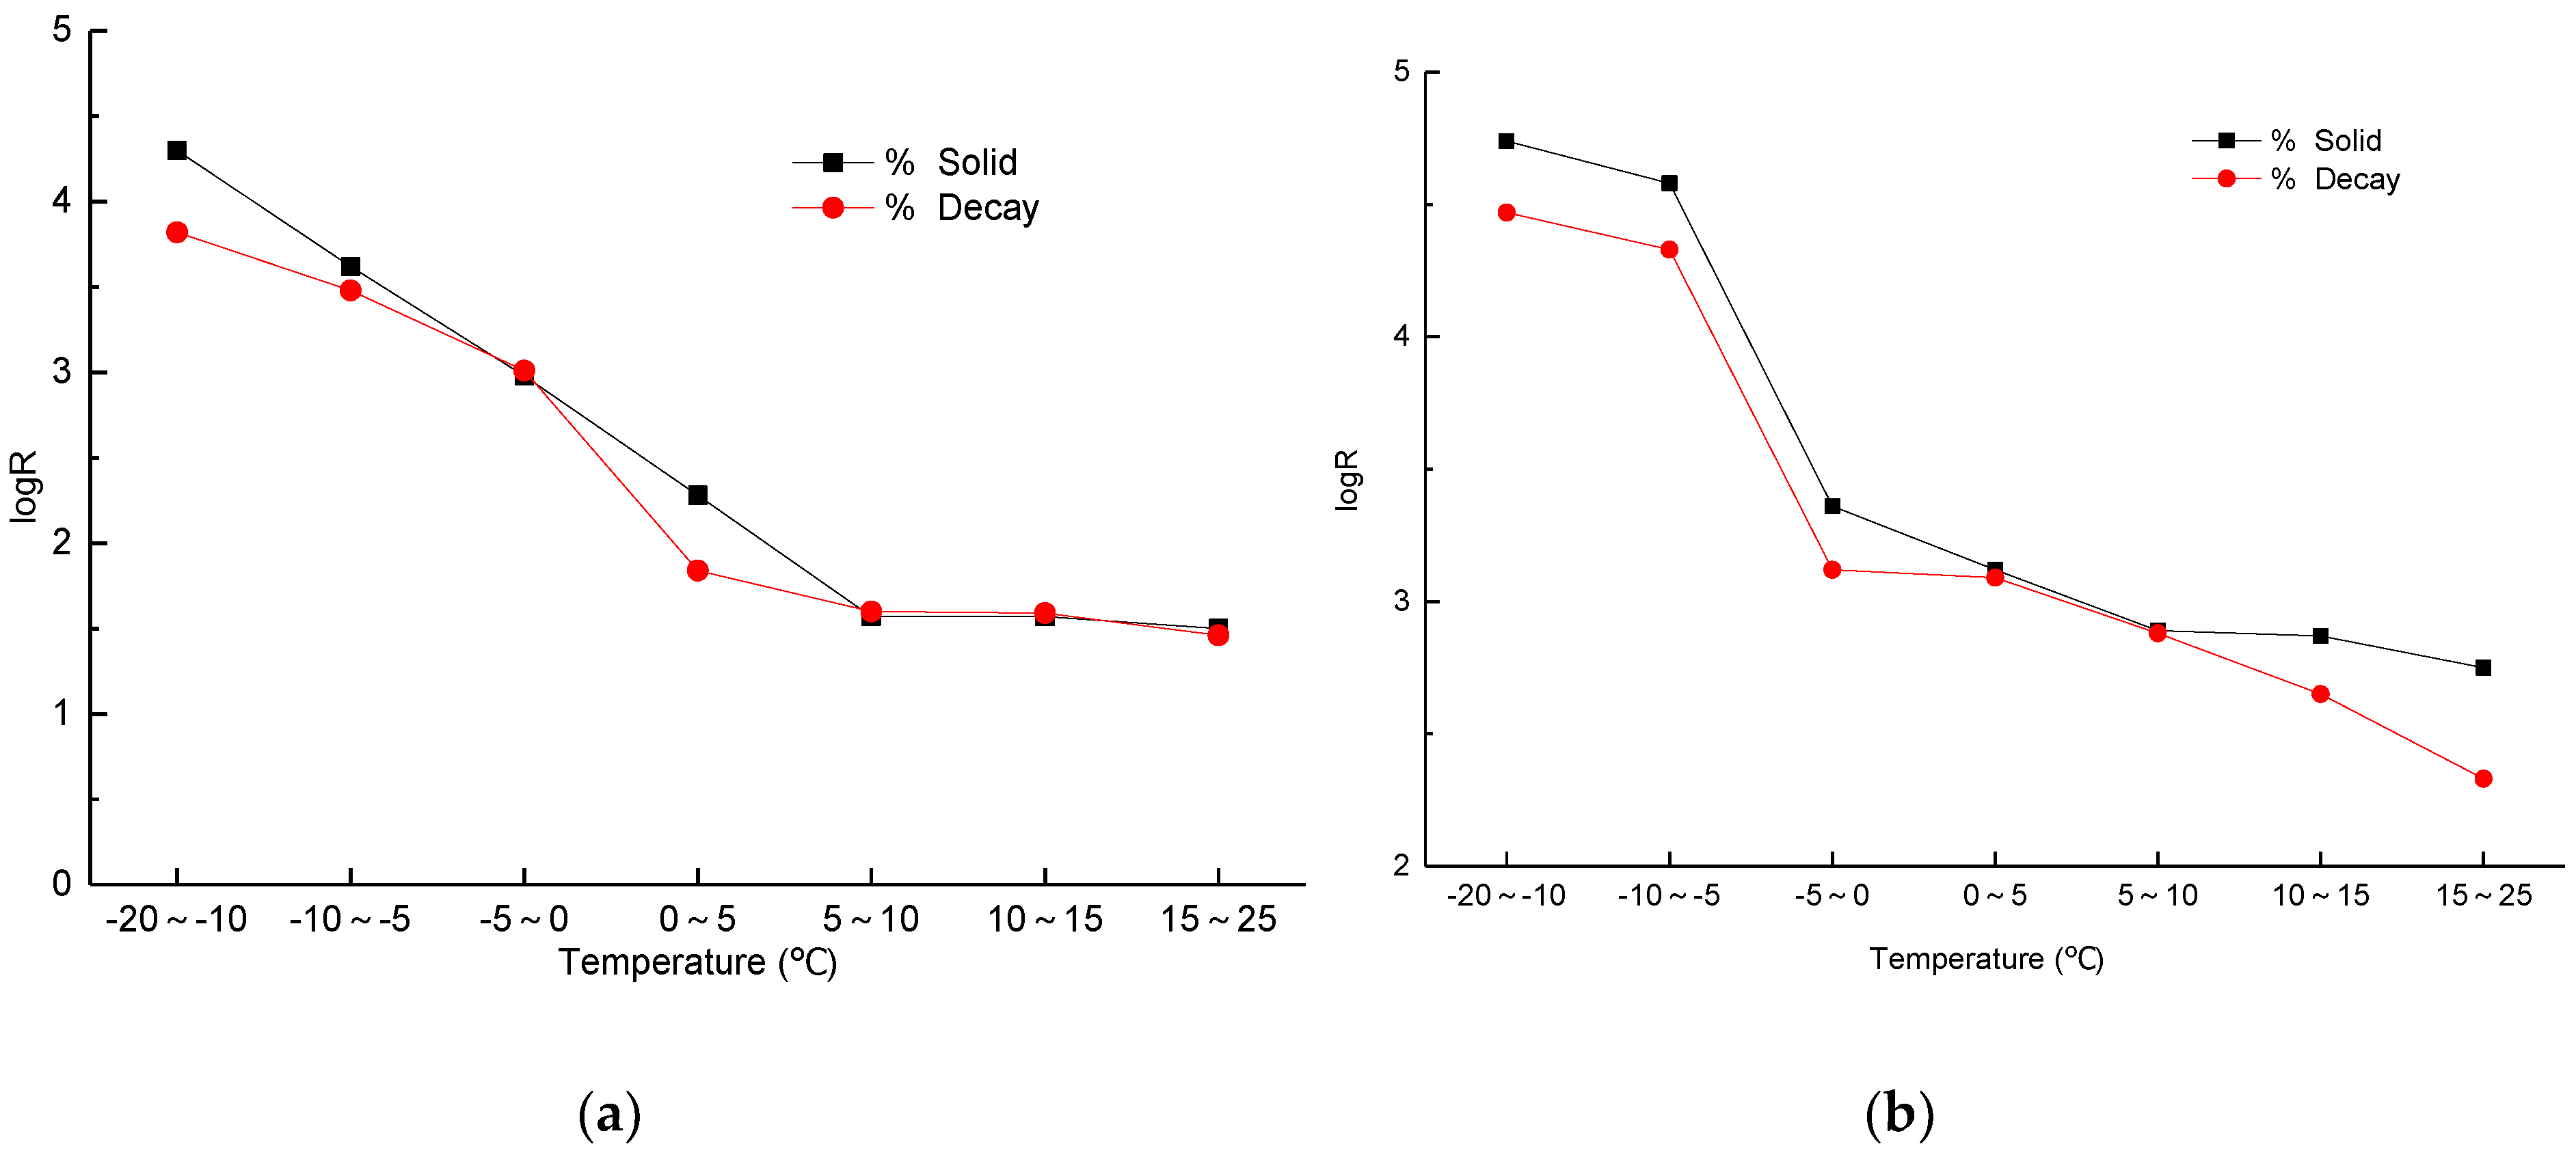
4.3. The Combined Effects of Seasonal Temperature and Moisture Content on the Electrical Resistance in the Cross-Section of Living Trees

The combined effects of seasonal temperature and moisture content on the electrical resistance in the cross-sections of two tree species were analyzed to find out their relationship more specifically. The statistical analysis software SPSS (Statistical Product and Service Solutions) was used to analyze the correlation between temperature, moisture content, and logR in the cross-sections. Using multivariate statistical regression analysis, a regression model was established between them (Table 2 and Table 3). The four regression equations for the healthy and decayed samples of two species were obtained, where the confidence level of F test was 0.01, and the determination coefficient (R2) was up to 0.8, which indicated that the model had a good degree of fitting. The correlation between logR and temperature as well as moisture content was analyzed. The observed results showed that the temperature and logR of the cross-sections of the healthy and decayed trees were significantly correlated at the level of 0.05, and the moisture content and logR were also correlated significantly at the level of 0.05. Therefore, the logR corresponding to different temperatures and moisture contents of healthy and decaying wood of Populus simonii and Larix gmelinii can be estimated by this regression model.
The results showed that the electrical resistance in the cross-sections of tress was significantly affected by the temperature and moisture content, and it was of great significance to the accuracy of electrical resistance of wild living trees. Based on the results of this study, when the electrical resistance tomography technique was applied to the non-destructive testing of living trees to evaluate the quality of wood at different temperatures, the measured results required one to consider the temperature and moisture content. Above the freezing point, the electrical resistance does not change significantly with respect to ambient temperature. Near the freezing point, the relative electrical resistance varies with temperature and it becomes difficult to assess. Therefore, it is not recommended to consider testing living trees near the freezing point temperature using the electrical resistive tomography. Below the freezing point, the electrical resistance changes with temperature greatly relative to the normal temperature. Therefore, when performing the detection of electrical resistance, it is necessary to calibrate the effects of temperature. The results of this study provide a theoretical reference for the detection of living trees in the field using electrical resistance tomography.

5. Conclusions

This study investigated the effects of seasonal temperature changes on electrical resistance in the cross-section of Populus simonii and Larix gmelinii living trees for 12 consecutive months. The results of this field investigation are summarized as follows:
(1)
No matter whether it was solid or decayed, ambient temperature had a significant effect on electrical resistance in the cross-section of living trees when the temperature was below the freezing point of water. The electrical resistance in the cross-sections of measured in winter was more than 15 times higher than when it was obtained above 0 °C. The increase of electrical resistance measured in winter was attributed to the phase change of free water in wood cells and the increased number of ice crystals in the wood.
(2)
When the temperature was below the freezing point, logR decreased with increasing temperature. Near the freezing point, logR changed rapidly with increasing temperature. Above the freezing point, logR changed slowly with the variations in the temperature and then became stable. At different temperatures, logR in the cross-sections of two trees species changed slowly with a change in the moisture content (moisture content was above the fiber saturation point). This value tended to be smooth with a further change in the moisture content.
(3)
The changes in the trends of logR in the cross-sections of solid and decayed trees were similar with the changes in temperature. At the same temperature, logR in the cross-sections of sound trees of the same tree species was slightly higher compared to the decayed ones. Although not too much difference between the sound and decayed trees was seen in this study, it is possible to detect decay in tree stems with the technique applied, confirming the results of previous studies. In this study, we used the average value of the electrical resistance obtained in the cross-section of the standing trees, which was likely the reason why the difference between sound and decayed trees was not obvious. However, to improve confidence in the application of ERT to trees, a more detailed investigation that separates sound and decayed sections of each tree should be performed in further studies.
(4)
Seasonal changes in the temperature and moisture content had interactive effects on logR, and the established linear regression model between the moisture content, temperature, and logR both had a high degree of fitting and a good determination coefficient with R2 above 0.8. For practical work, it is important to estimate the effect of changing moisture content or temperature, and predictions could be made using the linear regression model.

Author Contributions

X.Y. and L.W. conceived and designed the experiments; X.S. and M.X. performed the experiments and collected the data; X.Y. and Z.Z. analyzed the data; X.Y. wrote the manuscript; L.W. supervised the work and reviewed the manuscript.

Funding

This research was funded by Fujian Educational Bureau (JA15155) and the National Natural Science Foundation of China (Grant No. 31570547).

Acknowledgments

The authors gratefully acknowledge all research partners in these aforementioned projects for their cooperation and collaboration.

Conflicts of Interest

The authors declare no conflict of interest.

References

  1. Sanchez-Montero, R.; Lopez-Espi, P.L.; Martinez-Rojas, J.A.; Alpuente-Hermosillaand, J.; Alen-Cordero, C. Numerical Study of Focusing Effects of Microwaves inside Wood Due to Timber Ring Structure. Forests 2018, 9, 106. [Google Scholar] [CrossRef]
  2. Proto, A.R.; Macrì, G.; Bernardini, V.; Russo, D. Acoustic evaluation of wood quality with a non-destructive method in standing trees: A first survey in Italy. iForest-Biogeosci. For. 2017, 10, 700–706. [Google Scholar] [CrossRef]
  3. Huan, Z.; Jiao, Z.; Li, G.; Wu, X. Velocity Error Correction Based Tomographic Imaging for Stress Wave Nondestructive Evaluation of Wood. BioResources 2018, 13, 2530–2545. [Google Scholar] [CrossRef]
  4. Tattar, T.A.; Shigo, A.L.; Chase, T. Relationship between the degree of resistance to a pulsed electric current and wood in progressive stages of discoloration and decay in living trees. Can. J. For. Res. 1972, 2, 236–243. [Google Scholar] [CrossRef]
  5. Skutt, H.R.; Shigo, A.L.; Lessard, R.A. Detection of discolored and decayed wood in living trees using a pulsed electric current. Can. J. For. Res. 1972, 2, 54–56. [Google Scholar] [CrossRef]
  6. Shigo, A.L.; Shigo, A. Detection of Discoloration and Decay in Living Trees and Utility Poles; Forest Service of the US Department of Agriculture: Upper Darby, PA, USA, 1974; Volume 29, pp. 3–10.
  7. Shigo, A.L.; Shortle, W.C.; Ochrymowych, J. Detection of active decay at ground line in utility poles. Forest 1977, 2, 77. [Google Scholar]
  8. Bengtsson, B. Anordning och Användning vid Detektering Avröta-Angrepp i Biologiskt Material, Företrädesvis Träd. Swedish Patent No. 9703540-6, 20 September 1997. [Google Scholar]
  9. Larsson, B.; Bengtsson, B.; Gustafsson, M. Nondestructive detection of decay in living trees. Tree Physiol. 2004, 24, 853–858. [Google Scholar] [CrossRef] [PubMed] [Green Version]
  10. Weihs, U.; Dubbel, V.; Krummheuer, F.; Just, A. The electrical resistivity tomography—A promising technique for the detection of colored heart wood on standing beech trees. Forst und Holz 1999, 54, 166–170. [Google Scholar]
  11. Nicolotti, G.; Socco, L.; Martinis, R.; Sambuelli, L. Application and comparison of three tomographic techniques for detection of decay in trees. J. Arboric. 2003, 29, 66–78. [Google Scholar]
  12. Al Hagrey, S.A. Electrical resistivity imaging of tree trunks. Near Surf. Geophys. 2006, 4, 179–187. [Google Scholar] [CrossRef]
  13. Bieker, D.; Rust, S. Electric resistivity tomography shows radial variation of electrolytes in Quercus robur. Can. J. For. Res. 2010, 40, 1189–1193. [Google Scholar] [CrossRef]
  14. Guyot, A.; Ostergaard, K.T.; Lenkopane, M.; Fan, J.; Lockington, D.A. Using electrical resistivity tomography to differentiate sapwood from heartwood: Application to conifers. Tree Physiol. 2013, 33, 187–194. [Google Scholar] [CrossRef] [PubMed]
  15. Lin, C.J.; Chung, C.H.; Yang, T.H.; Lin, F.-C. Detection of Electric Resistivity Tomography and Evaluation of the Sapwood-Heartwood Demarcation in Three Asia Gymnosperm Species. Silva Fennica 2012, 46, 415–424. [Google Scholar] [CrossRef]
  16. Elliott, M.L.; Broschat, T.K.; Göcke, L. Preliminary Evaluation of Electrical Resistance Tomography for Imaging Palm Trunks. Arboric. Urban For. 2016, 42, 111–119. [Google Scholar]
  17. Lin, C.J.; Yang, T.H. Detection of acoustic velocity and electrical resistance tomographies for evaluation of peripheral-inner wood demarcation in urban royal palms. Urban For. Urban Green. 2015, 14, 583–589. [Google Scholar] [CrossRef]
  18. Yue, X.Q.; Wang, L.H.; Wang, X.L.; Rong, B.; Ge, X.; Liu, Z.; Chen, Q. Quantitative Detection of Internal Decay Degree for Standing Trees Based on Three NDT Methods-Electrical Resistance Tomography, Stress Wave Imaging and Resistograph Techniques. Sci. Silv. Sin. 2017, 53, 138–146. (In Chinese) [Google Scholar]
  19. Kollmann, F.P. “Physics of Wood.” Principles of Wood Science and Technology; Springer: Berlin/Heidelberg, Germany, 1968; pp. 160–291. [Google Scholar]
  20. Li, J. Wood Science. In The Scientific Preservation of Wood; Higher Education Press: Beijing, China, 2014; pp. 201–230. (In Chinese) [Google Scholar]
  21. Hiruma, J. Experiment of Electrical Resistance in Wood; Extracts from the Bulletin of the Forest Experiment Station, Meguro, Tokyo; Bureau of Forestry, Department of Agriculture and Commerce: Tokyo, Japan, 1915; Volume 2, pp. 59–65. [Google Scholar]
  22. Hasselblatt, M. Der Wasserdampfdruck und die elektrische Leitfähigkeit des Holzes in Abhängigkeit von seinem Wassergehalt. Zeitschrift für Anorganische und Allgemeine Chemie 1926, 154, 375–385. [Google Scholar] [CrossRef]
  23. Stamm A, J. An electrical conductivity method for determining the moisture content of wood. Ind. Eng. Chem. Anal. Ed. 1930, 2, 240–244. [Google Scholar] [CrossRef]
  24. Dunlap, M.E. Methods Used for the Measurement of the Moisture Content of Wood; Proceedings of American Society for Testing Materials, Committee Reports; Research Division: Beecroft, Australia, 1945; Volume 45, pp. 269–274. [Google Scholar]
  25. James, W.L. Electric Moisture Meters for Wood; Department of Agriculture, Forest Service, Forest Products Laboratory: Madison, WI, USA, 1963. [Google Scholar]
  26. Du, Q.P.; Geissen, A.; Noack, D. Widerstandskennlinien einiger Handelshölzer und ihre Meßbarkeit bei der elektrischen Holzfeuchtemessung. Holz als Roh-und Werkstoff 1991, 49, 305–311. [Google Scholar] [CrossRef]
  27. Du, Q.P.; Geissen, A.; Noack, D. Die Genauigkeit der elektrischen Holzfeuchtemessung nach dem Widerstandsprinzip. Holz als Roh-und Werkstoff 1991, 49, 1–6. [Google Scholar] [CrossRef]
  28. Fredriksson, M.; Wadsö, L.; Johansson, P. Small resistive wood moisture sensors: A method for moisture content determination in wood structures. Eur. J. Wood Wood Prod. 2013, 71, 515–524. [Google Scholar] [CrossRef]
  29. Nadler, A.; Tyree, M.T. Substituting stem’s water content by electrical conductivity for monitoring water status changes. Soil Sci. Soc. Am. J. 2008, 72, 1006–1013. [Google Scholar] [CrossRef]
  30. Yue, X.Q.; Wang, L.H.; Liu, Z.X.; Wang, X.L.; Rong, B.B. Electrical resistance tomography and stress wave tomography to quantitatively detect wood decay under different moisture contents. J. Fujian Agric. For. Univ. North-East For. Univ. 2016, 45, 593–598. (In Chinese) [Google Scholar]
  31. Brischke, C.; Rapp, A.O.; Bayerbach, R. Measurement system for long-term recording of wood moisture content with internal conductively glued electrodes. Build. Sci. 2008, 43, 1566–1574. [Google Scholar] [CrossRef]
  32. Carll, C.; TenWolde, A. Accuracy of wood resistance sensors for measurement of humidity. J. Test. Eval. 1996, 24, 154–160. [Google Scholar]
  33. Du, H.S.; Li, R.; Xiu, H.B.; Sun, J.J.; Chen, Y.H.; Zhao, Y. Relations among resistance percentage, temperature and moisture of Oak in the seasoning process. J. Beihua Univ. (Nat. Sci.) 2002, 3, 349–351. (In Chinese) [Google Scholar]
  34. Wang, Y.T.; Xu, H.D.; Wang, L.H.; Wang, X.L.; Sun, Y.T. Effects of environmental temperature on the electrical resistance on the cross section in standing tree. J. Nanjing For. Univ. (Nat. Sci. Ed.) 2016, 40, 143–148. (In Chinese) [Google Scholar]
  35. Wang, X.L.; Wang, L.H. Effects of electrode quantity on log defect test based on electrical resistance tomography. J. For. Eng. 2015, 6, 99–103. (In Chinese) [Google Scholar]
  36. Ma, H.B.; Wei, J.S.; Zhou, M.; Wu, H. The Correlation Analysis of DBH and Sapwood in Virgin Forest of Larix Gmelinii; Natural Science Academic Paper; Soil and fertilizer society: Beijing, China, 2007. (In Chinese) [Google Scholar]
  37. Liu, J.L.; Wang, C.K.; Zhang, Q.Z. Spatial variations in stem heartwood and sapwood for Larix gmelinii trees with various differentiation classes. Sci. Silv. Sin. 2014, 50, 114–121. (In Chinese) [Google Scholar]
  38. ANSI. QSIQ, SAC GB/T 1927–2009 Method of Sample Tree Collection for Physical and Mechanical Tests of Wood; American National Standards Institute (ANSI): Washington, DC, USA, 2009. [Google Scholar]
  39. ANSI. QSIQ, SAC GB/T 1931–2009 Method for Determination of the Moisture Content of Wood; American National Standards Institute (ANSI): Washington, DC, USA, 2009. [Google Scholar]
  40. Lin, R.T. A study on the electrical conduction in wood. For. Prod. 1965, 15, 506–551. [Google Scholar]
Figure 1. The field test of electric resistance tomography. (a) Arranging the electrode; (b) Current histogram displayed on the instruments.
Forests 09 00550 g001
Figure 2. The relationship between the MC of the living trees as measured by ST-85 and by the oven drying method.
Forests 09 00550 g002
Figure 3. Effect of temperature on the logR in the cross-section of Populus simonii trees under different MCs. (a) Sound Populus simonii trees; (b) Decayed Populus simonii trees.
Forests 09 00550 g003aForests 09 00550 g003b
Figure 4. Effect of temperature on the logR in the cross-section of Larix gmelinii trees under different MCs. (a) Sound Larix gmelinii trees; (b) Decayed Larix gmelinii trees.
Forests 09 00550 g004aForests 09 00550 g004b
Figure 5. Comparison of the logR in the cross-sections of healthy and decayed trees. (a) Populus simonii; (b) Larix gmelinii.
Forests 09 00550 g005
Figure 6. Effect of moisture content on the logarithmic value of mean resistance in the cross-section of living trees (Populus simonii) under different temperatures. (a) Sound trees; (b) Decayed trees.
Forests 09 00550 g006aForests 09 00550 g006b
Figure 7. Effect of moisture content on the logarithmic value of mean resistance in the cross-section of living trees (Larix gmelinii) under different temperatures. (a) Sound trees; (b) Decayed trees.
Forests 09 00550 g007aForests 09 00550 g007b
Table 1. Relevant relationship between MC of standing trees as measured by ST-85 and by the method of oven drying.
SpeciesRegression ModelR2R
Populus simonii Carr. y = 0.9836x + 83.7370.7820.884
Larix gmelinii (Rupr.) Rupr.y = 1.5004x + 50.1620.7430.862
Table 2. Regression models of logR to temperature and moisture content in the sound samples.
SpeciesRegression Model y = ax1 + bx2 + c
yx1x2cbaR2Fsig
Populus simoniilogRTMC6.34−0.02 −0.500.89315.90
Larix gmeliniilogRTMC6.87−0.02 −0.520.86198.830
Note: logR is the logarithm of electrical resistance in the cross-section of trees, T is the ambient temperature, and MC is the moisture content.
Table 3. Regression model of logR to temperature and moisture content in the decayed samples.
SpeciesRegression Model y = ax1 + bx2 + c
yx1x2cbaR2Fsig
Populus simoniilogRTMC5.93 −0.01 −0.44 0.88246.610
Larix gmeliniilogRTMC5.46 −0.01 −0.36 0.88234.530
Note: logR is the logarithm of electrical resistance in the cross-section of trees, T is the ambient temperature, and MC is the moisture content.

